Mineralogy and Physico-Chemical Data of Two Newly Discovered Halloysite in China and Their Contrasts with Some Typical Minerals


1
Centre for Mineral Materials, School of Minerals Processing and Bioengineering, Central South University, Changsha 410083, China
2
Key Laboratory for Mineral Materials and Application of Hunan Province, Central South University, Changsha 410083, China
*
Author to whom correspondence should be addressed.
Minerals 2018, 8(3), 108; https://doi.org/10.3390/min8030108
Submission received: 22 January 2018
/
Revised: 17 February 2018
/
Accepted: 24 February 2018
/
Published: 8 March 2018
Abstract
:We report in this article the systematical acquisition of physico-chemical parameters for two newly discovered halloysite (Hal) minerals from Shiyan and Tongling in China. As the comparative reference, the data from Hal in Linfen, Chenxi, and the salt lake in Australia (samples were abbreviated as Hal-AU, Hal-SY, Hal-LF, Hal-CX and Hal-TL, respectively) were also investigated using X-ray diffraction (XRD), scanning electronic microscopy (SEM), transmission electron microscopy (TEM), Fourier transformation infrared spectroscopy (FTIR), differential scanning calorimetry-thermogravimetry (DSC-TG), X-ray fluorescence, surface zeta potential measurements and N2 adsorption-desorption isotherms. The newly found minerals were probably formed in hydrothermal leaching and sedimentary circumstances. The Hal-SY contains 7 Å-halloysite and dickite, while Hal-TL contains 10 Å-halloysite with some alunite (similar with Hal-CX). Other impurities found in the samples include quartz, gibbsite, iron oxide and anatase. All of them showed tubular morphology with diameter in the range of 30–90 nm and a length of 300–2500 nm, while the Hal-SY has the largest inner diameter to about 150 nm. Specific surface areas varied from 26.0~59.0 m2·g−1. In addition, maximum CEC (cation exchange capacity) of the newly found Hal was about 40 cmol/kg, while that of Hal-AU was relatively low (8 cmol/kg) due to the sedimentary nature of Salt Lake circumstances. The surface charge was predominantly negative over most of the relevant pH range (>2.0). It can be concluded that the different morphology and impurity content of halloysite will greatly affect the surface area, pore volume, and cationic exchange capacity (CEC) of the minerals.
1. Introduction
Halloysite (abbreviated as Hal) (Al2Si2O5(OH)4·2H2O) is a hydrated polymorph of kaolinite with a peculiar naturally occurring tubular clay mineral [1], where the layered [SiO4] and [AlO6] polyhedrons are arranged in a 1:1 style manner. Hal contains extra water molecules between the alumina/silica layers compared to kaolinite (Al2Si2O5(OH)4) [2]. The hydration of –Al–OH and –Si–OH groups reduces bonding interactions between the adjacent alumina/silica layers, which in combination with the mismatch of [SiO4] tetrahedron and [AlO6] octahedron lattices, drives the layers to bend and form a stereotypically hollow tubular morphology [3,4,5], although occasionally, halloysite minerals may show some distinctive forms such as spherical and platy ones [6]. The basal d (001) spacing of hydrated halloysite is 10 Å, which is larger than kaolinite (~3 Å). The interlayer water is weakly coordinated, so that the 10 Å-halloysite will be easily converted to 7 Å-halloysite (also known as meta-halloysite) through mild dehydration [7,8]. Furthermore, the exterior and interior surfaces of Hal are composed of siloxane (Si–O–Si) groups and a gibbsite-like array of aluminol (Al–OH) groups, respectively, resulting in a negatively charged outer surface and the positively charged inner surface in the pH range 2.0~8.0 [2]. The average diameter of interior lumen is 15~20 nm, and that of the outer diameter is 50~80 nm, length of the tubes will vary from 100 nm to 1500 nm or more. The reported maximum specific surface area of Hal reached 156 m2/g [8].
Halloysite is mainly formed through weathering of igneous rocks or their hydrothermal alterations. Halloysite mineral reserves are found throughout the world, such as the Dragon Mine in USA, Australia, New Zealand, Portugal and China [9,10]. Different producing areas have varied geographical and climatic conditions, so the formation of halloysite also has different morphological and physicochemical properties. Recently, Hillier et al. studied 21 relatively pure, tubular halloysite (Hal) samples from different locations, the results suggested that prismatic halloysite is a cylindrical shape, on which the nanotubes continue to grow and form [11]. Churchman et al. [12] summarized some new insights and data on recent literatures on the morphology and structure of halloysite, and found that the neoformation of halloysite always requires the presence of water. In the event of dry circumstance, kaolinite is formed. The halloysite growth manner and morphology may be limited by the oxides and hydroxides associated with Fe and Mn elements.
Based on the hollow nanotubular morphology, large surface area, high porosity, non-toxicity, good thermal stability and biocompatibility, as well as adjustable surface properties of halloysite mineral [13,14,15]. Significant attention has been focused on the application of halloysite into many fields in these years, such as the applications in chemically blocked and controlled release [16,17,18,19,20,21], biomimetic nanoreactors [22,23,24], medicine carrier and biological antibacterial materials [25,26,27], catalysis supports [28,29,30,31,32], hydrogen storage matrix [33,34,35], food packaging applications [36], mineral templates and other functional materials [37,38,39]. Many reviews have summarized the characters and application fields of Hal minerals [40,41], for example, Yuan et al. [42] introduced the main structural features and properties of halloysite, especially focused on the structure and morphology of halloysite and its changes, the formation mechanism of tubular structures, the physico-chemical properties, chemical modification of surfaces, and halloysite-based advanced materials. Lee et al. [18] found that the addition of Hal could enhance the interfacial bonding strength between carbon fibers and epoxy resins. The above literatures have clearly shown the high importance of halloysite in the fields of both mineralogical and materials science.
In the process of exploring some useful minerals, two halloysite minerals were newly discovered in Tongling and Shiyan, China, which have never been reported previously. The objective of this study is to obtain some basic information about these two newly found Hal minerals through XRF, XRD, TEM, TG and DSC techniques. For contrast, three Hal from typical areas, Chenxi, Linfen, and Australia were also acquired. The results show that, in developing new products with halloysite nanotubes, changes in the physicochemical properties of halloysite from different regions need to be considered. The data may provide some reference for the choice of clay from different regions to meet specific requirements or to optimize the performance of future product.
2. Experimental
2.1. Materials
The tested Hal samples were obtained from Shiyan, Hubei province (abbreviated as Hal-SY), Tongling, Anhui province (Hal-TL) Linfen, Shanxi province (Hal-LF) Chenxi, Hunan province (Hal-CX) in China, and Salt Lake in Australia (Hal-AU).
2.2. Halloysite Purification
Pre-treatments were adapted before the samples were tested. Visible impurities attached on the raw mineral (such as the brown parts containing too much ferrites and soil) were removed by manual selection, white or blue bulks were used as the samples, and were ground to make them pass a 200 mesh sieve before the followed tests. The Hal (4 g) powder were added into 200 mL distilled water, and subsequently magnetically stirred in a conical flask at 25 °C for 6 h. The purpose of washing was to remove some of the soluble impurities in the mineral. The suspension was then filtered and washed with distilled water and anhydrous ethanol several times to remove the possible organic material contained in halloysite. The treated mineral was dried at 60 °C for further characterizations.
2.3. Characterizations
The crystal phase of the samples was confirmed by a DX-2700 powder X-ray diffractometer (Dandong Hao Yuan, Dandong, China) with Cu Kα-radiation (λ = 1.541806 Å). Sample was scanned from 3° to 80° of 2θ with a step width of 0.02°. The “Minerals” package in Jade software was used for mineral phase identification and quantification. Transmission electron microscopy (TEM) images were characterized with TEM system (Titan G2 60-300, FEI, Hillsboro, OR, USA) equipped with an energy-dispersive X-ray spectrometer (Oxford EDX, Oxford, UK) operating at 200 kV. Fourier transform infrared spectroscopy (FTIR, Shimadzu, Kyoto, Japan) analysis was performed at room temperature using a Shimadzu Iraffinity-1 spectrometer from 4000 cm−1 to 400 cm−1 with pressed disks of the sample and KBr mixture (the mass ratio is 1:100), 32 scans were accumulated. TG/DSC (Netzsch, Bavaria, Germany) curves of the pure Hal was measured by a Netzsch STA449 in Nitrogen atmosphere, the heating rate was set at 10 °C/min. The TESCAN MIRA3 LMU scanning electron microscope was used to observe the surface morphology at the acceleration voltage of 30 kV. Chemical composition of the halloysite was measured by a Bruker S4 Pioneer X-ray fluorescence spectroscopy (XRF) (Bruker, Ettlingen, Germany). The zeta potential was measured on a Zeta potential & Size Distribution Analyzer Zeta plus apparatus (Malvern, Malvern, UK) at solids content of about 0.25 mg/mL in distilled water. The halloysite samples were stirred and soaked in the testing solution for a minimum of 30 min to guarantee the sufficient infiltrated by the solvent prior to the tests. HCl 0.5% and NaOH 1% was used to adjust pH 2~12 to achieve stable suspension. CEC of the minerals was measured in a neutral environment by exchange of NH4+ cations. 1 g treated halloysite was dried at 95 °C for 4 h, then mixed with 25 mL 50% aqueous ethanol to remove most of the soluble salts. Leachates were drained and discarded. The mineral powers were mixed with 500 mL 0.1 M NH4Cl at pH 7.0 in a test tube for at least 4 h to ensure saturation with NH4+. The above process was repeated for 3 times, then transferred to 100 mL volumetric flask. Channels and air locks were gently removed by applying suction to the outlet of the test tube when the 0.1 M NH4Cl was added. In detail, 8 mL neutral formaldehyde (35%) was poured into 25 mL boiling exchange solution. Then, 5 drops phenolphthalein (0.1%) was added into the mixed solution simultaneously and titrated with prepared sodium hydroxide (0.1 M) until the solution became light purple and did not fade after 30 s. The process was repeated for 3 times and averaged. The textural properties of the samples, such as surface area, pore volume and pore size distribution, were determined at 77 K using a Micromeritics ASAP 2020 gas phase sorbent (Micromeritics, Atlanta, GA, USA) for N2 adsorption-desorption isotherms, and then treated by the BET (Brunauer-Emmett-Teller) method and the BJH (Barrett-Joyner-Halenda) method.
3. Results and Discussion
3.1. XRD Analysis
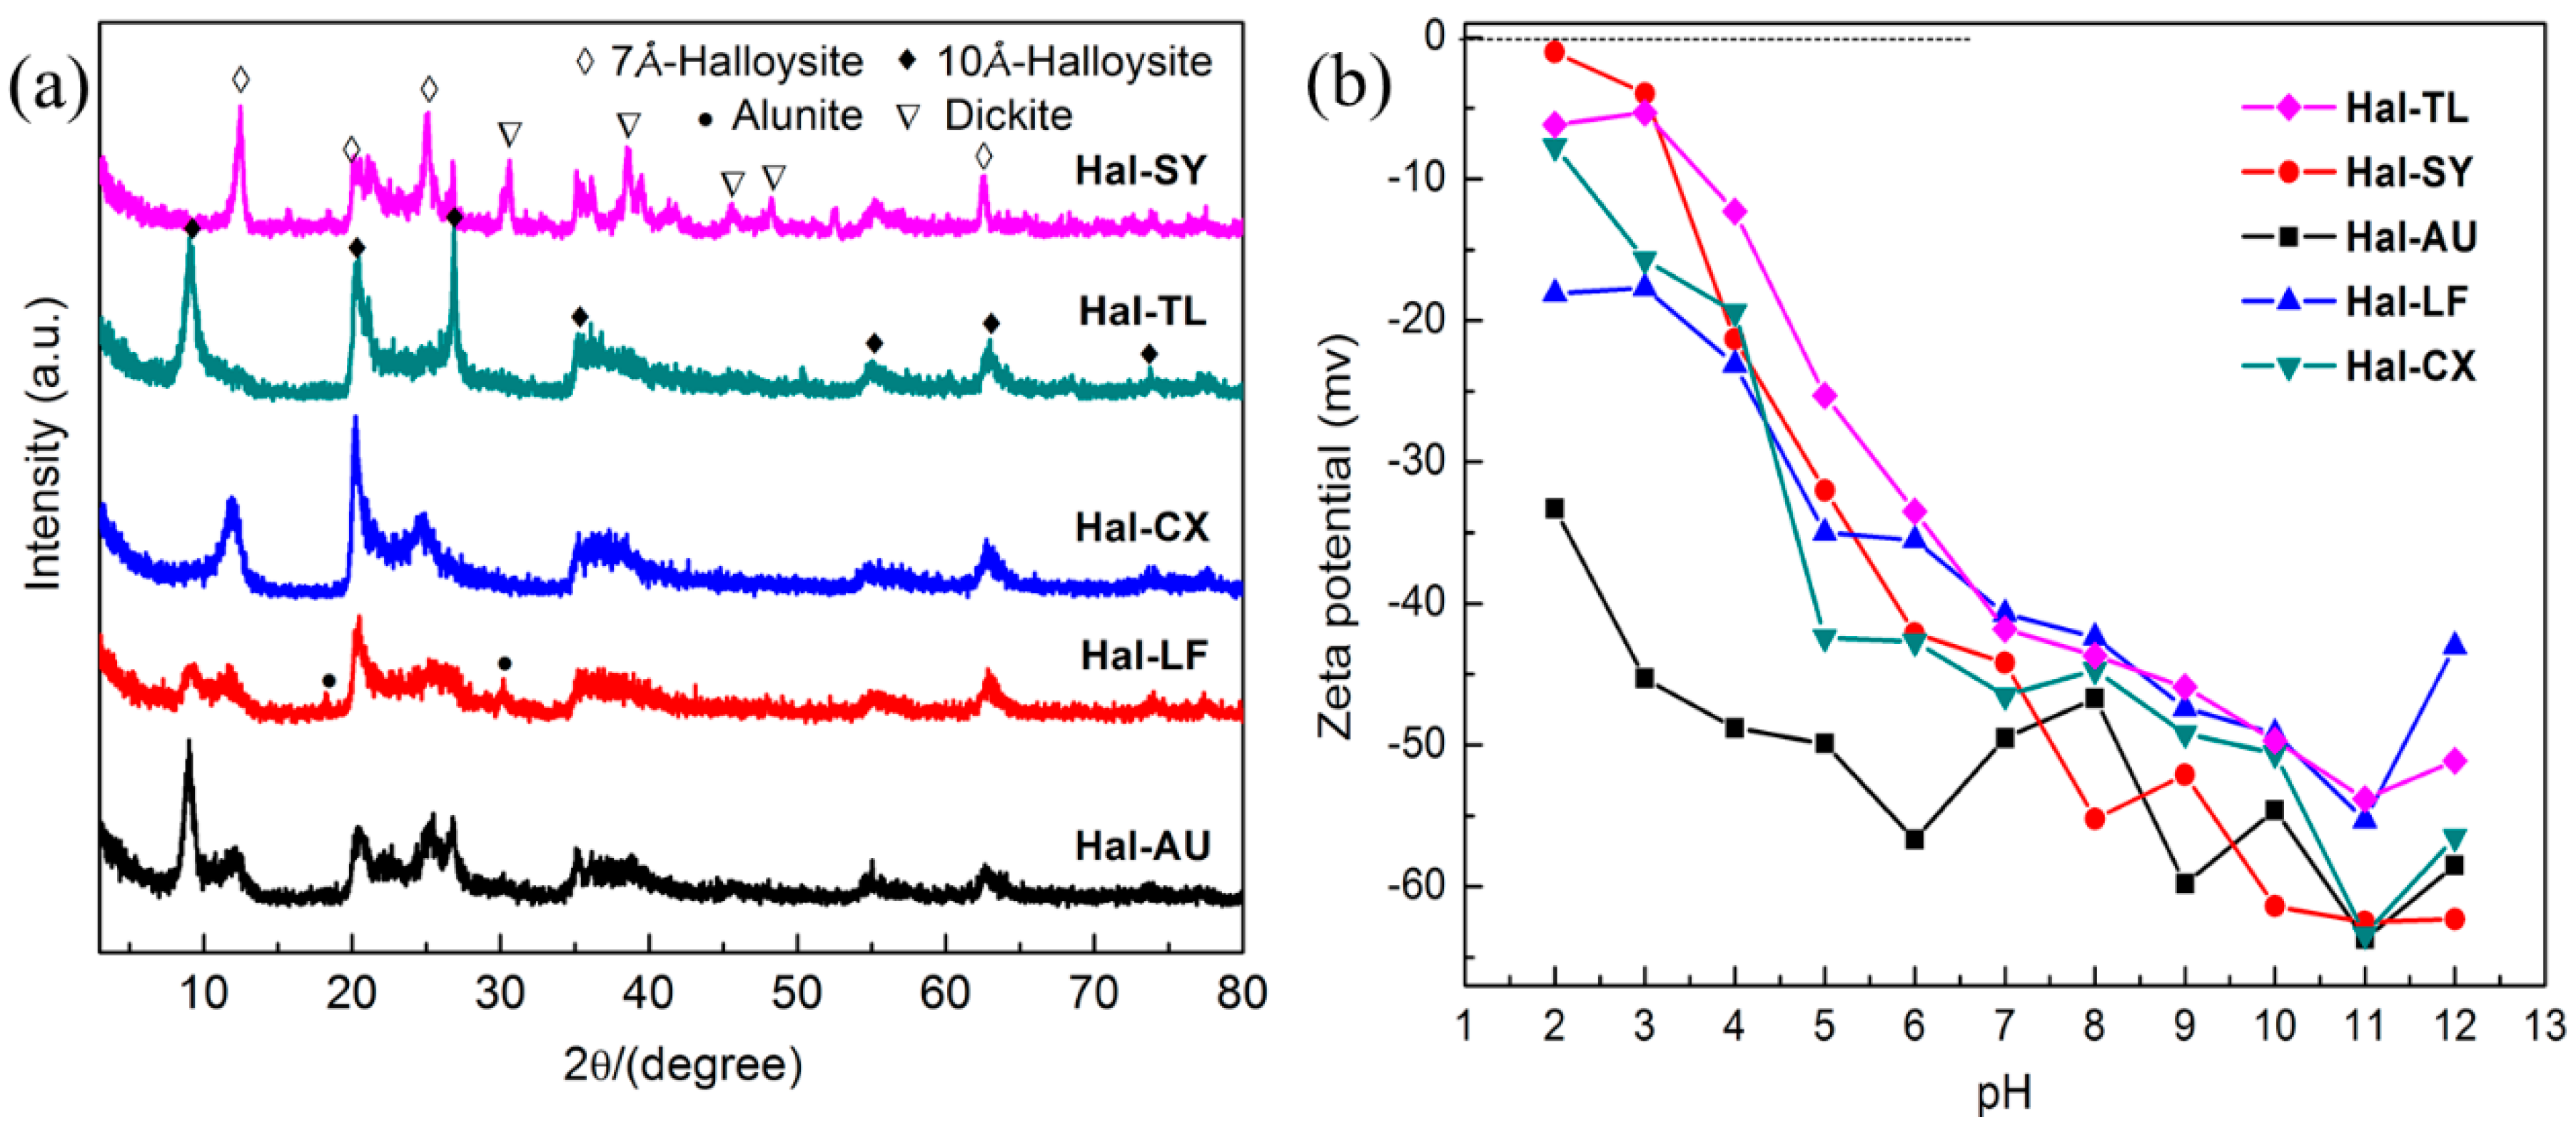
Halloysite usually shows broad and weak reflections due to their tubular morphology, high degree of disorder, small crystal size and interstratification of layers with various hydration states. Structure of the acquired samples were analyzed with the assistance of XRF results. X-ray diffraction patterns in Figure 1a show that the samples were all dominated by 7 Å- or 10 Å-halloysite structures, but some contained traces of impurity structures. The diffraction pattern for the Hal-SY had five peaks corresponding to 7 Å-halloysite (JCPDS PDF No. 29-1487), which is quite similar to the reflections from the Hal-CX. Other peaks at 2θ = 25.96°, 35.48°, 46.87° and 48.96° were detected, which were the characteristics of dickite (Al2Si2O5(OH)4, monoclinic structure, JCPDS PDF No. 10-0446). The coexistence of dickite (or alunite) and halloysite in the mineral indicating that halloysite was formed in the leaching and re-crystallization process, while the recrystallization process had not fully finished in the geology circumstance, yielding the mixed crystal structures in the mineral. XRD pattern of Hal-TL showed broad peaks belong to the 10 Å-halloysite (JCPDS PDF No. 29-1489). A characteristic reflection from gibbsite (Al(OH)3, monoclinic structure, JCPDS PDF No. 33-0018) was also observed on Hal-TL, suggesting that halloysite may be formed by weathering of feldspar mineral (KAlSi3O8, monoclinic structure, JCPDS PDF No. 89-8572). The Hal-AU sample is obtained in the sediments of Salt Lake in west Australia, the un-washed pristine Hal-AU sample contains large amount of NaCl (not shown here). So, the leaching and recrystallization process of Hal-AU should have better fulfilled in the cations abundant hot water, which should facilitate the crystallization process of many minerals. As a result, most of the diffraction peaks of Hal-AU can be indexed to the typical 10 Å-halloysite with a sharp and intense reflection at 2θ = 8.84°, corresponding to the basal spacing of (001) facets (d = 0.98 nm), while there seems to have a co-existed 7 Å-Hal in this sample, which may resulted from the drying pretreatment at 60 °C, as no such phase will be detected when no pre-treatment was conducted for this mineral, while that will show large amount of NaCl on the XRD. The co-existence of 7 Å- and 10 Å-Hal were also found in the Hal-LF sample. Only very few reflections from impurities were found in these two samples, the reflection at 2θ = 25.58° might be originated from the trace amount of TiO2 lattice in Hal-AU, while the traces of alunite (KAl3(SO4)2(OH)6, hexagonal structure, JCPDS PDF No. 73-1652) at 2θ = 17.87° and 30.92° were found on the XRD pattern of the Hal-LF sample. The existence of alunite in the Hal-LF indicated its formation by the action of acid-sulphate fluids.
Due to the varied environmental factors that affect the orderliness of different halloysite minerals, the formation and growth of Hal under different geological conditions have resulted in some very complicated structures and degrees of order. A crystallinity index of halloysite was introduced to estimate the crystal orderliness of the minerals. The index reflects the stacking order and internal variability of crystal lattice of a clay mineral, which was derived from the ratio of the intensities for the peak at 2θ = 4.4~4.5 Å to that at 2θ = 2.4~2.5 Å on each of the XRD patterns [8]. The derived crystallinity index for Hal-TL, Hal-SY, Hal-AU, Hal-LF, and Hal-CX were 2.21, 1.54, 1.85, 1.26, and 3.41, respectively. The index indicates that the crystallinity of Hal-TL is higher than Hal-SY, while it is still lower than the well crystallized Hal-CX sample. This should indicate that the lattice of Hal-TL sample from leaching of feldspar mineral is better developed than the non-fully developed Hal-SY mineral.
3.2. XRF Analysis
XRF results in Table 1 show that SiO2 and Al2O3 contents occupy the major components of halloysite; the commonly reported theoretical ratio is 2:1 in many literatures [16]. Actually, the ratio was often affected by the contents of impurities. The atomic ratios of SiO2 to Al2O3 in all of these Hal samples were varied in the range 1.11~1.26, rather than the theoretical 2.0, indicating that the [SiO4] tetrahedral sheet may contain some other positive ions (e.g., Al, Fe, Ti), which have substituted the normal Si sites and yielded some isomorphic or isomeric minerals. The main impurity in halloysite was Fe3+ (which existed as hematite or maghemite, and even partly substitute positions of Al3+ in the octahedral sheet [15,43]), Ca2+ and K+ (which often coordinates with oxygen atoms on the edge of the polyhedrons to compensate the excessive electronic charges, these cations may be exchangeable, or existed in the form of carbonates that cannot contribute to the cation exchange). The Hal-AU, Hal-SY and Hal-TL had a trace amount of Ti content, indicative of the anatase (TiO2) impurity [44]. P2O5 and SO3 were detected because of the existence of the aforementioned excessive cations in forms of phosphates and sulphates. The presence of K2O and SO3 in Hal-SY, Hal-LF and Hal-TL samples reflected traces of alunite [6]. Samples Hal-SY and Hal-TL recorded comparatively higher phosphorus possibly from the woodhouseite (CaAl3(PO4)(SO4)(OH)6) which may be formed in the geological sedimentation procedure.
3.3. Zeta Potential Analysis
The zeta potential of minerals is dependent on the ionic strength of the suspension, morphology and surface properties. The zeta potentials changing curves of the samples (Figure 1b) show large net negative charge in a wide range of pH values for all of the Hal surface that the negativity increased with increasing pH. Two main reasons were proposed for the surface negative charge of Hal in aqueous solution. Firstly, the hydroxylation of surface and edge sites of layered lattice of Hal in aqueous solution, which is the main reason for its negative charge [45]. Secondly, the replacement of Al3+ by Fe2+ in the octahedral sheet of halloysite raised the unbalanced layer charge. Zeta potential estimations based on first principle modeling for halloysite revealed that the two structural sheets showed different pH-dependent behaviors [46]. The octahedral sheet was positively charged when the pH was below 8.0, while the tetrahedral sheet was negatively charged when the pH was above 2.0. When the oxygen atoms of [SiO4] and [AlO6] are exposed to water, some aluminol and silanol hydroxyl groups will be formed on the surface through the following reactions (1) and (2) [47], accompanied with the ionization balance processes.
Sur-OH + H+→Sur-OH2+
Sur-OH + OH−→Sur-O− + H2O
The point of zero net proton charge (pHPZNPC) represents the critical point of the mineral surface protonation. When the pH of halloysite aqueous solution is lower than pHPZNPC, the aluminol and silanol groups begin to protonate through reaction (1) and form positively charged on broken edges and gibbsite planes. When the pH of halloysite aqueous solution is larger than pHPZNPC, the aluminol and silanol groups begin to deprotonate through reaction (2) and form negatively charged on broken edges and gibbsite planes [45]. The [SiO4] acidic sites on surface of the halloysite tubes will cause the equilibrium (1) move to the right hand over a wide pH range, and thus negatively charged on the surface. As the pH continued to increase, the balance was broken and the negative charge continued to increase. Surface potential for all of the samples are negative even in strong acidic circumstance (pH = 2.0), and the potential continues to decrease in the following tested pH range. The Hal-SY and Hal-TL samples show a relatively higher surface potential in all of the samples. A near zero potential was also detected on the Hal-SY when pH was close to 2.0, considering that this sample contains some dickite, the relatively higher surface potential is reasonable due to the relatively higher cation exchange capacity of this sample. In the pH value of 7.0~10.0, the Zeta potential of all of the samples tend to be in the range −60~−45 mV, especially the samples Hal-LF, Hal-CX, and Hal-TL, which were similar to previous results [6,15]. There is a slight increase at pH = 8, which can be attributed to the interior aluminoxane surface (IEP 9) [48]. The largest negative potential (−62.0 mV) was detected at pH = 11.0 on the Hal-AU sample. Also, this sample is nearly the most negatively charged sample in the tested pH range, indicating that the Salt Lake developing circumstance should have favored the negatively charged surface of the silicate mineral; also, the possible impurities such as alunite should contribute to the surface charges. As the presence of other components, especially alunite, makes the behavior-related electrolyte concentration of zeta potential difficult to interpret [6].
3.4. CEC Analysis
CEC of clay minerals determines the cation exchange ability with typical alkaline or alkalin-earth ions, which is the decisive factor for the adsorbing ability, chemical stability and application probability. CEC is usually measured in a neutral environment by exchange of NH4+ cations [49]. Generally, CEC of halloysite varied in the range 8~60 cmol/kg, which is a bit higher than Kaolin (1~15 cmol/kg) due to the existence of inter-layer water molecules and hydroxyls [50]. These inter-layer hydroxyls and water molecules will provide the exchangeable sites for many kinds of ions, and usually these ions are also exchangeable, yielding the relatively larger CEC values in Hal compared with kaolinite. At room temperature, the adsorption experiments of halloysite to NH4Cl showed that there are only two absorption sites in Hal, interlayer and outer surface, respectively, while NH4Cl can also be adsorbed by the surface as it is negatively charged. CEC of halloysite is actually affected by the purity of the raw material, particle size and even the effect of micro-topography. Due to the extremely small size of Hal nanotubes, it also had excellent boundaries and surface activity, so that its CEC value increased with decreasing sizes. Bailey (1990) considered Al3+ substituted Si4+ cations in the halloysite tetrahedron to produce negative charges [51], however, the 27Al NMR by Newman et al. (1994) [52] indicated that halloysite has similar Al(IV) content as standard kaolinite. This charge was balanced by the interlayer surface hydration exchangeable cations. In other words, the interlayer water in halloysite formed hydrated shells of charge-balancing cations, thus will contribute to the CEC of the Hal nanotubes. On the other hand, impurities in Hal minerals may also be responsible for the excessive Mg and K content in these samples. Ca, K, Mg and Na were the major exchangeable cations. The measured CEC for the Hal samples are included in Table 1. According to the chemical compositions of each sample in Table 1, the calcium should act as the dominant exchangeable cation in Hal-SY, Hal-LF and Hal-CX samples; a higher CEC (32 cmol/kg) was detected in the well-developed Hal-CX mineral with high purity, which is possibly due to the large amounts of hydroxyls as the exchangeable sites presented in the interlayer of halloysite tube walls. The Hal-SY mineral with the highest CEC (40 cmol/kg) was also obtained, which should be ascribed to the existence of high content Ca2+ in the sample, and the under-developed crystal lattice in the sample also should be responsible for the high CEC value. The Hal-TL and Hal-LF showed similar CEC, as they have similar exchangeable cation contents. The smallest CEC (8 cmol/kg) in Hal-AU was very impressive, which is similar with that of kaolinite. Considering the Salt Lake sedimentary circumstances, the highly ionic concentrations seem to have eliminated most of the exchangeable cations in the formation process of this mineral, resulting in the extremely low CEC value of the Hal-AU sample. The above results have indicated that the chemical compositions, as well as the cations status and developing conditions of the Hal will deeply affect the CEC and surface charge characters of the minerals. Also, the interlayer adsorption of NH0+ may contribute to the exchangeable cations in the test, which may provide some confusing results. While for the purpose of providing contrasting results with the literature, this method was still adapted in these experiments.
3.5. FTIR Analysis
FTIR spectrum is often used to characterize the structure and coordinative sites of clay-based minerals. Many typical vibration bands can be found on IR spectra of different clay minerals, while the spectra of halloysite in the range 550~1350 cm−1 are similar to kaolinite [53], so the ascriptions are often difficult to be recognized, but they still have some distinctive bands. Each vibration line is assigned to the stretching or deformation of the groups and bonds in the samples according to the literature [48,54,55,56,57]; the FTIR spectra of Hal from different regions are shown in Figure 2 and the ascriptions are included in Table 2, respectively. The double adsorption bands at around 3696 cm−1 and 3620 cm−1 were ascribed to the stretching vibration of the adsorbed water. The peaks at 3696 cm−1 corresponded to the stretching of perpendicular surface –OH groups, and the band at around 3620 cm−1 is ascribed to the stretching of –OH coordinated with the tetrahedral sheet and octahedral sheet located in the unit cell of Hal structural. The peak at 1642~1650 cm−1 could be ascribed to the bending of –OH in adsorbed water (for better recognition of the typical IR bands in the range 400~1200 cm−1, the spectra in the range 1200~3000 cm−1 were not shown for clarity of the fringes in mid-infrared part). The intensity of the H–O–H deformation band at 1642 cm−1 increased with decreasing degree of structural order, and the band increased with the increasing of inter-layer water contents. The broad bands in the range adsorption band at 950~1150 cm−1 originated from the Si–O stretching vibrations in all kinds of silicate-based clay minerals. The main absorption was detected at 1030 cm−1, with a trace of shoulder at around 1010 cm−1, which were often ascribed to the asymmetric in-plane Si–O–Si stretching. The same in-plane stretching of apical Si–O bonds were detected at 1094 cm−1. Furthermore, the symmetric stretching of Si–O bonds involving the basal oxygen atoms can be observed at 1116 cm−1. All of the Si–O stretching bands are similar for the Hal samples, with the exception of Hal-SY sample, which illustrated a relatively stronger band at 1116 cm−1, confirming that the Hal-SY sample should have more fragments or imperfections in the lattice. This has been and will be further verified in the following characterizations. The adsorption peak at around 910 cm−1 could be ascribed to the –OH deformation of inner hydroxyls [58], which illustrated a small shift to the higher wavenumber position (913 cm−1) for Hal-SY sample, indicating the different hydration state of this sample. The spectral bands from 690~800 cm−1 could be designated to the stretching of the Si–O lattice. The symmetric stretching was detected at 793 cm−1, and the doublet bands observed at 756 cm−1 and 695 cm−1 originated from the perpendicular stretching of Si–O bonds probably involving to surface hydroxyls. The double adsorption peaks at 534 cm−1 and 468 cm−1 were ascribed to the bending vibration of the Si–O groups. The former should result from the deformation of Al–O–Si frames, and the latter should have originated from the deformation of Si–O–Si bonds. The small bands at 432 cm−1 and 418 cm−1 should also come from the stretching of Si–O bonds in [SiO4] tetrahedral frameworks. The FTIR spectra of the different Hal showed nearly similar shapes with very little deviations, only the Hal-SY has some tiny differences in the positions or relative intensities of the vibration bands, which confirms that the acquired Hal minerals has the same basic structures, but remains to have some differences in the individual samples.
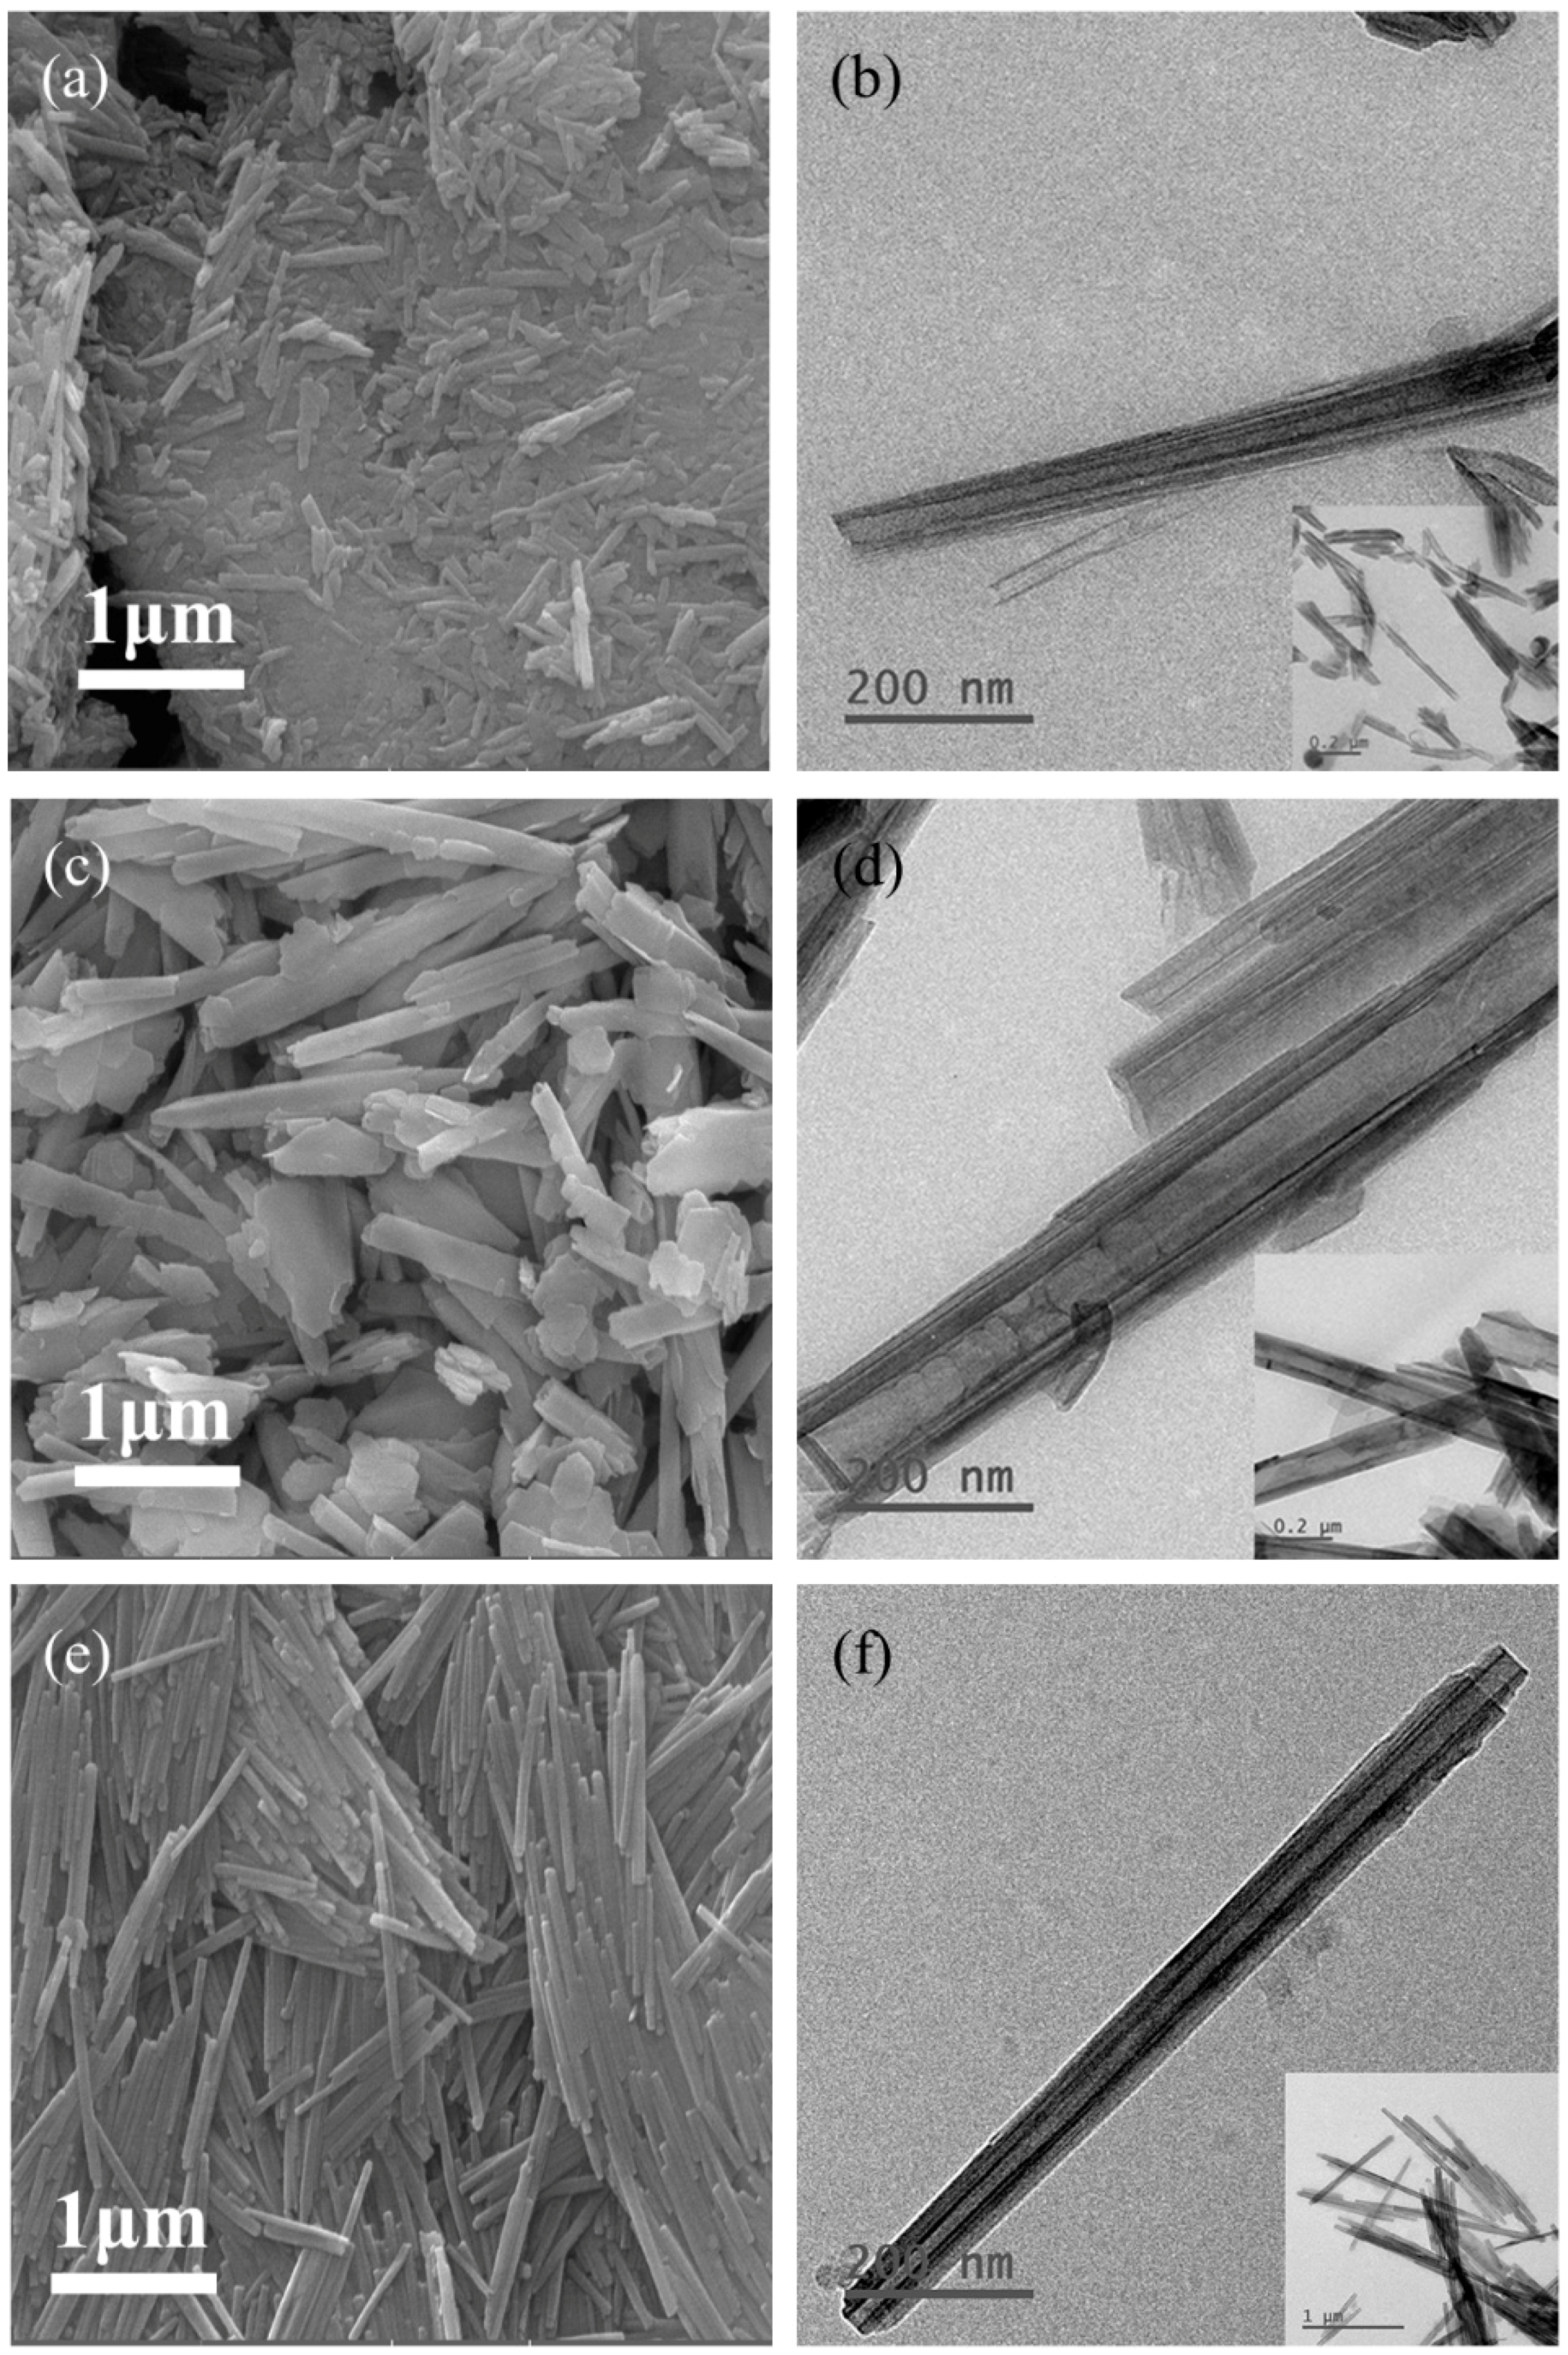
3.6. SEM and TEM Analysis
SEM and TEM images are the most direct avenue to verify tubular characters of different Hal minerals. Typical SEM images of the halloysite in Figure 3 clearly show the cylindrical shape for all of the Hal samples; TEM images showed that typical Hal possessed a hollow tubular structure with open ends. The nanotubes adhered and aggregated with each other in the pristine minerals. Some bubble-like fragments can be seen in some of the TEM images possibly due to the residual of ethanol solvent absorbed into the tube lumen by capillary forces in the sampling of TEM suspensions. The estimated morphological parameters of the various Hal minerals after dispersion in de-ionized water are summarized in Table 3. The halloysite particles were mainly tubular, with the outer diameter of about 30–80 nm, the inner diameter about 10–70 nm, and the length of about 200–2000 nm. Very few fragments were observed in the Hal-SY and Hal-CX samples. Comparison of the length/diameter (l/d) ratios based on the images revealed that most of Hal samples were composed of relatively long tubes and thin walls with a round or oval cross-section, whilst the exceptional Hal-SY was obviously composed of stubby tubes with outer diameter up to 150 nm (Figure 3d), which is much larger than the other samples. Some sheet-like particles were also observed in Figure 3c, which might be the presence of kaolinite or dickite in the sample. The Hal-TL sample has a quite smaller l/d ratio and less tube diameter, so as to the Hal-CX and Hal-LF samples. The most obvious character of Hal-AU is the well-developed nanotubes with uniform sizes and larger l/d ratio, no fragment and stubby tubes can be found in the sight field. The variation of the halloysite morphology should be originated from the difference in the geological circumstances and the genetic types. Two typical genetic types of halloysite were concluded in the literature: weathered residuals, and secondary leaching gel deposition-recrystallization. The formation of halloysite was associated with a silicon rich environment deposit, excessive Ca and K inhibited halloysite nucleation [8]. The presence of many different nucleation sites (Fe and/or Mn hydrates, kaolinite, dickite) may inhibit the crystal growth of these minerals, and may yield different kinds of isomeric products. It seems that the Hal developed from the Salt Lake circumstance have favored the formation of a well-developed halloysite mineral. Based on the composition and structure of the minerals, combined with X-ray diffraction and microscopic and scanning electron microscopy analyses, it can be concluded that all of the tested Hal samples should be formed following the secondary leaching gel deposition-recrystallization deposition process, while some of the Hal-SY mineral was not full developed due to the high impurities or different geological conditions, resulting in the mixture of dickite with halloysite in the mineral.
3.7. BET Surface Analysis and Porosity
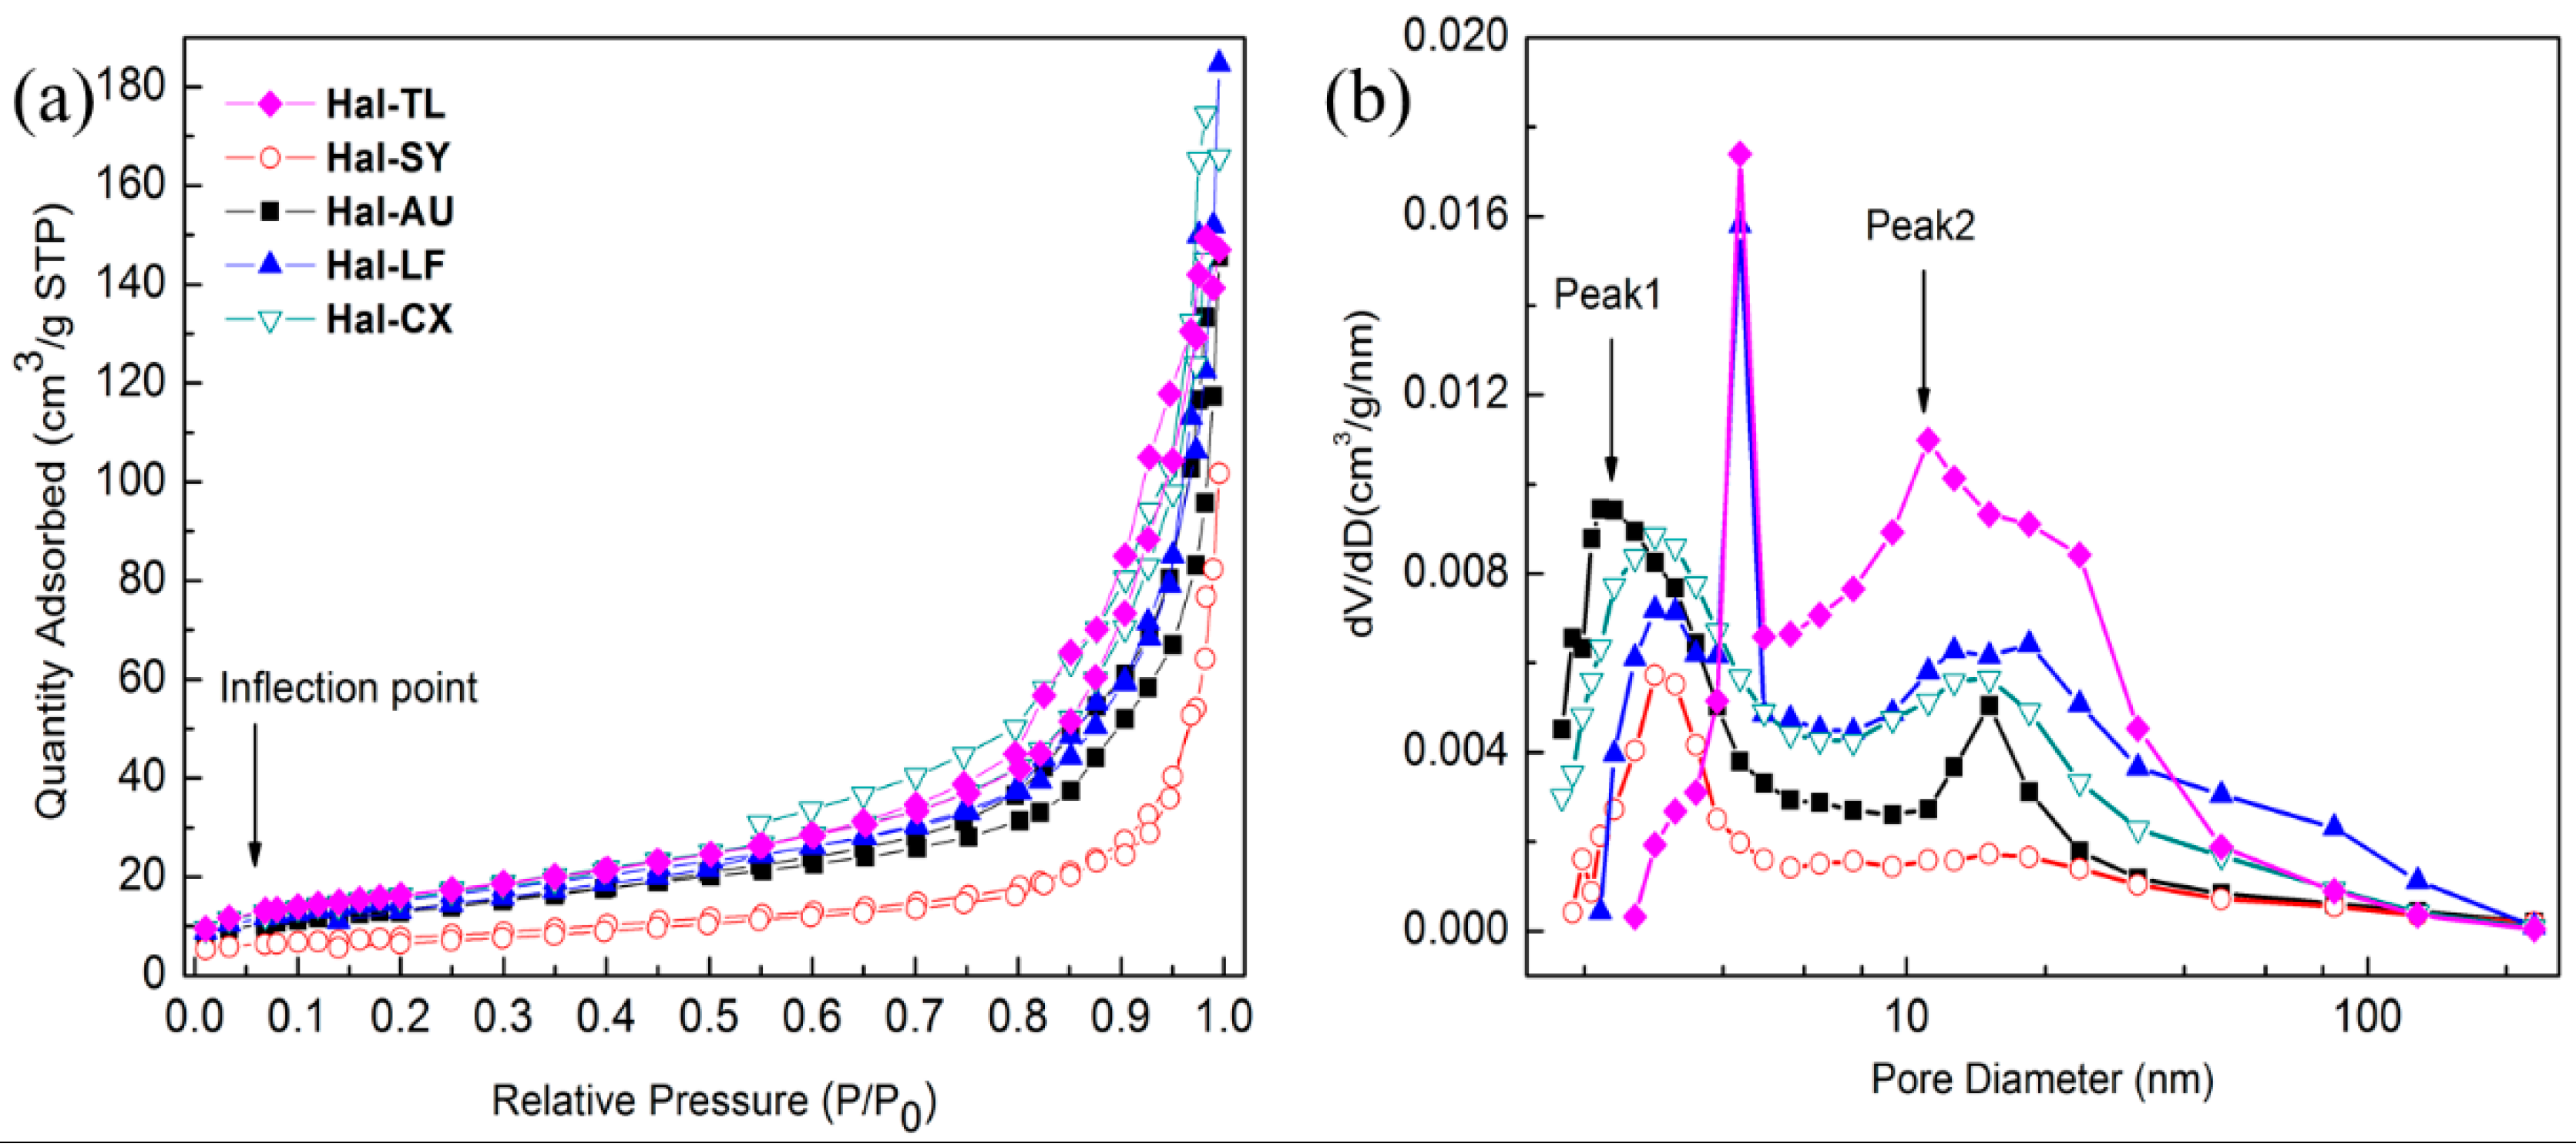
Nitrogen adsorption-desorption isotherms of Hal samples, and their corresponding BJH pore size distributions are shown in Figure 4, analysis of nitrogen adsorption data, surface area, pore size distribution, and pore volume are summarized in Table 4. The isotherms of all halloysite possessed type II with significant type H3 hysteresis loop in the high relative pressure (P/P0) range of 0.8–1.0, indicating the unrestricted monolayer/multilayer adsorption of N2 in the slit-shaped pores [59]. The inflection point, as shown in Figure 4a, indicated the beginning of the linear middle portion of the isotherms at which monolayer adsorption was completed and multi-layer adsorption started. Samples Hal-LF, Hal-CX and Hal-TL have larger surface areas (up to 55~58 m²/g), while the Hal-SY sample has a reduced BET surface area (26 m²/g) probably owing to the existence of sheet-like kaolinite or dickite. Most of the pore size distribution curves (Figure 4 and Table 4) have a similar broad bimodal shape, although the peak positions varied in the different samples. The double peaks (peak 1 and 2) correspond to the smaller inter-layer pores and larger tube lumens in the samples, respectively. Peak 1 in the smaller size side (2~8 nm) is due to the internal/surface pores, artificial pores caused by the tensile strength effect and the newly formed mesopores during dehydration of tubular halloysite, including spaces between the overlaps of folded halloysite nanotubes [60]. The sharp peaks at 7.5 nm for Hal-LF and Hal-TL should also be regarded as the longitudinal pores created by the tightly connected rolled tubular halloysites in the drying or dehydration process, confirming the regularly arranged nanotubes in these two samples [61]. Peak 2 is located in the bigger size side (14~17 nm), which should be mainly due to the central cavity of the halloysite tubes. Although the sizes derived from the BJH method are smaller than those observed in TEM images due to the sampling method of TEM, peak 2 in all of the BJH curves confirmed the existence of a lumen cavity in all of the samples. The observation of Peak 1 and the two sharp peaks in Figure 4b reflect the different status of the arrangement (or aggregation) of the nanotubes, while the existence of peak 2 should indicate the large cavity of the nanotubes. The obviously decreased Peak 2 on BJH curve of the Hal-SY sample should again confirm the different mineralogical character of this sample due to the existence of sheet-like kaolinite and/or dickite. This can be verified by the smaller pore volume in Hal-SY (0.16 cm³/g out of the 0.23 and 0.29 cm³/g for the other samples) in combination with the XRD and TEM results.
3.8. Thermogravimetric Analysis
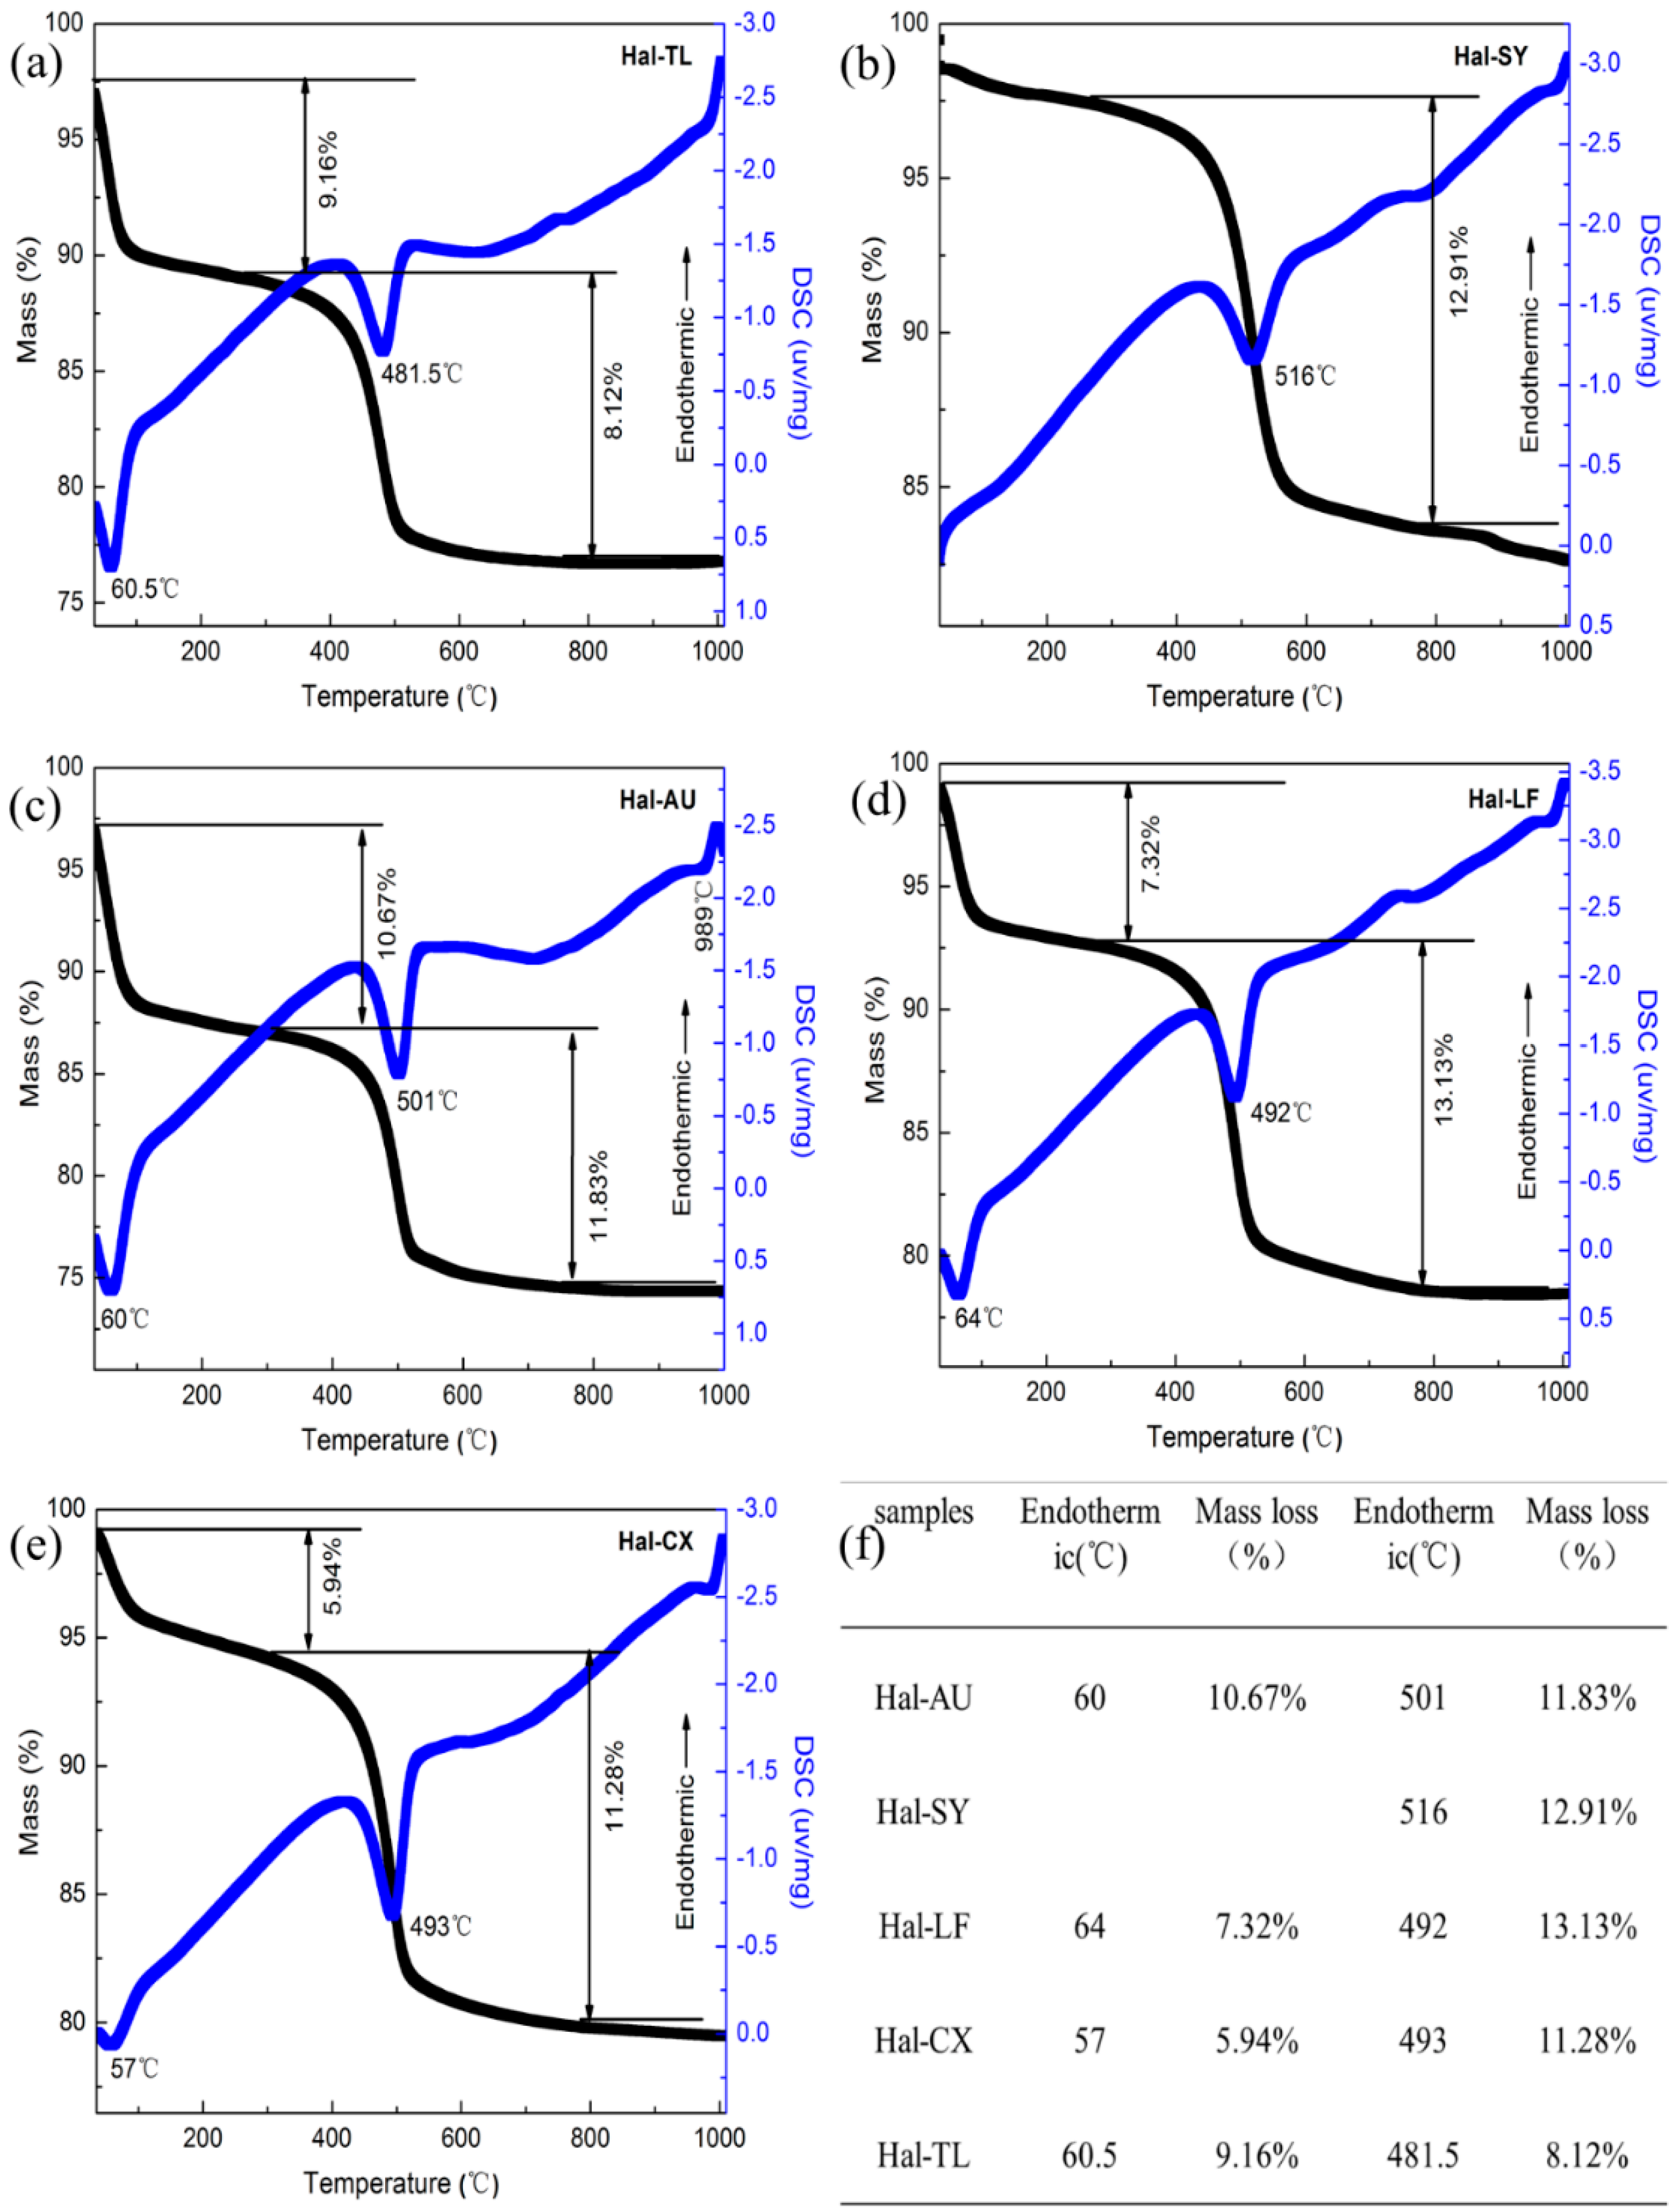
The thermal properties of the Hal in typical regions were recorded by TG and DSC from room temperature to 1010 °C at a heating rate of 10 °C/min (Figure 5). There were two main endothermic peaks followed by an exothermal peak in the heating process, with the exception of Hal-SY sample, for which, more sophisticated thermal behaviors were detected. The first endothermic peak for all of the TG/DSC curves in the range of 50–150 °C was attributed to the loss of adsorbed water on the surfaces or lumen of the halloysite. The mass loss in this process was about 10.67%, 9.16% and 7.322% in Hal-AU, Hal-TL and Hal-LF, respectively, as these samples contain a large part of 10 Å-halloysite, according to the XRD results, which has a higher hydroxyl contents compared with the 7 Å-halloysite. Whereas this mass loss stage for the Hal-CX is only 5.94% because this sample contained only 7 Å-halloysite. For the Hal-SY sample, only about 3% mass loss was detected before 200 °C, confirming a relative lower water content for the mixture of 7 Å-halloysite and dickite in this sample. The second endothermic peak between 450 °C and 600 °C is often attributed to the structural de-hydroxylation process; a mass loss from 8.12%~13.13% was recorded in this stage. The exothermic peak in the range 900 °C~1000 °C should be attributed to the phase segregation of SiO2 and γ-Al2O3 from halloysite lattice in the mineral [62]. As expected, the DSC curves for 7 Å-halloysite and 10 Å-halloysite were similar except for the weak or absent first endothermic peak before 120 °C. The shape, position and area of the drastic de-hydroxylation peak can be affected by particle size distribution, crystallinity, type of isomorphs substitution, and impurities. The de-hydroxylation in the Hal-SY happens near up to 516 °C, which is accompanied by an obvious mass loss of 12.91%. This may be due to the presence of dickite in the Hal-SY sample, which had a de-hydroxylation temperature of about 603 °C [63]. The peak temperature for de-hydroxylation in Hal-TL was reduced to 481 °C possibly due to the presence of gibbsite, which has a de-hydroxylation temperature of 246 °C [64,65].
4. Conclusions
Based on the above physico-chemical properties, it can be concluded that halloysite minerals formed under different geographical and climatic conditions have varied morphological and chemical properties. Morphology of the newly found Hal-SY have an l/d ratio of about 8.13, while the Hal-TL sample has the smaller l/d ratio of about 6.79 with stubby shape. Hal-AU and Hal-LF had a particularly uniform and straight tubular morphology with a diameter in the range of 30–90 nm and a length of 300–1600 nm. Zeta potential measurements showed that all halloysite samples were negatively charged in the range of pH 2–12. The presence of dickite in the sample Hal-SY caused the increased de-hydroxylation temperature but decreased specific surface area, whereas the presence of gibbsite decreased the de-hydroxylation temperature of Hal-TL. Cation exchange capacity of the tested halloysite samples was revealed to be in the range 8~40 cmol/kg and maximized in Hal-CX. These basic results may provide useful information for the understanding of halloysite minerals from different areas and will aid in the preparation of advanced materials from halloysite.
Acknowledgments
This work was supported by the National Natural Science Fund of China (51774331, 51304242, 51374250), National Science Fund for Distinguished Young Scholars (51225403), the Natural Science Fund of Hunan Province (2017JJ0351), the Innovation Driven Plan of Central South University (No. 2016CX015), the ShengHua Scholar Project of CSU (20160201), the Strategic Priority Research Program of Central South University (ZLXD2017005), the Specialized Research Fund for the Doctoral Program of Higher Education (20130162120011), Funds for Hunan Provincial Natural Science Foundation for Innovative Research Groups([2013]2), the Fundamental Research Funds for the Central Universities of Central South University (2017zzts668, 2017zzts583 and 2017zzts436).
Author Contributions
Jing Ouyang, Dawei Mu, Yi Zhang conceived and designed the experiments; Dawei Mu performed the experiments, analyzed the data and wrote the drafts of the paper; Jing Ouyang corrected the draft intensively, submitted the paper and pay for the processing fees, Yi Zhang and Huaming Yang helped in the preparation of the paper and in checking the drafts of the paper.
Conflicts of Interest
The authors declare no conflict of interest.
References
- Yuan, P.; Southon, P.D.; Liu, Z.; Green, M.E.R.; Hook, J.M.; Antill, S.J.; Kepert, C.J. Functionalization of halloysite clay nanotubes by grafting with γ-aminopropyltriethoxysilane. J. Phys. Chem. C 2008, 112, 15742–15751. [Google Scholar] [CrossRef]
- Chao, C.; Liu, J.; Wang, J.; Zhang, Y.; Zhang, B.; Zhang, Y.; Xiang, X.; Chen, R. Surface modification of halloysite nanotubes with dopamine for enzyme immobilization. ACS Appl. Mater. Interfaces 2013, 5, 10559–10564. [Google Scholar] [CrossRef] [PubMed]
- Hofmann, U. On the chemistry of clay. Angew. Chem. Int. Ed. 1968, 7, 681–692. [Google Scholar] [CrossRef]
- Lvov, Y.M.; Shchukin, D.G.; Möhwald, H.; Price, R.R. Halloysite clay nanotubes for controlled release of protective agents. ACS Nano 2008, 2, 814–820. [Google Scholar] [CrossRef] [PubMed]
- Zhai, R.; Zhang, B.; Liu, L.; Xie, Y.; Zhang, H.; Liu, J. Immobilization of enzyme biocatalyst on natural halloysite nanotubes. Catal. Commun. 2010, 12, 259–263. [Google Scholar] [CrossRef]
- Pasbakhsh, P.; Churchman, G.J.; Keeling, J.L. Characterisation of properties of various halloysites relevant to their use as nanotubes and microfibre fillers. Appl. Clay Sci. 2013, 74, 47–57. [Google Scholar] [CrossRef]
- Churchman, G.J. The relationship between the hydrated and dehydrated states of an halloysite. Clays Clay Miner. 1972, 20, 241–246. [Google Scholar] [CrossRef]
- Joussein, E.; Petit, S.; Churchman, J.; Theng, B.; Righi, D.; Delvaux, B. Halloysite clay minerals—A review. Clay Miner. 2005, 40, 383–426. [Google Scholar] [CrossRef]
- García, F.J.; Sergio, G.R.; Andreas, K.; Armin, R. Study of natural halloysite from the Dragon Mine, Utah (USA). Z. Anorg. Allg. Chem. 2010, 635, 790–795. [Google Scholar] [CrossRef]
- Bobos, I. Kaolinite to halloysite-7 Å transformation in the kaolin deposit of São Vicente de Pereira, Portugal. Clays Clay Miner. 2001, 49, 596–607. [Google Scholar] [CrossRef]
- Hillier, S.; Brydson, R.; Delbos, E.; Fraser, T.; Gray, N.; Pendlowski, H.; Phillips, I.; Robertson, J.; Wilson, I. Correlations among the mineralogical and physical properties of halloysite nanotubes (HNTS). Clay Miner. 2016, 51, 325–350. [Google Scholar] [CrossRef]
- Churchman, G.J.; Pasbakhsh, P.; Lowe, D.J.; Theng, B.K.G. Unique but diverse: Some observations on the formation, structure and morphology of halloysite. Clay Miner. 2016, 51, 395–416. [Google Scholar] [CrossRef]
- Yang, Y.; Chen, Y.; Leng, F.; Huang, L.; Wang, Z.; Tian, W. Recent advances on surface modification of halloysite nanotubes for multifunctional applications. Appl. Sci. 2017, 7, 1215. [Google Scholar]
- Rawtani, D. Multifarious applications of halloysite nano tubes: A review. Rev. Adv. Mater. Sci. 2012, 30, 282–295. [Google Scholar]
- Zhang, Y.; Tang, A.; Yang, H.; Ouyang, J. Applications and interfaces of halloysite nanocomposites. Appl. Clay Sci. 2015, 119, 8–17. [Google Scholar] [CrossRef]
- Cheng, Z.L.; Cao, B.C.; Wu, P.R.; Ma, L.; Liu, Z. Templated synthesis of graphene nanosheets within curling layered nanostructure of halloysite nanotubes. Mater. Lett. 2017, 202, 62–65. [Google Scholar] [CrossRef]
- Mo, J.; Ma, W.; Zhang, W.; Yuan, J. Structure and properties of carbon intercalated halloysite and its organosilicone hybrid film with low dielectric constant. Mater. Des. 2017, 128, 56–63. [Google Scholar] [CrossRef]
- Lee, J.W.; Park, S.J.; Kim, Y.H. Improvement of interfacial adhesion of incorporated halloysite-nanotubes in fiber-reinforced epoxy-based composites. Appl. Sci. 2017, 7, 441. [Google Scholar] [CrossRef]
- Fu, L.; Yang, H.; Tang, A.; Hu, Y. Engineering a tubular mesoporous silica nanocontainer with well-preserved clay shell from natural halloysite. Nano Res. 2017, 10, 2782–2799. [Google Scholar] [CrossRef]
- Zheng, T.; Ni, X. Loading the polyol carbonization agent into clay nanotubes for the preparation of environmentally stable UV-cured epoxy materials. J. Appl. Polym. Sci. 2017, 134, 45045. [Google Scholar] [CrossRef]
- Cavallaro, G.; Danilushkina, A.A.; Evtugyn, V.G.; Lazzara, G.; Milioto, S.; Parisi, F.; Rozhina, E.V.; Fakhrullin, R.F. Halloysite nanotubes: Controlled access and release by smart gates. Nanomaterials 2017, 7, 199. [Google Scholar] [CrossRef] [PubMed]
- Zheng, P.; Du, Y.; Ma, X. Selective fabrication of iron oxide particles in halloysite lumen. Mater. Chem. Phys. 2015, 151, 14–17. [Google Scholar] [CrossRef]
- Shchukin, D.G.; Sukhorukov, G.B.; Price, R.R.; Lvov, Y.M. Halloysite nanotubes as biomimetic nanoreactors. Small 2005, 1, 510–513. [Google Scholar] [CrossRef] [PubMed]
- Li, Z.; Liu, L.; González, A.J.; Wang, D. Bioinspired polydopamine-induced assembly of ultrafine Fe(OH)3 nanoparticles on halloysite toward highly efficient fire retardancy of epoxy resin via an action of interfacial catalysis. Polym. Chem. 2017, 8, 3926–3936. [Google Scholar] [CrossRef]
- Ouyang, J.; Zhao, Z.; Zhang, Y.; Yang, H. Textual properties and catalytic performances of halloysite hybrid CeO2-ZrO2 nanoparticles. J. Colloid Interface Sci. 2017, 505, 430–436. [Google Scholar] [CrossRef] [PubMed]
- Zhang, Y.; He, X.; Ouyang, J.; Yang, H. Palladium nanoparticles deposited on silanized halloysite nanotubes: Synthesis, characterization and enhanced catalytic property. Sci. Rep. 2013, 3, 2948. [Google Scholar] [CrossRef] [PubMed]
- Zeng, X.; Wang, Q.; Wang, H.; Yang, Y. Catalytically active silver nanoparticles loaded in the lumen of halloysite nanotubes via electrostatic interactions. J. Mater. Sci. 2017, 52, 8391–8400. [Google Scholar] [CrossRef]
- Wang, P.; Lv, A.; Hu, J.; Xu, J.A.; Lu, G. In situ synthesis of SAPO-34 grown onto fully calcined kaolin microspheres and its catalytic properties for the MTO reaction. Ind. Eng. Chem. Res. 2011, 50, 12741–12749. [Google Scholar] [CrossRef]
- Riela, S.; Massaro, M.; Colletti, C.G.; Lazzara, G.; Milioto, S.; Noto, R. Halloysite nanotubes as support for metal-based catalysts. J. Mater. Chem. A 2017, 5, 13276–13293. [Google Scholar]
- Leporatti, S. Halloysite clay nanotubes as nano-bazookas for drug delivery. Polym. Int. 2017, 66, 1111–1118. [Google Scholar] [CrossRef]
- Shu, Z.; Zhang, Y.; Yang, Q.; Yang, H. Halloysite nanotubes supported Ag and ZnO nanoparticles with synergistically enhanced antibacterial activity. Nanoscale Res. Lett. 2017, 12, 135. [Google Scholar] [CrossRef] [PubMed]
- Li, X.; Yang, Q.; Ouyang, J.; Yang, H.; Chang, S. Chitosan modified halloysite nanotubes as emerging porous microspheres for drug carrier. Appl. Clay Sci. 2016, 126, 306–312. [Google Scholar] [CrossRef]
- Wang, X.; Weiner, M.L. Hydrogen Storage Apparatus Comprised of Halloysite. U.S. Patent 7,425,232 B2, 16 September 2008. [Google Scholar]
- Jin, J.; Zhang, Y.; Ouyang, J.; Yang, H. Halloysite nanotubes as hydrogen storage materials. Phys. Chem. Miner. 2014, 41, 323–331. [Google Scholar] [CrossRef]
- Jin, J.; Fu, L.; Yang, H.; Ouyang, J. Carbon hybridized halloysite nanotubes for high-performance hydrogen storage capacities. Sci. Rep. 2015, 5, 12429. [Google Scholar] [CrossRef] [PubMed]
- Makaremi, M.; Pasbakhsh, P.; Cavallaro, G.; Lazzara, G.; Aw, Y.K.; Lee, S.M.; Milioto, S. Effect of morphology and size of halloysite nanotubes on functional pectin bionanocomposites for food packaging applications. ACS Appl. Mater. Interfaces 2017, 9, 17476–17488. [Google Scholar] [CrossRef] [PubMed]
- Hou, K.; Zeng, Y.; Zhou, C.; Chen, J.; Wen, X.; Xu, S.; Cheng, J.; Lin, Y.; Pi, P. Durable underwater superoleophobic PDDA/halloysite nanotubes decorated stainless steel mesh for efficient oil-water separation. Appl. Surf. Sci. 2017, 416, 344–352. [Google Scholar] [CrossRef]
- Niu, M.; Yang, H.; Zhang, X.; Wang, Y.; Tang, A. Amine-impregnated mesoporous silica nanotube as an emerging nanocomposite for CO2 capture. ACS Appl. Mater. Interfaces 2016, 8, 17312–17320. [Google Scholar] [CrossRef] [PubMed]
- Ganganboina, A.B.; Chowdhury, A.D.; Doong, R. New avenue for appendage of graphene quantum dots on halloysite nanotubes as anode materials for high performance supercapacitors. ACS Sustain. Chem. Eng. 2017, 5, 4930–4940. [Google Scholar] [CrossRef]
- Zhang, H. Selective modification of inner surface of halloysite nanotubes: A review. Nanotechnol. Rev. 2017, 6, 573–581. [Google Scholar] [CrossRef]
- Zahidah, K.A.; Kakooei, S.; Ismail, M.C.; Raja, P.B. Halloysite nanotubes as nanocontainer for smart coating application: A review. Prog. Org. Coat. 2017, 111, 175–185. [Google Scholar] [CrossRef]
- Yuan, P.; Tan, D.; Annabi-Bergaya, F. Properties and applications of halloysite nanotubes: Recent research advances and future prospects. Appl. Clay Sci. 2015, 112–113, 75–93. [Google Scholar] [CrossRef]
- Burzo, E. Halloysite and Pyrosmalite Groups of Silicates; Springer: Heidelberg, Germany, 2009; pp. 235–352. [Google Scholar]
- Schroeder, P.A. Ti-bearing phases in the huber formation, an east georgia kaolin deposit. Clays Clay Miner. 2000, 48, 151–158. [Google Scholar] [CrossRef]
- Hu, P.; Yang, H. Insight into the physicochemical aspects of kaolins with different morphologies. Appl. Clay Sci. 2013, 74, 58–65. [Google Scholar] [CrossRef]
- Abdullayev, E.; Lvov, Y. Halloysite Tubule Nanoreactors for Industrial and Agricultural Applications; Apple Academic Press: New York, NY, USA, 2015. [Google Scholar]
- Levis, S.R.; Deasy, P.B. Characterisation of halloysite for use as a microtubular drug delivery system. Int. J. Pharm. 2002, 243, 125–134. [Google Scholar] [CrossRef]
- Alberola, J.A.; Mondragón, R.; Juliá, J.E.; Hernández, L.; Cabedo, L. Characterization of halloysite-water nanofluid for heat transfer applications. Appl. Clay Sci. 2014, 99, 54–61. [Google Scholar] [CrossRef]
- Shahriari, F.; Higashi, T.; Tamura, K. Effects of clay addition on soil protease activities in andosols in the presence of cadmium. Soil Sci. Plant Nutr. 2010, 56, 560–569. [Google Scholar] [CrossRef]
- Takahashi, T.; Dahlgren, R.A.; Theng, B.K.G.; Whitton, J.S.; Soma, M. Potassium-selective, halloysite-rich soils formed in volcanic materials from Northern California. Soil Sci. Soc. Am. J. 2001, 65, 516–526. [Google Scholar] [CrossRef]
- Bailey, S.W. Halloysite—A critical assessment. Sci. Geol. Mem. 1990, 86, 89–98. [Google Scholar]
- Newman, R.H.; Childs, C.W.; Churchman, G.J. Aluminium coordination and structural disorder in halloysite and kaolinite by 27Al NMR spectroscopy. Clay Miner. 1994, 29, 305–312. [Google Scholar] [CrossRef]
- Cheng, H.; Frost, R.L.; Yang, J.; Liu, Q.; He, J. Infrared and infrared emission spectroscopic study of typical chinese kaolinite and halloysite. Spectrochim. Acta Part A 2010, 77, 1014–1020. [Google Scholar] [CrossRef] [PubMed] [Green Version]
- Ouyang, J.; Guo, B.; Fu, L.; Yang, H.; Hu, Y.; Tang, A.; Long, H.; Jin, Y.; Chen, J.; Jiang, J. Radical guided selective loading of silver nanoparticles at interior lumen and out surface of halloysite nanotubes. Mater. Des. 2016, 110, 169–178. [Google Scholar] [CrossRef]
- Jia, Z.; Luo, Y.; Guo, B.; Yang, B.; Du, M.; Jia, D. Reinforcing and flame-retardant effects of halloysite nanotubes on LLDPE. Polym. Plast. Technol. Eng. 2009, 48, 607–613. [Google Scholar] [CrossRef]
- Adamo, P.; Violante, P.; Wilson, M.J. Tubular and spheroidal halloysite in pyroclastic deposits in the area of the Roccamonfina volcano (Southern Italy). Geoderma 2001, 99, 295–316. [Google Scholar] [CrossRef]
- Wayne, R.P.; Barnes, I.; Biggs, P.; Burrows, J.P.; Canosa-Mas, C.E.; Hjorth, J.; Bras, G.L.; Moortgat, G.K.; Perner, D.; Poulet, G. The nitrate radical: Physics, chemistry, and the atmosphere. Atmos. Environ. 1991, 25, 1–203. [Google Scholar] [CrossRef]
- Gates, W.P.; Kloprogge, J.T.; Madejová, J.; Bergaya, F. Infrared and Raman Spectroscopies of Clay Minerals; Elsevier Ltd.: Amsterdam, The Netherlands, 2017. [Google Scholar]
- Sing, K.S.W. Reporting physisorption data for gas/solid systems with special reference to the determination of surface area and porosity (recommendations 1984). Pure Appl. Chem. 1985, 57, 603–619. [Google Scholar] [CrossRef]
- Yuan, P.; Tan, D.; Annabi-Bergaya, F.; Yan, W.; Fan, M.; Liu, D.; He, H. Changes in structure, morphology, porosity, and surface activity of mesoporous halloysite nanotubes under heating. Clays Clay Miner. 2012, 60, 561–573. [Google Scholar] [CrossRef]
- Kohyama, N.; Fukushima, K.; Fukami, A. Observation of the hydrated form of tubular halloysite by an electron microscope equipped with an environmental cell. Clays Clay Miner. 1978, 26, 25–40. [Google Scholar] [CrossRef]
- Ouyang, J.; Zhou, Z.; Zhang, Y.; Yang, H. High morphological stability and structural transition of halloysite (Hunan, China) in heat treatment. Appl. Clay Sci. 2014, 101, 16–22. [Google Scholar] [CrossRef]
- Zhong, X.H.; Liu, Y.; Xu, T.; Liu, W.Y. Studies on the thermal behavior and decomposition mechanism of dickite-potassium acetate complexes. J. Therm. Anal. Calorim. 2017, 129, 1095–1102. [Google Scholar] [CrossRef]
- Redaoui, D.; Sahnoune, F.; Heraiz, M.; Raghdi, A. Mechanism and kinetic parameters of the thermal decomposition of gibbsite Al(OH)3 by thermogravimetric analysis. Acta Phys. Pol. A 2017, 131, 562–565. [Google Scholar] [CrossRef]
- Ndayiragije, S.; Delvaux, B. Coexistence of allophane, gibbsite, kaolinite and hydroxy-Al-interlayered 2:1 clay minerals in a perudic Andosol. Geoderma 2003, 117, 203–214. [Google Scholar] [CrossRef]
Figure 1.
(a) XRD patterns of powdered samples of halloysite minerals; (b) Zeta potential measurements for different halloysite samples.
Figure 1.
(a) XRD patterns of powdered samples of halloysite minerals; (b) Zeta potential measurements for different halloysite samples.

Figure 2.
FTIR spectra of different halloysite minerals in the range 3000–4000 cm−1 and 400–1200 cm−1.
Figure 2.
FTIR spectra of different halloysite minerals in the range 3000–4000 cm−1 and 400–1200 cm−1.
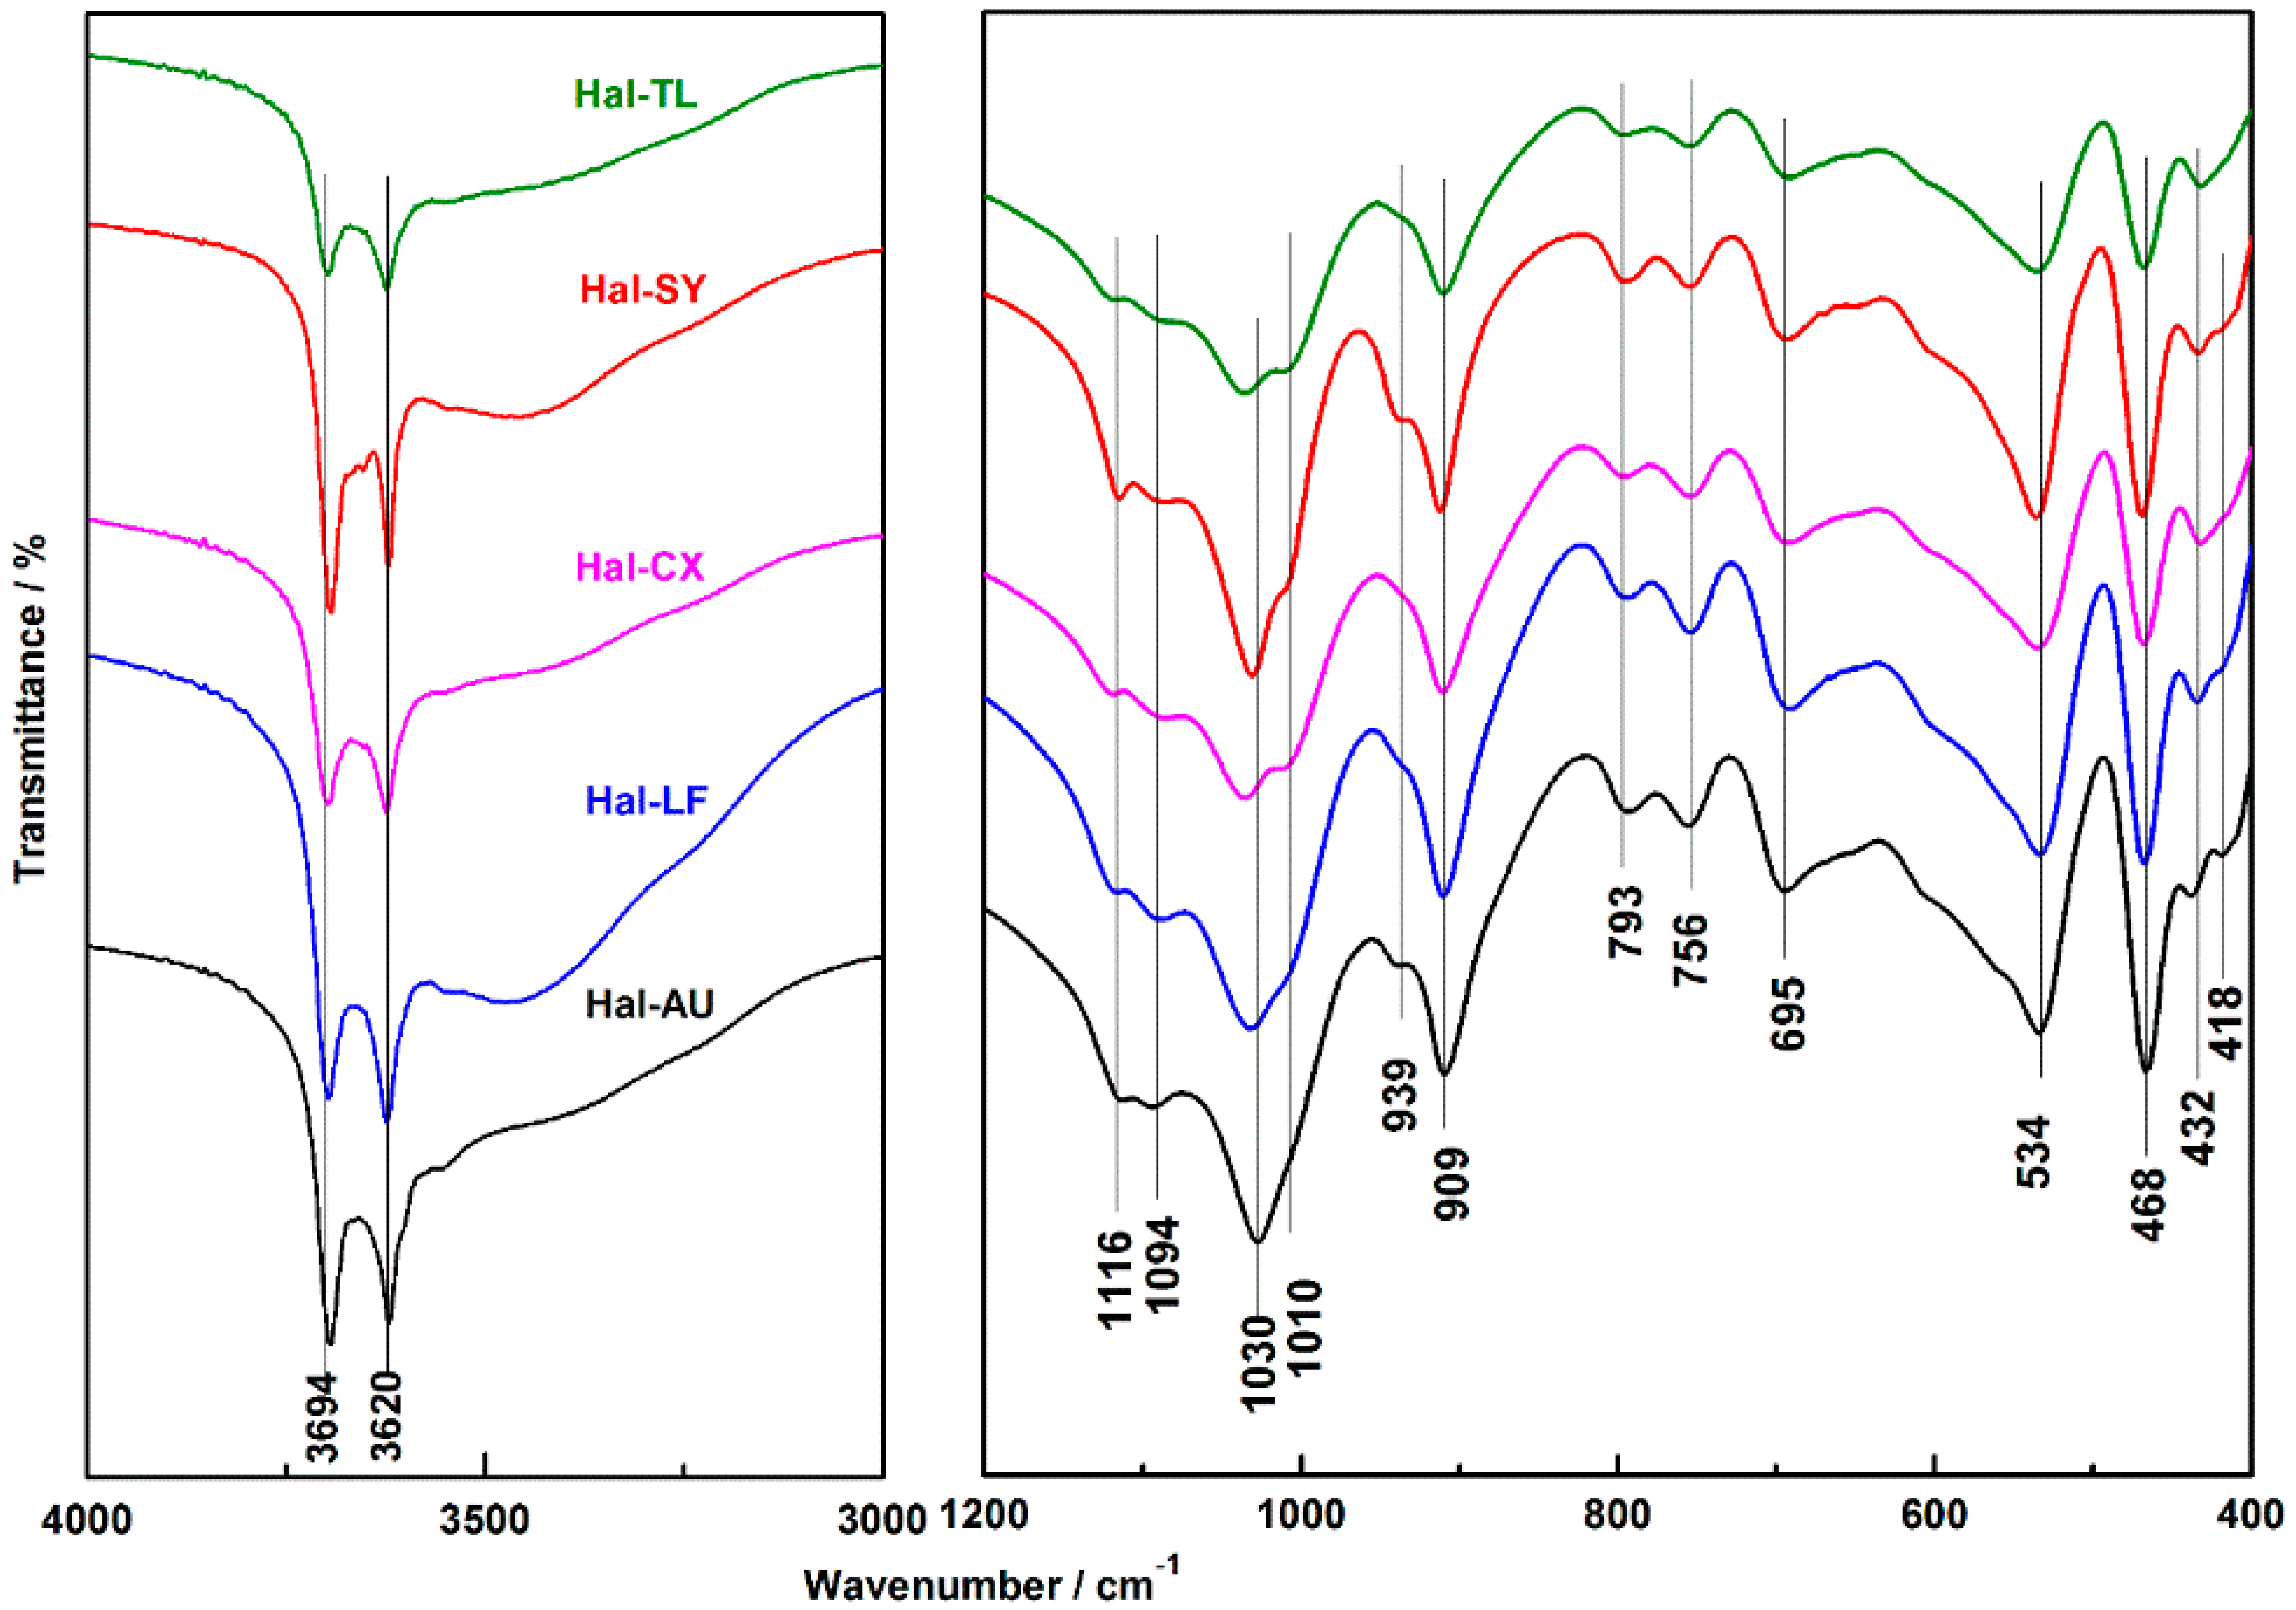
Figure 3.
SEM and TEM images of (a,b) Hal-TL, (c,d) Hal-SY (e,f) Hal-AU (g,h) Hal-LF (i,j) Hal-CX.

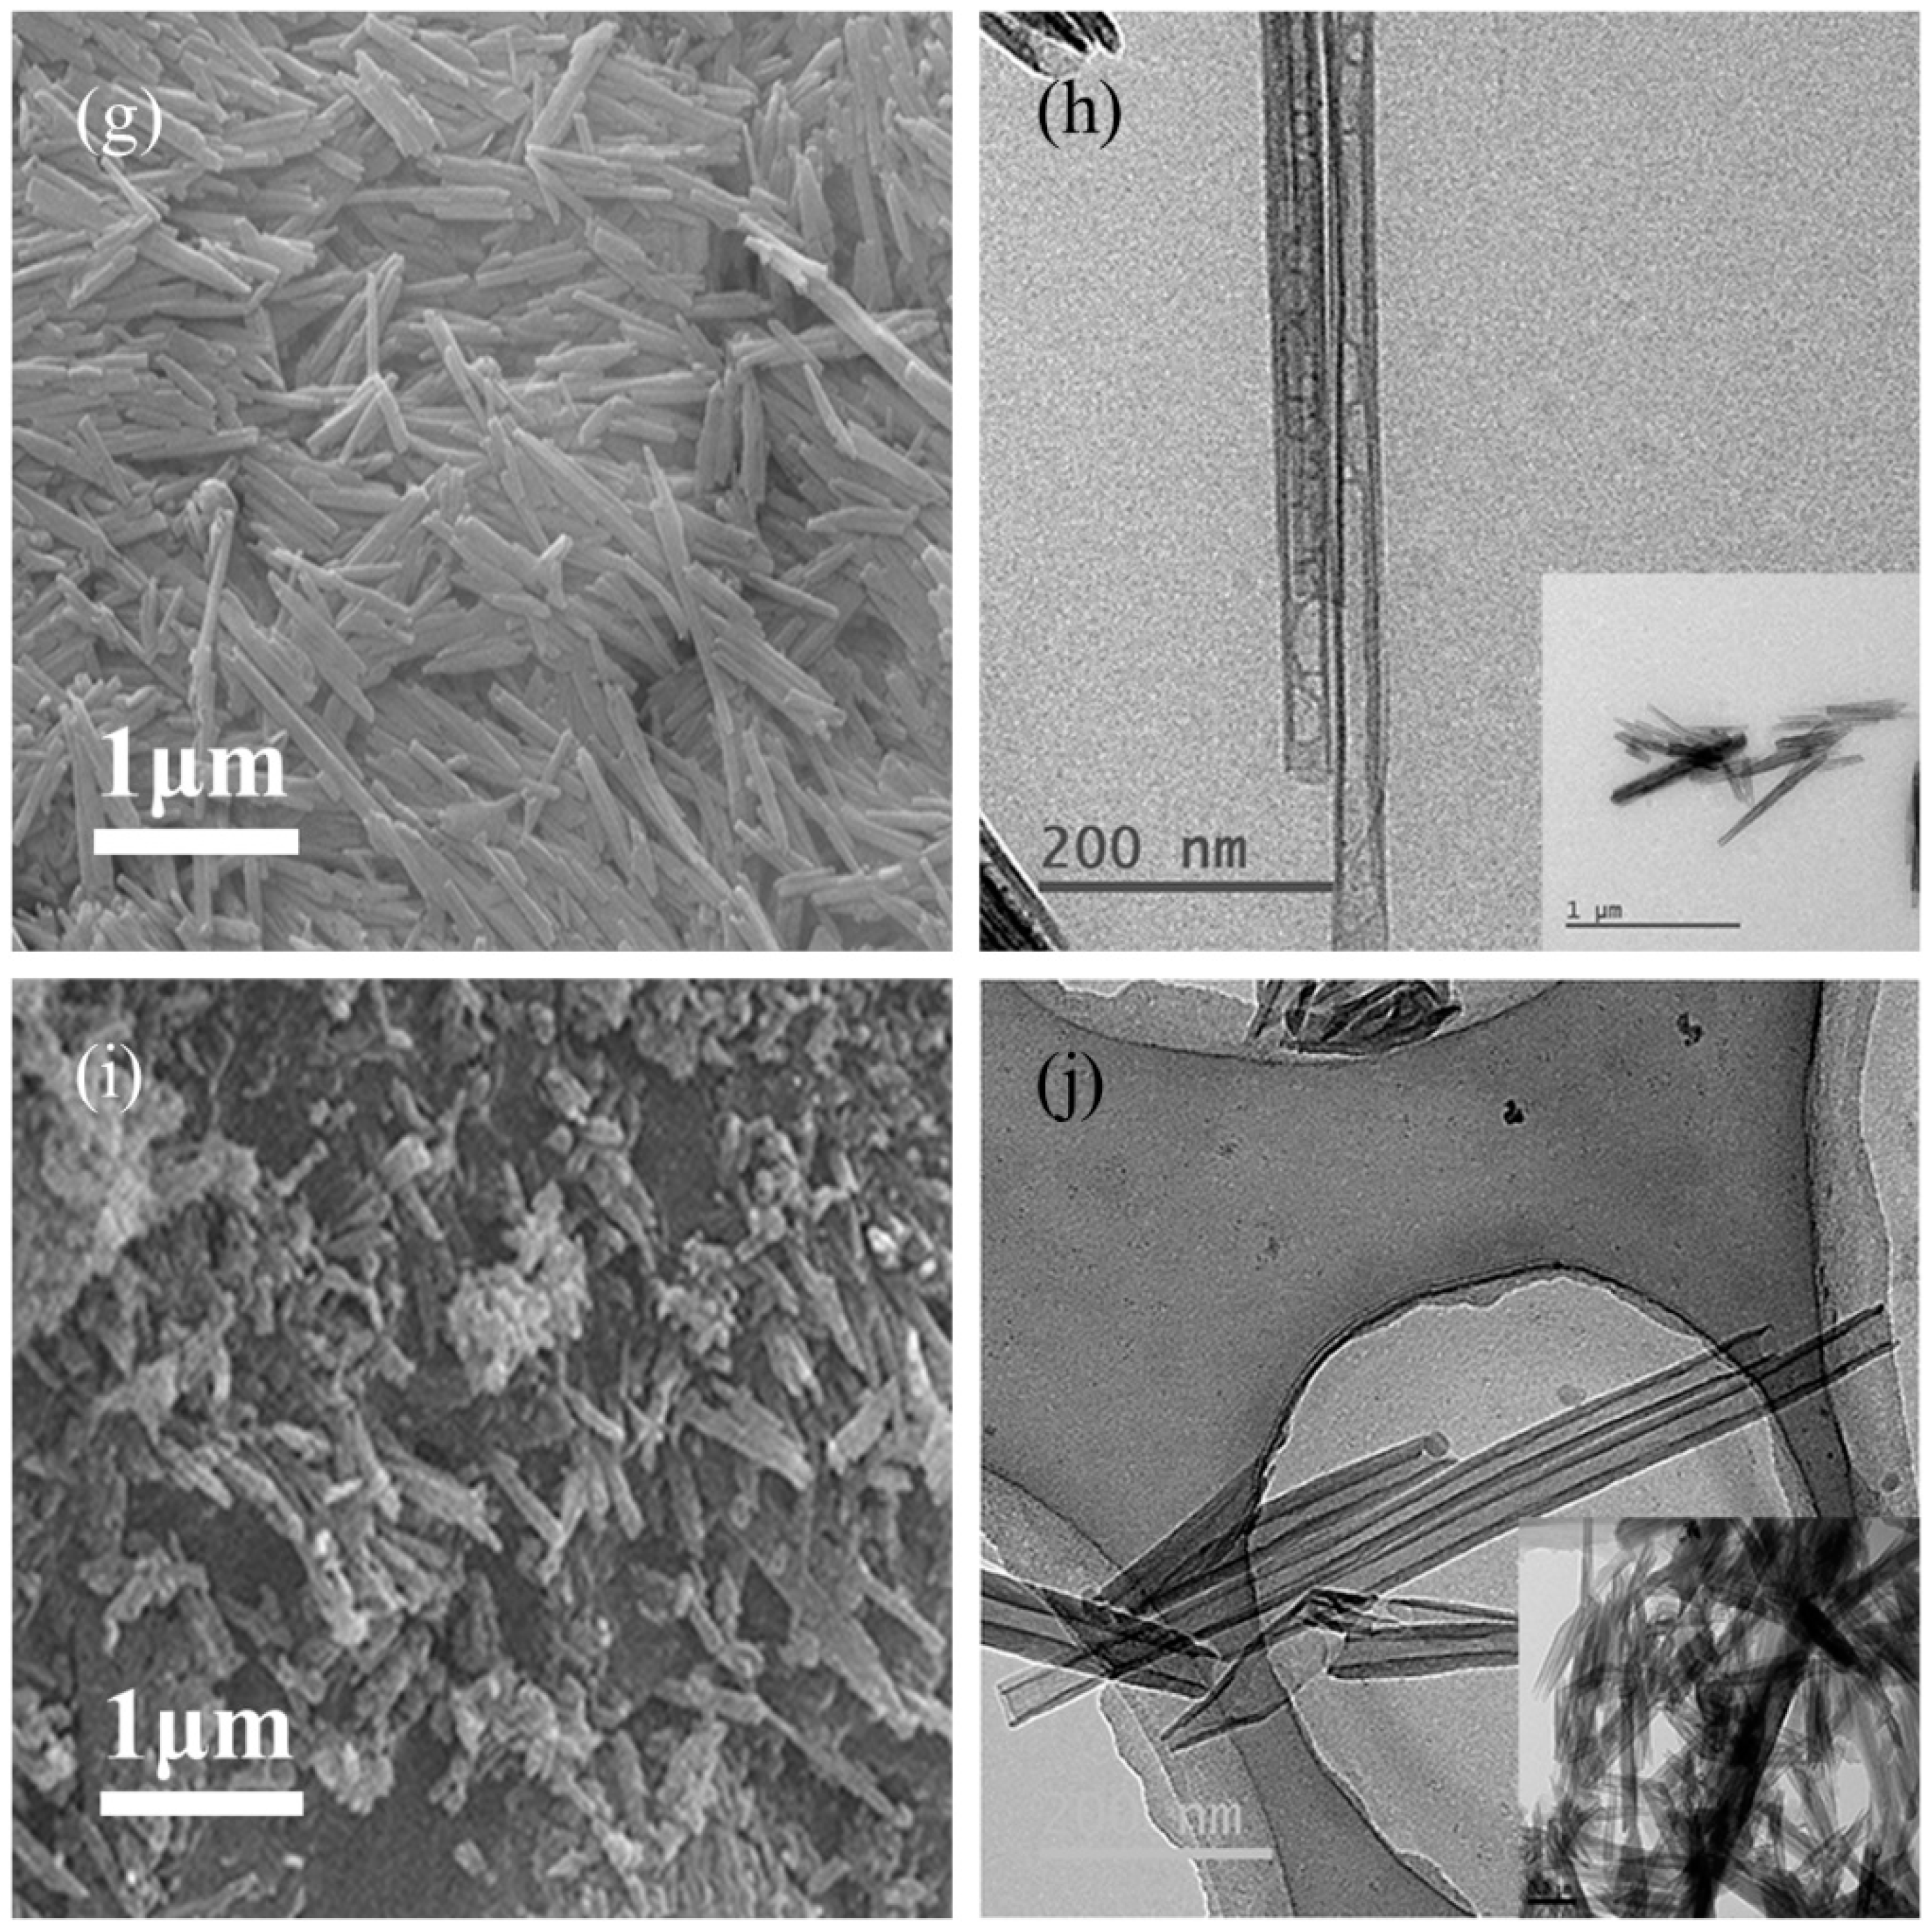
Figure 4.
(a) N2 adsorption-desorption isotherms and (b) pore size distributions of the Hal samples.
Figure 4.
(a) N2 adsorption-desorption isotherms and (b) pore size distributions of the Hal samples.

Figure 5.
TG and DSC results for halloysite samples (a) Hal-TL; (b) Hal-SY; (c) Hal-AU; (d) Hal-LF and (e) Hal-CX; the table in (f) is the detailed parameters of each stages of thermal behaviors.
Figure 5.
TG and DSC results for halloysite samples (a) Hal-TL; (b) Hal-SY; (c) Hal-AU; (d) Hal-LF and (e) Hal-CX; the table in (f) is the detailed parameters of each stages of thermal behaviors.

Table 1.
The chemical composition and CEC values of halloysites in typical regions (%).
| Composition (%) | SiO2 | Al2O3 | Fe2O3 | MgO | CaO | K2O | Na2O | TiO2 | P2O5 | SO3 | Cl | CEC (cmol/kg) |
|---|---|---|---|---|---|---|---|---|---|---|---|---|
| Hal-SY | 41.90 | 37.67 | 0.32 | 0.06 | 1.83 | 0.18 | 0 | 0.02 | 2.60 | 1.33 | 0.01 | 40 |
| Hal-TL | 44.98 | 36.28 | 0.10 | 0.04 | 0.04 | 0.24 | 0 | 0.03 | 0.12 | 0.25 | 0.03 | 20 |
| Hal-AU | 45.03 | 35.78 | 1.01 | 0.03 | 0.01 | 0.23 | 0.07 | 0.05 | 0 | 0.16 | 0.17 | 8 |
| Hal-LF | 53.15 | 44.66 | 0.19 | 0.13 | 0.15 | 0.24 | 0.09 | 0 | 0 | 1.29 | 0.06 | 24 |
| Hal-CX | 44.33 | 37.81 | 0.20 | 0 | 0.12 | 0.02 | 0 | 0 | 0.05 | 0.30 | 0.05 | 32 |
Table 2.
Assignments of FTIR vibrations recorded for halloysite samples.
| Suggested Assignments | Wavenumbers (cm−1) | ||||
|---|---|---|---|---|---|
| Hal-AU | Hal-SY | Hal-LF | Hal-CX | Hal-TL | |
| stretching of perpendicular surface –O–H | 3694 | 3694 | 3697 | 3697 | 3697 |
| –O–H stretching of inner hydroxyls | 3620 | 3620 | 3623 | 3623 | 3623 |
| the bending of –OH in adsorbed water | 1642 | 1649 | 1642 | 1650 | 1650 |
| (Broad band) Si–O stretching | 1027 | 1030 | 1032 | 1035 | 1035 |
| –O–H deformation of inner hydroxyls | 910 | 913 | 910 | 911 | 910 |
| Symmetric stretching of Si–O | 793 | 796 | 794 | 796 | 796 |
| the perpendicular Si–O stretching | 756 | 755 | 754 | 754 | 754 |
| the perpendicular Si–O stretching | 694 | 693 | 691 | 692 | 692 |
| the bending deformation of Al–O–Si | 534 | 536 | 534 | 535 | 535 |
| the bending deformation of Si–O–Si | 466 | 469 | 468 | 468 | 468 |
| Stretching of [SiO4] tetrahedron | 434 | 433 | 432 | 432 | 432 |
| Deformation of [SiO4] tetrahedron | 418 | 416 | 417 | - | - |
Table 3.
Morphological characteristics of halloysites in this study.
| Halloysite | Dominant Particle Shapes | Length (nm) | Inner Diam. (nm) | Outer Diam. (nm) | Pore Shape | Length/Diameter Ratio |
|---|---|---|---|---|---|---|
| TL | Short and stubby, tubular and plate-like | 200~1000 | 10~25 | 40~90 | Cylindrical | 6.79 |
| SY | Tubular and plate-like | 300~3000 | 20~150 | 50~300 | Prismatic | 8.13 |
| AU | Long and thin tubular | 400~1600 | 10~25 | 40~90 | Cylindrical | 15.31 |
| LF | Long and thin tubular | 300~1300 | 10~30 | 30~80 | Cylindrical | 10.76 |
| CX | Long tubular | 500~1500 | 10~30 | 40~60 | Cylindrical | 9.63 |
Table 4.
BET-specific surface area, pore volume and BJH adsorption average pore size of Hal samples.
Table 4.
BET-specific surface area, pore volume and BJH adsorption average pore size of Hal samples.
| Samples | Surface Area (m²/g) | Pore Volume (cm³/g) | Average Pore Size (nm) |
|---|---|---|---|
| Hal-SY | 27.0 | 0.2 | 22.0 |
| Hal-TL | 58.2 | 0.2 | 14.7 |
| Hal-AU | 48.7 | 0.2 | 16.4 |
| Hal-LF | 55.4 | 0.2 | 17.7 |
| Hal-CX | 58.7 | 0.3 | 16.5 |
© 2018 by the authors. Licensee MDPI, Basel, Switzerland. This article is an open access article distributed under the terms and conditions of the Creative Commons Attribution (CC BY) license (http://creativecommons.org/licenses/by/4.0/).
Share and Cite
MDPI and ACS Style
Ouyang, J.; Mu, D.; Zhang, Y.; Yang, H. Mineralogy and Physico-Chemical Data of Two Newly Discovered Halloysite in China and Their Contrasts with Some Typical Minerals. Minerals 2018, 8, 108. https://doi.org/10.3390/min8030108
AMA Style
Ouyang J, Mu D, Zhang Y, Yang H. Mineralogy and Physico-Chemical Data of Two Newly Discovered Halloysite in China and Their Contrasts with Some Typical Minerals. Minerals. 2018; 8(3):108. https://doi.org/10.3390/min8030108
Chicago/Turabian StyleOuyang, Jing, Dawei Mu, Yi Zhang, and Huaming Yang. 2018. "Mineralogy and Physico-Chemical Data of Two Newly Discovered Halloysite in China and Their Contrasts with Some Typical Minerals" Minerals 8, no. 3: 108. https://doi.org/10.3390/min8030108
Note that from the first issue of 2016, this journal uses article numbers instead of page numbers. See further details here.