Article

Near-Field Optical Examination of Potassium n-Butyl Xanthate/Chalcopyrite Flotation Products

1
Helmholtz-Zentrum Dresden-Rossendorf, Helmholtz Institute Freiberg for Resource Technology, Chemnitzer Str. 40, 09599 Freiberg, Germany
2
Institute of Applied Physics, University of Technology Dresden, 01062 Dresden, Germany
3
Institute of Radiation Physics, Helmholtz-Zentrum Dresden-Rossendorf, Bautzner Landstraße 400, 01328 Dresden, Germany
4
Institute of Ion Beam Physics and Materials Research, Helmholtz-Zentrum Dresden-Rossendorf, Bautzner Landstraße 400, 01328 Dresden, Germany
5
Institute of Resource Ecology, Helmholtz-Zentrum Dresden-Rossendorf, Bautzner Landstraße 400, 01328 Dresden, Germany
6
Center for Advancing Electronics Dresden (CFAED), University of Technology Dresden, 01062 Dresden, Germany
*
Author to whom correspondence should be addressed.
Minerals 2018, 8(3), 118; https://doi.org/10.3390/min8030118
Submission received: 9 February 2018 / Revised: 14 March 2018 / Accepted: 15 March 2018 / Published: 19 March 2018
(This article belongs to the Special Issue Applications of Atomic Force Microscopy in Mineral Flotation)

Abstract

:
The present study introduces scattering-type scanning near-field infrared optical nanospectroscopy (s-SNIM) as a valuable and well-suited tool for spectrally fingerprinting n-butyl xanthate (KBX) molecules adsorbed to chalcopyrite (CCP) sample surfaces. The collector KBX is well known to float CCP and is used in beneficiation. We thus identified KBX reaction products both by IR optical far- and near-field techniques, applying attenuated total internal reflection Fourier-transform infrared spectroscopy (ATR FT-IR) in comparison to s-SNIM, respectively. The major KBX band around 880 cm−1 was probed in s-SNIM using both the tunable free-electron laser FELBE at the Helmholtz-Zentrum Dresden-Rossendorf facility, Germany, and table-top CO2 laser illumination. We then were able to monitor the KBX agglomeration in patches <500 nm in diameter at the CCP surface, as well as nanospectroscopically identify the presence of KBX reaction products down to the 10−4 M concentration.

1. Introduction

Flotation is known as one of the most frequently used technologies in the mineral processing industries, annually separating billions of tons of valuable minerals from worthless material. Many primary resources of copper, zinc, lead, gold, platinum group metals (PGM), graphite, etc. may be recovered by this process. The technology is based on the control of the wettability of mineral surfaces using the selective adsorption of amphiphilic molecules. Even though the process has been established for more than a century, the microscopic understanding of flotation still stands in its infancy; little is known, for instance, about the spatial coverage and adsorption of the mediating amphiphilic molecules, e.g., when varying the local chemical environment or the surface potential, influencing the recovery of valuables and the separation efficiency of the flotation process. Also, the adsorption kinetics is far from being understood. Hence, contributions to an in-depth fundamental understanding by applying modern analytical techniques are warranted. Here, we introduced optical near-field techniques as a valuable methodology to collect both spectroscopic and microscopic data from such sample systems, down to the nanometer scale. We used potassium n-butyl xanthate (C4H9OCSSK: KBX) adsorbed to chalcopyrite (CCP) as the model system, and tracked the relevant optical fingerprint regions for the amphiphilic KBX reaction products by both the infrared (IR) optical far and near field using attenuated total reflection Fourier-transform infrared spectroscopy (ATR FT-IR) and scattering-type scanning near-field infrared optical nanospectroscopy (s-SNIM), respectively.
Xanthates, e.g., KBX, are organic collector molecules that are frequently used for the flotation of sulfide minerals such as CCP, sphalerite, and galena. The chemical and physical nature of the sulfide-mineral/xanthate interface and the specific xanthate-to-mineral interactions have been the subject of numerous investigations by means of FT-IR [1,2,3,4,5], X-ray photoelectron spectroscopy (XPS) [6,7,8,9,10,11,12], X-ray absorption near edge fine structure (XANES) [13,14], and secondary ion mass spectrometry (SIMS) [15,16,17,18,19,20]. On the nanometer length scale, Beattie and co-workers investigated the interactions of various polymeric surfactants with minerals (including CCP) [21,22,23,24] manifesting the paramount role of sub-micrometer domains generated by the adsorbates and attachment of the bubble-particle systems using in situ atomic-force-microscopy (AFM) imaging combined with other techniques. Additionally, Zhang and Zhang [25] were able to elucidate the adsorption conditions of several xanthate collector molecules onto CCP surfaces by using in situ AFM operated in a liquid cell [26].
The latter nanoscopic works report on the non-continuous adsorption of amphiphilic molecules to the CCP substrate, agglomerating in patches of sub-micrometer size that obviously are not resolved by standard optical microscopy. This constitutes the major driving force for the present study, i.e., by combining optical nano-spectroscopy in the mid-IR wavelength range with the high lateral resolution of s-SNIM. To the best of our knowledge, no information is available on any optical nanoscopic ex situ investigation on the KBX/CCP interface that aims to visualize the distribution of the collector reaction products on dried CCP substrates. Moreover, it is still far from being understood how the adsorption conditions of the xanthate surfactants affect the floatability of sulfide minerals and the ability of such particles to attach to air bubbles.
Scattering scanning near-field infrared optical nanospectroscopy (s-SNIM) combines nanoscopic atomic force microscopy (AFM) with IR spectroscopy and, hence, may be applied in order to obtain high-resolution, spectrally-resolved images in the fingerprint region of these molecules [27,28,29]. In particular, s-SNIM was used as a versatile tool to image the nano-optical contrast with a wavelength-independent resolution of a few tens of nanometers [30] and over a broad frequency range from near-infrared (NIR) down to a frequency of 1 THz [31,32,33]. s-SNIM has witnessed a huge boost over the last 15 years, investigating image contrasts, e.g., of phonon/polariton-modes [34,35], IR optical anisotropy [36], and (buried) charge carrier densities in semiconductors [37,38]; quantifying stress and strain [39]; or inspecting vibrational modes in molecules [40]. All of these examples clearly illustrate the manifold benefits of this nanoscopic IR technique.
In the present work, we investigated the reaction products of KBX molecules adsorbed to natural CCP sample surfaces. Our primary goal was to visualize the spatial distribution of the reaction products on the mineral surface and target their fingerprint resonances in the surface-bound state. Therefore, we followed the concept of our previous works when investigating organic porphyrin monolayers on a metallic surface by optical near-field microscopy [41]. In the present work, we addressed the fingerprint region of KBX by combining s-SNIM with mid-IR laser sources, i.e., a table-top CO2 laser and the free-electron laser (FEL) FELBE at the Helmholtz-Zentrum Dresden-Rossendorf (HZDR) facility, Germany, that offers a precisely tunable, narrow-band laser beam with an extremely broad tunability range from 40 to 2000 cm−1 (5 to 250 μm) [32,42,43]. Moreover, s-SNIM was also applied to visualize the lateral distribution of KBX reaction products adsorbed to the CCP surface, followed by scanning the sample relative to the “optical” tip at a fixed IR wavelength. Note that all samples were also inspected by ATR FT-IR spectroscopy prior to s-SNIM inspection.

2. Materials and Methods

2.1. Materials and Sample Preparation

The raw materials used in this study include natural chalcopyrite (CCP) minerals provided by the Henderson Mine, South Africa, and technical-grade K-butyl-xanthate (KBX, 95% purity) purchased from J&K Scientific Ltd., Beijing, China. For ATR FT-IR spectroscopic investigations, all samples were prepared using the following protocol: 100 mg of CCP powder was added to a 10-mL 10−2 M solution of aqueous KBX (pH = 9). This suspension then was stirred for 10 min with the pH kept constant by adding potassium hydroxide and hydrochloric acid. Note that a pH of 9 was chosen since many similar industrial processes are carried using such a pH. After 10 min, the particles of the reaction product (CCPX-2a) were filtered, thoroughly washed off the sample surface with water, and then dried overnight at 40 °C. The same procedure was applied to primary KBX solutions of 10−3 M and 10−4 M concentrations with the goal to synthesize CCPX-3a and CCCPX-4a samples, respectively. Note that industrial processes generally use KBX concentrations of 10−3 M and 10−4 M or lower, due to economic and environmental aspects.
Samples used for our s-SNIM investigations were prepared analogously. Nevertheless, since a flat sample topography is preferred in s-SNIM, a CCP sample several cm3 large was embedded into an epoxy polymer resin until it was completely hardened. The sample was then cut into two pieces and mechanically polished to a <5 nm RMS (root mean squared) sample surface roughness prior to KBX adsorption. The overall surface area of the CCP was several cm2 and several cm3 in volume. During polishing, the resin was already completely hardened, making it much less reactive. With respect to the volume of the bulk CCP, it appears unlikely that the resin could reach the center area of the rock during embedding where the AFM measurements were carried out. Previous studies with a similar sample preparation did not reveal any influence of the epoxy [44,45]. However, a contamination of the CCP surface with the hardened epoxy polymer during embedding and polishing cannot be completely ruled out. Subsequently, the substrates were processed using the same protocol as described above for the three KBX concentrations, resulting in samples CCPX-2b, CCPX-3b, and CCPX-4b for KBX concentrations of 10−2 M, 10−3 M, and 10−4 M, respectively.

2.2. ATR FT-IR Measurements

ATR FT-IR measurements (see Figure 1) were carried out with a Bruker Vertex 80/v spectrometer (Billerica, MA, USA) using an ATR device with a diamond crystal with nine internal reflections on the upper surface and an angle of incidence of 45° (DURA SamplIR II, Smiths Inc., Edgewood, MD, USA). Transmission spectra were recorded with a mercury cadmium telluride detector over the spectral range of 650–1300 cm−1 with a spectral resolution of 4 cm−1. For each measurement, 256 individual spectra were averaged. For these IR measurements, samples of CCP, CCPX-2a, CCPX-3a, and CCPX-4a, were dispersed in distilled water at a concentration of 2.5 g/L. As a reference, the bare KBX material was dissolved in water at the same concentrations. Then, aliquots of 2.5 µL from each of these dispersions/solutions were dried on the surface of the ATR crystal in a gentle nitrogen stream.

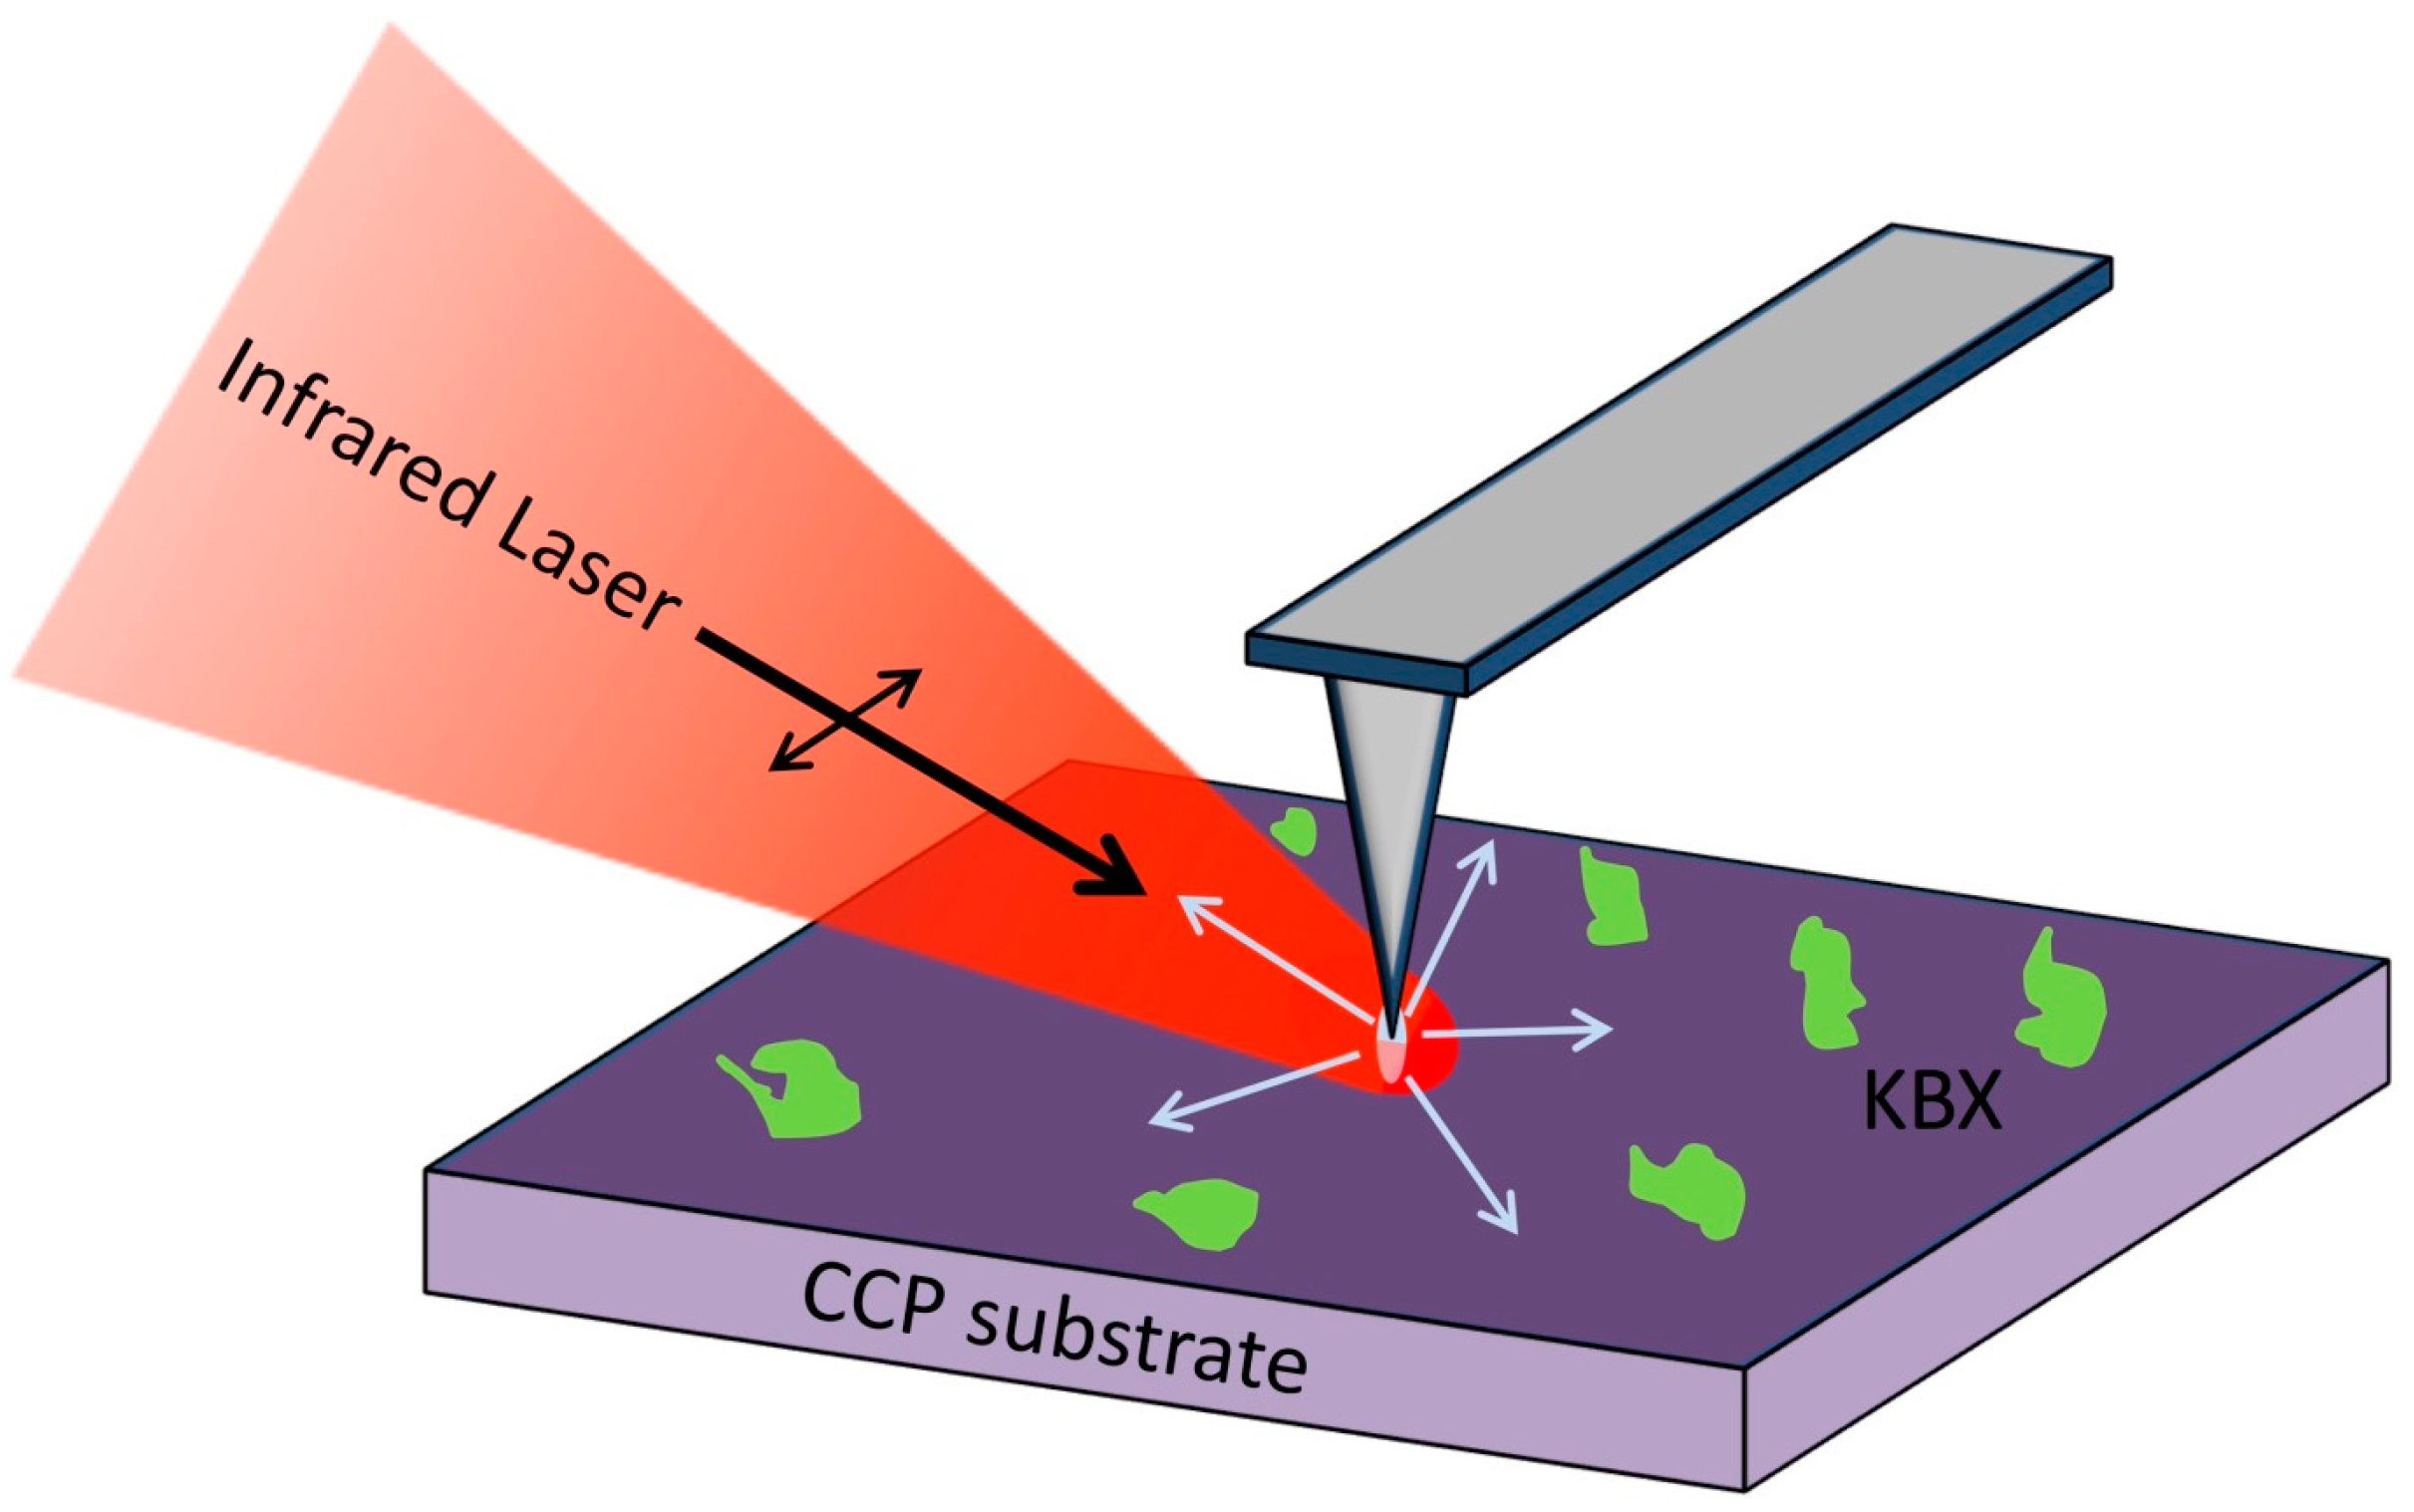
2.3. Near-Field Microscopy Setup

The s-SNIM microscope is based on a home-built AFM that is operated in non-contact mode, with the AFM tip oscillating a few nanometers above the sample surface (see Figure 2). In s-SNIM, the impinging mid-infrared laser light (either the FEL or the CO2 laser) induces an optical dipole into the metal-coated tip that confines the enhanced optical near field under the tip apex to a probing volume of a few (10 nm)3 only. The near-field coupled tip-sample system scatters back to the far-field detector carrying the optical signature of the probing volume. Note that the total scattering efficiency in s-SNIM strongly depends on both the sample material under investigation and the impinging IR laser wavelengths. Hence, using tunable IR light sources as offered by the FEL allows for exploring the whole fingerprint region of any such sample, as well as dramatically enhances the image contrast at material resonances. A lateral resolution of a few tens of nanometers thus is achievable by s-SNIM with monolayer sensitivity [46].
In the present work, the reaction product of KBX molecules in different concentrations and CCP (samples CCPX-2b, CCPX-3b, and CCPX-4b) were studied in the mid-IR wavelength regime from 740 to 1260 cm−1, in accordance with our ATR FT-IR measurements. The study of CCPX-2b was performed with the FEL, revealing maximum sensitivity around 880 cm−1. Moreover, the samples prepared with a lower KBX concentration (i.e., CCPX-3b and CCPX-4b) were studied as well, using the table-top CO2 laser at the same maximum spectral position around 880 cm−1 as was employed by the FEL for CCPX-2b.
s-SNIM imaging was performed by raster scanning the sample under the tip over a typical 10 µm × 10 µm surface area with a pixel resolution of ~80 nm (128 × 128 pixels per frame). In order to suppress laser noise, the image acquisition time was adjusted to line-scan times of 6.3 s and 5 s when using the FEL and CO2 laser, respectively, with the pixel averaging time was then set to 130 ms and 50 ms. Note that true near-field contrast can be retrieved in s-SNIM when demodulating (and plotting) higher harmonics of the evanescent near-field signal [27,42,47]. Unwanted background scattering that reduces the signal-to-noise ration (SNR) can be further reduced when using a cross-polarized illumination/detection scheme [48]. In the work reported here, we consistently used s-polarized incident light with p-polarized detection and plotted the second-harmonic near-field information.

3. Results

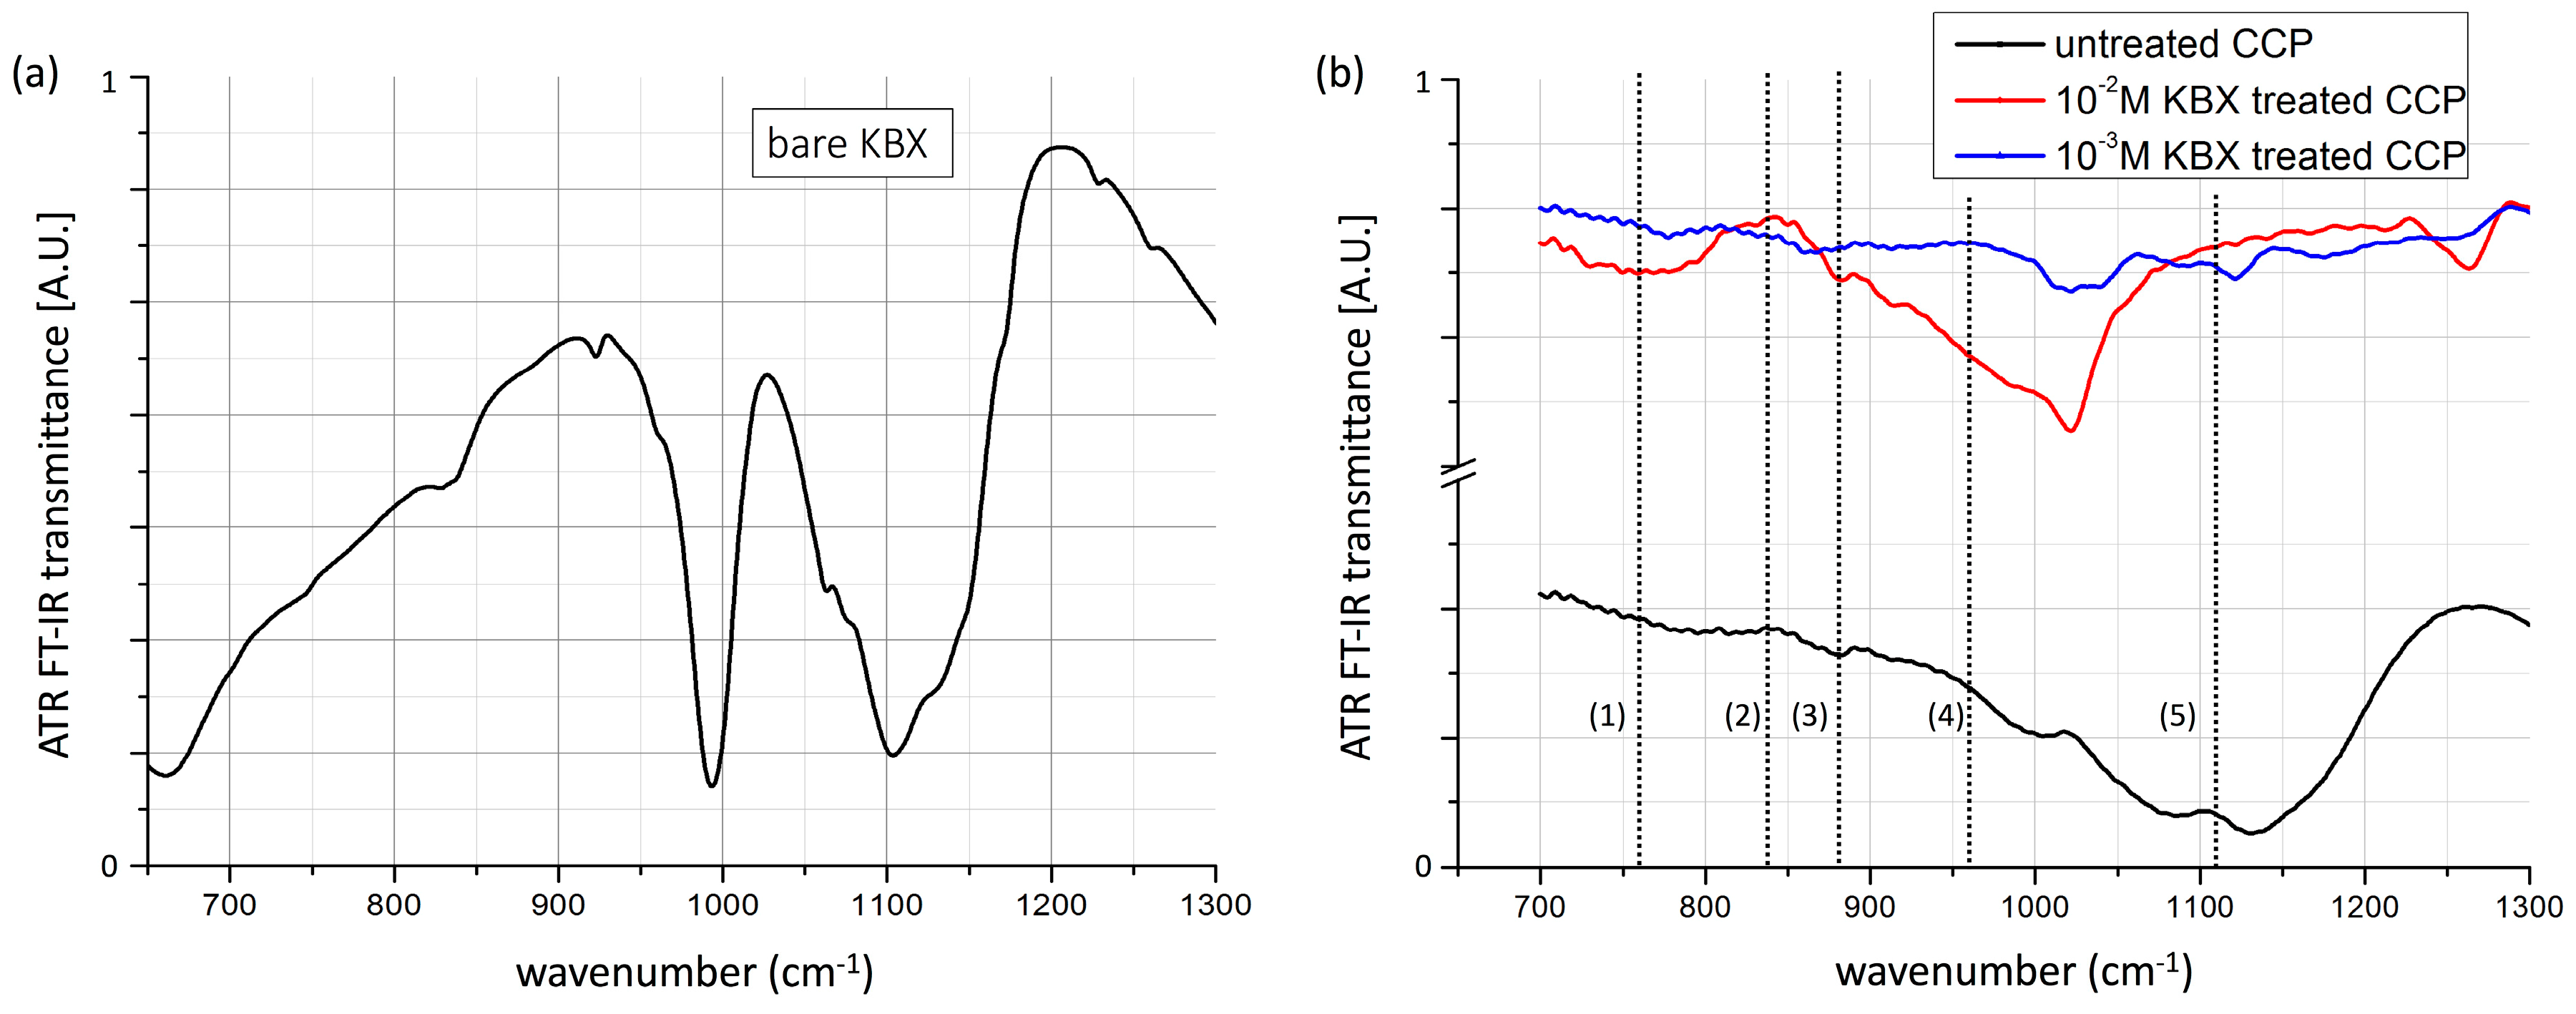
3.1. ATR FT-IR Measurements

CCP and KBX raw materials as well as CCPX-2a, CCPX-3a, and CCPX-4a products were firstly investigated by macroscopic mid-IR spectroscopy with the goal of retrieving their relevant IR fingerprint regions and absorption bands for our s-SNIM investigation to follow. Figure 1a presents the IR spectrum of the bare KBX for the mid-IR wavelength regime of 650 cm−1 to 1300 cm−1. Here, broad overlapping bands are observed, with two major features showing up at 993 cm−1 and 1103 cm−1. The latter is assigned to modes of the –CS2– functional group. The spectrum shows slight differences in comparison to previously published data [49]. In particular, the absorption band around 1000 cm−1 can hardly be related to KBX. With respect to the given KBX purity of about 95%, this band is obviously due to unknown impurities of KBX. As a consequence, we selected those wavenumbers for our KBX near-field investigations that are published in the literature and that are not strongly affected by impurities.
Figure 1b shows the IR spectra of CCP as well as the reaction products after conditioning with 10−2 M and 10−3 M aqueous KBX solutions, namely samples CCPX-2a and CCPX-3a. The spectrum of untreated CCP shows a characteristic broad absorption band around 1100 cm−1. After conditioning with 10−2 M KBX the spectrum changes significantly, showing a much higher absolute value as well as significant bands that may partly be attributed to the spectrum of bare KBX (Figure 1a). The spectral differences between KBX (Figure 1a) and the CCP-KBX reaction products (Figure 1b) are based on the new chemical structure of the compounds obtained after KBX conditioning on the CCP surface, an effect that is known for flotation reactions [50,51,52] as the composition of the reaction products varies strongly on the conditioning parameters. The reaction products have been investigated by several groups with FT-IR [7], XPS [53], and other X-ray techniques [54], leading to the conclusion that the reaction product is dominated by cuprous xanthate and dixanthogen.
When the CCP was conditioned at a lower 10−3 M KBX concentration, the IR spectrum of the product obtained changed drastically. In particular, bands with lower intensities and at different frequencies were observed, suggesting the presence of new CCP-KBX products with a changed chemical structure. Note that these spectra might partly contain absorption peaks of reaction products as reported for the 10−2 M KBX case. Nevertheless, their concentration was too low to be detected by the ATR FT-IR technique.

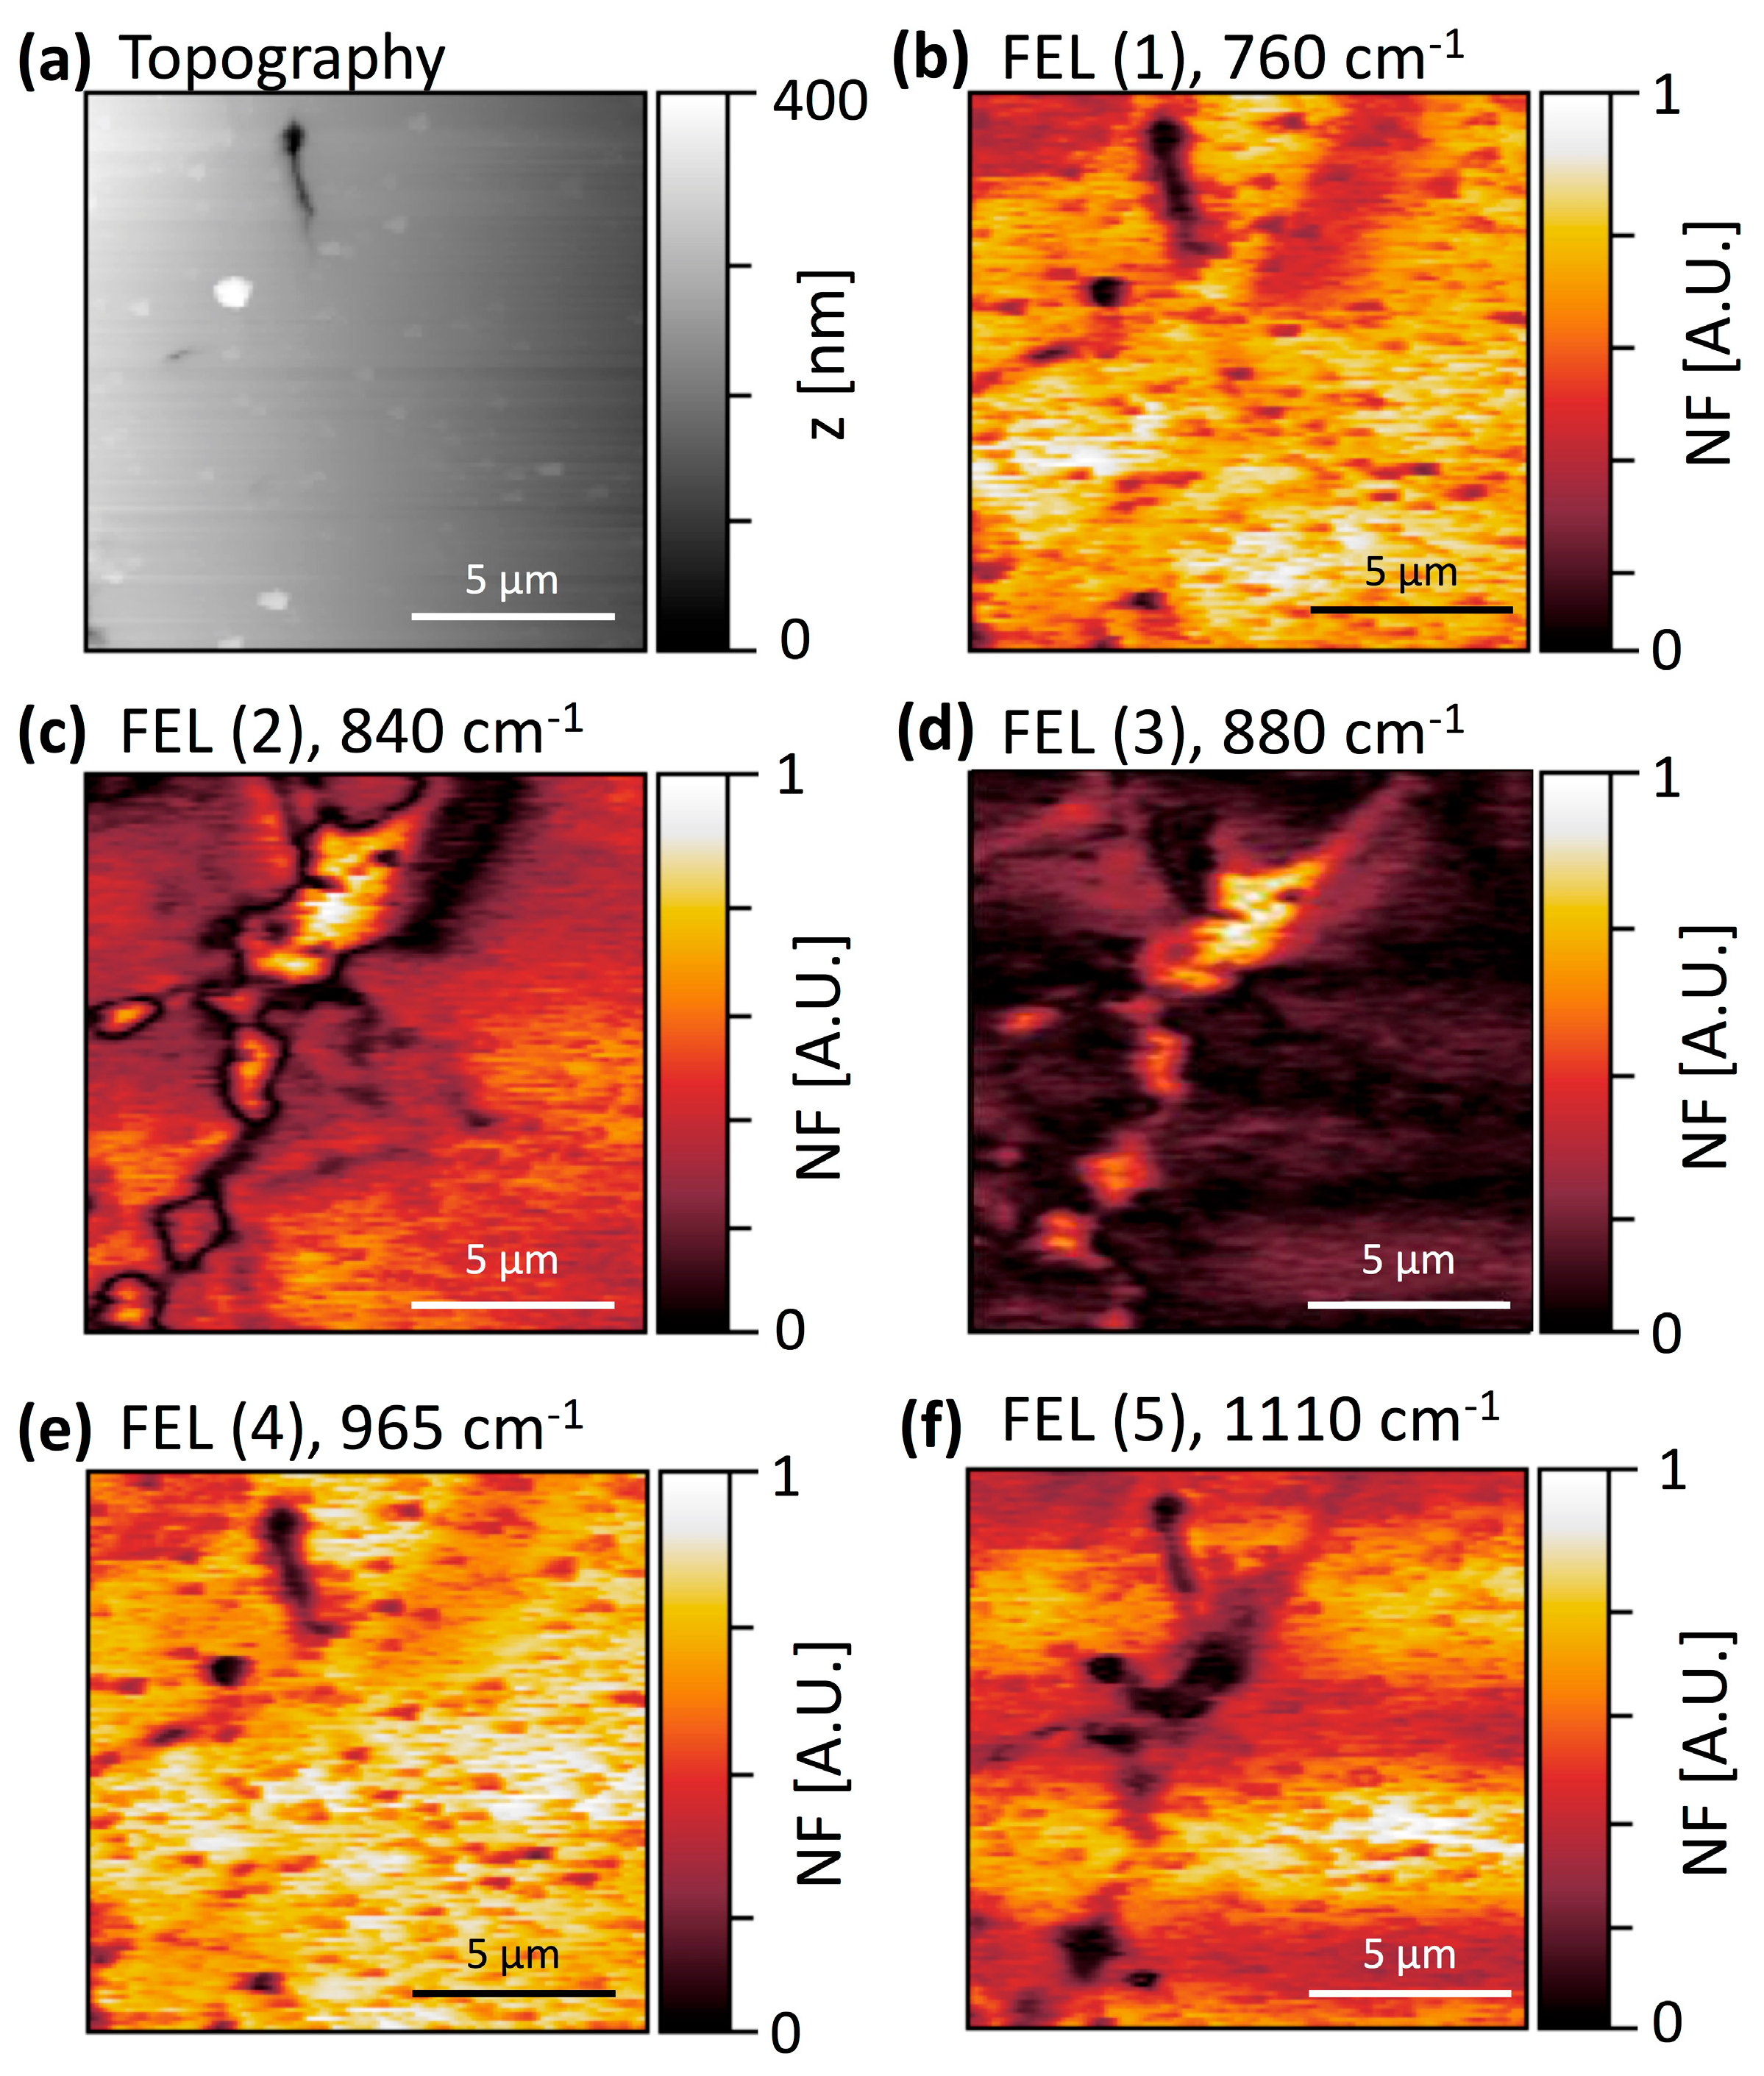
3.2. s-SNIM of the CCPX-2b Sample Applying the Free-Electron Laser

FEL near-field examinations were carried out on the CCPX-2b sample (10−2 M concentration) over the spectral range of 760–1260 cm−1. In Figure 3 we present selected results of these measurements at specific wavelengths, as indicated in Figure 1b. Note that the full set of scan data is displayed in the supplementary information in Figure S1. The topography of the investigated area with a 14 µm × 14 µm size is illustrated in Figure 3a. The surface roughness is less than 2 nm. Besides a crack in the upper part of the scan (see Figure 3a) and some debris particles, the surface appears flat and does not show larger clusters of KBX reaction products, as was reported by Mikhlin et al. [55] in their liquid-cell AFM investigations. The corresponding near-field images are displayed in Figure 3b–f. Since both the spectral power density, the detector responsivity, and the effective focal size might slightly vary for different wavenumbers, the vertical z-scale bars were normalized for better comparison (contrast ranges from 0 to 1).
The frequencies for the nanoscopic near-field examination (Figure 3b–f) were chosen from the macroscopic ATR FT-IR data as indicated in Figure 1b. Figure 3b shows the near-field response at 760 cm−1, where no absorption after KBX treatment was observed in the mid-IR data. This near-field image shows a very homogeneous continuous response over the whole sample area. The small dots and area of low signal stem from topographic artifacts and irregularities (e.g., the crater in the top of the image), or result from impurities (dust particles, etc.) at the sample surface. At a frequency of 965 cm−1 (see Figure 3e), the sample containing 10−2 M KBX showed a quite similar absorption behavior to the untreated CCP sample apart from a remarkable near-field signal offset (background). Hence, no material contrast of the KBX was expected and the near-field image looks very similar to Figure 3b.
The s-SNIM examinations displayed in Figure 3b,e show a very low material contrast between the KBX reaction products and the CCP substrate. At 840 cm−1 and 880 cm−1 (Figure 3c,d), however, an elongated, clustered area with a clearly enhanced near-field signature appears, indicating the resonant condition of adsorbed KBX reaction products at this wavelength. The observed elongated area consists of a few larger patches that are interconnected by a few thin channels with a lateral size as small as 700 nm. The contrast is largest for the 880 cm−1 measurement. At 840 cm−1, the area is circumscribed by a thin line of low signal, which originates from a phase-jump in the near-field measurement when the tip moves from one material to the other. This characteristic response indicates the resonant behavior of the KBX reaction products compared to the non-resonantly excited CCP substrate. Note that at exactly this wavenumber, the mid-IR spectrum also shows an enhanced signal, leading to the conclusion that this material is indeed the KBX reaction product.
The same structure is also visible in Figure 3f for a frequency of 1110 cm−1, where an inverted contrast is found. This contrast reversal is again characteristic for resonant excitation in near-field microscopy when tuning the wavelength over the resonance [34,36]. At this wavelength, the structure is not as clear as in Figure 3c, which is consistent with the mid-IR data, where the difference between the untreated CCP and the 10−2 M KBX sample is much lower. Note also the weak interference pattern (horizontal stripes) seen in Figure 3f, which is a typical artifact in near-field microscopy due to multiple reflections from the sample surface and cantilever. In conclusion, this spectral behavior is very typical for a nano-spectroscopic measurement and links the macroscopic mid-IR data to the nanoscale structures of the KBX reaction product.

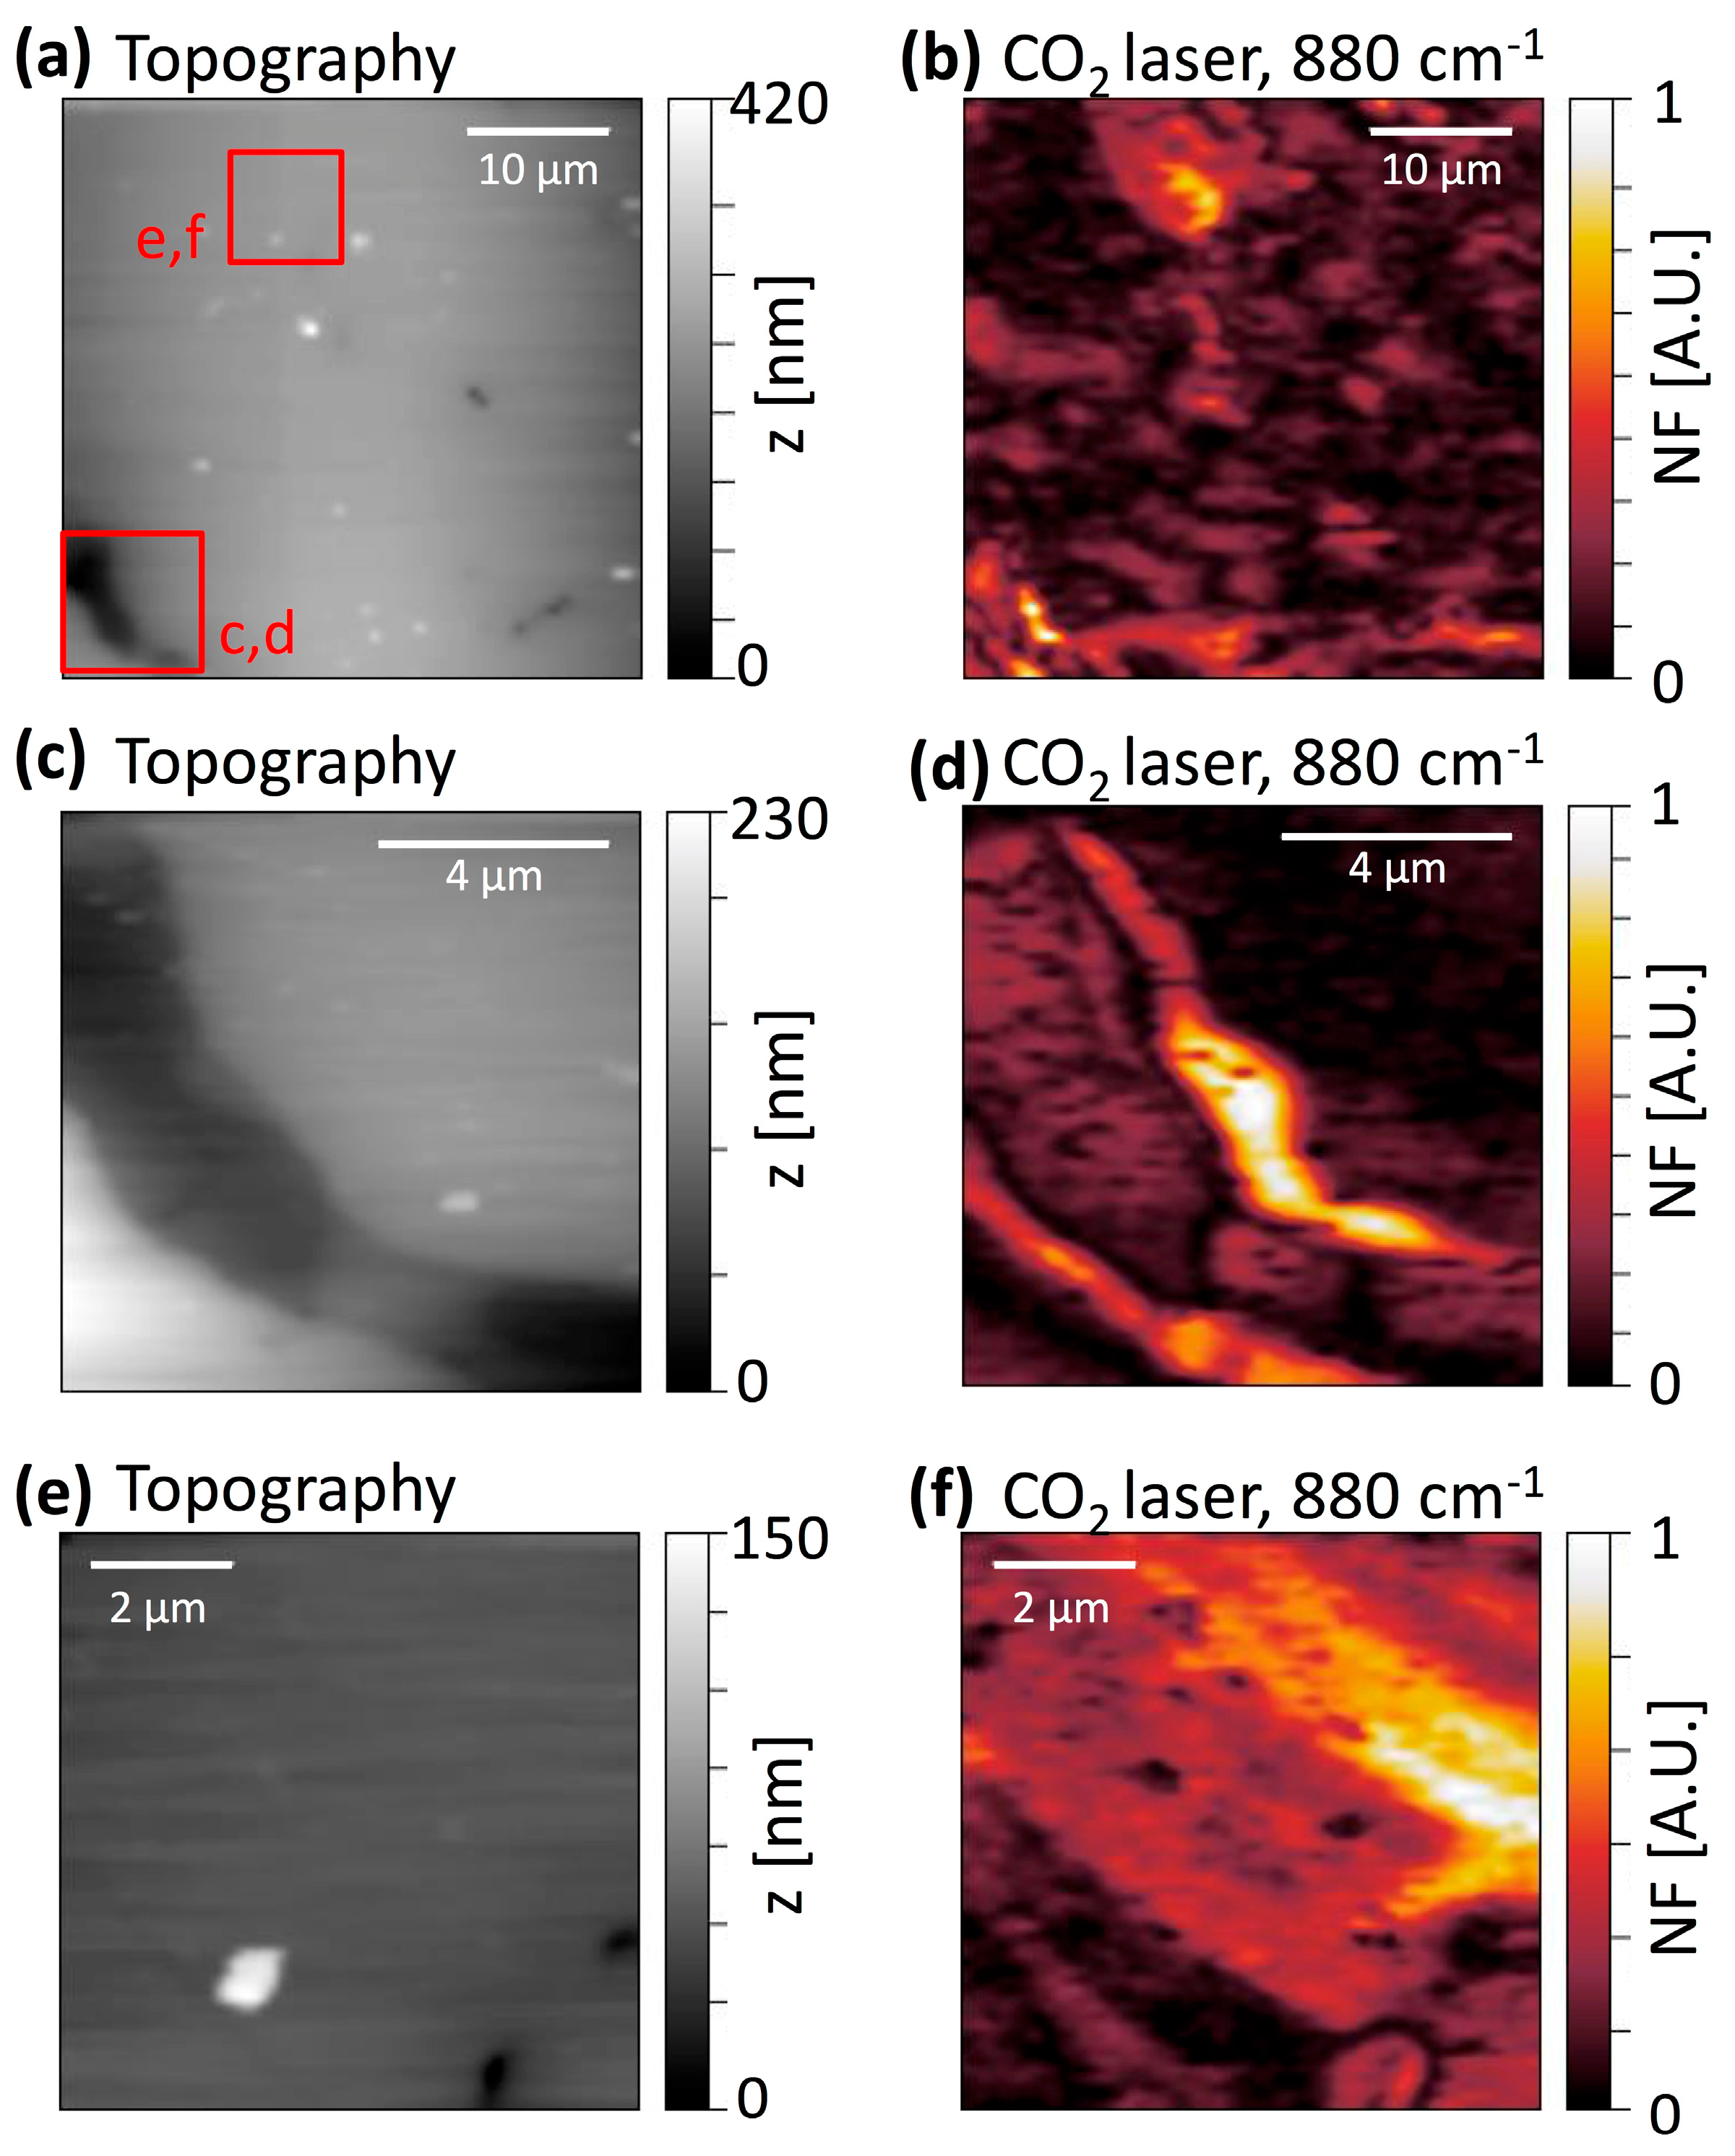
3.3. s-SNIM of CCPX-3b and CCPX-4b Samples with the CO2-Laser

The adsorption of KBX on CCP may generate quite irregular and even three-dimensional aggregates, as reported by Mikhlin et al. [55]. This is certainly due to the higher KBX concentration of >10−2 M used in all of the previous works, including the paper by Mikhlin et al. Nevertheless, the mining industry prefers much lower KBX concentrations, which result in a subtler adsorption at the CCP surface. We address these demands by preparing adequate samples, i.e., CCPX-3b and CCPX-4b. In fact, as shown below, our s-SNIM technique is readily capable to monitor the KBX presence at these low concentrations as well as when tracking the 880 cm−1 peak. Note that we switch from the application of the FEL to a table-top CO2 laser system.
Figure 4 illustrates a detailed study of the 10−3-M-treated sample, with Figure 4a,b displaying the topography and s-SNIM response of a 40 µm × 40 µm overview scan, respectively. As seen, the sample provides a relatively flat surface topography, but exhibits a several micrometers-wide and a 100-nm deep canyon in the bottom left corner of the image. The near-field response shows an enhanced signal of microstructures in two distinct areas, namely close to the canyon and in the top middle of the scan. Figure 4c–f display magnifications of those areas, respectively, as indicated in Figure 4a. Figure 4c shows a close-up view of the sample topographic around the canyon area, while the corresponding s-SNIM plot exhibits an enhanced signal on the top plateau next to the canyon, where the KBX reaction products seems to favorably agglomerate. In contrast, the surface of the second zoom area as displayed in Figure 4e appears flat except for some smaller features. An enhanced near-field signal can be found on a completely flat area with a size of roughly 2 µm × 8 µm in the top right area of Figure 4f.
Additional near-field results of the 10−4 M sample recorded at a laser frequency of 880 cm−1 are displayed in Figure 5. The topography information in Figure 5a displays a relatively smooth and flat surface with very little contamination by particles or adsorbates. The near field as displayed in Figure 5b shows twines that form a web-like structure. The largest signal is exhibited in the lower right part of the image, where the twines have the strongest density and the contrast to the substrate is obvious. However, in the upper left part of the image, the concentration is much smaller and the twines seem to be less broad, namely as small as 500 nm. Here, the contrast is close to the detection limit until it completely vanishes.
The measurements with the CO2 laser demonstrate that our approach is readily able to identify KBX reaction products at the CCP sample surface at a very low concentration, comparable to industry standards. We found different shapes for agglomerates of KBX reaction products on the CCP surface that are in most cases located close to defects of the CCP surface. The application of the s-SNIM technique allows for the resolution of structures as small as 500 nm in lateral size at 880 cm−1 (i.e., at a wavelength of 11.4 μm) corresponding to a resolution of λ/22.

4. Conclusions

We demonstrated that scattering-type scanning near-field infrared optical nanospectroscopy (s-SNIM) operated with the FELBE free-electron laser at the Helmholtz-Zentrum Dresden-Rossendorf facility, Germany, or a table-top CO2 laser, provides a molecular identification of n-butyl xanthate (KBX) molecules adsorbed to chalcopyrite (CCP) sample surfaces, both spectroscopically and microscopically. We tracked the major vibrational band of KBX reaction products around 880 cm−1 by s-SNIM, which showed good agreement with the macroscopic, integral measurements obtained by attenuated total internal reflection Fourier-transform infrared spectroscopy (ATR FT-IR). Moreover, the s-SNIM imaging capability identified islands of KBX reaction products with <500 nm in diameter that aggregate in patches at the CCP surface, underlining the sub-wavelength optical resolution in s-SNIM of better than λ/22. Surprisingly, the presented s-SNIM method allows for fingerprinting the KBX reaction products even under the chosen harsh but industrially relevant conditions, e.g., using 95% pure KBX solution only, and operating at very high dilutions of 10−4 M concentrations.

Supplementary Materials

The following are available online at https://www.mdpi.com/2075-163X/8/3/118/s1, Figure S1: Complementary near-field data on CCPX-2b.

Acknowledgments

The authors are grateful for technical support by the ELBE team at the Helmholtz-Zentrum Dresden-Rossendorf facility, Germany. Technical assistance during ATR FT-IR measurements by K. Heim is gratefully acknowledged. This work was financially supported by the BMBF (Bundesministerium für Bildung und Forschung) under grant no. 05K16ODA. F.K. acknowledges the financial support by the Rosa Luxemburg Stiftung. The first author was financially supported through the project “OptimOre”, which received funding from the European Union’s Horizon 2020 research and innovation programme under grant agreement No. 642201.

Author Contributions

T.F., F.K., H.F., J.M.K., S.C.K., and L.M.E. conceived and designed the experiments; T.F., F.K., and T.N. performed the experiments; T.F., F.K., A.P., S.C.K., and H.F. analyzed the data; H.F. and M.R. contributed reagents/materials/analysis tools; T.K., F.K., S.C.K., and L.M.E. wrote the paper.

Conflicts of Interest

The authors declare no conflict of interest.

References

  1. Leppinen, J.O.; Basilio, C.I.; Yoon, R.H. In-situ FTIR study of ethyl xanthate on sulfide minerals under controlled potential. Int. J. Miner. Process. 1989, 26, 259–274. [Google Scholar] [CrossRef]
  2. Chernyshova, I.V. Anodic processes on a galena (PbS) electrode in the presence of n-butyl xanthate studied FTIR-spectroelectrochemically. J. Phys. Chem. B 2001, 105, 8185–8191. [Google Scholar] [CrossRef]
  3. Chernyshova, I.V. In situ FTIR−spectroelectrochemical study of the anodic processes on a galena (PbS) electrode under open-air conditions in the absence and presence of n-butyl xanthate. Langmuir 2002, 18, 6962–6968. [Google Scholar] [CrossRef]
  4. Fredriksson, A.; Homgren, A.; Forsling, W. Kinetics of collector adsorption on mineral surfaces. Miner. Eng. 2006, 19, 784–789. [Google Scholar] [CrossRef]
  5. Fredriksson, A.; Hellström, P.; Öberg, S.; Holmgren, A. Comparison between in situ total internal reflection vibrational spectroscopy of an adsorbed collector and spectra calculated by ab initio density functional theory methods. J. Phys. Chem. C 2007, 111, 9299–9304. [Google Scholar] [CrossRef]
  6. Fredriksson, A.; Holmgren, A. An in-situ ATR-FTIR investigation of adsorption and orientation of heptyl xanthate at the lead sulphide/aqueous solution interface. Miner. Eng. 2008, 12, 1000–1004. [Google Scholar] [CrossRef]
  7. Zhang, Y.; Cao, Z.; Sun, C. FTIR studies of xanthate adsorption on chalcopyrite, pentlandite and pyrite surfaces. J. Mol. Struct. 2013, 1048, 434–440. [Google Scholar] [CrossRef]
  8. Pillai, K.C.; Young, V.Y.; Bockris, J.O.M. X-ray photoelectron spectroscopy studies of xanthate adsorption on pyrite mineral surfaces. J. Colloid Interface Sci. 1985, 103, 145–153. [Google Scholar] [CrossRef]
  9. Page, P.W.; Hazell, L.B. X-ray photoelectron spectroscopy (XPS) studies of potassium amyl xanthate (KAX) adsorption on precipitated PbS related to galena flotation. Int. J. Miner. Process. 1989, 25, 97–100. [Google Scholar] [CrossRef]
  10. Buckley, A.N.; Woods, R. X-ray photoelectron spectroscopic and electrochemical studies of the interaction of xanthate with galena in relation to the mechanism proposed by Page and Hazell. Int. J. Miner. Process. 1990, 28, 301–311. [Google Scholar] [CrossRef]
  11. Laajalehto, K.; Nowak, P.; Pomianowski, A.; Suoninen, E. Xanthate adsorption at PbS/aqueous interfaces: Comparison of XPS, infrared and electrochemical results. Colloids Surf. 1991, 57, 319–333. [Google Scholar] [CrossRef]
  12. Laajalehto, K.; Nowak, P.; Suoninen, E. On the XPS and IR identification of the products of xanthate sorption at the surface of galena. Int. J. Miner. Process. 1993, 37, 123–147. [Google Scholar] [CrossRef]
  13. Laajehto, K.; Smart, R.S.C.; Ralston, J.; Suoninen, E. STM and XPS investigation of reaction of galena in air. Appl. Surf. Sci. 1993, 64, 29–39. [Google Scholar] [CrossRef]
  14. Shchukarev, A.V.; Kravets, I.M.; Buckley, A.N.; Woods, R. Submonolayer adsorption of alkyl xanthates on galena. Int. J. Miner. Process. 1994, 41, 99–114. [Google Scholar] [CrossRef]
  15. Buckley, A.N.; Goh, S.W.; Lamb, R.N.; Woods, R. Interaction of thiol collectors with pre-oxidised sulfide minerals. Int. J. Miner. Process. 1994, 72, 163–174. [Google Scholar] [CrossRef]
  16. Szargan, R.; Uhlig, I.; Wittstock, G.; Roßbach, P. New methods in flotation research—Application of synchrotron radiation to investigation of adsorbates on modified galena surfaces. Int. J. Miner. Process. 1997, 51, 151–161. [Google Scholar] [CrossRef]
  17. Goh, S.W.; Buckley, A.N.; Lamb, R.N.; Fan, L.J.; Yang, Y. XPS, Static SIMS and NEXAFS spectroscopic investigation of thiol adsorption on metals and metal sulfides. ECS Trans. 2006, 2, 107–119. [Google Scholar] [CrossRef]
  18. O`Dea, A.R.; Prince, K.E.; Smart, R.S.C.; Gerson, A.R. Secondary ion mass spectrometry investigation of the interaction of xanthate with galena. Int. J. Miner. Process. 2001, 61, 121–143. [Google Scholar] [CrossRef]
  19. Piantadosi, C.; Smart, R.S.C. Statistical comparison of hydrophobic species on galena and pyrite particles in flotation concentrates and tails from TOF-SIMS evidence. Int. J. Miner. Process. 2002, 64, 43–54. [Google Scholar] [CrossRef]
  20. Goh, W.S.; Buckley, A.N.; Lamb, R.N.; Woods, R. The ability of static ion mass spectrometry to discriminate submonolayer from multilayer adsorption of thiol collectors. Miner. Eng. 2006, 19, 571–581. [Google Scholar] [CrossRef]
  21. Chelgani, S.C.; Hart, B. TOF-SIMS studies of surface chemistry of minerals subjected to flotation separation—A review. Miner. Eng. 2014, 57, 1–11. [Google Scholar] [CrossRef]
  22. Beaussart, A.; Parkinson, L.; Mierczynska-Vasilev, A.; Ralston, J.; Beattie, D.A. Effect of adsorbed polymers on bubble-particle attachement. Langmuir 2009, 25, 13290–13294. [Google Scholar] [CrossRef] [PubMed]
  23. Mierczynska-Vasilev, A.; Beattie, D.A. In situ atomic force microscopy of modified dextrin adsorption on hydrophobic and hydrophilic layered silicate minerals. J. Colloid Interface Sci. 2010, 344, 429–437. [Google Scholar] [CrossRef] [PubMed]
  24. Mierczynska-Vasilev, A.; Beattie, D.A. Adsorption of tailored carboxymethyl cellulose polymers on talc and chalcopyrite: Correlation between coverage, wettability, and flotation. Miner. Eng. 2010, 23, 11–13. [Google Scholar] [CrossRef]
  25. Zhang, J.; Zhang, W. An Atomic Force Microscopy Study of the Adsorption of Collectors on Chalcopyrite. In Microscopy: Advances in Scientific Research and Education; Formatex Research Center: Badajoz, Spain, 2014; Volume 2, pp. 967–973. ISBN 978-84-942134-4-1. [Google Scholar]
  26. Sedeva, I.G.; Fetzer, R.; Fornasiero, D.; Ralston, J.; Beattie, D.A. Adsorption of modified dextrins to a hydrophobic surface: QCM-D studies, AFM imaging, and dynamic contact angle measurements. J. Colloid Interface Sci. 2010, 345, 417–426. [Google Scholar] [CrossRef] [PubMed]
  27. Knoll, B.; Keilmann, F. Enhanced dielectric contrast in scattering-type scanning near-field optical microscopy. Opt. Commun. 2000, 182, 321–328. [Google Scholar] [CrossRef]
  28. Hillenbrand, R.; Knoll, B.; Keilmann, F. Pure optical contrast in scattering-type scanning near-field microscopy. J. Microsc. 2001, 202, 77–83. [Google Scholar] [CrossRef] [PubMed]
  29. Brehm, M.; Taubner, T.; Hillenbrand, R.; Keilmann, F. Infrared spectroscopic mapping of single nanoparticles and viruses at nanoscale resolution. Nano Lett. 2006, 6, 1307–1310. [Google Scholar] [CrossRef] [PubMed]
  30. Hillenbrand, R.; Keilmann, F. Material-specific mapping of metal/semiconductor/dielectric nanosystems at 10 nm resolution by backscattering near field optical microscopy. Appl. Phys. Lett. 2002, 80, 25–27. [Google Scholar] [CrossRef]
  31. Moon, K.; Park, H.; Kim, J.; Do, Y.; Lee, S.; Lee, G.; Kang, H.; Han, H. Subsurfae Nanoimaging by Broadband Terahertz Pulse Near-Field Microscopy. Nano Lett. 2015, 15, 549–552. [Google Scholar] [CrossRef] [PubMed]
  32. Kuschewski, F.; von Ribbeck, H.-G.; Döring, J.; Winnerl, S.; Eng, L.M.; Kehr, S.C. Narrow-band near-field nanoscopy in the spectral range from 1.3 to 8.5 THz. Appl. Phys. Lett. 2016, 108, 113102. [Google Scholar] [CrossRef]
  33. Stinson, H.T.; Sternbach, A.; Najera, O.; Jing, R.; Mcleod, A.S.; Slusar, T.V.; Mueller, A.; Anderegg, L.; Kim, H.T.; Rozenberg, M. Imaging the nanoscale phase separation in vanadium dioxide thin films at terahertz frequencies. Arxiv, 2017; arXiv:1711.05242. [Google Scholar]
  34. Hillenbrand, R.; Taubner, T.; Keilmann, F. Phonon-enhanced light–matter interaction at the nanometre scale. Nature 2002, 418, 159. [Google Scholar] [CrossRef] [PubMed]
  35. Döring, J.; von Ribbeck, H.-G.; Fehrenbacher, M.; Kehr, S.C.; Eng, L.M. Near-field resonance shifts of ferroelectric barium titanate domains upon low-temperature phase transition. Appl. Phys. Lett. 2014, 105, 053109. [Google Scholar] [CrossRef]
  36. Kehr, S.C.; Cebula, M.; Mieth, O.; Härtling, T.; Seidel, J.; Grafström, S.; Eng, L.M.; Winnerl, S.; Stehr, D.; Helm, M. Anisotropy contrast in phonon-enhanced apertureless near-field microscopy using a free-electron laser. Phys. Rev. Lett. 2008, 100, 256403. [Google Scholar] [CrossRef] [PubMed]
  37. Jacob, R.; Winnerl, S.; Schneider, H.; Helm, M.; Wenzel, M.T.; Ribbeck, H.-G.; Eng, L.M.; Kehr, S.C. Quantitative determination of the charge carrier concentration of ion implanted silicon by IR-near-field spectroscopy. Opt. Express 2010, 18, 26206. [Google Scholar] [CrossRef] [PubMed]
  38. Huber, A.J.; Keilmann, F.; Wittborn, J.; Aizpurua, J.; Hillenbrand, R. Terahertz Near-Field Nanoscopy of Mobile Carriers in Single Semiconductor Nanodevices. Nano Lett. 2008, 8, 3766–3770. [Google Scholar] [CrossRef] [PubMed]
  39. Huber, A.J.; Ziegler, A.; Köck, T.; Hillenbrand, R. Infrared spectroscopy of strained semiconductors. Nat. Nanotechnol. 2009, 4, 153–157. [Google Scholar] [CrossRef] [PubMed]
  40. Pollard, B.; Muller, E.A.; Hinrichs, K.; Raschke, M.B. Vibrational nano-spectroscopic imaging correlating structure with intermolecular coupling and dynamics. Nat. Commun. 2014, 5, 1–7. [Google Scholar] [CrossRef] [PubMed]
  41. Nikiforov, M.P.; Kehr, S.C.; Park, T.H.; Milde, P.; Zerwerck, U.; Loppacher, C.; Eng, L.M.; Therien, M.J.; Engheta, N.; Bonnell, D. Probing polarization and dielectric function of molecules with higher order harmonics in scattering-near-field scanning optical microscopy. J. Appl. Phys. 2009, 106, 114307. [Google Scholar] [CrossRef]
  42. Kehr, S.C.; Liu, Y.M.; Martin, L.W.; Yu, P.; Yang, C.-H.; Wenzel, M.T.; Jacob, R.; von Ribbeck, H.-G.; Helm, M.; Zhang, X. Near-field examination of perovskite-based superlenses and superlens-enhanced probe-object coupling. Nat. Commun. 2011, 2, 249. [Google Scholar] [CrossRef] [PubMed]
  43. Fehrenbacher, M.; Winnerl, S.; Schneider, H.; Döring, J.; Kehr, S.C.; Eng, L.M.; Huo, Y.; Schmidt, O.G.; Yao, K.; Liu, Y.; et al. Plasmonic Superlensing in Doped GaAs. Nano Lett. 2015, 15, 1057. [Google Scholar] [CrossRef] [PubMed]
  44. Diao, M.; Nguyen, T.A.H.; Taran, E.; Mahler, S.; Nguyen, A.V. Differences in adhesion of A. thiooxidans and A. ferrooxidans on chalcopyrite as revealed by atomic force microscopy with bacterial probes. Miner. Eng. 2014, 64, 9–15. [Google Scholar] [CrossRef]
  45. Babel, B.; Rudolph, M. Characterizing mineral wettabilities on a microscale by colloidal probe atomic force microscopy. Miner. Eng. 2018, in press. [Google Scholar]
  46. Fei, Z.; Rodin, A.S.; Andreev, G.O.; Bao, W.; McLeod, A.S.; Wagner, M.; Zhang, L.M.; Zhao, Z.; Thiemens, M.; Dominguez, G.; Fogler, M.M. Gate-tuning of graphene plasmons revealed by infrared nano-imaging. Nature 2012, 487, 82–85. [Google Scholar] [CrossRef] [PubMed]
  47. Wurtz, G.; Bachelot, R.; Royer, P. A reflection-mode apertureless scanning near-field optical microscope developed from a commercial scanning probe microscope. Rev. Sci. Instrum. 1998, 69, 1735–1743. [Google Scholar] [CrossRef]
  48. Esslinger, M.; Dorfmüller, J.; Khunsin, E.; Vogelgesang, R.; Kern, K. Background-free imaging of plasmonic structures with cross-polarized apertureless scanning near-field optical microscopy. Rev. Sci. Instrum. 2012, 83, 033704. [Google Scholar] [CrossRef] [PubMed]
  49. Little, L.H.; Poling, G.W.; Leja, J. Infrared Spectra of Xanthate Compounds, II. Assignment of Vibrational Frequencies. Can. J. Chem. 1961, 39, 745–754. [Google Scholar] [CrossRef]
  50. Basařová, P.; Bartovská, L.; Kořínek, K.; Horn, D. The influence of flotation agent concentration on the wettability and flotability of polystyrene. J. Colloid Interface Sci. 2005, 286, 333–338. [Google Scholar] [CrossRef] [PubMed]
  51. Luo, X.; Feng, B.; Wong, C.; Miao, J.; Ma, B.; Zhou, H. The critical importance of pulp concentration on the flotation of galena from a low grade lead-zinc ore. J. Mater. Res. Technol. 2016, 5, 131–135. [Google Scholar] [CrossRef]
  52. Kursun, H. The influence of frother types and concentrations on fine particles’ entrainment using column flotation. Sep. Sci. Technol. 2016, 52, 722–731. [Google Scholar] [CrossRef]
  53. Mielczarski, J.A.; Cases, J.M.; Alnot, M.; Ehrhardt, J.J. XPS Characterization of Chalcopyrite, Tetrahedrite, and Tennantite Surface Products after Different Conditioning. 1. Aqueous Solution at pH 10. Langmuir 1996, 12, 2519–2530. [Google Scholar] [CrossRef]
  54. Mikhlin, Y.L.; Tomashevich, Y.V.; Asanov, I.P.; Okotrub, A.V.; Vamek, V.A.; Vyalikh, D.V. Spectroscopic and electrochemical characterization of the surface layers of chalcopyrite (CuFeS2) reacted in acidic solutions. Appl. Surface Sci. 2004, 225, 395–409. [Google Scholar] [CrossRef]
  55. Mikhlin, Y.L.; Karacharov, A.A.; Likhatski, M.N. Effect of adsorption of butyl xanthate on galena, PbS, and HOPG surfaces as studied by atomic force microscopy and spectroscopy and XPS. Int. J. Miner. Process. 2015, 144, 81–89. [Google Scholar] [CrossRef]
Figure 1. Macroscopic ATR FT-IR spectra of (a) pure KBX and (b) untreated CCP substrate, as well as CCPX-2a and CCPX-3a samples. The dashed lines 1 to 5 in (b) correspond to the spectral positions of the spatio-spectral investigations when using the FEL in combination with s-SNIM (see Figure 3b–f).
Minerals 08 00118 g001
Figure 2. Schematic drawing of the s-SNIM setup. s-polarized mid-infrared light is focused onto an AFM tip/CCP-sample (purple) junction, confining the near field under the tip apex. The coupled tip/sample dipole interaction scatters back into the far-field and is demodulated at higher cantilever harmonics. Note the greenish parts at the sample surface that represent the patchy adsorption of KBX molecules to the CCP.
Minerals 08 00118 g002
Figure 3. Scan area (14 µm × 14 µm) of a CCPX-2a sample examined with the free-electron laser (FEL). Displayed are (a) the sample topography and (bf) the corresponding near-field (NF) images recorded at (b) 760 cm−1, (c) 840 cm−1, (d) 880 cm−1, (e) 960 cm−1, and (f) 1100 cm−1. The sample surface exhibits an RMS roughness of <2 nm, and thus allows for associating the near-field contrast in pictures (bf) with effective molecular signatures. No contrast is observed in images (b,e), while elongated patches at 840 cm−1, 880 cm−1, and 1110 cm−1 show an increased/reduced near-field signal in images (c,d,f), respectively, that can be associated with the presence of KBX reaction products.
Minerals 08 00118 g003
Figure 4. Investigations of KBX reaction products distribution on the 10−3 M KBX-treated sample (CCPX-3b) at 880 cm−1 using the CO2 laser. (a) A 40 µm × 40 µm overview topography scan of the examined area. Red squares mark the areas of magnified scans in c,d and e,f, respectively. (b) shows the near-field signal on the same area as the overview scan in (a). In particular, two areas (bottom left and top middle) show enhanced near-field response. The topography of the 10 µm × 10 µm magnified scan with a 3-µm wide and 100-nm deep curved canyon is depicted in (c). (d) shows the corresponding near-field response with a strongly enhanced signal at the cliffs of the scan. An 8 µm × 8 µm scan of a rather flat area can be found in (e). Here, an enhanced near-field signal (f) is found in an area with a size of roughly 8 µm × 2 µm.
Minerals 08 00118 g004
Figure 5. Investigations of KBX reaction products distribution on a 10−4 M KBX-treated sample, CCCPX-4b. (a) The topography of a 10 µm × 20 µm area is depicted. (b) Near-field response of the same area at 880 cm−1 probed with the CO2 laser, revealing an enhanced signal in a web-like structure.
Minerals 08 00118 g005

