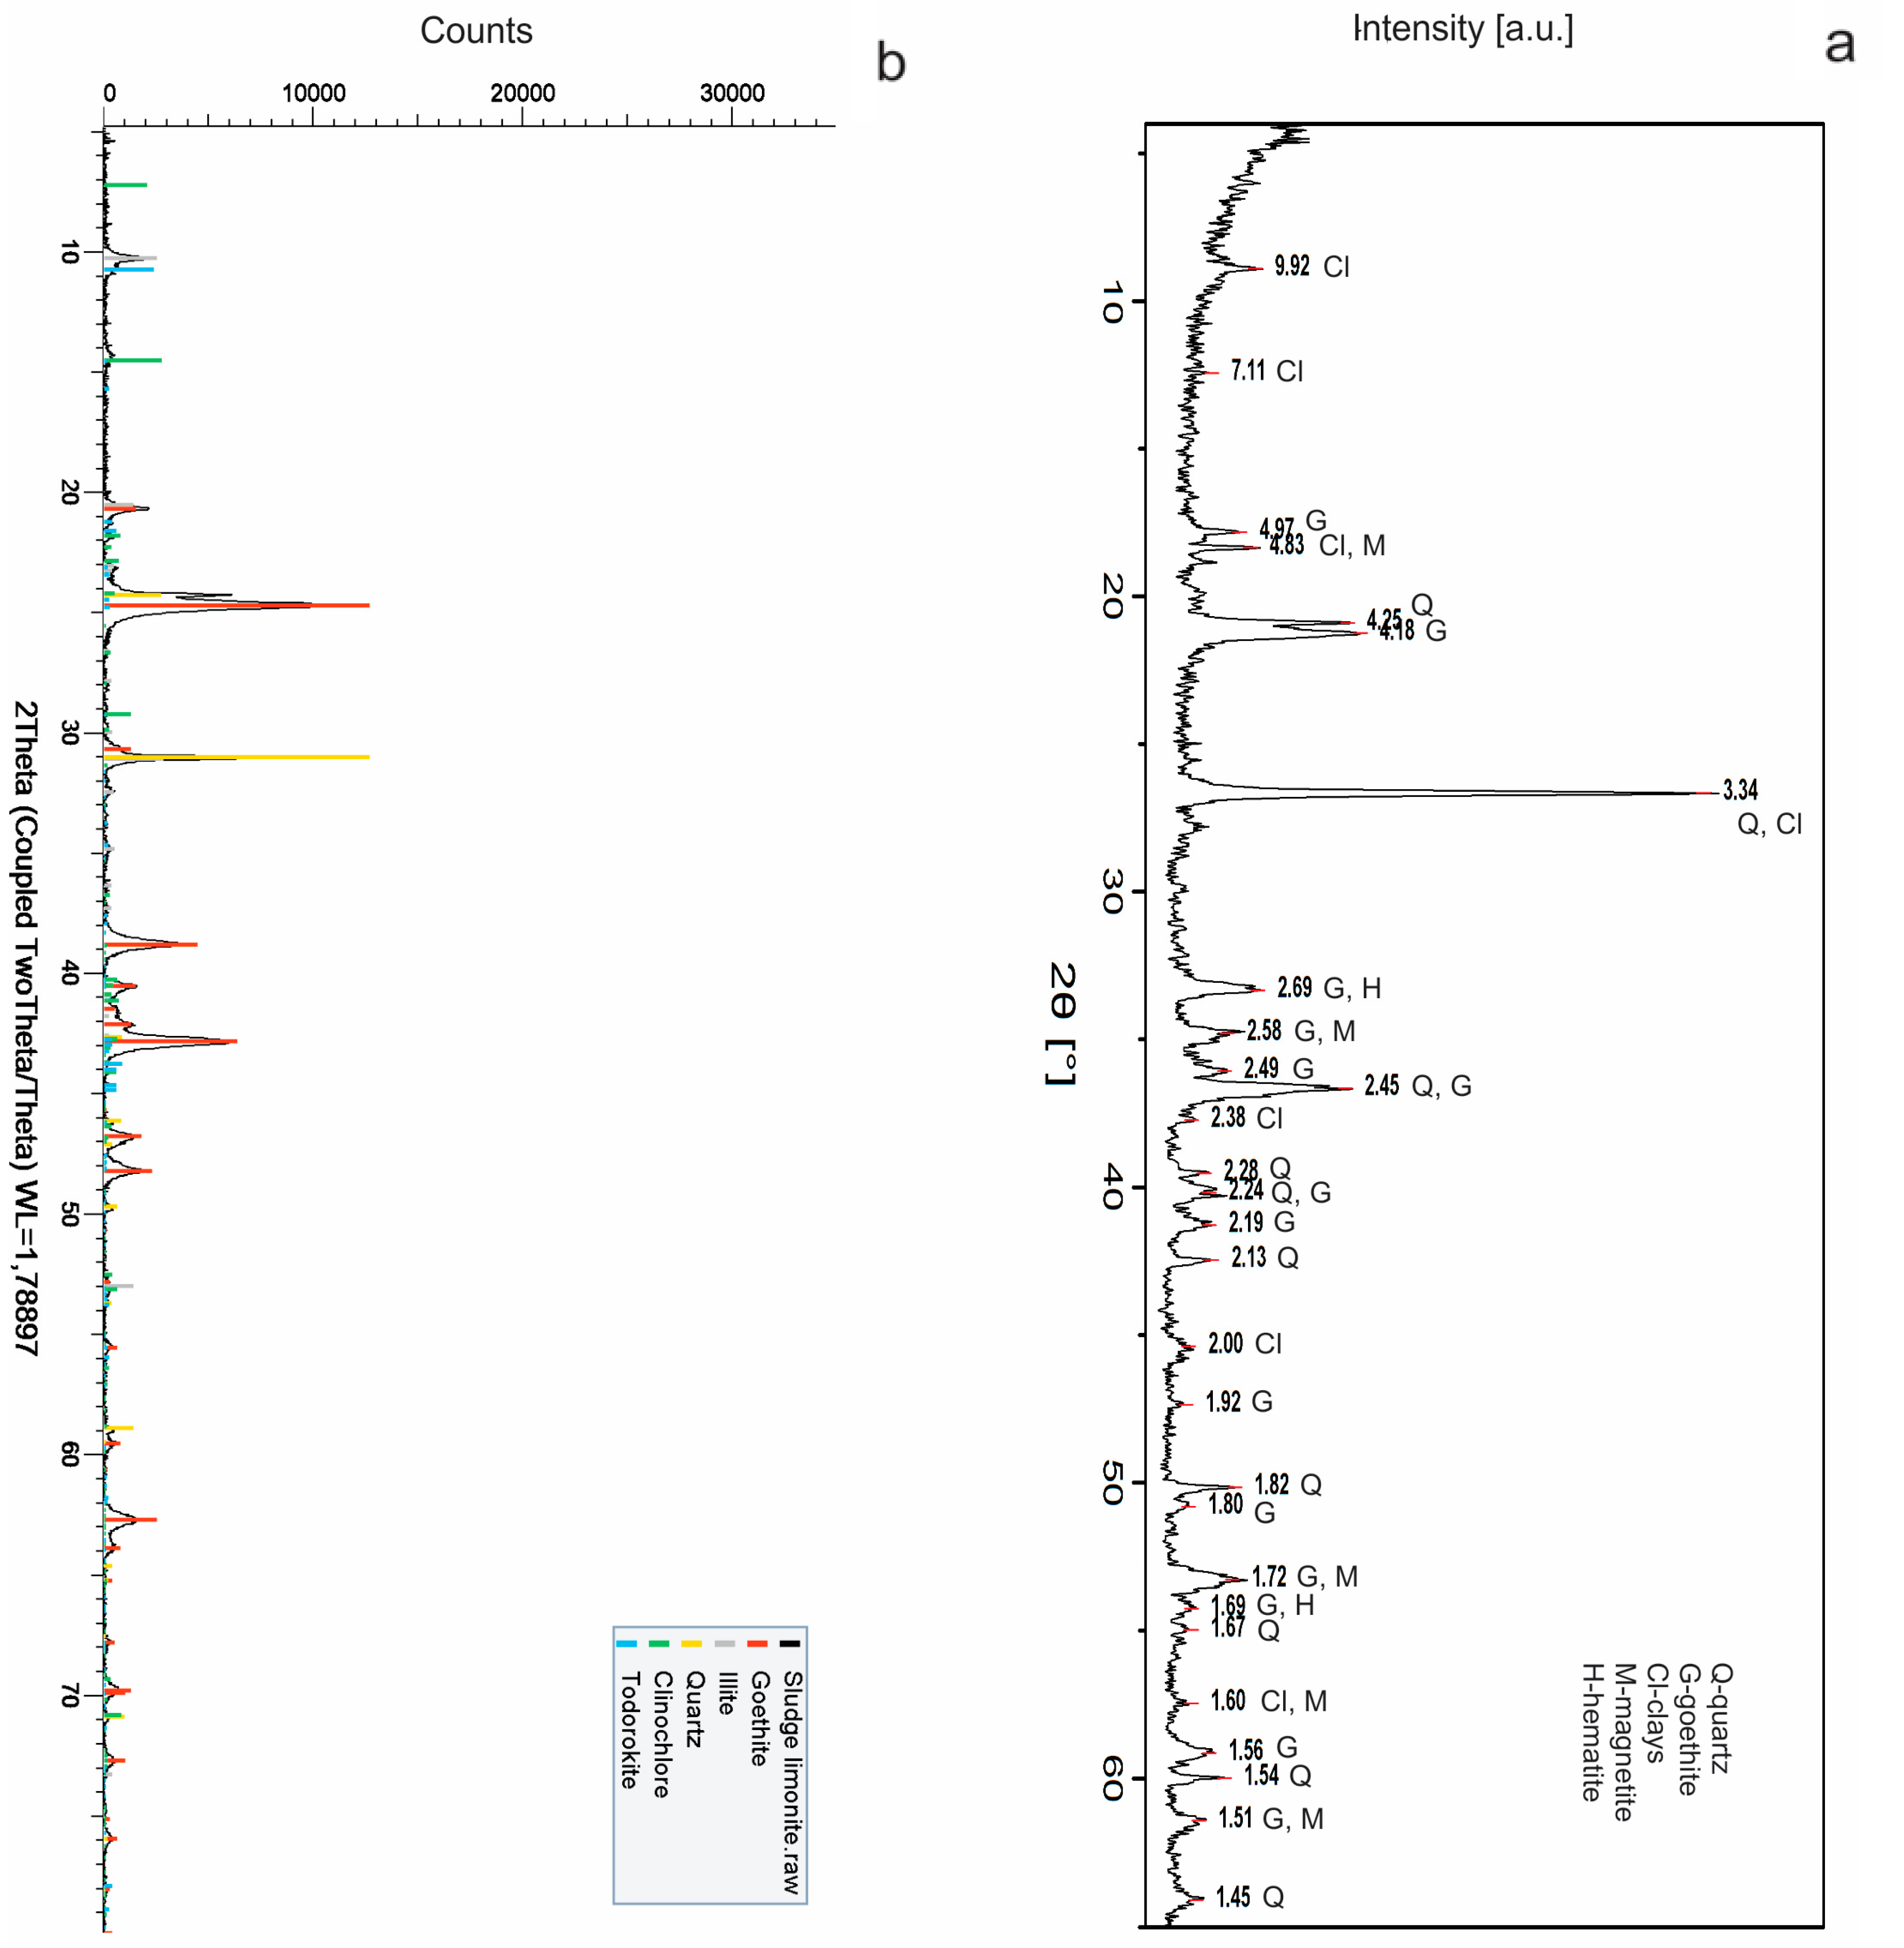
Article

Comparative Study of the Mineral Composition and Its Connection with Some Properties Important for the Sludge Flocculation Process-Examples from Omarska Mine

1
Faculty of Mining Prijedor, University of Banja Luka, Save Kovacevica bb, 79101 Prijedor, Bosnia and Herzegovina
2
Geological Survey of Serbia, Rovinjska 12, 11000 Belgrade, Serbia
3
Faculty of Physical Chemistry, University of Belgrade, Studentski Trg 16, 11000 Belgrade, Serbia
*
Author to whom correspondence should be addressed.
Minerals 2018, 8(3), 119; https://doi.org/10.3390/min8030119
Submission received: 6 February 2018 / Revised: 3 March 2018 / Accepted: 15 March 2018 / Published: 20 March 2018

Abstract

:
Studied sludge samples are composed of major goethite and quartz; less clay minerals; and minor magnetite, hematite, clinochlore and todorokite. They have quite similar qualitative, but different semi-quantitative compositions. There are similar particle size distributions between the samples, and the highest contents of ~50% belongs to the finest classes of <6 μm. Among size classes within the samples, almost identical iron contents are present; indicating their similar mineral compositions, which make these systems very complex for further separation processes. Sludge II has a higher natural settling rate, due to its higher density and mineral composition. With addition of the flocculant, settling rates increase significantly with the increase of the liquid component in both of the samples. The effect of flocculant on the settling rate is different between samples, and depends on their mineral composition. The time of settling does not play a role in selectivity, to the ratio of the mass of floating and sinking parts, and iron content does not change with time. The content of iron partially increases by flocculation; therefore, this method should be considered as an appropriate one. Zeta potential values for sludge are mostly between those for goethite and quartz, indicating their particle mixture and intricately association.

1. Introduction

The iron ore deposit “Omarska” (Bosnia and Herzegovina) is located in the northeast part of the “Sana paleozoic”, or the Ljubija metalogenetic region; and in the Omarska-Prijedor field between the cities of Prijedor and Banja Luka [1,2]. Iron ore from Omarska mine was previously assigned as limonite ore in association with clay minerals, quartz and some manganese minerals [1]. As it is well known, limonite is one of the two principal iron ores (the other being hematite, Fe2O3), and has been mined for the production of iron. It should be classified mainly as a mixture of hydrated iron oxides and hydroxides, with a chemical formula which could be written as Fe2O3·H2O. Furthermore, it is porous and often wrapped with fine-grained clay and other minerals. Because of that, X-ray powder diffraction (XRPD), Fourier transform infrared (FTIR) and scanning electron microscope-X-ray microanalysis (SEM-EDS) analyses were recently performed for obtaining more precise mineral determination [2]. These studies showed that primary natural mineral raw materials from this deposit are generally composed of major goethite-FeO (OH), quartz and clay minerals; in association with more or less minor contents of hematite, magnetite, feldspars, amphiboles, chloritoid, etc. Clay minerals were identified as illite-sericite which prevails over kaolinite, and with chlorites which appear only sporadically [2]. According to the data from [3], the average content of Fe from this ore is 36.12%, but it is highly variable and ranges from 18.19% to 54.71%.
Processing of ore in the Omarska mine is carried out by the following methods: washing, sieving, grading and magnetic concentration [1,2]. Crude ore is firstly washed in the washing drum, and then continues to wet sieving, grinding and grading by spiral classifier and the mechanical hydro-cyclones. The larger classes from hydro-cyclone go to the thickener and further to the magnetic separation. The smaller classes (<25 μm) overflow from hydro-cyclone to the tailing in the form of sludge. On the one hand, this sludge is an environmental problem; but on the other hand, if it contains significant amounts of limonite, we believe that it could be economically useful as iron ore, if an adequate technique for its sufficient concentration could be experimentally approved and applied.
Conventional techniques for the preparation of iron ore, such as magnetic and wet separation, give good results only in the case of high-quality coarse ore; however, in the case of low grade or fine ores, they are often insufficiently effective [4,5,6,7,8,9]. An important economic and ecologic problem in the mineral processing of fine ores, is the large quantity of sludge disposed as final waste. Fine iron ores most often contain clays, quartz and other minerals as gangue material along with iron minerals; therefore, such sludge is a complex system. This is the reason why many studies are conducted in order to select the best technique for the evaluation of complex ores with large amounts of fine particles. One of the most studied techniques for removing gangue from fine iron ores is selective flocculation [10,11,12,13,14]. However, knowledge about fine limonite ore processing is still relatively poor. The selective separation of useful minerals from gangue in a complex system such as sludge, is difficult in any case, and depends on the individual components of the sludge and their behavior [15,16,17]. Some of the most important criteria for the selection of the most adequate processing method are related to the sludge mineralogy, its particle size distribution and flocculation behavior properties.
The aim of this study is mineralogical characterization of two sludge samples with different initial content of iron derived by hydro-cyclone overflow generated during the processing of iron ore in the Omarska mine. In order to determine the mineral phases present and, in particular, their major impurities, XRPD, FTIR, chemical and SEM-EDS analyses were performed. Also, the particle size distributions and iron contents by size class were compared. Some other properties important for the sludge flocculation process, such as: natural settling; settling with the addition of flocculant; effect of solid concentration; and zeta potential variations were studied, as well. Hence, a comparative study of the mineral composition and its connection with some properties important for the sludge flocculation process, was processed.

2. Materials and Methods

2.1. Materials

Iron ore in the Omarska mine is abundant in large quantities of small classes, and such as that those that come to the magnetic concentration plant. The overflow from spiral mechanical classifier (classes 0–0.5 mm) goes to the hydro-cyclone. The larger classes, namely “sand” from hydro-cyclone (classes 0.025–0.5 mm) go to the thickener; whereas the smaller classes, namely, overflow from hydro-cyclone (classes <0.025 mm), go to the tailing in forms of sludge. Two such characteristic sludge samples with different content of Fe (i.e., 29.43%—marked as sludge I; and 41.19%—marked as sludge II) were chosen and taken for further analysis.
All reagents used were of analytical grade, and they were prepared as solutions in distilled water. The sodium hexametaphosphate (SHMP; Na6P6O18), manufactured by Lach-Ner, s.r.o. (Neratovice, Czech Republic), was used as dispersant. As flocculant, anionic polyacrylamide (PAM) type SUPERFLOC A100, manufactured by Kemira (Helsinki, Finland), was used. Preparation of flocculant for all experiments was carried out in the same way according to the instructions provided by the manufacturer of reagents [18]. As pH modifier, 0.1 M NaOH was used.

2.2. Methods

2.2.1. Characterization Methods

Chemical analyses were performed by wet analysis according to BAS ISO 2597-1:2012 standard for determination of iron ore. Density of sludge samples was determined by the pycnometer-using method. Samples were dried at 105 °C to constant weight prior to determination, and distilled water was used at room temperature (20 °C). For pH measurements, laboratory pH-meter type SENSION TM pH31, HACH Lange GmbH (Dusseldorf, Germany), was used.
The X-ray powder diffraction (XRPD) patterns of sludge I were obtained by a Philips PW-1710(Amsterdam, the Netherlands)automated diffractometer using a Cu tube (λ = 1.54060Å) operated at 40 kV and 30 mA. The instrument was equipped with a curved graphite monochromatic diffraction beam, and Xe-filled proportional counter. The diffraction data were collected in the 2θ a Bragg angle ranges from 4° to 65°, counting for 0.25 s at every 0.02° steps. The divergence and receiving slits were fixed at 1° and 0.1 mm, respectively. The XRPD measurements were performed ex situ at room temperature in a stationary sample holder. The alignment of the diffractometer was checked by means of a standard Si powder material. Identification of the present mineral phases was done by comparison of the inter-planar spacings (d) and relative intensities (I) with the literature data, which is a corresponding card from the International Centre for Diffraction Data, the Powder Diffraction File ICDD-PDF database (https://www.icdd.com).
Fourier Transform Infrared (FTIR) spectroscopy of both sludge samples was performed using Thermo Nicolet 6700 (Thermo Fisher Scientific, Waltham, MA, USA), at the spectral area 4000–400 cm−1, with resolution of 2 cm−1 and with 32 scans. Samples were powdered in agate mortar. For the spectra recording, KBr was used as following: in 150 mg of powdered KBr, 1 mg of the studied sample was added; then, it was homogenized and tablets were made under specific pressure and vacuum. Identification of the present mineral phases was done by comparison with the IR spectra from reference data of the corresponding mineral phases.
Scanning Electron Microscope-SEM analyses were carried out in a JEOL JSM 6610LV (JEOL Ltd., Tokyo, Japan) coupled with Energy Dispersive Spectrometry-EDS by EDS detector model X-Max Large Area Analytical Silicon Drift connected with INCA Energy 350 Microanalysis System for sludge I.
XRPD and SEM-EDS analyses of sludge II were performed in the laboratory of Global Research and Development, Mining and Mineral Processing, Maizières-lès-Metz, France. XRPD data were obtained on BRUKER D2 PHASER by using software DIFFRAC.EVA V4.0 (Bruker, Billerica, MA, USA); whereas SEM-EDS data were obtained on HITACHI “TM 3000” Tabletop Microscope (Tokyo, Japan) with High Sensitivity BSE Detector.

2.2.2. Particle Size Distribution Analysis

For particle size distribution, Beaker decantation analysis was used for both samples, according to the following procedure: (i) 100 g of the limonite sludge, previously dried at 105 °C; (ii) two cups of 2 L; and (iii) six cups of 1 L volume. For dispersant, 0.002 M of sodium hexametaphosphate (SHMP) was used. The pulp was gently stirred in order to disperse the particles through the whole volume, and then it was allowed to stand for the calculated time. The water which was above the end of the tube was syphoned off, then dried and weighed. Velocity of the particles and time of settling was calculated according to forms from the literature [19].

2.2.3. Settling and Flocculation Experiments

The natural settling and settling with the addition of flocculant were determined for both samples. Also, different solid/liquid relationships (marked as S:L) of: 1:7; 1:9.7; and 1:19.7; at the same conditions were used.
For settling, a graduated glass cylinder with volume of 100 mL was used. The flocculation experiments were performed at a pulp density with three different solid/liquid ratios (i.e.,: 1:7; 1:9.7; and 1:19.7). All of the tests were performed at pH = 7, which is an average pH value in real conditions.
The tests of selectivity were carried out according to the following procedure: (i) Beaker of 1000 mL volume for better visualization of the dispersion; (ii) 69 g of dry sample in 500 mL of distilled water for the experiment (which is adequate to the simulation of natural industrial conditions); (iii) 50 g/t of flocculant A100; and (iv) 1000 g/t of dispersant SHMP.

2.2.4. Zeta Potential Measurements

Zeta potential measurements were performed using a ZM3-D-G meter, Zeta Meter system 3.0+, with direct video imaging from Zeta Meter Inc., Staunton, VA, USA; at Universidad Federal de Minas Gerais, Belo Horizonte, Brazil. The measurements were carried out according to the following procedure: samples were classified through the sedimentation in 250 mL test tubes, with a mineral concentration of 80 mg/L to reach a particle size below 10 μm. Distilled water was used during the sedimentation procedure with the natural minerals, and the dispersant reagents solutions were used for the remaining sedimentation tests. The pH of the mineral suspensions, with or without dispersant reagents, was adjusted at the beginning of the sedimentation procedure. Before each test, the completely opened Zeta Meter cell was first washed intensively with tap water, and after that, with distilled water. Before each measurement, the platinum and the molybdenum electrodes were washed with distilled water. The voltage used in the test was always the highest possible voltage that did not generate vortex due to the heating of the suspension during the measurements.

3. Results and Discussion

3.1. Physicochemical Characterization

Basic physicochemical characteristics were given in Table 1. The chemical analyses of two sludge samples show significant differences, and therefore, that was the main reason why they were selected for further comparisons. Sludge I is significantly poorer in terms of desirable Fe content, and contains a significantly higher amount of undesirable gangue impurities, such as Si and Al. On the other hand, sludge II is richer in terms of Fe; and with lesser content of the Si and Al impurities than the sludge I, but still relatively high. Determined loss on ignition (LOI) contents, Si/Al ratios and pH values are very similar in both samples. The Si/Al ratios indicated the presence of free quartz and alumosilicates in both of the samples. Sludge II have higher density and S/L ratio than sludge I.

3.2. XRPD Study

The obtained results of the XRPD studies are shown at Figure 1 and Table 2. By comparison of these, it can be clearly seen that there are more or less similar qualitative mineral compositions, but with their different semi-quantitative contents. It can be concluded that sludge samples consist mostly of goethite-FeO(OH) and quartz (SiO2), which prevails over clay minerals. Also, the minor contents of magnetite, hematite, clinochlore and todorokite (with composition of: (Na,Ca,K,Ba,Sr)1−x(Mn,Mg,Al)6O12·3–4H2O), were determined.
Identification of clay minerals indicates that they are mostly of illite-sericite and kaolinite composition, and with chlorites, which appears only sporadically. Sericite is mainly of the muscovite mica type.
The results of determined densities (Table 1), obviously confirm the XRPD results (Table 2), and the correlation between sample mineral composition and their densities. Namely, increase of goethite (4.27–4.29 g/cm3) content increases the sample density, whereas increase of quartz (2.65–2.66 g/cm3) and clays (2.79–2.80 g/cm3) contents decrease it (https://www.mindat.org).
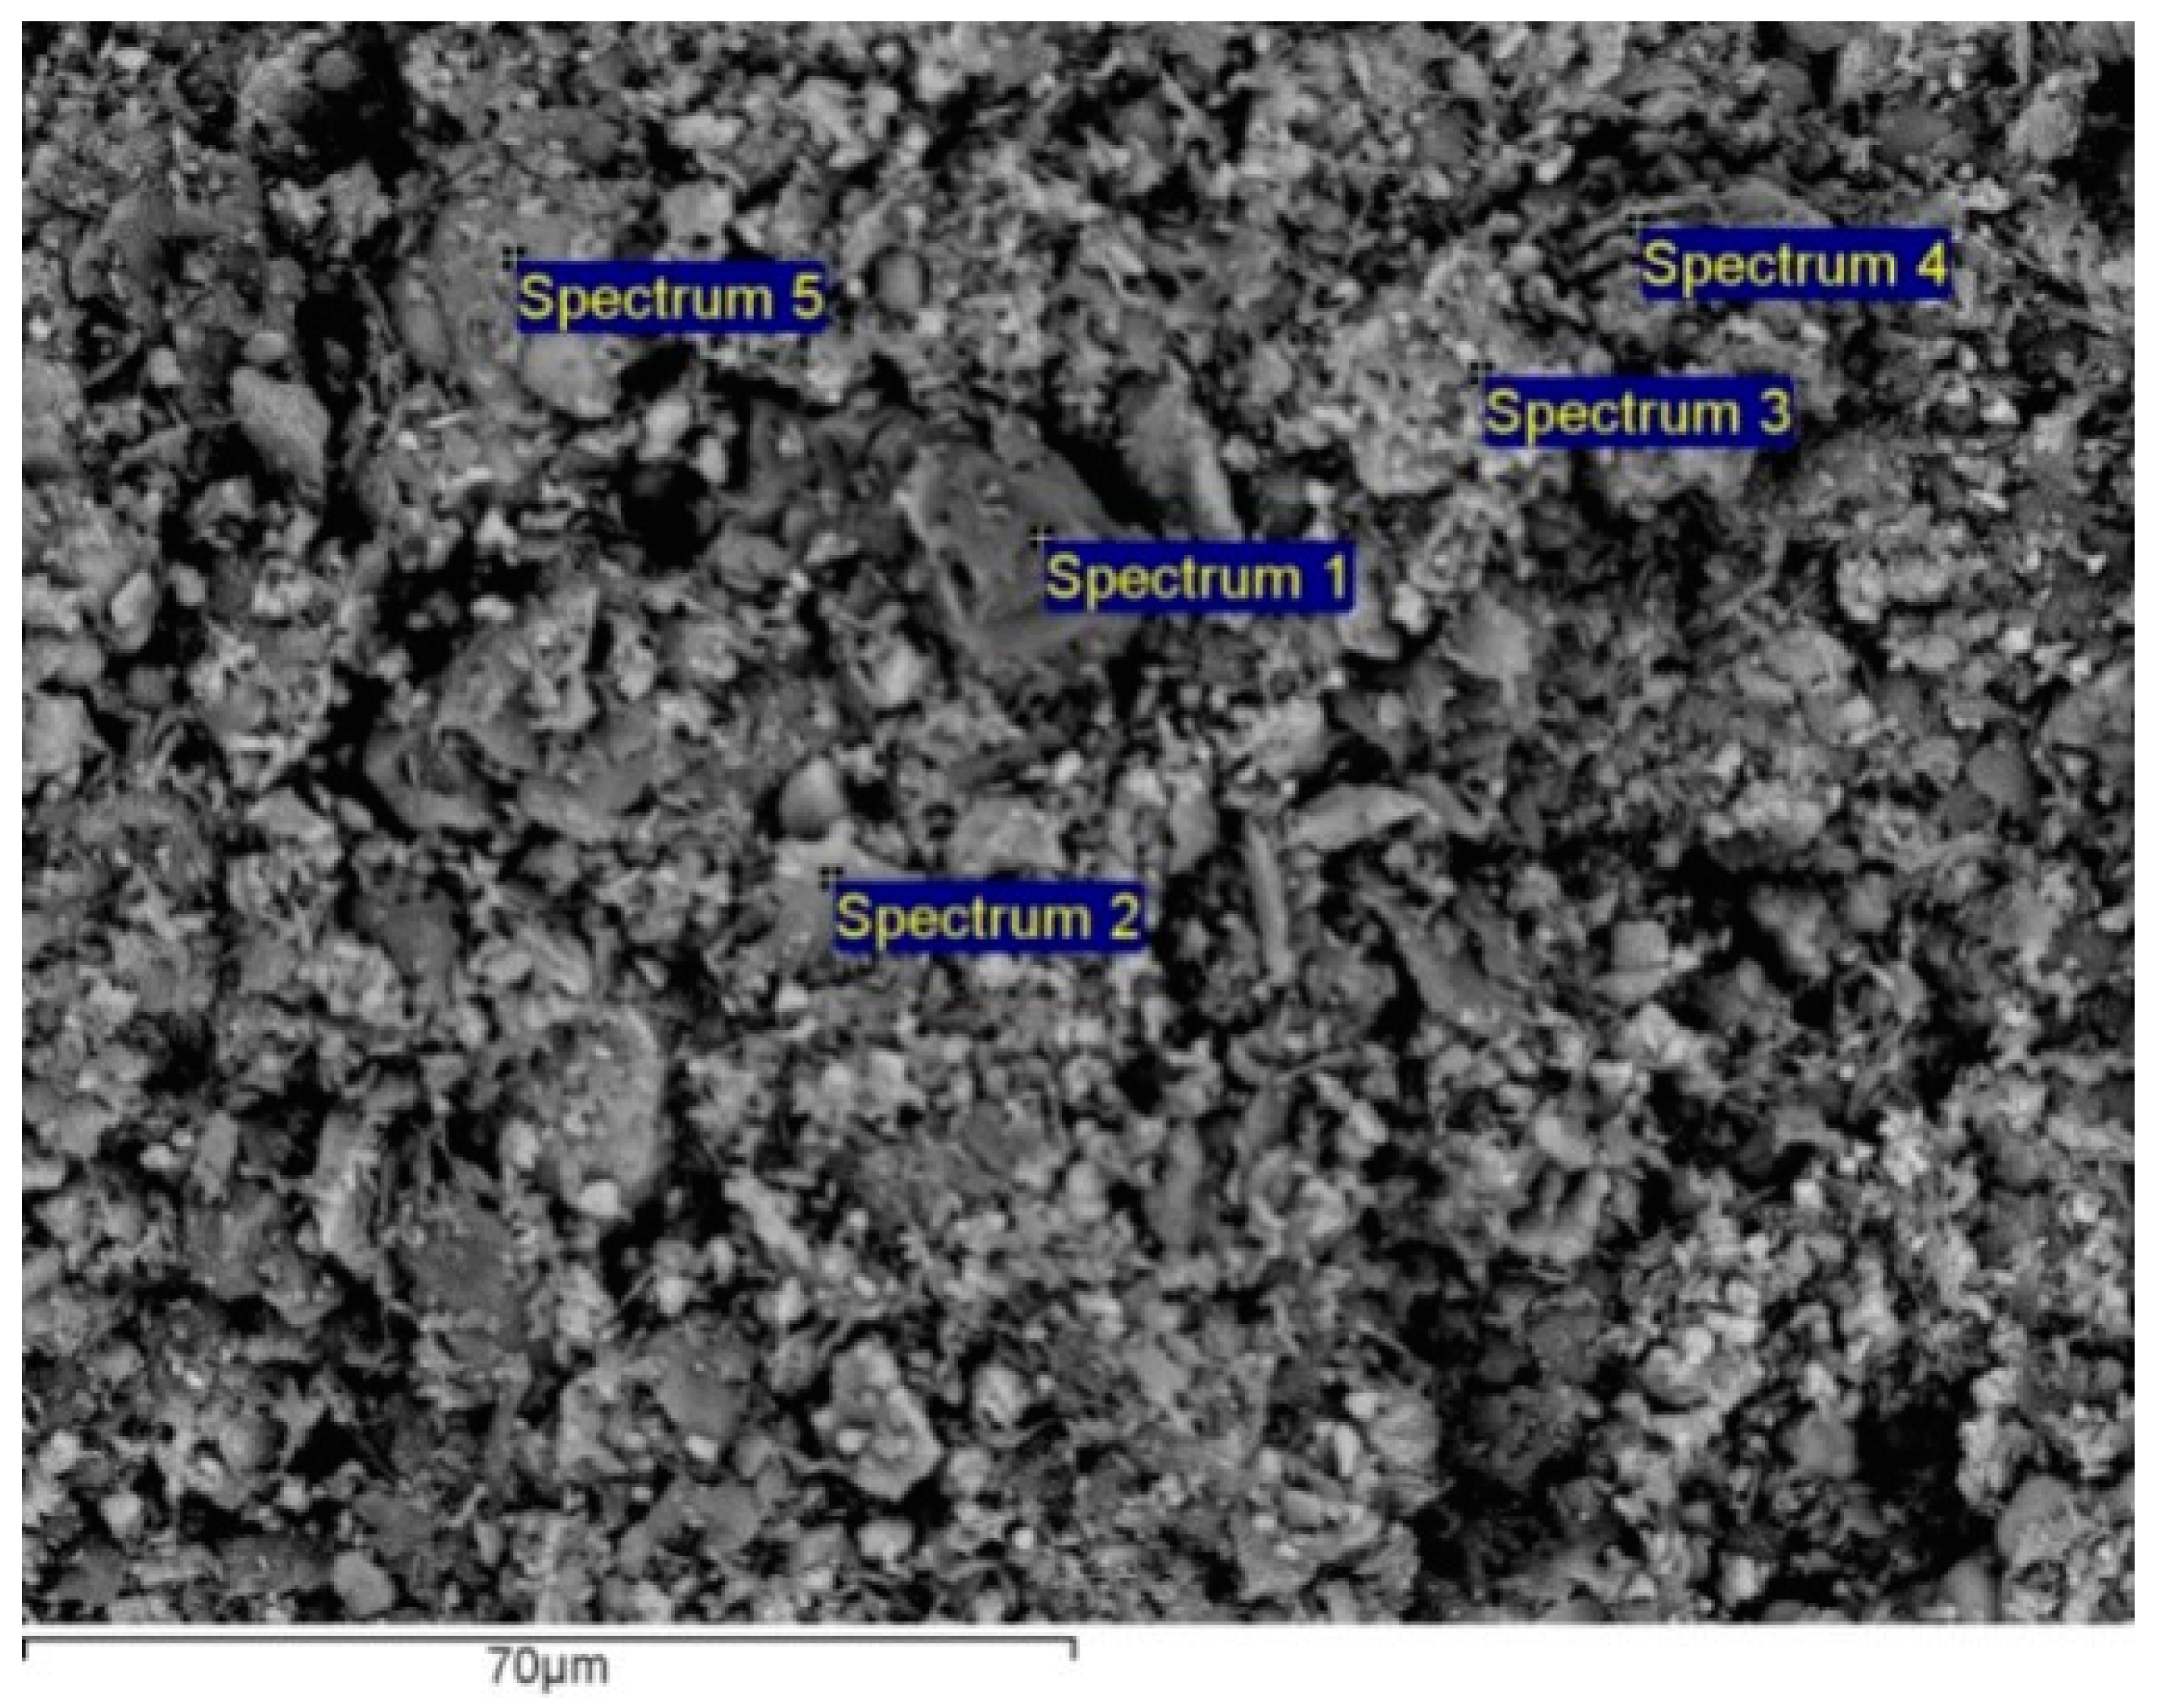
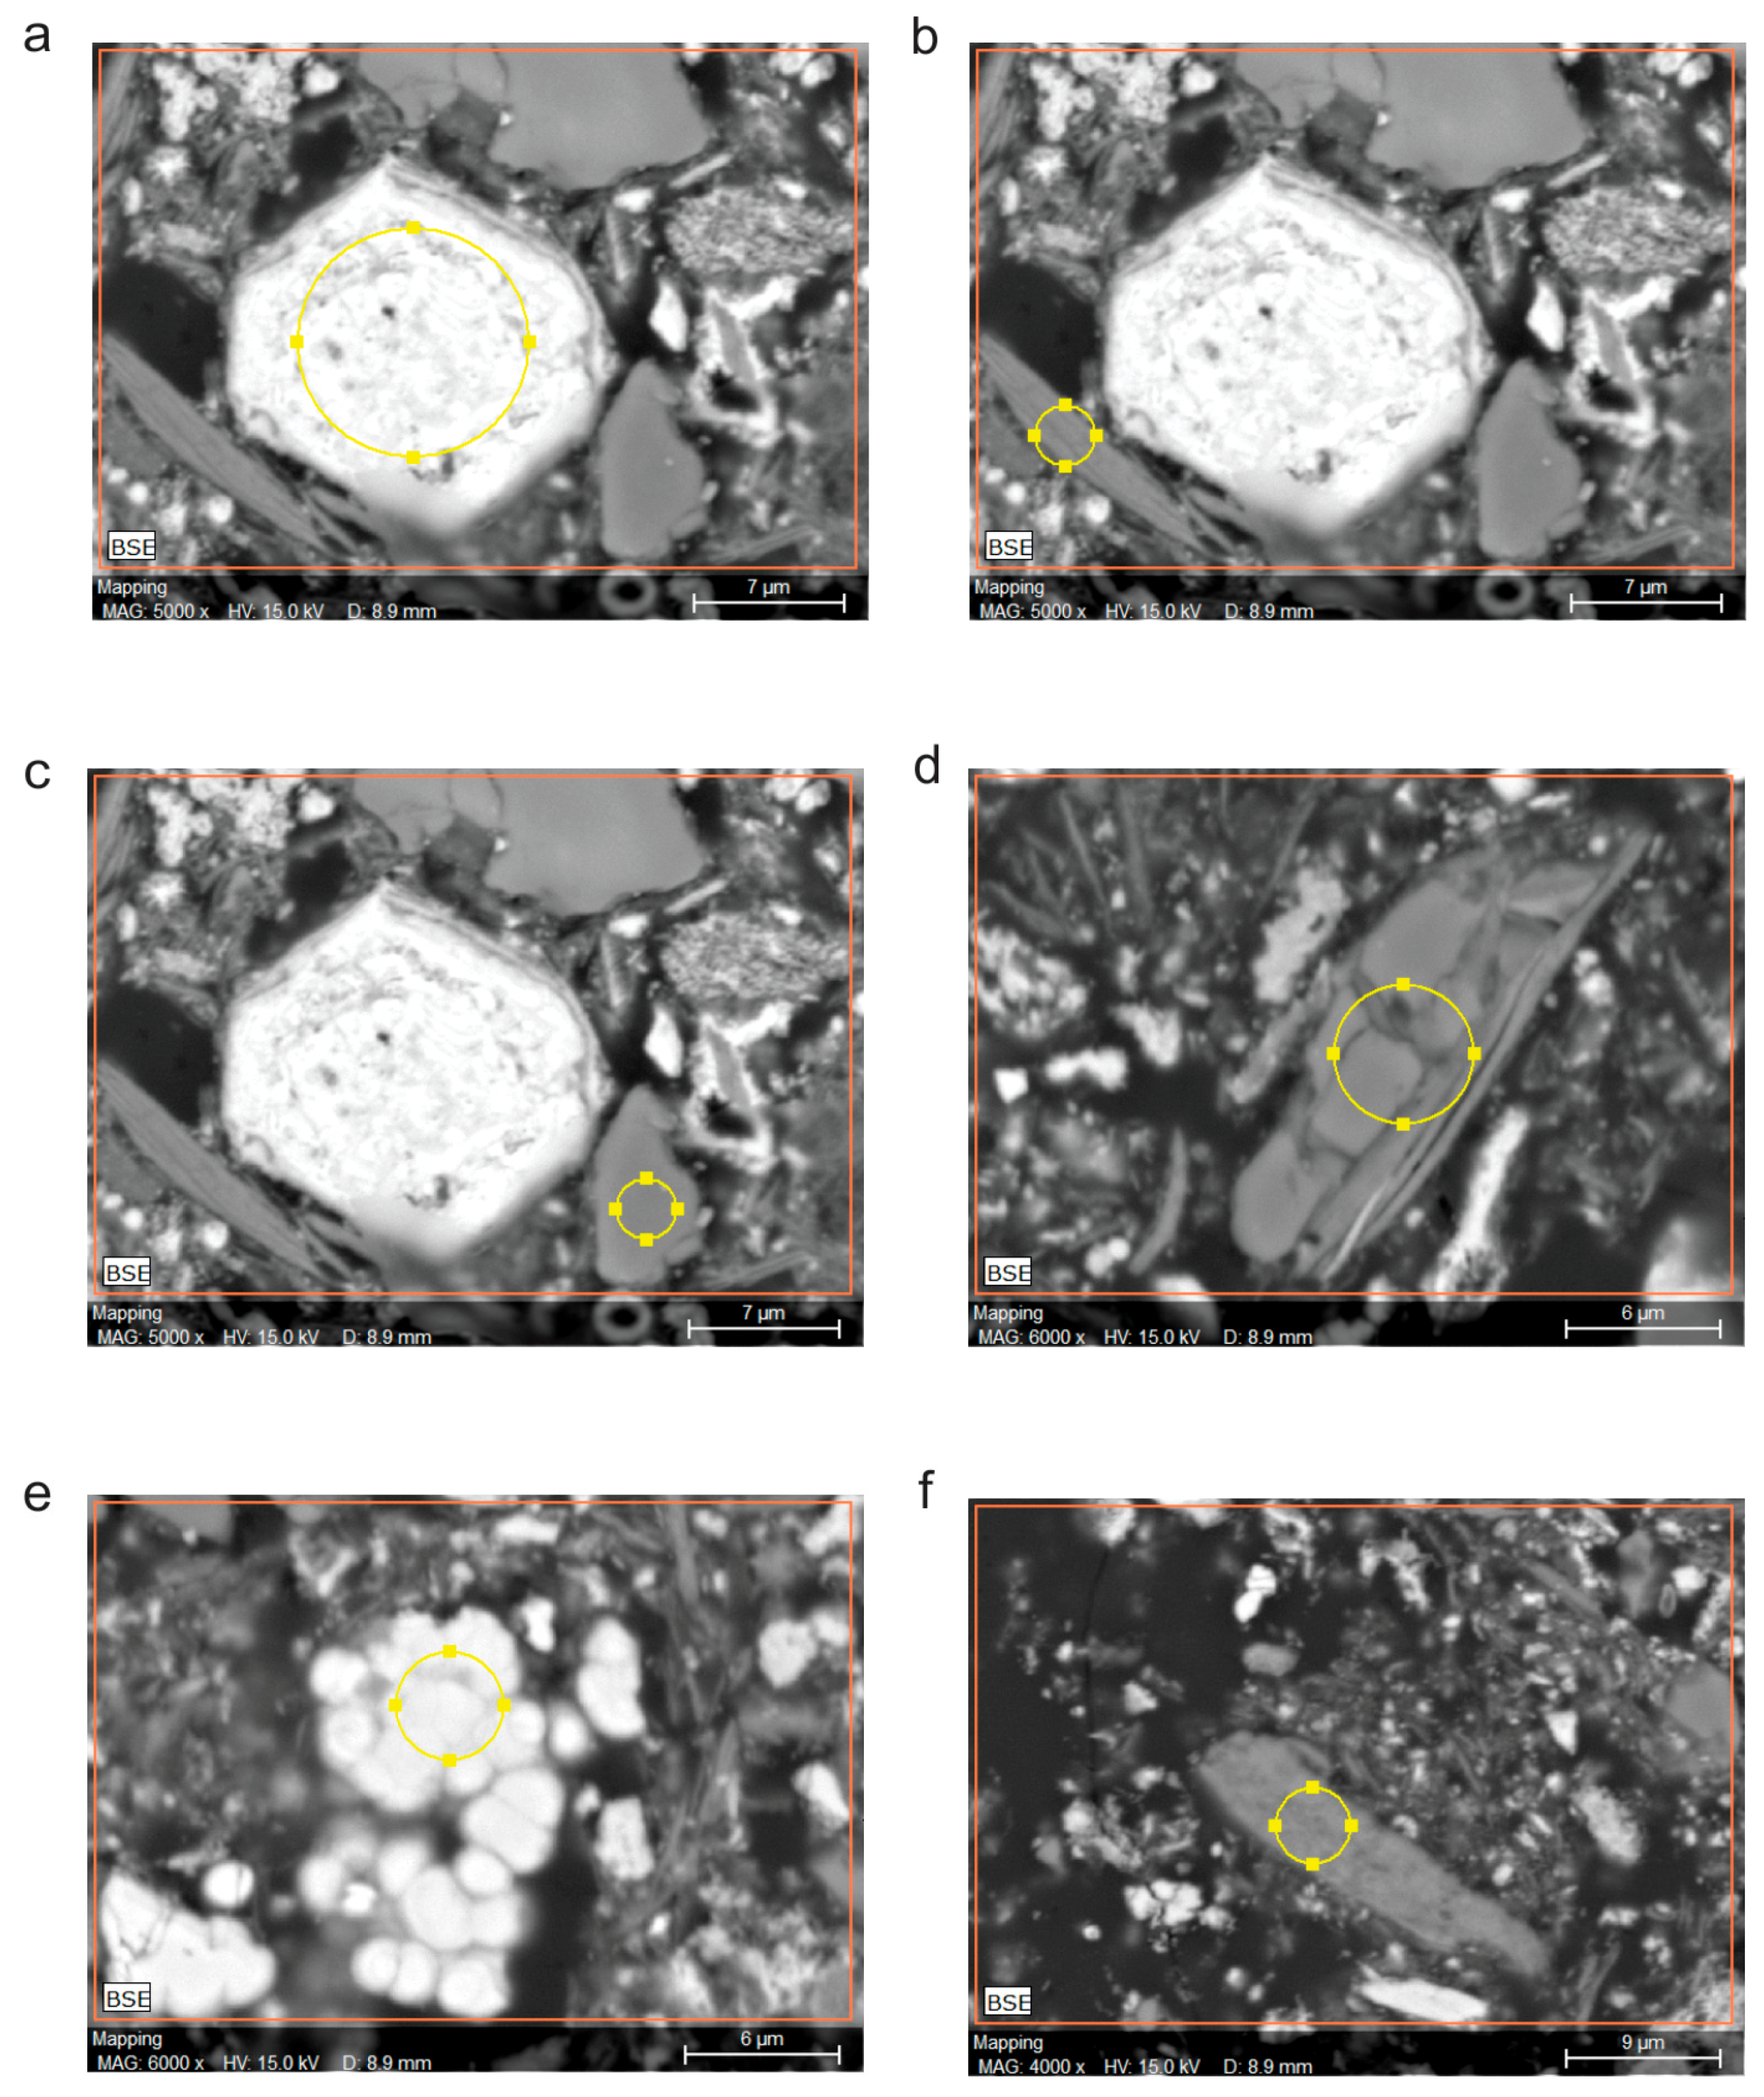
3.3. FTIR Study

The obtained results of the FTIR studies are shown in Figure 2 and Table 3. Identification of the present mineral phases was done using adequate references [20,21,22]. The obtained results are in very good accordance, and mainly confirm XRPD results of the previously determined qualitative and semi-quantitative mineral compositions.

3.4. SEM-EDS

SEM-EDS was used for the morphological, structural and chemical composition study of sludge samples, and results are shown at Figure 3 and Figure 4, and Table 4 and Table 5. For defining a more precise elemental and mineral composition, analyses of selected points on the surface were done. These points were primarily selected by choosing different grains with various colors, brightness, types of crystals, shapes and textures, and with the main purpose of analyzing as many different mineral species as possible. It is obvious that majority of the visible grains are very fine or ultra-fine, with sizes less than about 10 μm; bigger grains than these are with at less quantity, and is contrary to the much bigger grains determined for natural mineral raw samples [2].
SEM images and EDS chemistry of sludge I samples (Figure 3 and Table 4) show heterogeneity of mineral composition with the predominant oxide (and/or hydroxide) minerals consisting mainly of iron, silicon and aluminum; and with some Mn, Na and K, as well. Also, only rarely, there are some Ti and Cu impurities. Furthermore, Si/Al ratio indicates the presence of free silica (i.e., quartz), with or without Al-silicates.
X-ray microanalysis (EDS) data for selected points (Figure 3 and Table 4) confirm heterogeneity of sludge I surfaces with the following detected possible major phases, and which were calculated from compound % based on oxygen by stoichiometry: quartz (point 1); Fe minerals intricately associated with alumosilicates (point 2); Fe minerals (points 3 and 5); and alumosilicates (point 4). Small quantities of manganese minerals (or its impurities) have been also recorded at the points 2–5.
X-ray microanalysis (EDS) data for selected points of the sludge II sample (Figure 4 and Table 5), compared to sludge I sample, confirm the same heterogeneity of sludge surfaces. In addition, the same major possible phases were detected, i.e., Fe minerals associated with manganese (spectrums a and e); alumosilicates with K, Na and rarely Fe (spectrums b and f); and quartz (spectrums c and d). Therefore, it is obvious that the chosen points are of various types of crystals, shapes, textures, colors and brightness, and are adequate to the determined minerals. For example, Fe minerals are bright, whereas quartz and clay minerals are gray or dark.
One of the most limiting factors for determination of the mineral phases from EDS data is its inability to measure hydrogen, since goethite and clay minerals contain considerable amounts of OH groups and/or H2O. According to that, we can only speculate about these possible phases. However, we believe that the obtained SEM-EDS results are also in very good accordance and that they mainly confirms XRPD results of the previously determined qualitative and semi-quantitative mineral compositions presented in this paper (Figure 1 and Table 2). Besides that, all of the presented results are further in very good agreement with those previously obtained for the mineral raw material [2].

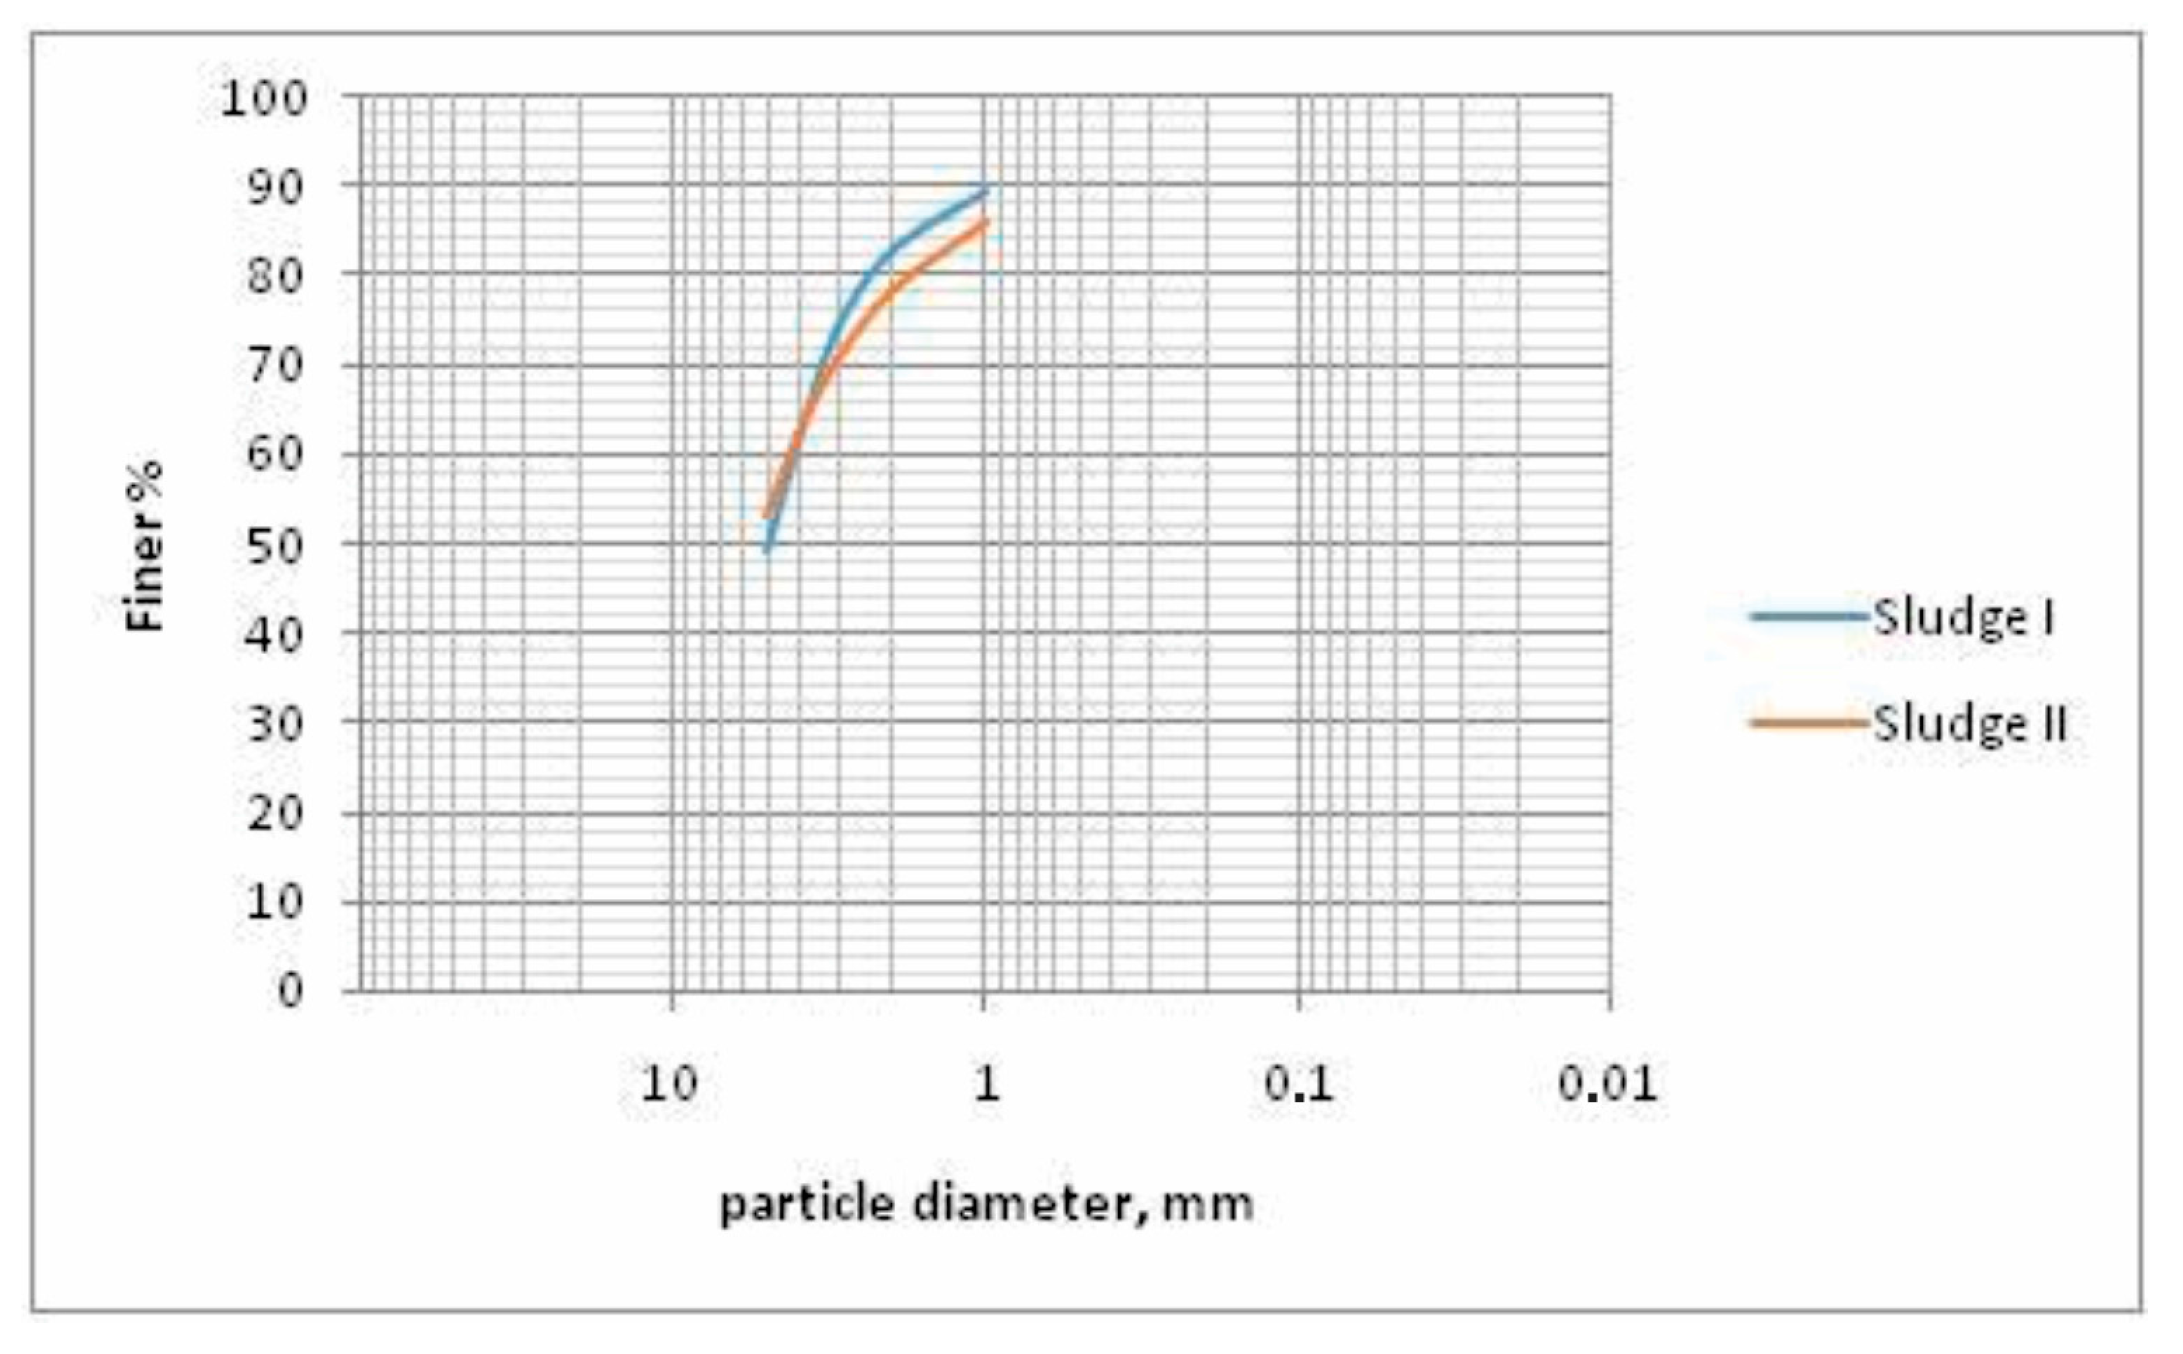
3.5. Particle Size Distribution Analyzes

Comparative results of particle size distribution analyzes of two samples of sludge, given in Table 6 and Figure 5, show that there is no considerable difference in the classes of particle size distribution of these two samples. However, it is clearly noticeable that in both samples, the highest mass percentage (~50%) belongs to the finest classes, i.e., to those bellow 6 μm. Furthermore, almost 3/4 of the samples belong to the classes below 13 μm, confirming the SEM-EDS results (Figure 3 and Figure 4).
In both samples, iron content was also determined for every size class separately (Table 6). The Fe content by particle size classes is quite uniform and generally is in accordance with the initial measurements. Calculated units of Fe compared to initial values show the largest iron content in the size class bellow 6 μm. Although in some classes a slightly higher iron content is observed by comparison with the initial one (such as 6–9 μm; Table 6), these differences are not sufficient reason for further research to be done on separate classes. Particularly interesting is that there is no big difference in the classes of particle size distribution between the two samples, although the mineral phases are present in various contents (Table 1, Table 2 and Table 3). This indicates that all of the identified mineral phases, both useful (such as goethite and other Fe minerals) and useless (i.e., gangue minerals, such as quartz and clays), are present in the sludge samples in very similar contents in all of the particle size classes. As these minerals mainly appear as fine and ultra-fine particles, this makes the system very complex for further separation processes.
Some other recently presented results of particle size distribution of the limonite sludge that occurs as a hydro-cyclone overflow in the Omarska iron mine [23] are also in accordance with those listed here.

3.6. Initial Settling and Flocculation Studies

The main goal of initial settling and flocculation studies was to compare the behavior of two sludge samples with different S/L ratios; and with or without flocculant. Additionally, the possibility of selective separation of iron minerals and quartz was studied, due to the fact that quartz was determined as the main impurity by the present research (Figure 1, Figure 2, Figure 3 and Figure 4 and Table 1, Table 2, Table 3, Table 4 and Table 5).
Based on previous experiments of limonite and clay settling [24], it can be concluded that the distribution of limonite in settled product is significantly higher than the distribution of clay, with the use of any applied flocculants, regardless of the time of settling, and the type and concentration of applied reagents. Distributions of limonite in the settled product in laboratory experiments under test conditions were within the range of 80–100%. The distributions of clay in the overflow were within 20–50%, which, translated into industrial conditions, means that the settled product with over 51–55% of Fe can be easily obtained, with mass utilization of over 80%, compared to the initial sludge. This is possible, because industrial sludge in Omarska contains over 40%, and sometimes more than 50% of Fe. On the basis of the Fe content in settled product, we believe that it would be, after consolidation, very interesting for application in the field of metallurgy.
For initial settling investigations, under best conditions, the same procedure used for investigations of settling rate on natural limonite samples [24] was applied. These experiments aim to demonstrate the possible impact of different input samples on the behavior of settling rate, naturally and also in the presence of the flocculant. Furthermore, the effect of solid concentration was examined by using different ratios of solid/liquid. In such manner, we tried to define the behaviors of these samples, as well as to determine if there is a difference between samples from plants for the preparation of mineral raw materials “Omarska” (which S:L ratios are usually of 1:7; 1:8; or 1:9), and possible influence of mineralogical, chemical or particle size distribution analyses.

3.6.1. Natural Settling with Different S/L Ratio

As it is well known, forms for calculating the grain fall rate cannot accurately determine the rate of precipitation, due to the defects in the correct values for correction coefficients that take into account the irregular shape of the grain, the changings of fluid density and in particular, the questions related to the flocculation or dispersion of the smallest classes resulting from the charge of the grain.
At the beginning of precipitation, in diluted pulp, and under free fall conditions, deposition rate is relatively large and constant. The smaller the angle between the straight line of the curve and the ordinates, the greater the speed of compaction. When crossing into the area of plunged fall, the rate is rapidly reduced and the graph gets a rectilinear character. As the density increases in the thickening zone, the curve is asymptotically approaching a constant value that depends on the thickness of the precipitate layer of the precipitated product. A defective point is called a critical deposition point. The prevailing opinion is that for the critical point of precipitation, the beginning of the precipitation curve should be taken. The critical rate (Vav) in this paper is calculated as: Vav = H/tcr (mm/min); where H is height of the clear zone during critical time (in mm), and tcr is deposition time required to achieve a critical deposition point (in minutes).
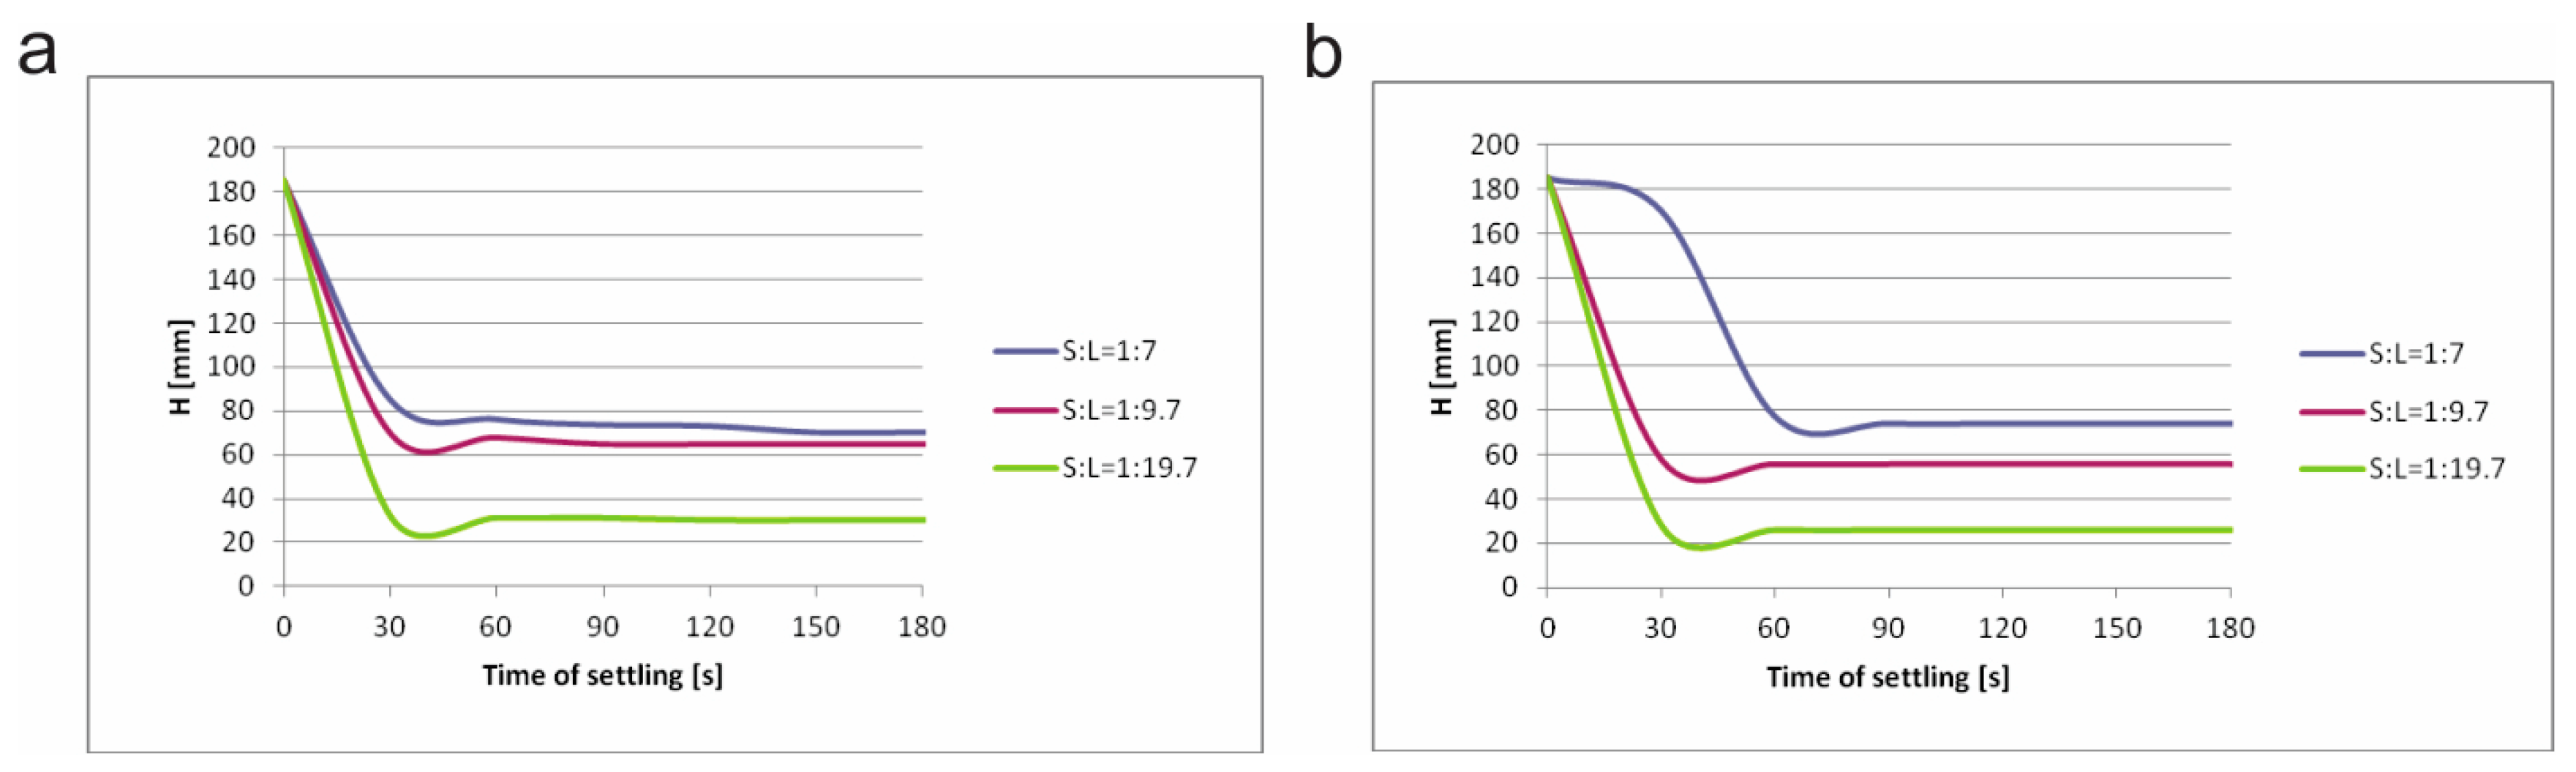
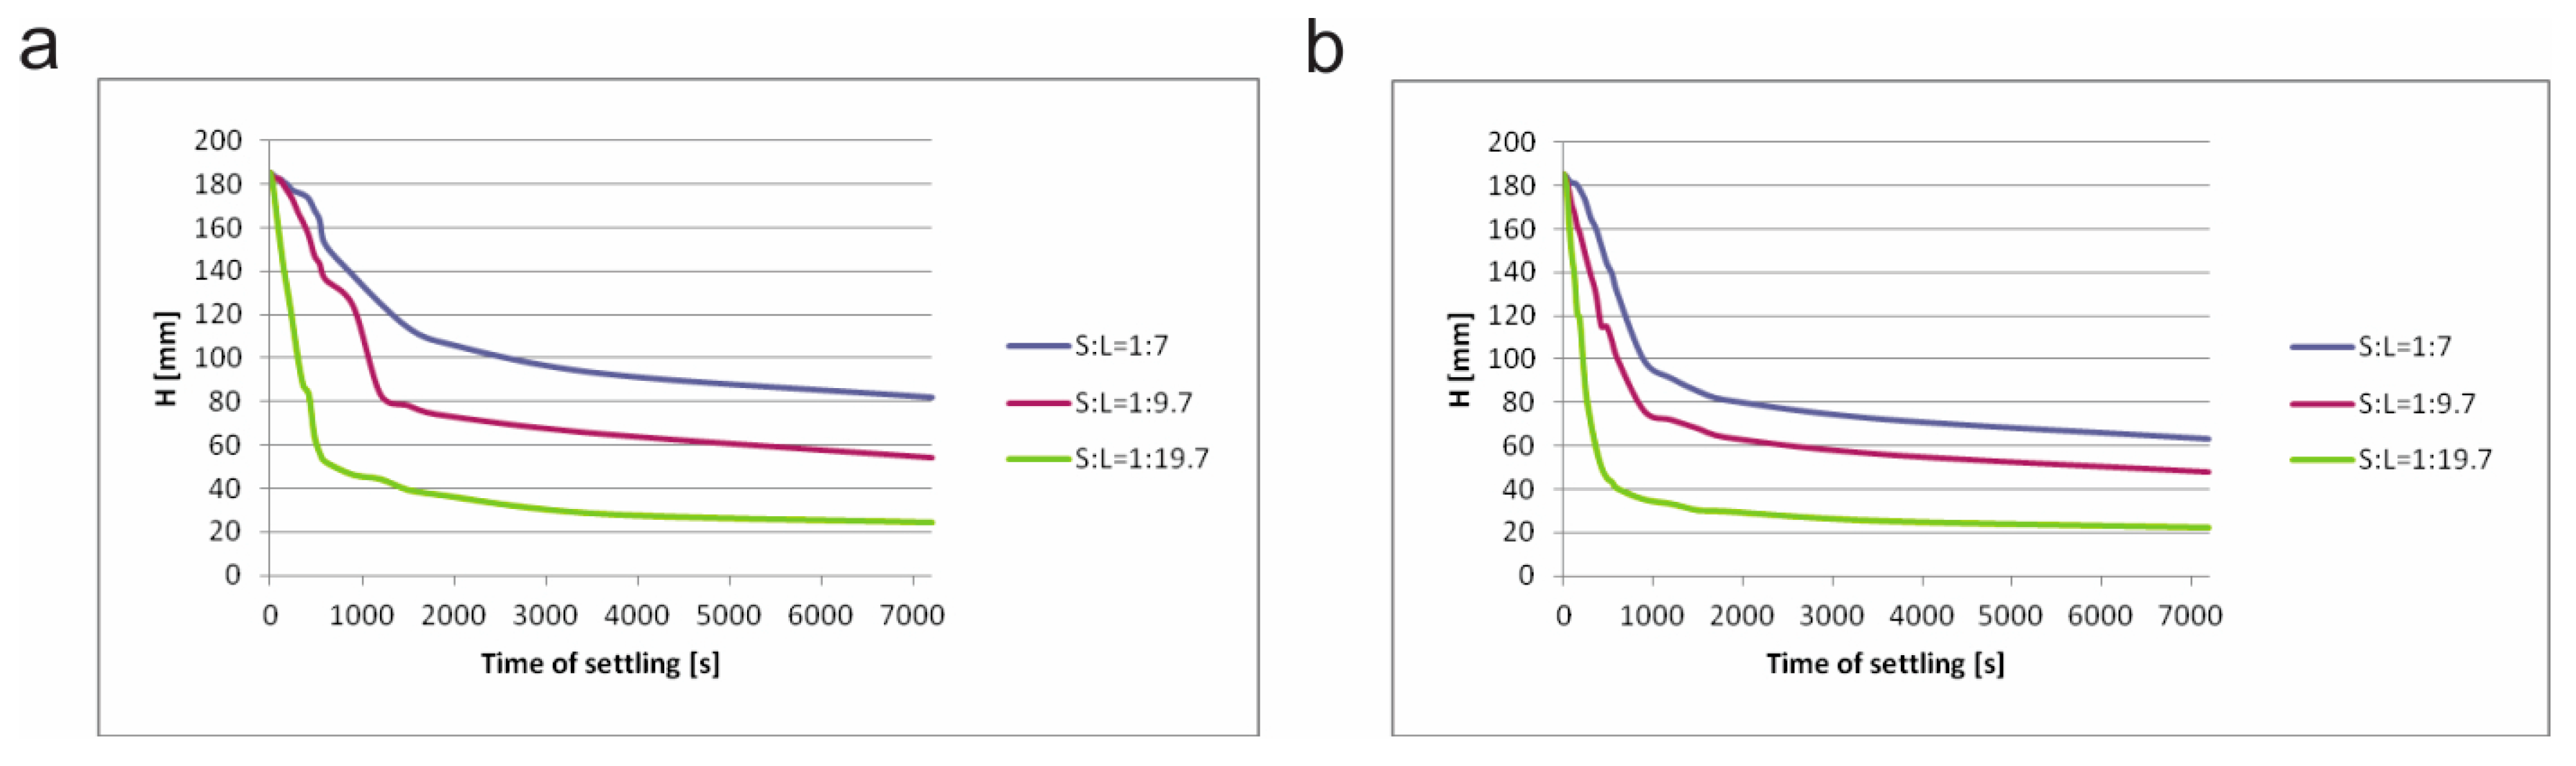
In Figure 6, natural settling curves of sludge I and sludge II with different ratios of S:L are shown. Generally, there is no big difference in settling behavior between these samples. However, sludge II sample has a higher settling rate as expected due to its higher density and higher contents of Fe minerals in its composition (Table 1, Table 2 and Table 3). If we compare the effect of solid concentration, in all three cases, sludge II has a higher deposition rate. Also, samples with smallest solid/liquid ratio have the highest settling rates in both cases, which is in accordance with some other studies [25].

3.6.2. Settling with Different S/L Ratios with Additional Flocculant A100

In Figure 7, settling curves of both samples with different ratios of S/L, and with additional anionic flocculant A100, are shown. Figure 7 shows that there is relatively small difference between sludge I and sludge II. In all cases settling starts fast, i.e., only after 30 seconds from the beginning, regardless of the S/L ratio; or the type of sample. However, by comparison with natural settling (Figure 6 and Figure 7), it can be clearly seen that the settling rate is obviously improved with additional flocculant.
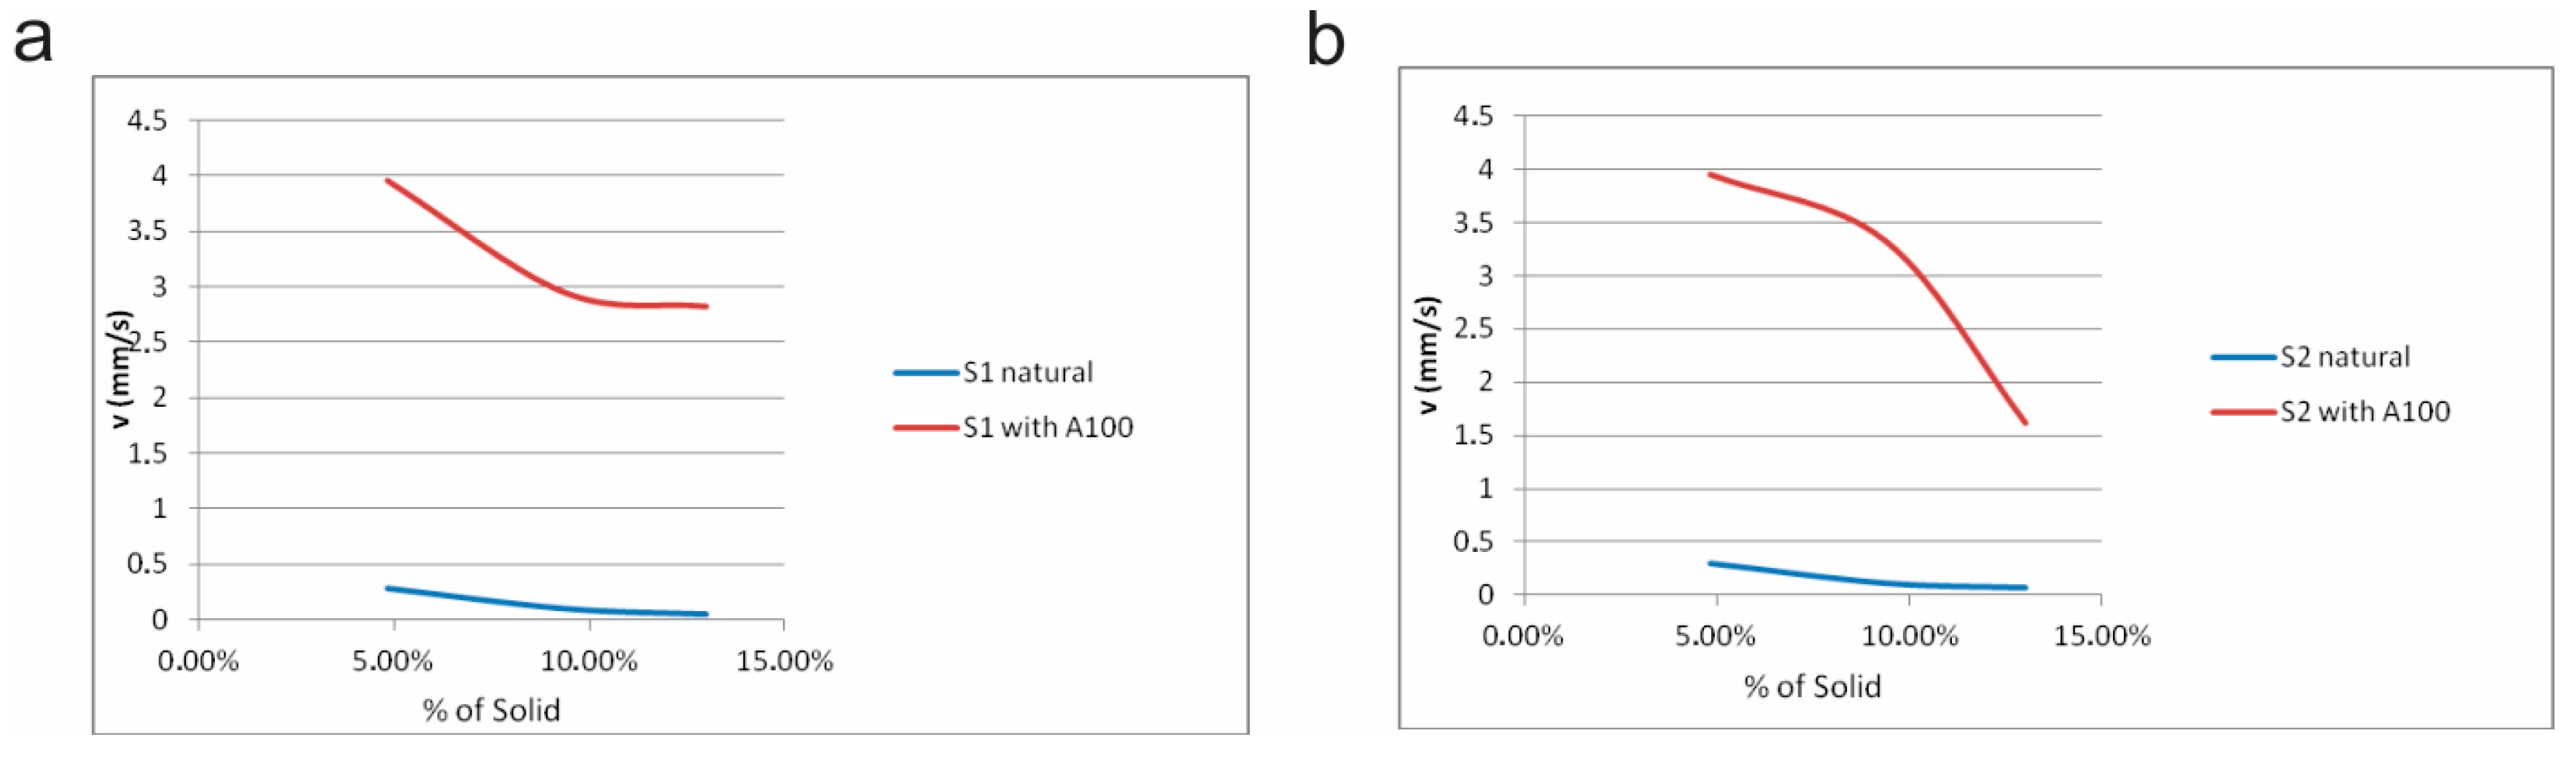
In Table 7 and Figure 8, comparisons of critical settling rates are shown. From these, it can be clearly seen that in the case of natural settling, there is no significant increase in the critical settling rates, regardless of the S:L ratios. The differences between the rates in the relationship of S:L are greater with higher percentage of the liquid phase in both samples. It is important to emphasize here that such diluted pulp is unusual for plants from which the samples were taken (i.e., the overflow of the hydro cyclone), but it was used in the experiment for easier detection of the behavior of the mineral particles and the influence of the solid/liquid ratios.
However, with the addition of the flocculant, these rates increase significantly with the increase of the liquid component in both of the samples. Furthermore, the differences in critical settling rates between samples in the presence of the flocculant are also obvious. These differences obviously depend on the various mineral compositions, because sludge II contains significantly higher content of iron minerals than sludge I (Table 1 and Table 2). Obviously, the effect of flocculant in the heterogeneous system depends both on the mineral composition and their quantity; as well as on the S/L ratio.
Effect of solid/liquid ratio on settling rate was confirmed by the results of hindered settling rate which was calculated according to the Richardson–Zaki equation [25]. This equation describes a method for calculating the sedimentation rate in a liquid-solid system as a function of the free falling rate of a single particle and the concentration of particles. From Table 8, it can be seen that samples with the smallest solid/liquid ratio have the highest settling rates in both cases.

3.6.3. Testing Selectivity of Flocculation with Flocculant A100 and Dispersant SHMP

As noted above, the dispersant and the flocculant were selected on the basis of results obtained earlier of the effects of certain reagents on the behavior of limonite and clay [24]. Namely, it was then concluded that the distribution of limonite in settled product is significantly higher than the distribution of clay, with the use of applied flocculants, regardless of the time of settling. However, at that time, behavior of quartz was not studied, due to the supposition of its insignificant contents and role. Some earlier studies showed that hydrolyzed polyacrylamide may be used for selective flocculation of hematite from quartz [25,26,27].
In this chapter, the influence of settling time on the selectivity was tested only at the iron richer sample (sludge II) with addition of sodium hexametaphosphate (SHMP) as dispersant. Initially, settling behavior was tested by monitoring the weight distribution and the content grade and recovery of Fe and SiO2 in floating and sinking part. The results of the distribution of masses and grade and recovery of Fe and SiO2 contents between the sinking and floating part in the function of settling time are presented in Table 9.
According to the obtained results, settling time does not play a significant role in the distribution of masses between the sinking and floating parts. Partial increasing of iron ore content after flocculation by comparison to the initial sample can be seen especially in the floating part. However, taking into account the distribution of masses, recovery of iron ore is relatively low, i.e., within a few Fe%; and, therefore, it is not quite satisfactory. However, as the content of iron partially increases by flocculation, this method should be considered as appropriate.
Separation indices are not calculated, because it is obvious from Table 9 that the selectivity has not been achieved. Theoretically, selective flocculation depends on many parameters, such as: surface chemistry of particles, particle size distribution, degree of dispersion of particles, functional groups of the polymer, etc. Specifically, heterogeneity of the mineral surface is one of the important factors in these cases. According to the cited papers, we expected that polyacrylamide is much less adsorbed on quartz. Unfortunately, in this case, this did not happen.

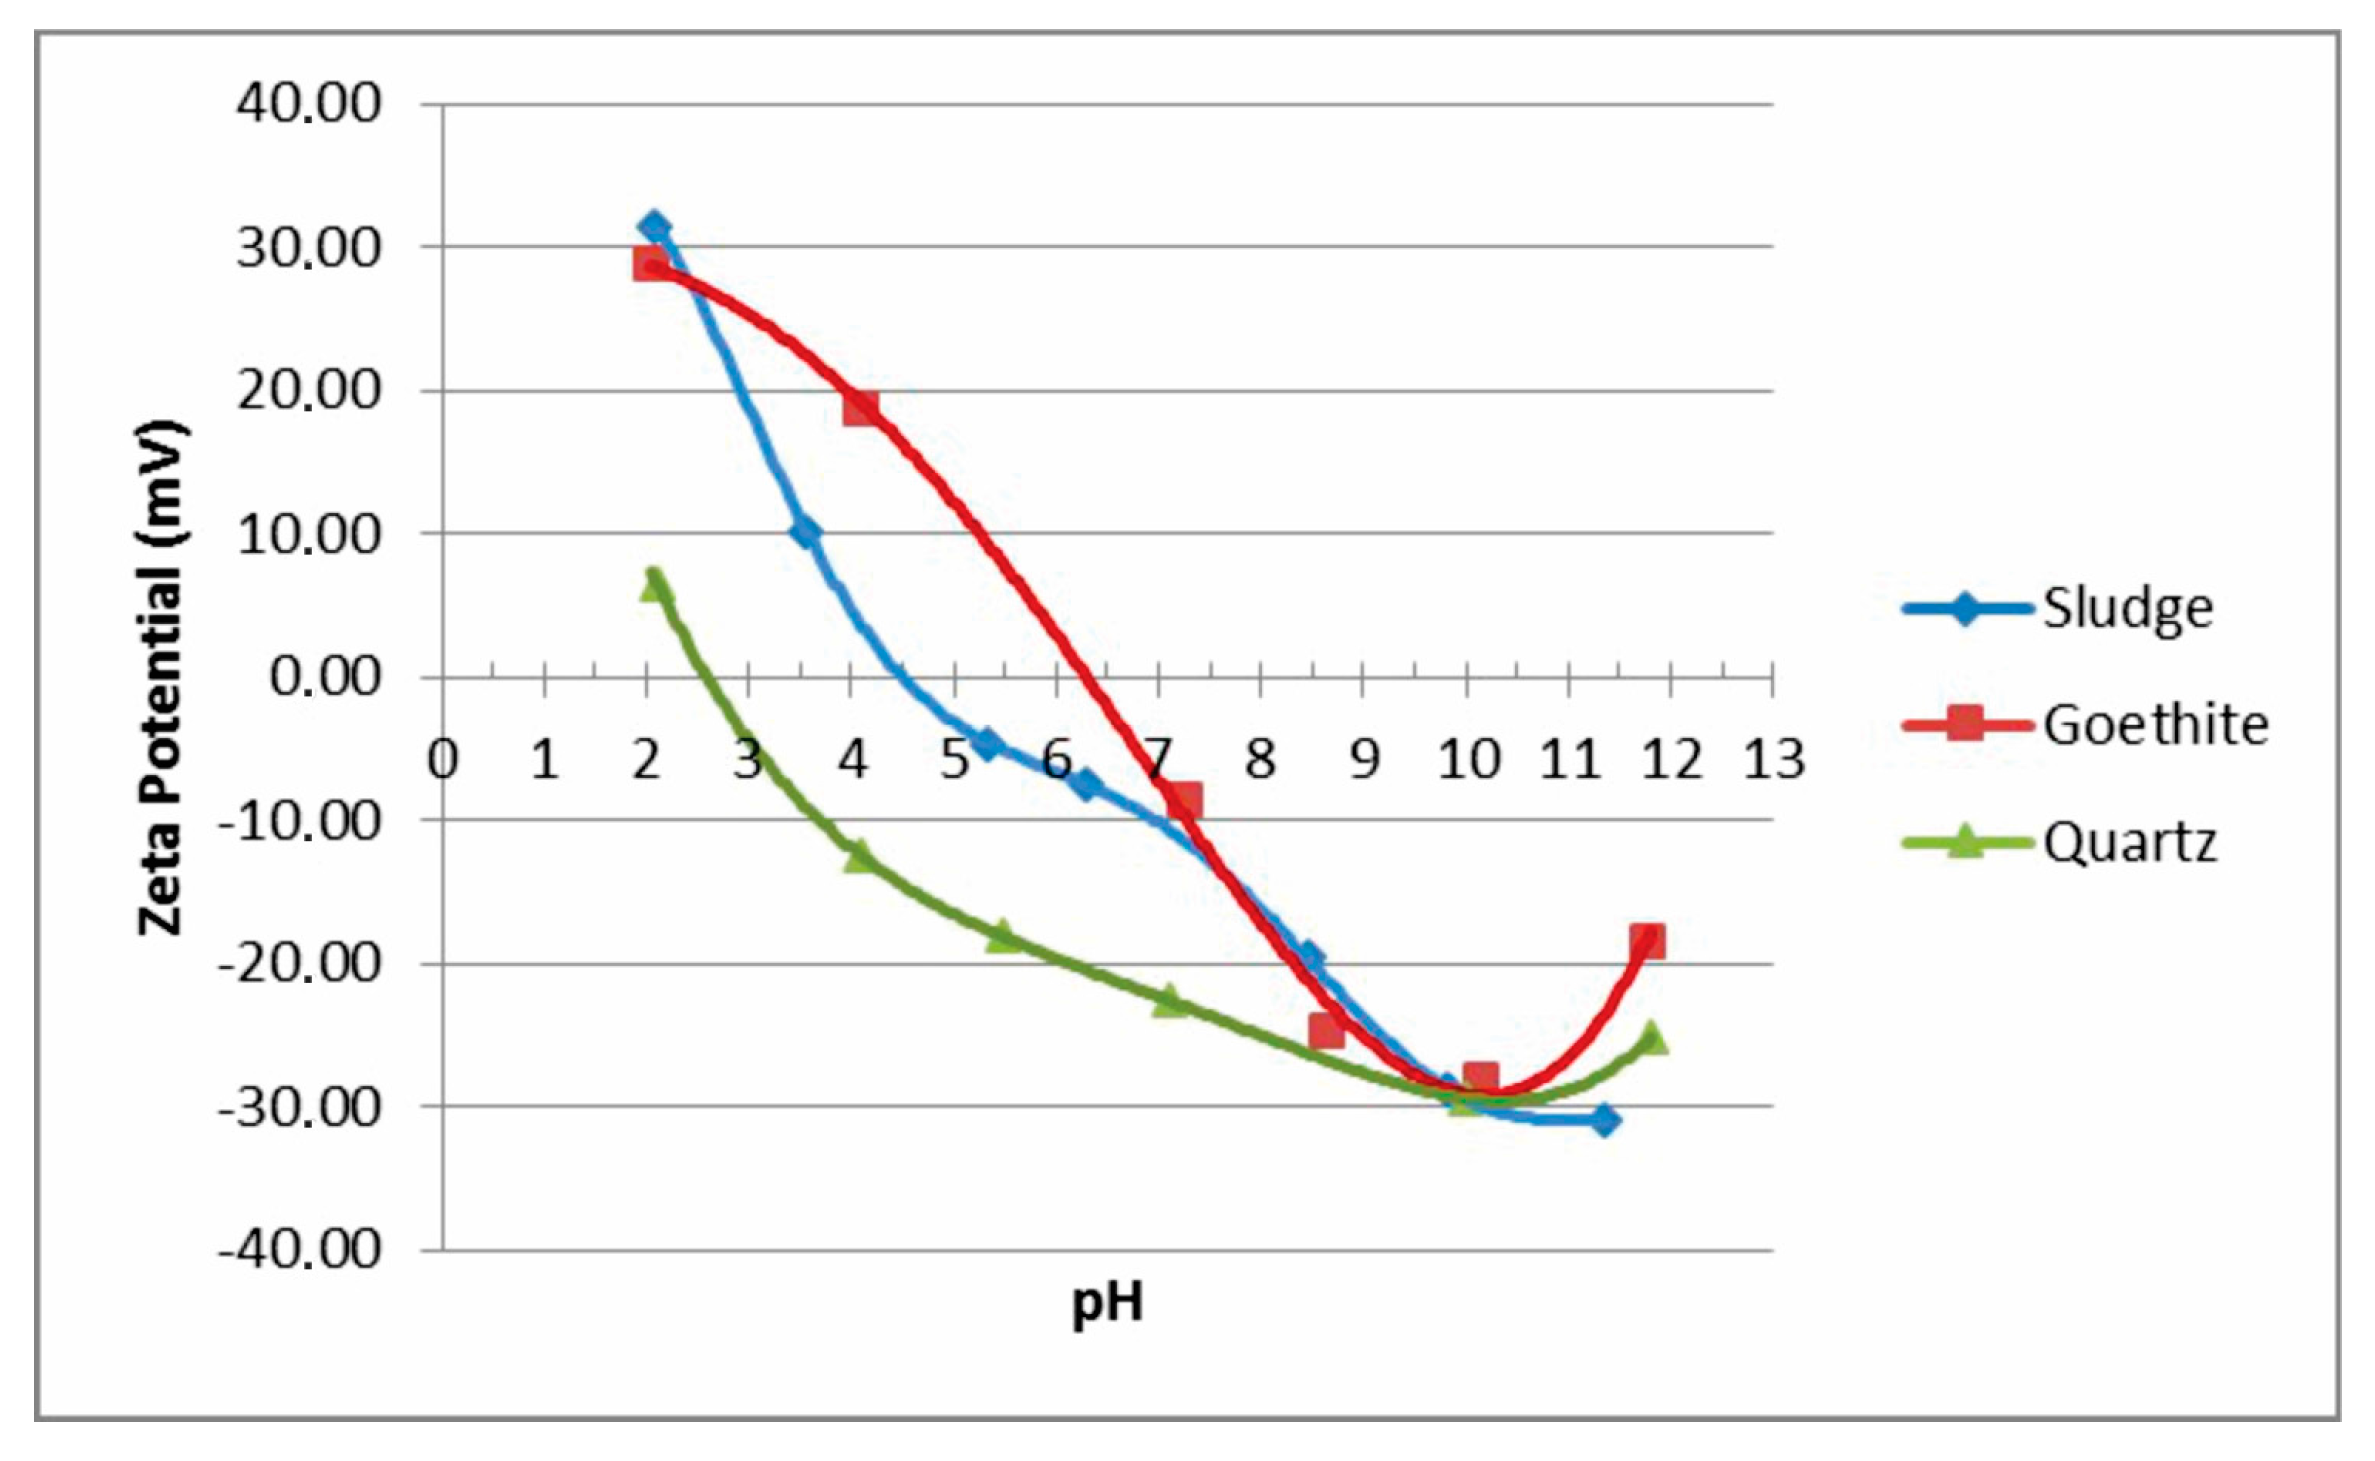
3.7. Zeta Potential Study

In order to better understand the influence of mineral composition on dispersion, in this chapter, results of zeta potential (ζ-potential) measurements were analyzed for the sludge itself, as well as for the individual goethite and quartz phases, which were previously identified as major minerals in the sludge samples (Figure 2 and Figure 3; Table 1, Table 2 and Table 3).
An important step in the selective flocculation process is to achieve stable dispersion of mineral particles. Dispersion stability of mineral particles is dependent on the zeta potential of present particles. The knowledge of zeta potential plays a significant role in understanding dispersion and interfacial processes, such as flocculation. Zeta potential is a measure of the magnitude of the electrostatic or charge repulsion/attraction between particles, and it is one of the fundamental parameters known to affect stability. Its measurement brings detailed insight into the causes of dispersion, aggregation or flocculation, and it can be used to improve the formulation of dispersions, emulsions and suspensions.
From a plot of zeta potential as a function of pH, a number of important data can be noted. Namely, isoelectric point (IEP) represents a condition when the value of zeta potential is zero. At such conditions, the dispersion is unstable, and there are no reflective forces present among the particles. A higher zeta potential produces dispersion. Also, particles with an IEP below pH = 7 have an acidic character, whereas those with an IEP above pH = 7 are basic (i.e., alkaline). This study was done by measuring of zeta potential in the various combinations of absence/presence of dispersant (SHMP), and also in the absence/presence of anionic polyacrylamide A100 (PAM) flocculant.
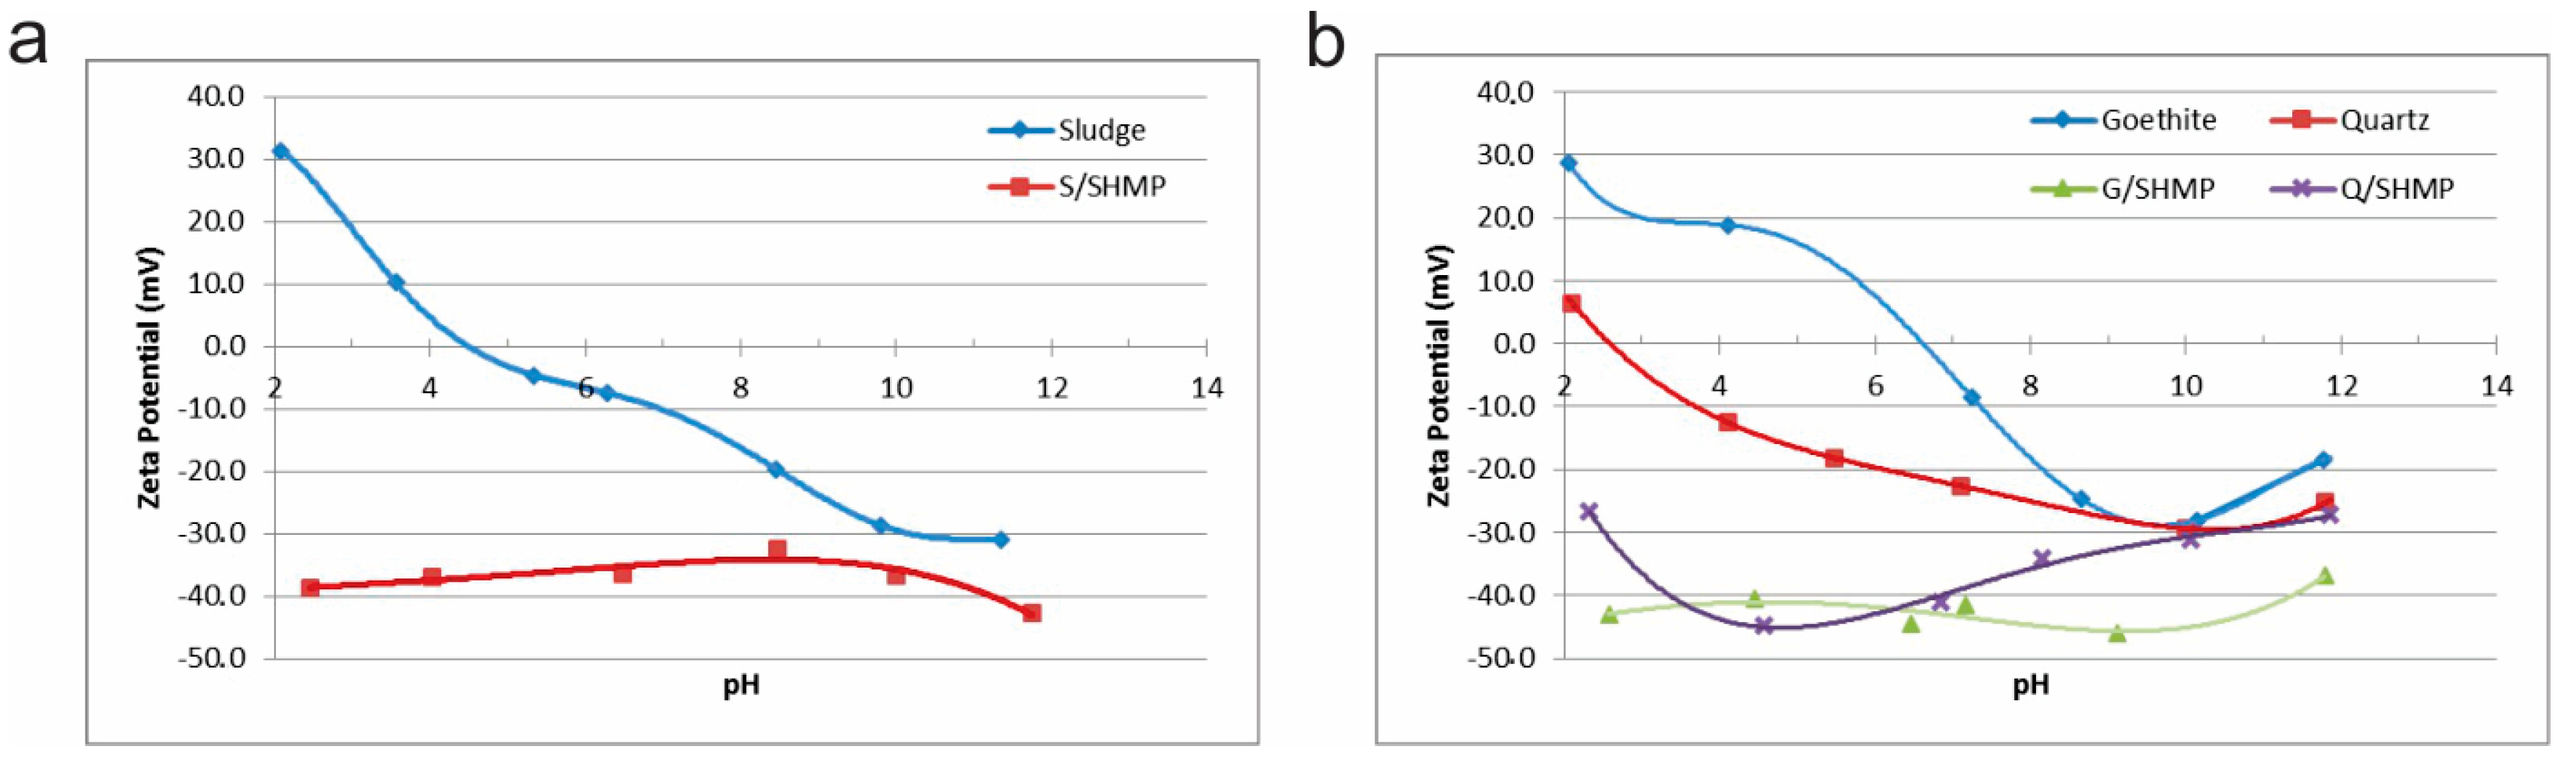
Zeta-potential curves for sludge II, and also for natural mineral raw samples of goethite II and quartz II, which were previously determined [2], are shown at Figure 9. The zeta potential curves for natural quartz and goethite are similar to various curves available in the literature [28], with the IEPs at pH = 2.6 and pH = 6.6 values, respectively. The IEP for sludge II that was found at pH = 4.5 confirms mineralogical heterogeneity on surfaces of particles. Namely, from the results obtained, it is obvious that the measured zeta potential and IEP value of sludge II mostly lie between the values of individual mineral goethite and quartz phases. Therefore, this most probably indicates to the presence of both of these individual phases on the surface of sludge particles. The magnitude of the negative zeta potential of all mineral particles is maximized at pH = 10 value.
The presence of sodium-hexametaphosphate (SHMP) dispersant obviously causes the increase of negative zeta potential magnitudes in all of the investigated cases, as it can be seen from Figure 10. Also, from these, it can be clearly seen that the surface charge remains negative throughout all of the investigated pH values, and for all of the samples. According to the well-known DLVO (Derjaguin, Landau, Verwey, Overbeek) theory, the stability of the suspension of colloidal particles is determined by the balance between the electrostatic interaction and the van der Waals interaction between particles. The addition of SHMP increases the negative charges on particle surfaces, causing better dispersion.
After addition of SHMP dispersant, the biggest difference of zeta potential magnitudes between goethite and quartz are also at pH = 10 (Figure 10b). For example, such zeta potential values at pH = 10 increase from −30 mV (without SHMP) to −45 mV (with SHMP) for goethite, but only from −29 mV (without SHMP) to −31 mV (with SHMP) for quartz. After adding SHMP, goethite is mostly more negatively charged than quartz. Also, behavior of sludge surface charge is very similar to goethite, and the surface charge remains negative throughout all of the investigated pH region (Figure 10a,b). The particles, regardless of their mineralogy, with negative zeta potentials of significant magnitude will remain dispersed due to the electrostatic repulsion. The energy barrier can be eliminated by neutralization of surface charge due to the adsorption of a suitable flocculant onto the particle surface and bridging between the particles. Flocculant adsorption can be measured by changing of the zeta potential after adsorption. If the polymer is adsorbed, there is a change in the surface of the particles, and thus the change in zeta potential.
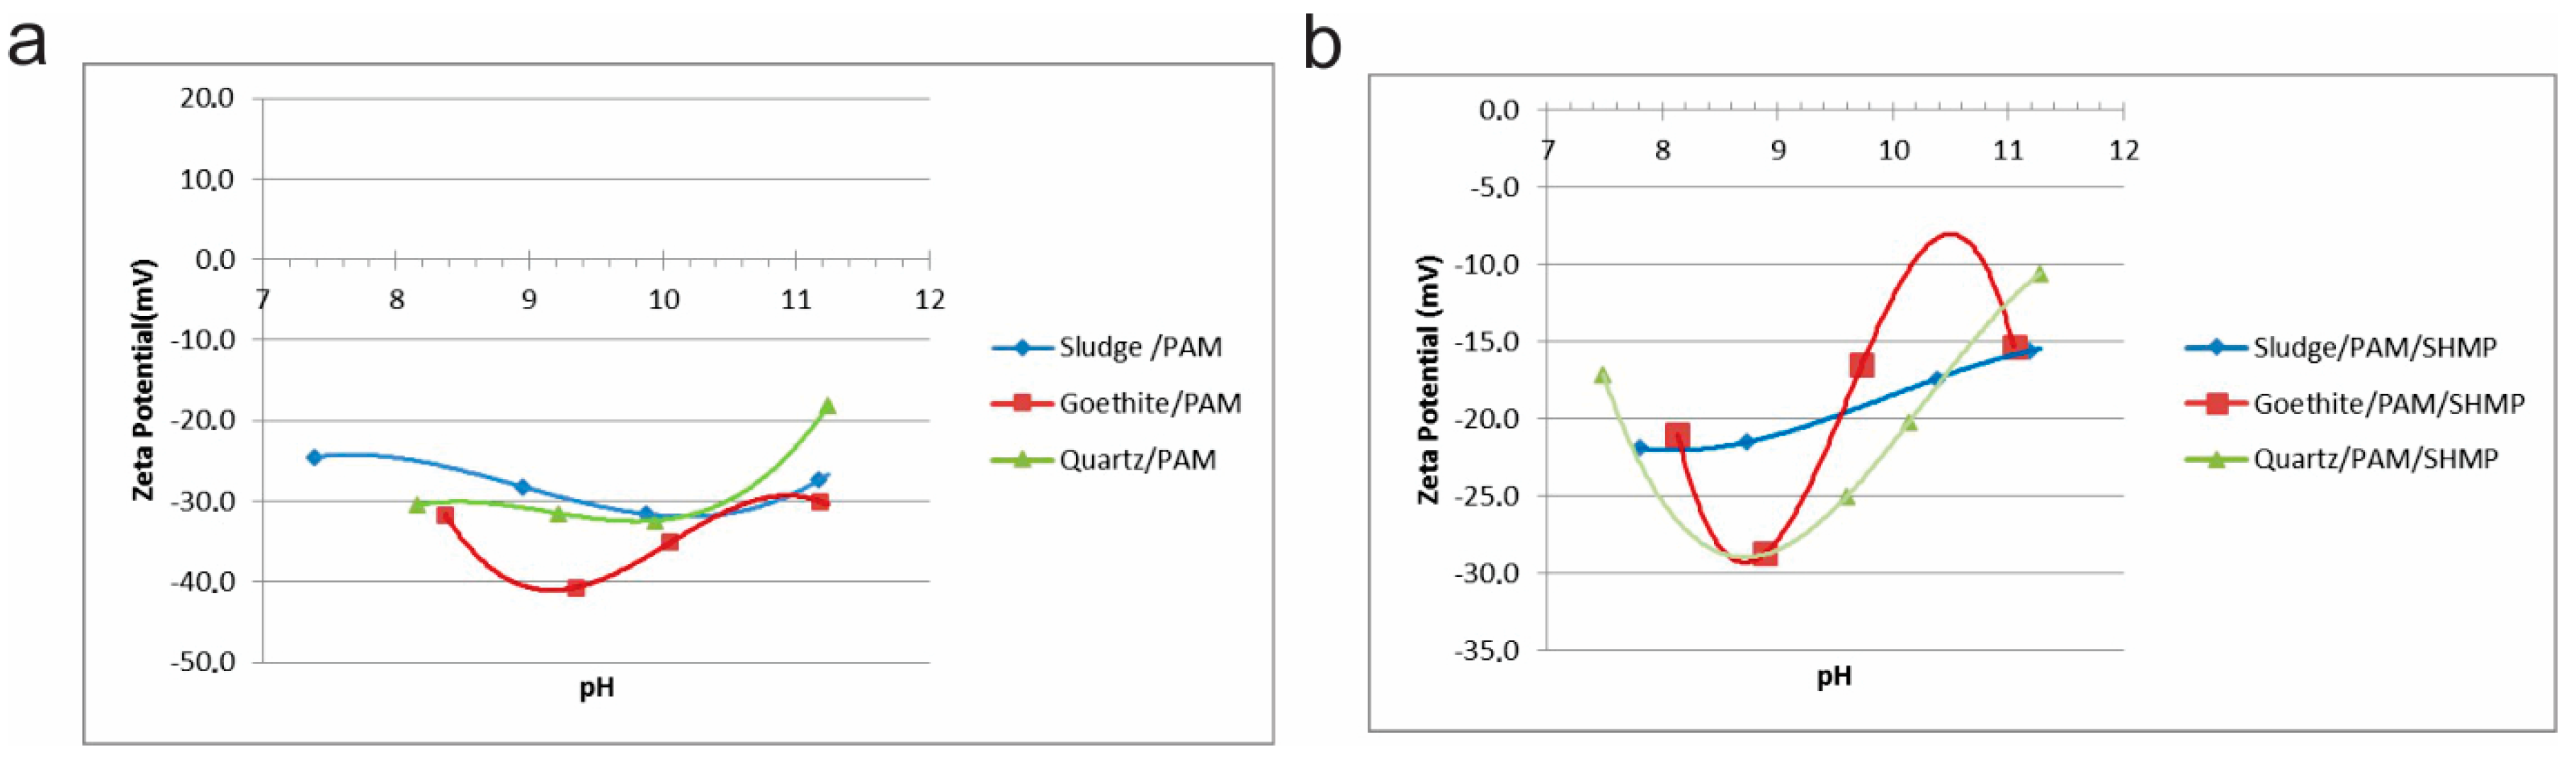
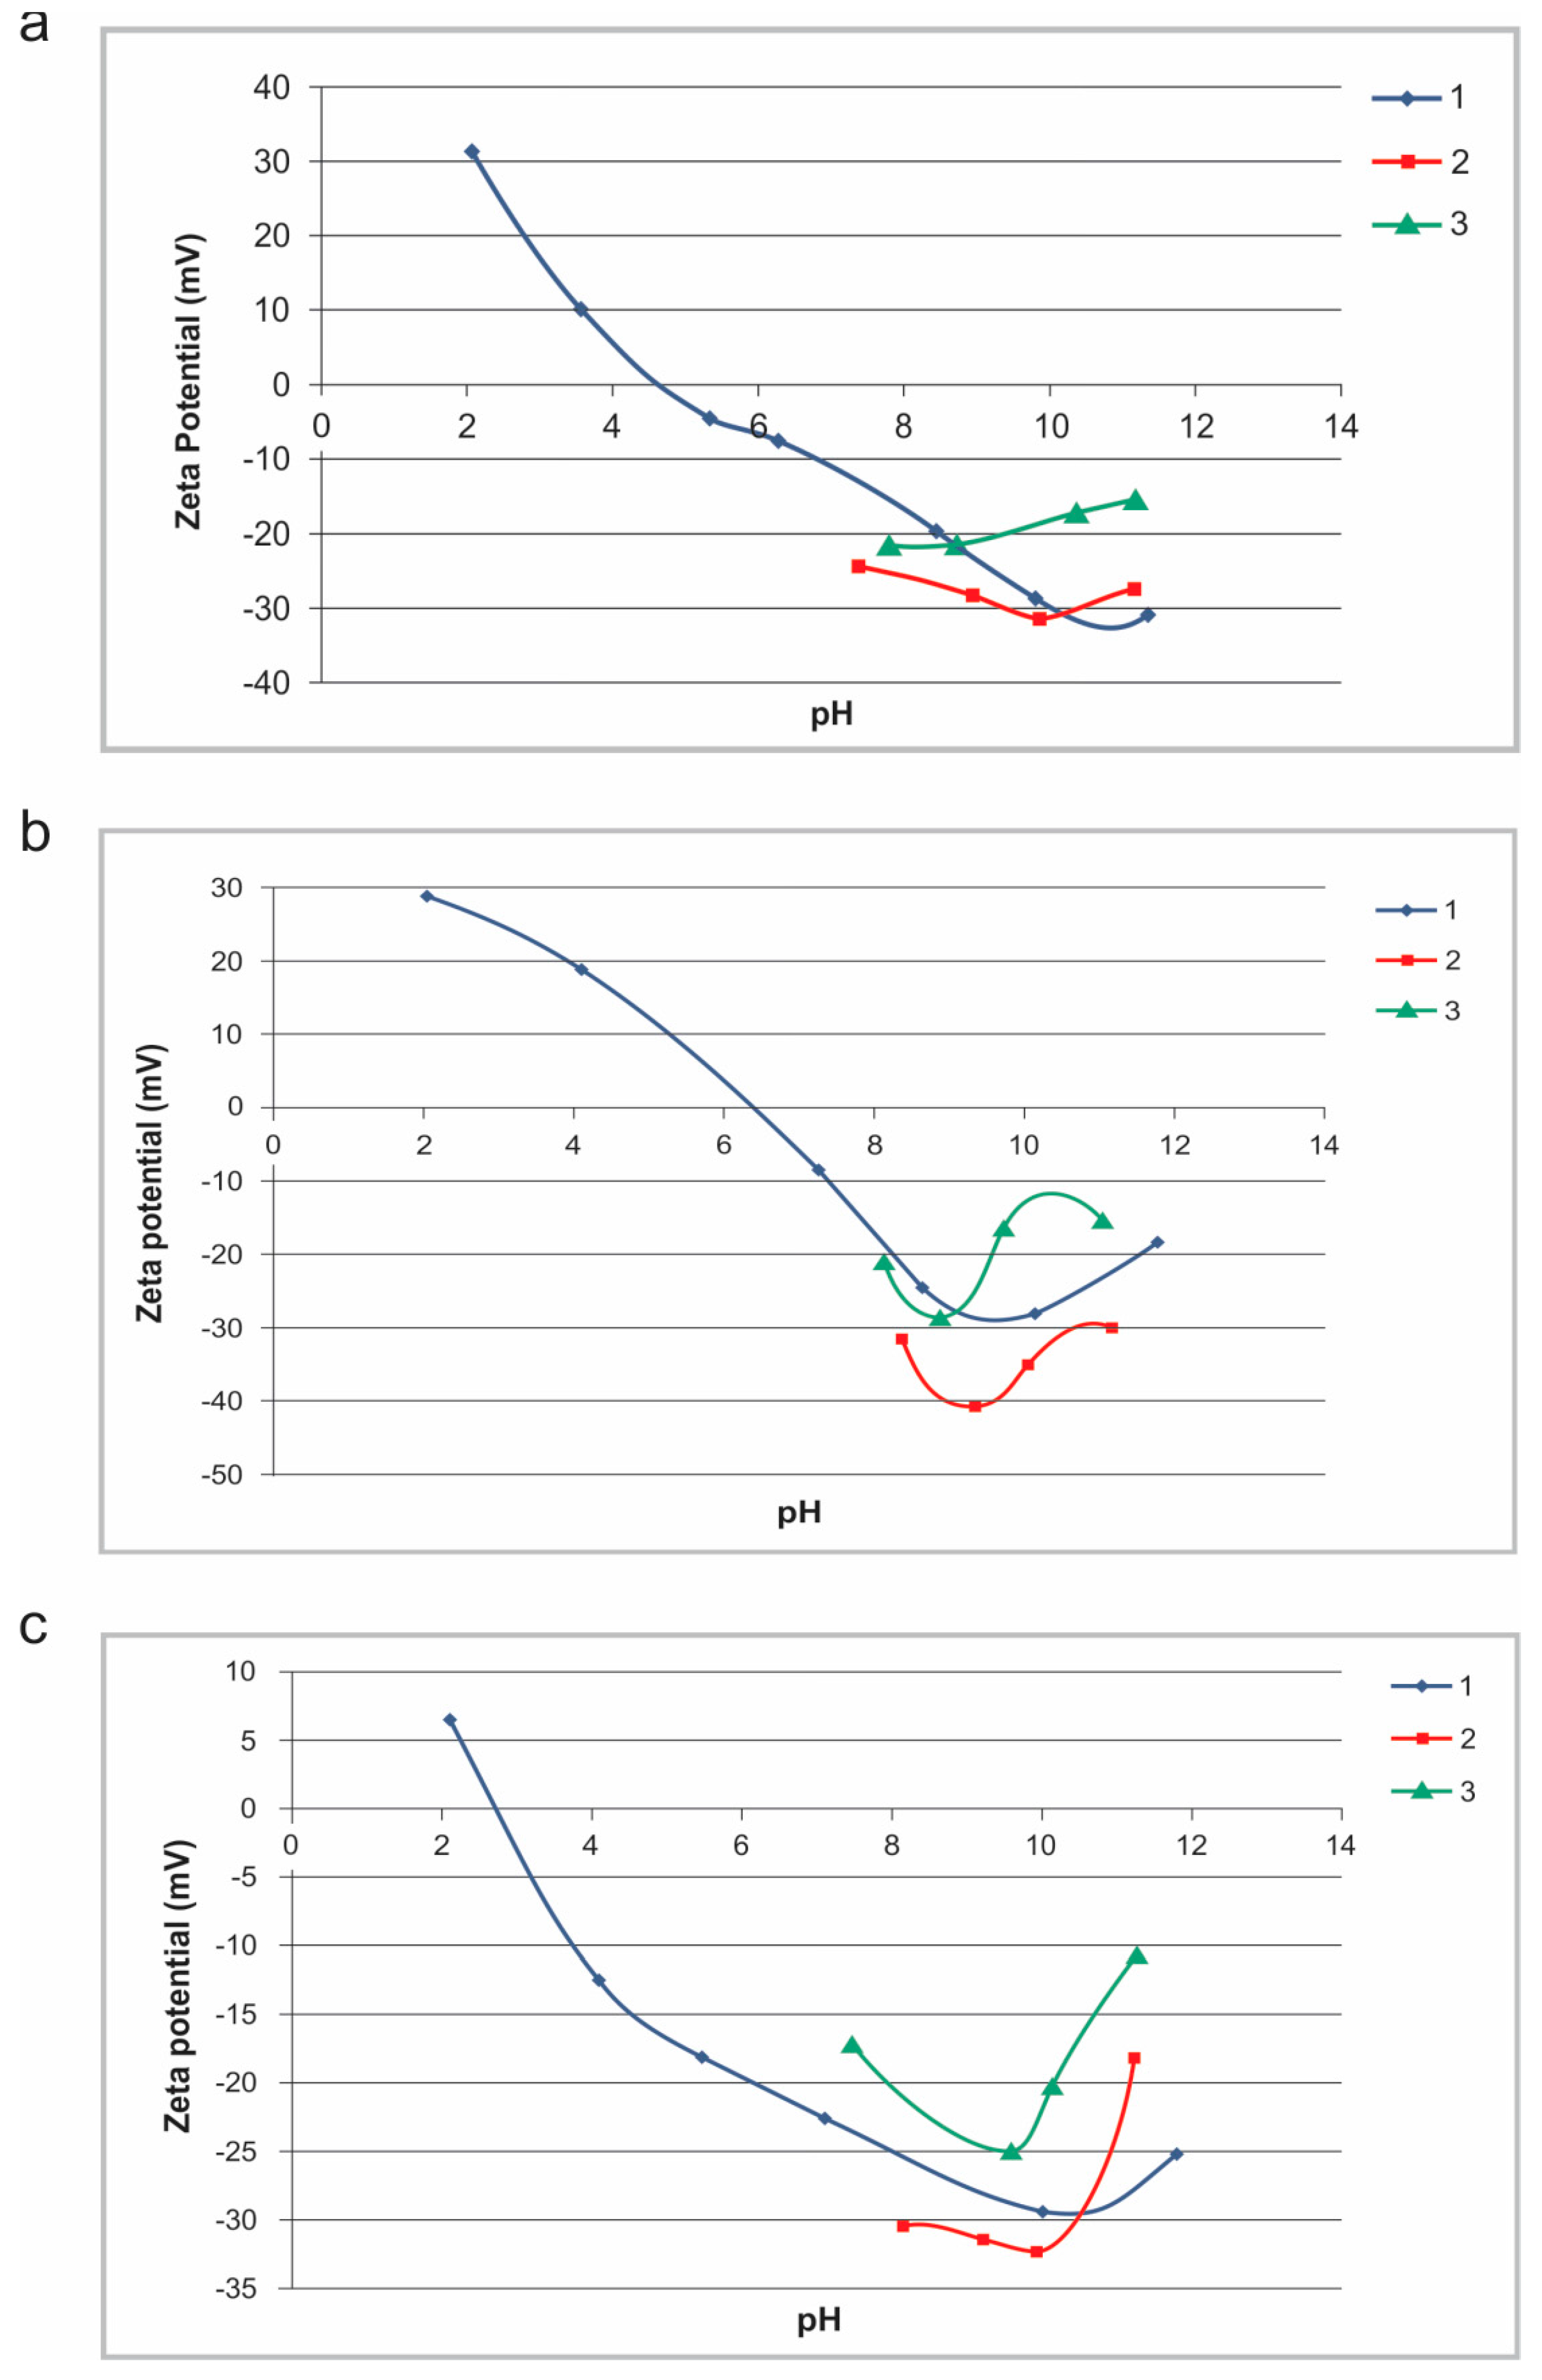
In Figure 11 and Figure 12, zeta potential curves as a function of pH for the same studied samples in the presence of anionic polyacrylamide (PAM, A100), and with/without SHMP dispersant, are shown. These curves are presented in two different ways: as mutually compared samples (Figure 11); and as each individual sample with/without reagents (Figure 12). This offers a better view of the situation.
It is obvious that the used anionic polyacrylamide (PAM) causes changes on the surface of all tested samples (Figure 11a and Figure 12). The relatively high zeta potential values indicate a fairly stable dispersion, regardless of the mineral composition. The further additional inclusion of a SHMP dispersant significantly reduces the zeta potential (Figure 11b and Figure 12), indicating favorable conditions for flocculation, particularly for goethite at pH = 10 (Figure 12b). The difference of the zeta potentials between quartz and goethite indicates a more pronounced flocculation for goethite than for quartz. It is also evident that zeta potential values of sludge in this case are only partially between those for the individual oxides, and depends on the pH range.
The mechanism of flocculation takes place in two stages, i.e., adsorption of reagent onto surface of particles and formation of aggregates. Polymer adsorption onto mineral surface takes place due to typical chemical bonds, i.e., ionic, dispersive (van der Waals), covalent, semi-polar, hydrogen of hydrophobic bonds, as well as their combination [29].
The nature of the mechanisms involved in flocculation of mineral suspensions is very complex, and depends on many parameters, such as: surface chemistry of particles, particle size distribution, degree of dispersion of particles, functional groups of the polymer, etc. The flocculation in the presence of polymer molecules can be attributed to charge neutralization and inter-particle bridging. Electrostatic bonding is the predominant mechanism when it comes to oppositely charged particles. Polymer molecules, by adsorption on oppositely charged oxide particles, can neutralize the charge on particle surfaces and reduce the inter-particle repulsive forces. A polymer can also flocculate similarly charged particles if the electrostatic repulsive forces are not strong enough to prevent the particles from bridging by the long chains of the polymer. The mechanism of flocculation negatively charged oxide with anionic polyacrylamide cannot be explained by electrostatic bonds. Flocculation of negatively charged oxide particles by anionic polymer is probably due to the hydrogen bonding [10]. Electronegative MO groups are predominant at high pH values on oxide surfaces, and some authors believe that there is a possibility that it can bond with the weakly acidic NH2 function, forming a weaker bond [30].
PAM has flocculating effects on both goethite and quartz, as well as on their mixture (i.e., sludge). Our study of the possibility of selective activity was based on the fundamental differences of surface charge of quartz and goethite. According to the zeta potential measurements observed, there is a difference in the surface charge of quartz and goethite, even in presence of the PAM and SHMP. However, the behavior of the mixture is quite different, and their zeta potential values are mostly between those for the individual oxides (Figure 9, Figure 10, Figure 11 and Figure 12). This could also further indirectly indicate that goethite and quartz (and/or clays) are most probably more or less intricately associated or even included in each other, in accordance with the SEM-EDS study (points 2, 3, 5, a, e and f; Figure 3 and Figure 4, and Table 4 and Table 5).
Initial settling experiments presented in this paper indicate that despite some differences in the behavior of individual phases, these are not sufficient enough to achieve selective PAM activity under the studied conditions. In the case of such low-grade limonite ore, gangue minerals (which are usually of quartz and clay composition) are finely distributed in a porous matrix of goethite, or intricately associated and even included in each other, as zeta potential and SEM-EDS studies indicated. This makes interfacial particle surfaces heterogeneous, even when they are well dispersed, as our results have shown. In such a case, the presence of another mineral can activate the quartz surface and make it much more reactive to the polyacrylamide chain, than would be expected [26]. Another reason may be the relatively high solid concentration. All cited positive results have been obtained with a low solid concentration of 1–5%. We selected an S/L ratio of 1:7 (i.e., of 12.5%), because it corresponds to the industrial conditions. Under such conditions, the flocculant more easily bridges the iron mineral particles simultaneously with quartz particles in this heterogeneous system. This leads to the hetero flocculation and reduces selectivity.

4. Conclusions

The mineral phases present in the sludge generated during the processing of iron ore in the Omarska mine were studied. According to the obtained results of XRPD, FTIR, chemical, SEM and EDS analyses, it can be concluded that sludge samples were composed mostly of goethite and quartz, which prevails over clay minerals. Magnetite, hematite, clinochlore and todorokite are minor determined phases. Identification of clay minerals indicate that they are mostly of illite-sericite and kaolinite composition, and with chlorites, which appears only sporadically. Sericite is mainly of the muscovite mica type. Although the phase composition of two analyzed sludge samples are almost the same, their content varies. The results presented indicate quartz as the main impurity. The results obtained from the investigations of area fractions for selected points agree well with the data of mineralogical compositions of these samples and indicate high heterogeneity of the surface.
Particle size distribution analyses confirm the complexity of the system. All of the identified mineral phases, both useful (iron minerals) and useless (quartz and clays), are present in the sludge as fine and ultra-fine particles. In both samples, the largest part of the mass of the finest particles, and large iron content is concentrated just in the smallest fractions. Also, similar mineral compositions are present among every size class within the samples, which makes this system very complex for separation processes. It is obvious that the majority of the visible grains are very fine or ultra-fine, with sizes less than about 10 μm; bigger grains than these are with much less quantity, and also in contrast to the much bigger grains determined for natural mineral raw samples.
Settling and flocculation examinations show that there is no significant difference in natural settling behavior between the two sludge samples. Samples with the smallest solid concentration of the sludge have the highest settling rates in both cases. The settling rate is obviously improved by using anionic polyacrylamide flocculant in both cases, with differences between the two samples. The effect of flocculant depends both on the mineral composition and on their quantity, as well as on the S/L ratios.
The initial test of selectivity of anionic polyacrylamide did not show results, probably because of the large heterogeneity of the mineral surfaces present in the mixture and relatively high solid concentration. Fe grade increases in the floating part, but Fe recovery is too small. The time of settling does not play a significant role in selectivity; the ratio of the mass of floating and sinking parts, and iron content does not change with time. These data suggest that it is necessary to further examine the individual components and their behavior in a complex system such as sludge, in order to determine the best parameters (conditions, reagents, etc.) for selective flocculation.
The influence of the mineral composition of the sludge on the surface charge can be seen from the zeta potential values. IEP was obtained at the pH values of 2.6, 6.6 and 4.5 for quartz, goethite and sludge, respectively. After the addition of SHMP as dispersant, and A100 as flocculant, the surface charge remains negative throughout all of the investigated pH values, and for all samples. The biggest difference of zeta potential magnitudes between goethite and quartz are obtained at pH = 10. The behavior of the mixture varies with respect to the individual components, and their zeta potential values are mostly between those for the individual oxides.
In this paper we have shown that the behavior of sludge from mineral processing, as a natural mixture of oxides, depends on its mineral composition. In the case of limonite sludge, in which the goethite and quartz are predominant, the heterogeneity of the surface areas of the particles present in the sludge is particularly pronounced.

Acknowledgments

The authors are grateful to three anonymous reviewers for their useful comments and suggestions. The authors are also grateful to the ArcelorMittal company in Prijedor (Bosnia and Herzegovina) for technical support and enabling the study visit of L.T. to the laboratory Global Research and Development, Mining and Mineral Processing, Maizières-lès-Metz (France), for the purpose of preparation of her PhD; to Armando Araujo for the zeta potential measurements at Universidad Federal de Minas Gerais, Belo Horizonte (Brazil); to the SEM LAB of Faculty of Mining and Geology, University of Belgrade (Serbia), for the SEM and EDS measurements; and to Aleksandra Ćirić for technical assistance.

Author Contributions

Ljiljana Tankosić, Pavle Tančić, Svjetlana Sredić and Zoran Nedić conceived and designed the experiments; Ljiljana Tankosić, Pavle Tančić and Zoran Nedić performed the experiments; Ljiljana Tankosić, Pavle Tančić, Svjetlana Sredić and Zoran Nedić analyzed the data; Ljiljana Tankosić, Pavle Tančić and Svjetlana Sredić wrote the paper.

Conflicts of Interest

The authors declare no conflict of interest.

References

  1. Milovanović, D.; Milošević, A.; Salcin, E. Elaboration on Iron Ore Classification, Categorization, and Calculation for the Deposit of “Omarska”—Location of “Buvac”; Institute of Mining: Prijedor, Bosnia and Herzegovina, 2007. (In Serbian) [Google Scholar]
  2. Tankosić, L.; Tančić, P.; Sredić, S.; Nedić, Z.; Malbašić, V. Characterization of natural raw materials in the processing of iron ore from Omarska mine. In Proceedings of the International Symposium “Mining and Geology Today”, Belgrade, Serbia, 18 September 2017; pp. 316–330. [Google Scholar]
  3. Company ArcelorMittal Prijedor; (Prijedor, Bosnia and Herzegovina). Personal communication, 2017.
  4. Praes, P.E.; de Albuquerque, R.O.; Luz, A.F.O. Recovery of Iron Ore Tailings by Column Flotation. J. Miner. Mater. Charact. Eng. 2013, 1, 212–216. [Google Scholar] [CrossRef]
  5. Ma, M. Froth Flotation of Iron Ores. Int. J. Min. Eng. Miner. Process. 2012, 1, 56–61. [Google Scholar] [CrossRef]
  6. Kumar, R.; Mandre, N.R. Recovery of iron from iron ore slimes by selective flocculation. J. S. Afr. Inst. Min. Metall. 2017, 117, 397–400. [Google Scholar] [CrossRef]
  7. Ahmed, H.A.M.; Mahran, G.M.A. Processing of Iron Ore Fines from Alswaween Kingdom of Saudi Arabia. Physicochem. Probl. Miner. Process. 2013, 49, 419–430. [Google Scholar] [CrossRef]
  8. Ajaka, E.O. Recovering Fine Iron Minerals from Itakpe Iron Ore Process Tailing. J. Eng. Appl. Sci. 2009, 4, 17–28. [Google Scholar]
  9. Somasundaran, P.; Runkana, V. Selective flocculation of fines. Trans. Nonferrous Met. Soc. China 2000, 10, 8–11. [Google Scholar]
  10. Sresty, G.C.; Somasundaran, P. Selective Flocculation of Synthetic Mineral Mixtures Using Modified Polymers. Int. J. Miner. Process. 1980, 6, 303–320. [Google Scholar] [CrossRef]
  11. Weissenborn, P.K.; Warren, L.J.; Dunn, J.G. Optimisation of selective flocculation of ultrafine iron ore. Int. J. Miner. Process. 1994, 42, 191–213. [Google Scholar] [CrossRef]
  12. Orumwense, F.F.O.; Nwachukwu, J.C. Flocculation studies on hematite-silica system using polymeric flocculants. Indian J. Chem. Technol. 2000, 7, 23–29. [Google Scholar]
  13. Panda, L.; Biswal, S.K.; Tathavadkar, V. Beneficiation of Synthetic Iron Ore Kaolinite Mixture Using Selective Flocculation. J. Miner. Mater. Charact. Eng. 2010, 9, 973–983. [Google Scholar] [CrossRef]
  14. Su, T.; Chen, T.; Zhang, Y.; Hu, P. Selective Flocculation Enhanced Magnetic Separation of Ultrafine Disseminated Magnetite Ores. Minerals 2016, 6, 86. [Google Scholar] [CrossRef]
  15. Kulkarni, R.D.; Somasundaran, P. Mineralogical Heterogeneity of Ore Particles and Its Effects on Their Interfacial Characteristics. Powder Technol. 1976, 14, 279–285. [Google Scholar] [CrossRef]
  16. Nayak, N.P. Mineralogical Characterization of Goethite-Lateritic Ore & Its Implication on Beneficiation. Int. J. Eng. Sci. Res. Technol. 2014, 3, 288–291. [Google Scholar]
  17. Leistner, T.; Peuker, U.A.; Rudolph, M. How gangue particle size can affect the recovery of ultrafine and fine particles during froth flotation. Miner. Eng. 2017, 109, 1–9. [Google Scholar] [CrossRef]
  18. Cytec Industries Inc. Cytec Мining Chemicals Handbook, Revised Edition; Cytec Industries Inc.: Woodland Park, NJ, USA, 2002; pp. 187–202. Available online: https://www.911metallurgist.com/wp-content/uploads/2017/03/2002-cytec-mining-handbook924751.pdf (accessed on 17 March 2018).
  19. Wills, B.A.; Napier-Munn, T. Mineral Processing Technology, 7th ed.; Elsevier Science & Technology Books: Amsterdam, The Netherlands, 2006; pp. 98–99. ISBN 0750644508. [Google Scholar]
  20. Moenke, H. Mineralspektren; Academie Verlag: Berlin, Germany, 1962. [Google Scholar]
  21. Plyusnina, I.I. Infrakrasnye Spektry Mineralov; Mosk. Gos. Univ.: Moscow, Russia, 1967. [Google Scholar]
  22. Gadsden, J.A. Infrared Spectra of Minerals and Related Inorganic Compounds; Longmans: London, UK, 1975. [Google Scholar]
  23. Tankosić, L.; Tančić, P.; Sredić, S.; Nedić, Z.; Torbica, D. Particle size distribution of iron ore sludge determined by using different methods and iron content by size class. In Proceedings of the 7th Balkan Mining Congress, Prijedor, Bosnia and Herzegovina, 11–13 October 2017; pp. 129–141. [Google Scholar] [CrossRef]
  24. Tankosić, L.; Calic, N.; Kostović, M. Selective flocculation of limonite and clay by polyacrylamides. In Proceedings of the XVI Balkan Mineral Processing Congress, Belgrade, Serbia, 17–19 June 2015; pp. 1109–1113. [Google Scholar]
  25. Shi, Z.; Zhou, X.; Luo, W.; Liu, Z.; Sun, D.; Zhang, X. Different slurry concentration on settling effect of the iron tailings. Adv. Mater. Res. 2013, 634–638, 3325–3330. [Google Scholar] [CrossRef]
  26. Drzymala, J.; Fuerstenau, D.W. Selective flocculation of hematite in the hematite-quartz-ferric ions-polyacrilyc acid system, Part I. Activation and deactivation of quartz. Int. J. Miner. Process. 1981, 8, 265–277. [Google Scholar] [CrossRef]
  27. Jin, R.; Hu, W.; Hou, X. Mechanism of selective flocculation of hematite from quartz with hydrolysed polyacrilamyde. Colloids Surf. 1987, 26, 317–331. [Google Scholar] [CrossRef]
  28. Tankosić, L. Possibility of Limonite Concentration of Selective Flocculation of Sludge and Sludge Removal. Master’s Thesis, Faculty of Mining and Geology, University of Belgrade, Belgrade, Serbia, 2012. (In Serbian). [Google Scholar]
  29. Drzymala, J. Mineral Processing, Foundations of Theory and Practice of Minerallurgy; Wroclaw University of Technology: Wrocław, Poland, 2007; pp. 449–462. [Google Scholar]
  30. Lee, L.T.; Somasundaran, P. Adsorption of Polyacrylamide on Oxide Minerals. Langmuir 1989, 5, 854–860. [Google Scholar] [CrossRef]
Figure 1. X-ray powder diffraction (XRPD) patterns of the samples. (a) Sludge I; (b) Sludge II.
Minerals 08 00119 g001
Figure 2. Fourier transform infrared (FTIR) patterns of the samples. (a) Sludge I; (b) Sludge II.
Minerals 08 00119 g002
Figure 3. Scanning electron microscope (SEM) image of the sludge I sample with analyzed selected points 1–5.
Minerals 08 00119 g003
Figure 4. Scanning electron microscope (SEM)image of the sludge II sample with analyzed selected points (af).
Minerals 08 00119 g004
Figure 5. Particle size distribution for two investigated samples.
Minerals 08 00119 g005
Figure 6. Natural settling with different ratios of S:L. (a) Sludge I; (b) Sludge II.
Minerals 08 00119 g006
Figure 7. Settling with different S:L ratios and with flocculant A100. (a) Sludge I; (b) Sludge II. Note: The division on the x-axis have made a smaller partition than at Figure 6, since the height of the sediment of settling sample after 180 seconds is the same.
Minerals 08 00119 g007
Figure 8. Critical settling rate. (a) Sludge I; (b) Sludge II.
Minerals 08 00119 g008
Figure 9. Zeta-potential curves for sludge II, goethite and quartz samples.
Minerals 08 00119 g009
Figure 10. Zeta potential in absence/presence of SHMP. (a) Sludge II; (b) Goethite and quartz.
Minerals 08 00119 g010
Figure 11. Zeta potentials of sludge, goethite and quartz. (a) With PAM (A100); (b) With PAM (A100) and SHMP.
Minerals 08 00119 g011
Figure 12. Zeta potentials without reagents (1); with PAM (2); and with PAM and SHMP (3). (a) Sludge II; (b) Goethite; (c) Quartz.
Minerals 08 00119 g012
Table 1. Basic physicochemical properties of two sludge samples.
SampleChemical Compositions (in Mass %)Si/Al RatioS/L RatiopH ValueDensity (g·cm−3)
FeMnSiO2Al2O3LOI
Sludge I29.432.5630.059.669.323.111:9.16.963.000
Sludge II41.191.9818.856.0310.683.131:77.023.526
Table 2. Identified qualitative and semi-quantitative mineral compositions by XRPD studies.
SampleSludge ISludge II
Qualitative and semi-quantitative mineral compositionQuartz, goethite, clays (of illite-sericite-kaolinite composition), magnetite and hematite.Goethite, quartz, illite-sericite, clinochlore and todorokite.
CommentQuartz (~44%) and goethite (~38%) which prevails over clay minerals (~10%), magnetite (~5%) and hematite (~3%). Goethite (~65%) which prevails over quartz (~21%) and illite-sericite (~10%). In the sample, there are also most probably present clinochlore (chlorite group) and todorokite with about ~2% of each.
Table 3. Identified qualitative and semi-quantitative mineral compositions by FTIR studies.
SampleSludge ISludge II
Identified mineral compositionQuartz (798 cm−1), goethite (3130, 908 and 798 cm−1) and clay minerals (clays: 3624, 1029 and 908 cm−1; illite-sericite: 534 cm−1; and kaolinite: 3701 and 473 cm−1).Goethite (3118, 899 and 798 cm−1), quartz (798 cm−1), and clay minerals (clays: 3622, 1654, 1030, 1008 and 899 cm−1; illite-sericite: 534 cm−1; and kaolinite: 3696, 470 and 470 cm−1).
Table 4. X-ray microanalysis (EDS) data from the selected points 1–5 of the sludge I shown in Figure 3.
Element 12345
Owt %54.0850.9746.1159.0248.38
at %67.7171.2872.4672.1275.33
Siwt %44.1111.804.2017.201.85
at %31.469.403.7611.971.64
Alwt %0.478.482.7514.601.73
at %0.357.032.5710.571.60
Fewt %1.3423.3144.213.7747.34
at %0.489.3419.901.3221.12
Nawt %n.d.1.00n.d.3.87n.d.
at %0.973.29
Kwt %n.d.1.120.341.19n.d.
at %0.640.220.59
Mnwt %n.d.2.062.390.350.69
at %0.841.090.130.31
Tiwt %n.d.0.54n.d.n.d.n.d.
at %0.25
Compound %1.09
Cuwt %n.d.0.73n.d.n.d.n.d.
at %0.26
Compound %1.11
n.d.—not detected.
Table 5. X-ray microanalysis (EDS)data from the selected points a–f of the sludge II shown in Figure 4.
Element abcdef
Owt %38.1253.1343.1641.9028.2036.71
at %67.7466.0757.1455.9257.4452.08
Siwt %1.1722.8556.8448.060.6429.74
at %1.1816.1942.8636.540.7424.03
Alwt %0.2718.89n.d.8.380.3618.11
at %0.2913.936.630.4415.23
Fewt %58.67n.d.n.d.n.d.64.555.09
at %29.8737.672.07
Nawt %n.d.3.38n.d.n.d.n.d.n.d.
at %2.93
Kwt %n.d.1.75n.d.1.66n.d.8.76
at %0.890.915.09
Mnwt %1.77n.d.n.d.n.d.6.25n.d.
at %0.923.71
n.d.—not detected.
Table 6. Particle size distribution and iron content by size class for two investigated samples.
Sludge I Sludge II
Fraction (µm)Mass %Fe * (Mass %)Fe ** (Mass %)Mass %Fe * (Mass %)Fe ** (Mass %)
Initial10029.43-10041.19-
>2510.4229.053.0313.8344.536.16
18–256.7727.631.877.5838.782.94
13–188.9627.342.457.9340.093.18
9–1312.6028.713.628.2941.493.44
6–911.8830.233.599.1143.273.94
<649.3728.7314.1853.2637.3819.91
Fe *—units of Fe; Fe **—units of Fe compared to initial.
Table 7. Critical settling rate (mm/s) of Sludge I and Sludge II.
Sludge ISludge II
S:L (% of Solid)Natural SettlingSettling with FlocculantNatural SettlingSettling with Flocculant
1:7 (12.5)0.052.830.071.61
1:9.7 (9.4)0.102.950.113.33
1:19.7 (4.8)0.283.950.303.95
Table 8. Hindered settling rate (mm/s) of Sludge I and Sludge II.
Sludge ISludge II
S:L (% of Solid)Terminal SettlingHindered SettlingTerminal SettlingHindered Settling
1:7 (12.5)0.1840.1480.2030.193
1:9.7 (9.4)0.1840.1570.2030.203
1:19.7 (4.8)0.1840.1700.2030.216
Table 9. Selective flocculation of sludge II with different time of settling.
Time of SettlingProductM (%)Fe Grade (%)SiO2 Grade (%)Fe Recovery (%)SiO2 Recovery (%)
30″Float18.0043.3115.4018.9314.71
Sink82.0040.9020.081.4287.00
Total100.00----
1′Float11.3544.5212.8512.277.74
Sink88.6540.9820.2088.2095.00
Total100.00----
2′Float13.5045.8111.8015.018.45
Sink86.5040.5320.3085.1193.15
Total100.00----
3′Float17.7044.7812.7519.2411.97
Sink82.3040.4120.2080.7488.19
Total100.00----
4′Float10.3346.6610.2511.705.62
Sink89.6740.8419.9588.9194.90
Total100.00----
5′Float14.7045.5112.1016.249.44
Sink85.3040.6120.3084.1091.86
Total100.00----
10′Float14.0745.2311.5015.458.58
Sink85.9340.2820.1084.0391.63
Total100.00----

