Micropore Structure of Cement-Stabilized Gold Mine Tailings

1
Department of Civil Engineering, University of Seoul, Seoul 02504, Korea
2
Department of Civil and Environmental Engineering, Western University, London, ON N6A 5B9, Canada
*
Author to whom correspondence should be addressed.
Minerals 2018, 8(3), 96; https://doi.org/10.3390/min8030096
Submission received: 28 December 2017
/
Revised: 14 February 2018
/
Accepted: 22 February 2018
/
Published: 2 March 2018
Abstract
:Mine tailings have often to be stabilized by mixing them with cementing agents. In this study, the pore structure of gold tailings stabilized with Portland cement was evaluated by means of mercury intrusion porosimetry. The investigation was conducted on samples prepared with different fractions of tailings and cement as well as on samples activated with elevated temperature curing and chemical (CaCl2) addition. It was observed that all mixed samples exhibit a mono-modal pore size distribution, indicating that the cement-stabilized tailings are characterized by a single-porosity structure. The results also showed that the higher fraction of tailings and cement leads to a dense and finer pore structure. The total porosity of mixture samples decreases with increasing curing temperature and CaCl2 concentration due to the acceleration of hydration reaction.
1. Introduction
Mine tailings, produced from mineral processing in the mining industry, are ground rock particles after extraction of valuable metals and minerals from orebody. In general, the tailings are in the form of slurry or paste that are deposited hydraulically in tailings impoundments, which utilize large areas and are costly for management. Disposal of the tailings in impoundments may also cause environmental and safety concerns. For example, the reactive tailings that contain residual sulphides can generate acid mine drainage (AMD) and the saturated tailings deposits with high porosity may be collapsed due to flood and earthquake events [1,2]. To reduce the environmental and geotechnical vulnerability, a stabilization-solidification technique, transformed tailings slurry and paste into an inert material by the addition of binders (e.g., cement, lime, fly ash, and inorganic polymer) has been developed and implemented [3,4].
Cement is commonly used as an additive to improve the mechanical, mineralogical, and geochemical properties of problematic geomaterials such as soft clay, dredged material, sewage sludge, and mine tailings. It is attributed to the hydration reaction, which produces cementitious materials in the mixture matrix. The cement hydration can ensure the stabilization of heavy metal contamination within the matrix as well as the formation of a structure within the particle assemblage [5]. The term “ucture” defines the combination of fabric and bonding (inter-particle forces including cementation and electrostatic forces) [6]. Although the structure of cement-stabilized geomaterials has been studied, most investigations have been focused on the effect of type, form, and dosage of cements and curing time [7,8,9,10]. Since the activation of hydration reactivity by thermal and chemical treatments influences the structural evolution, knowledge regarding the structure of cemented tailings is necessary to enhance the efficiency of tailings management.
Thermal activation for cementitious materials often refers to elevated temperature curing [11]. Variations of cementitious materials under high curing temperature are mainly the results of two mechanisms [12]. One is the formation of hydration productions under high temperatures and the other is the transformation of constituent phases under different temperatures. Therefore, studies on the thermal treatment effect on the microstructures of cementitious materials are necessary.
The chemical activation refers to the use of chemical agents and mineral admixtures to activate the potential reactivity of cementitious components [13]. Calcium chloride (CaCl2) primarily serves to accelerate hydration reactions in cementitious materials. This acceleration is believed to occur by the direct acceleration of the growth rate of hydration products, but the mechanism is not fully understood, especially at the micro-level perspective. It is expected that accelerating the hydration reaction would influence the morphology of the hydration products, thereby changing the microstructure of cementitious matrix. Ramachandran and Feldman [14] observed that the morphology of hydration products varies, depending on the amount of CaCl2 added to cement pastes. Juenger et al. [15] examined tricalcium silicate hydrating in a solution containing CaCl2 and noted that CaCl2 increases the rate of formation of the inner product, calcium silicate hydrate. The CaCl2 has been used to allow binder utilization during cold weather given the concern that low temperatures could prevent sufficient hydrations and strength development in geomaterials [16]. This is because the addition of CaCl2 results in the depression of the freezing point of water. For example, Bowers [17] investigated CaCl2 modification on soil-cement at different temperatures and reported that decreased strength may occur if temperature and/or dosage limitations are exceeded.
The objective of this study is to evaluate the pore structure of the cement-stabilized tailings by using mercury intrusion porosimetry technique. Effect of fractions of tailings and cement within the mixed samples is examined. The investigation is also made on samples prepared with elevated temperature curing and CaCl2 addition. The pore size distribution of the mixture samples is quantified in terms of the critical pore diameter and the threshold diameter.
2. Materials and Methods
2.1. Materials
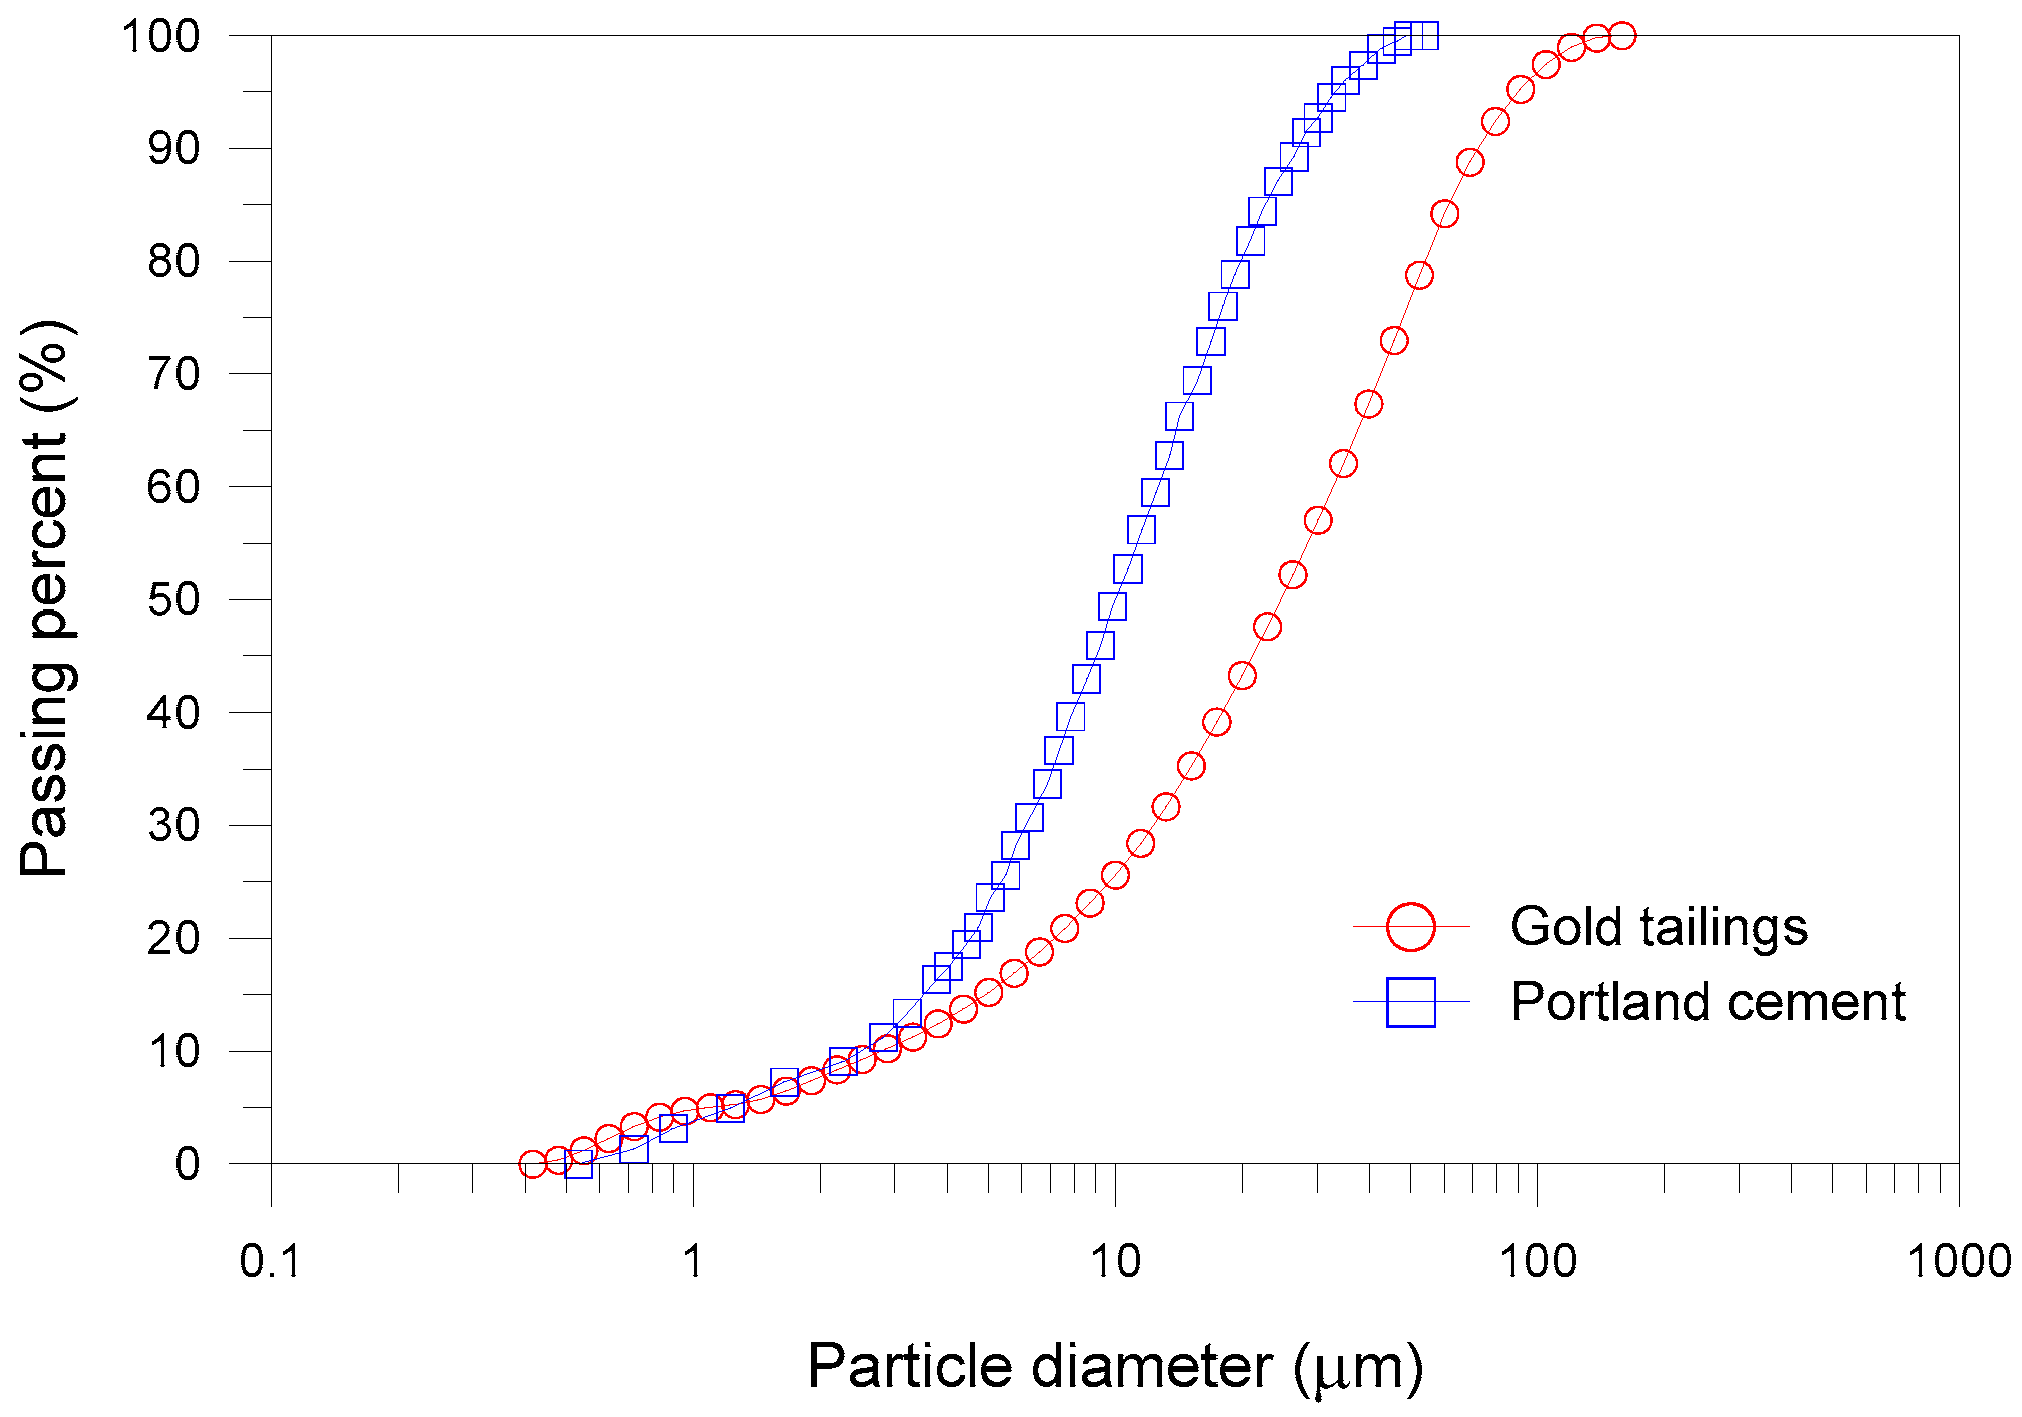
The materials used in this study are gold tailings, Portland cement, distilled water, and calcium chloride (CaCl2). The tailings were provided in the dry state from a gold mine site, in northern Ontario, Canada. The X-ray diffraction (XRD) (D/max diffractometer, Rigaku, Japan) technique was used for the identification of fine-grained minerals and the study of their crystal structure [6], and the mineralogy of gold tailings are quartz (37%), amphibole (30%), illite (26%), chlorite (4%), and pyrrhotite (3%). The particle size distribution of the tailings was determined by a laser diffraction analyzer that utilizes diffraction patterns of a laser beam passed through minerals ranging from nanometers to millimeters in size. Figure 1 shows the particle size distribution of the tailings, indicating 50% of the tailings particles are smaller than 20 μm. The specific gravity and specific surface of the gold tailings are 3.28 and 0.714 m2/g, respectively.
The binder used for tailings stabilization is Type I Portland cement. The particle size distribution of the cement is generally smaller than that of the gold tailings, as shown in Figure 1. The specific gravity and specific surface of the Portland cement are 3.17 and 0.367 m2/g, respectively. The chemical compositions of the tailings and cement are given in Table 1. Distilled water was used to prepare mixture slurries of tailings and cement. CaCl2 powder was used as chemical activator. The required amounts of CaCl2 were added to distilled water to prepare the electrolyte solutions with 0.05 and 0.2 M concentrations.
2.2. Sample Preparation
The prescribed volume of water (or CaCl2 solution) was first added to the dry tailings and mixed thoroughly by a mixing machine to obtain the tailings volume fraction Vgt of 26% and 28%. The cement volume faction Vpc of 2% and 4% is then added to the tailings slurry to achieve the cement-tailings mixture. The mixing was done within 10 min to achieve the uniform mixture as well as to prevent hardening of the mixture. The cement-tailings mixture was then placed into polyvinyl chloride (PVC) molds 50 mm in diameter and 100 mm high. Care was taken to remove trapped air bubbles and voids from the mixture during placement of the mixture in the molds. All sample mixtures were cured for 28 days. For thermal activation, curing temperature on cement-tailings mixture was controlled. To prepare the sample mixtures with an initial temperatures of 5, 25, and 45 °C, 24 h before the mixing, all materials were placed inside an environmental chamber. The mixing and curing took place in the environmental chamber with the same initial temperatures. The details of the prepared mixes are summarized in Table 2.
2.3. Mercury Intrusion Porosimetry
The determination of pore size distribution (PSD) by mercury intrusion porosimetry (MIP) technique is based on the principle that external pressure is required to intrude a pore with mercury, a nonwetting fluid. The theoretical relationship between the intrusion pressure P (N/m) and pore diameter D (μm) is given by Washburn [18] as:
where T is the surface tension of mercury (N/m) and θ is the contact angle (°) between mercury and solid phase. As cited by Lee et al. [19], T and θ are assumed to be 0.480 N/m and 140°. The MIP device used is a MicRometrics AutoPore IV 9500 V 1.07 (MicroMetrics, Ottawa, ON, Canada). During the MIP test, the volume of mercury intruding on the medium corresponding to stepped intrusion pressure is recorded and the pore diameter intruded by mercury under each pressure is computed with the known T and θ. Although the compression of pore space prior to actual intrusion into the bulk medium may occur, this effect is less important for cement-treated materials [20]. It is worth noting that MIP does not measure actual pore diameter but pore entrance diameter owing to the bottleneck effect [21].
After curing, cubical samples with dimension of 1 cm on a side were carefully taken from the middle of the cemented mixtures. The completely dried samples were prepared by using the freeze-drying method, which minimizes the microstructure alternation induced by shrinkage during drying. The samples were immersed in liquid nitrogen for quick freezing of their pore fluids and placed in a desiccator for 24 h of sublimation.
The MIP data are expressed in the forms of the cumulative pore volume as a function of the logarithm of pore diameter, known as the cumulative intrusion curve. Other useful information can be obtained by differentiating the cumulative distribution curve, called the differential distribution curve. Namely, the log-differential pore volume is defined as
where, Vi is the measured total pore volume corresponding to the pore diameter Di.
In order to evaluate the repeatability of the MIP results obtained throughout the abovementioned test method, the pore size distributions for Sample A1 are shown in Figure 2, indicating that no significant differences are identified between the pore size distributions of two samples taken from an identical mixture.
3. Results and Discussion
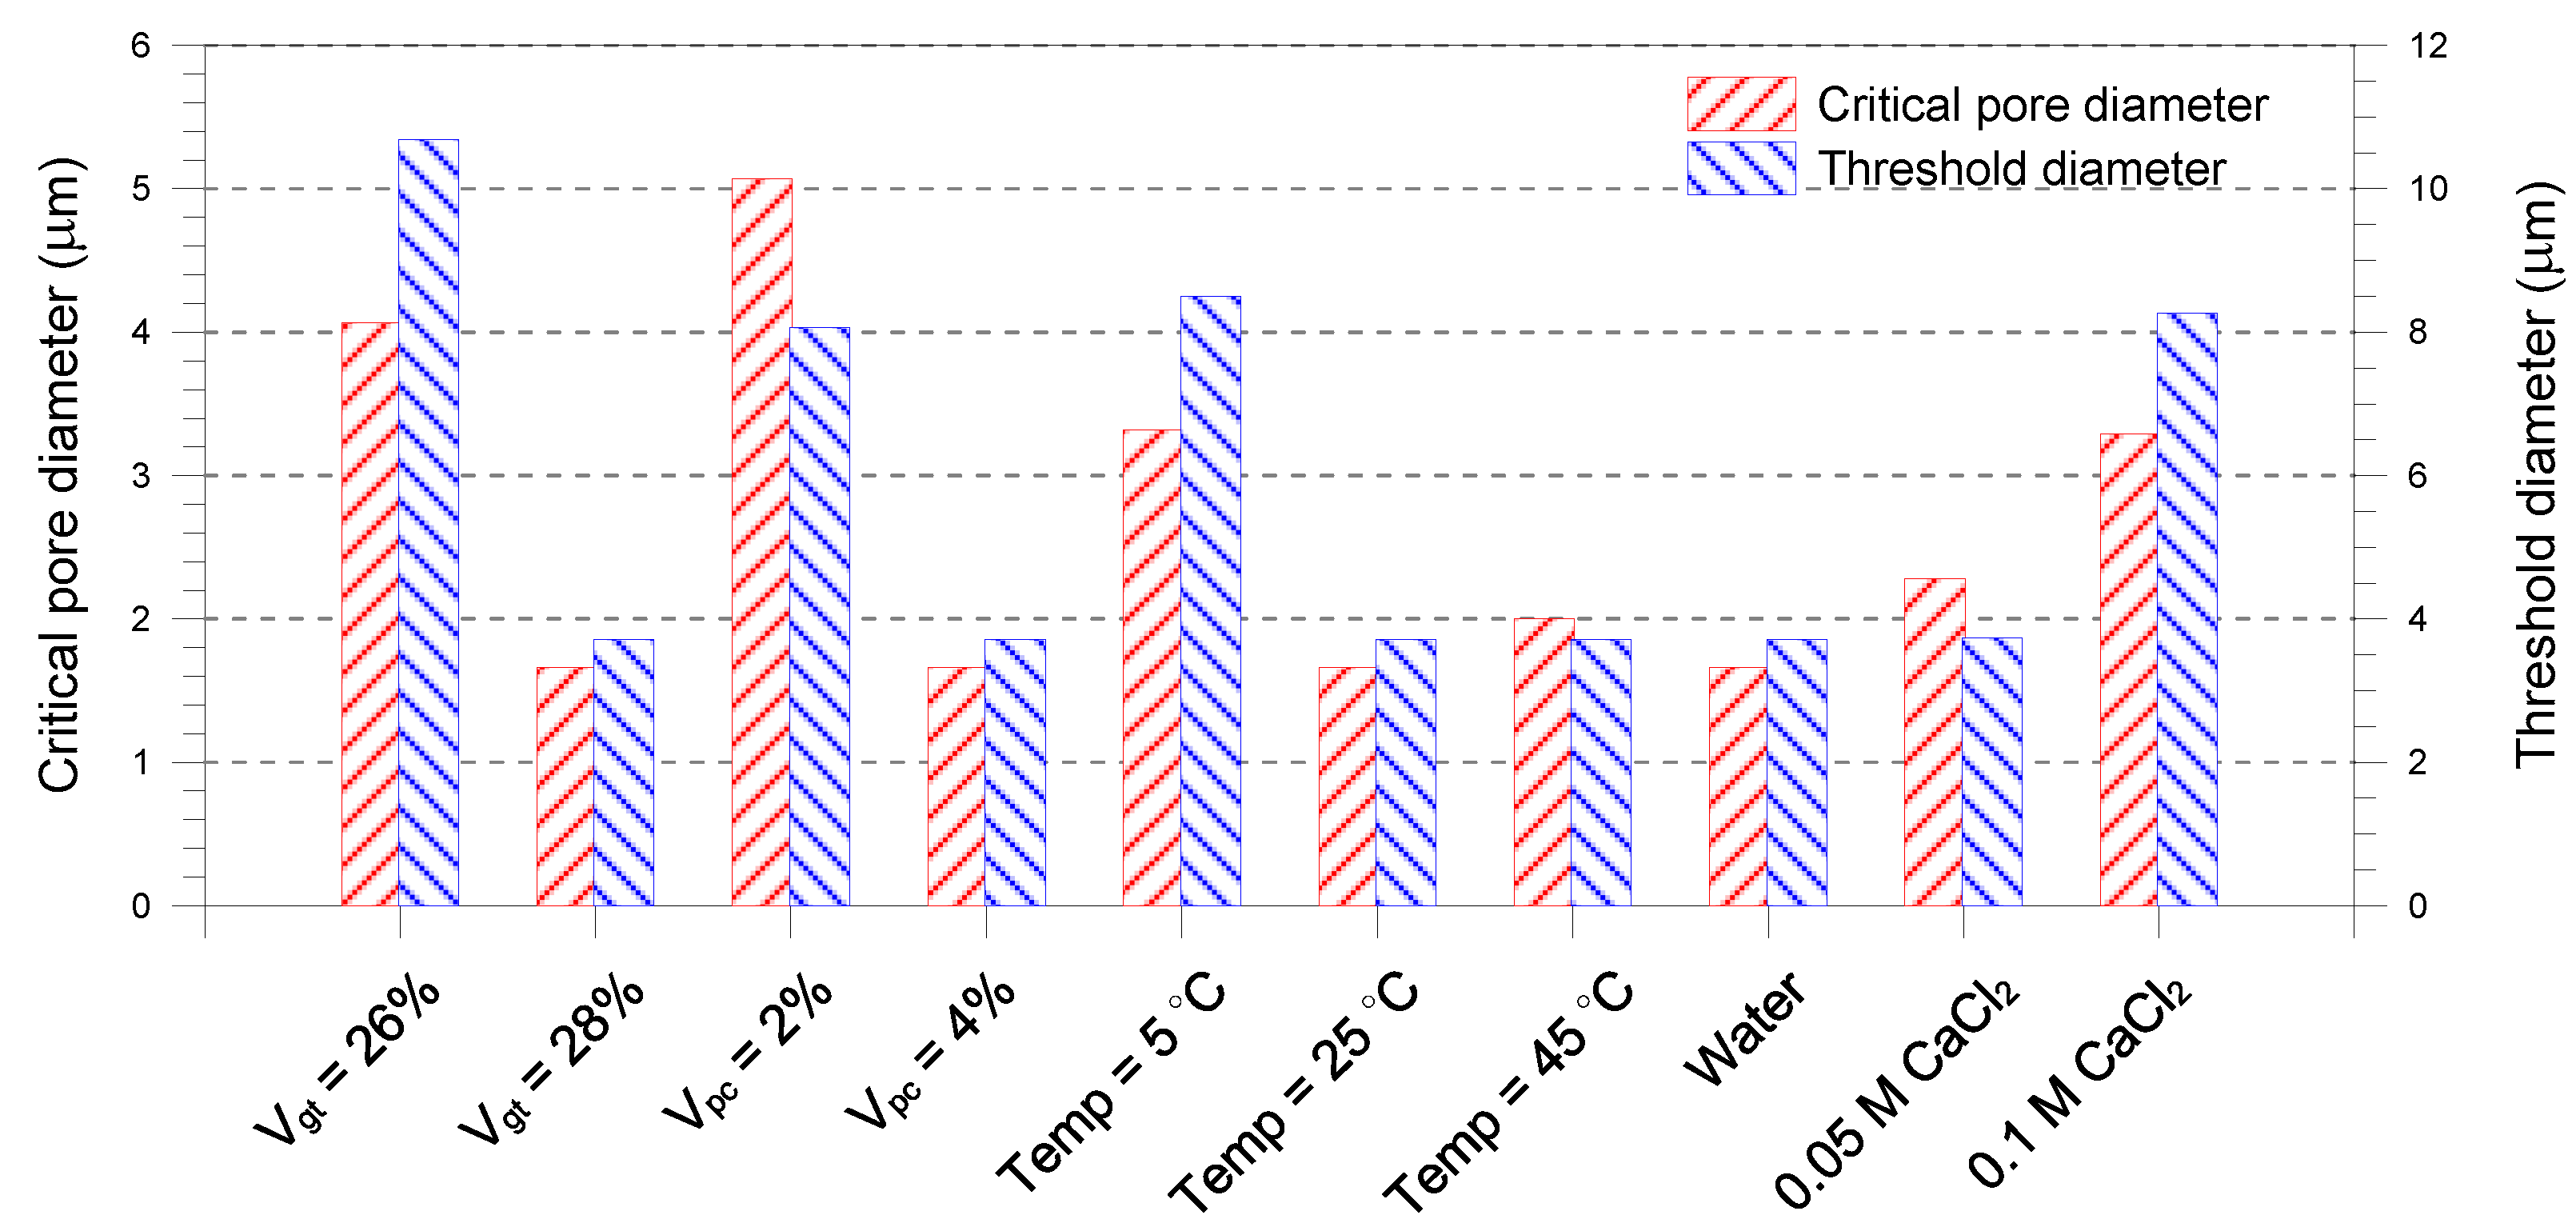
Figure 3, Figure 4, Figure 5 and Figure 6 show the pore size distribution (PSD) of gold tailings stabilized with Portland cement. The PSD is observed for a diameter range of 6 nm to 0.1 mm. Since all cumulative curves become essentially flat at diameters less than 6 nm, it is assumed that, irrespective of the mixture composition and curing temperature of the samples, almost all of the pores in the samples have a diameter larger than 6 nm. Hence, the cumulative volume at a diameter of 6 nm represents the total pore volume of cement-stabilized tailings, which lies within the range of 0.21–0.27 mL/g (see Table 2). Meanwhile, it can be seen in the differential curves that all samples exhibit a unimodal PSD, indicating a microporosity structure is a single-porosity structure, which was found in other cement-based materials [8,22]. The peak is also shown in different locations of pore diameters intruded and it widely varies in magnitude and sharpness (the number of adjacent diameter having similar pore size density): diameters smaller than the peak diameter tend to have a larger pore size density than diameters larger than the peak diameter. The peak diameter is referred to as the critical pore diameter. Figure 7 presents the critical pore diameter and the threshold diameter (the diameter of the largest pore at which the great volume of mercury is intruded) of the mixture samples. The former represents the mean diameter of pore entry way that allows maximum percolation throughout the porous medium and the latter represents the maximum diameter of pores that form a continuous network through the pore system and marks the onset of percolation [21]. For the cement-stabilized tailings, the critical pore diameter falls in the range of 1.66–5.07 μm and the threshold diameter ranges between 3.71 and 10.69 μm.
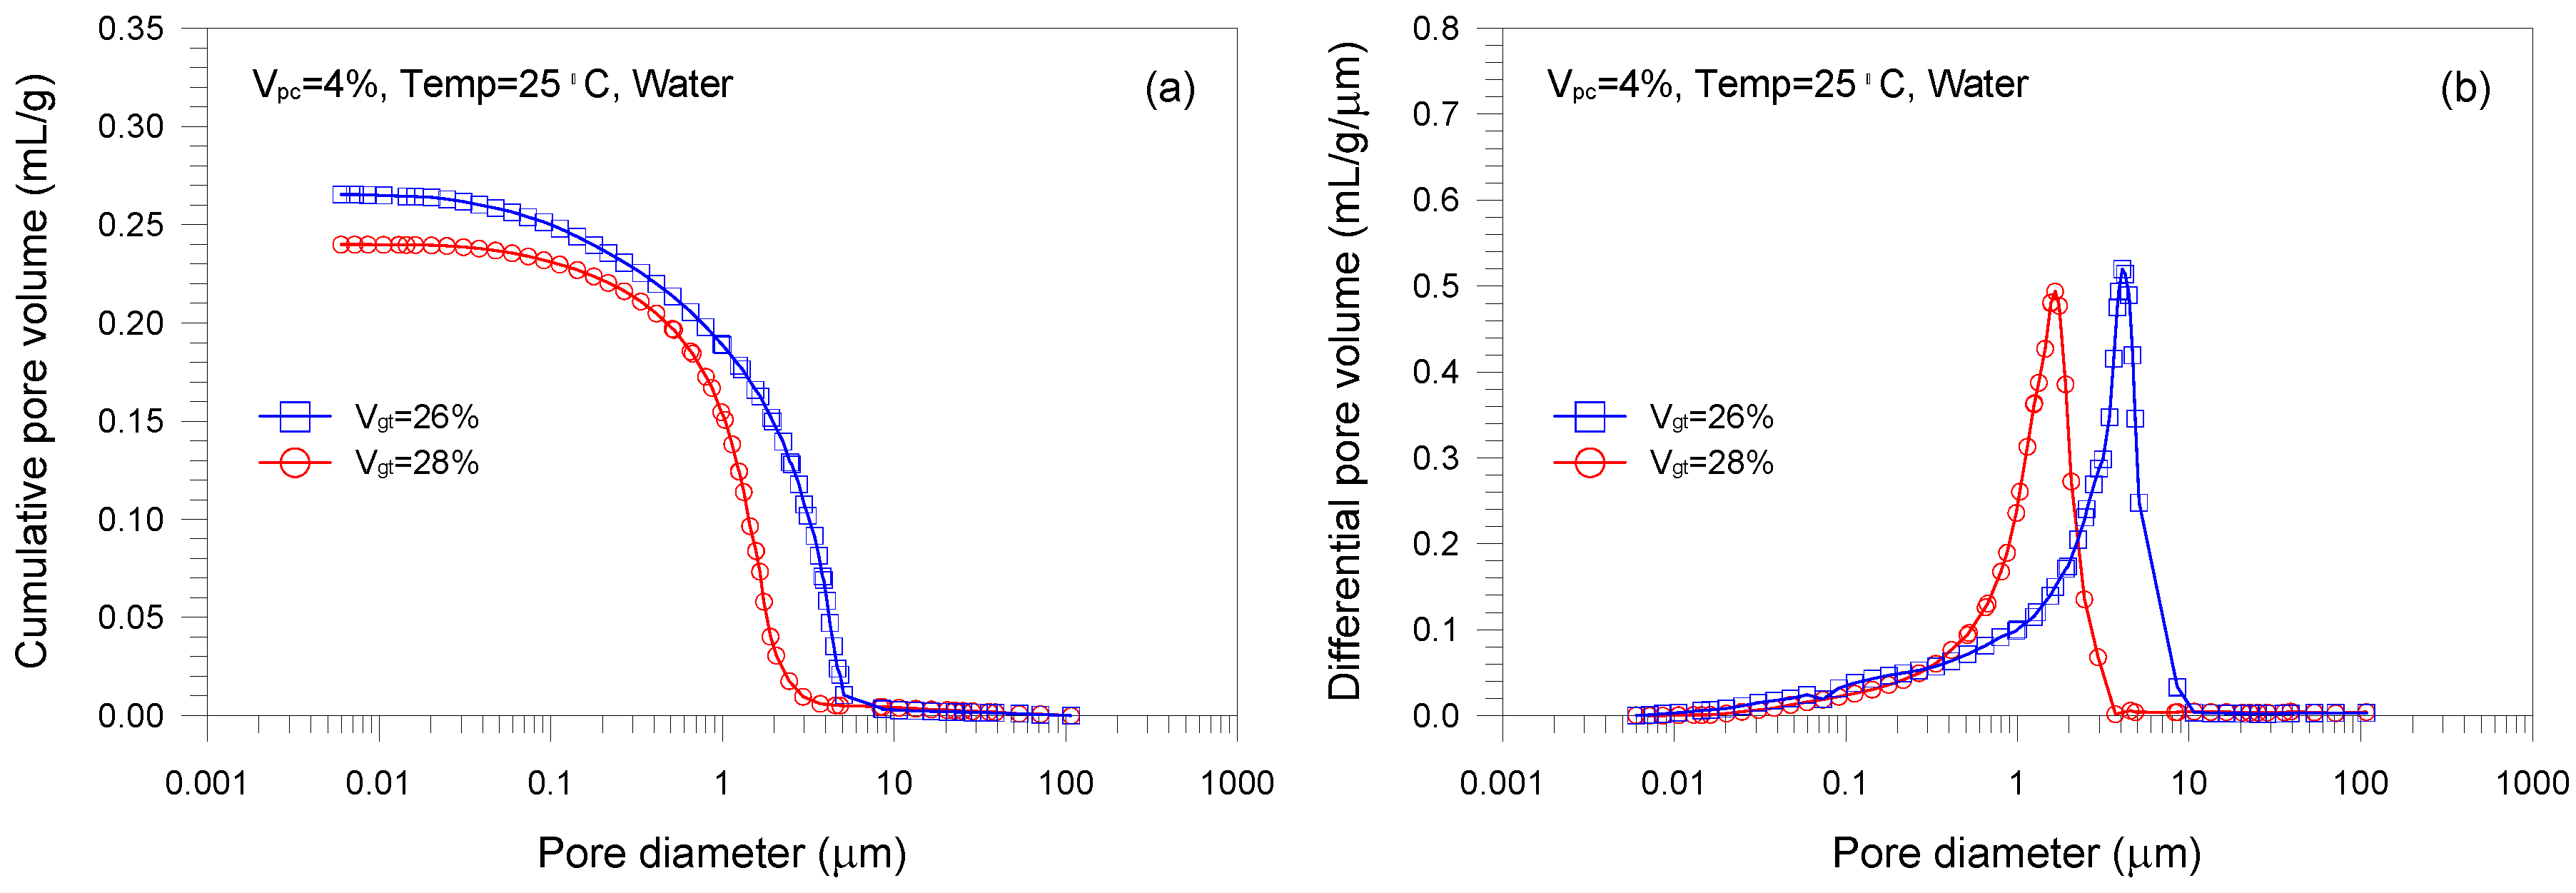
Figure 3 highlights the effect of Vgt on the pore size distribution of cement-stabilized tailings. In Figure 3a, an increase in Vgt results in the increase of tailings volume fraction in the samples with a fixed amount of cement, leading to the lower total pore volume. In other words, the distance between tailings particles become smaller as the water volume fraction is decreased. Increasing tailings fraction also affects the change in microstructure of hardened samples, as shown in Figure 3b. The critical and threshold diameters decrease with increasing Vgt, although the difference in the peak intensity is not significant. This implies that the mean diameter of the pores decreases with the tailings fraction in the samples. Similar observation was reported in hardened cement pastes and mortars [23,24].
Figure 4 demonstrates the effect of Vpc on the pore size distributions of cement-stabilized tailings. The sample with Vpc = 4% has a denser packing with a finer distribution of the pores than the sample with Vpc = 2%. In other words, the higher cement volume fraction in the samples, the less the total pore volume and the smaller the critical and threshold diameters. This is due to the addition of more cement creating the formation of a higher amount of hydration products (e.g., calcium silicate hydrate (CSH), calcium aluminate hydrate (CAH), and hydrated lime (Ca(OH)2)) and thereby, fills the pores of less than 10 μm and blocks the pore connectivity within the sample mixture.
Figure 5 shows the effect of curing temperature on the pore size distributions of cement-stabilized tailings. In Figure 5a, the total pore volume of samples cured at hotter temperature is lower than those of samples at colder temperatures. The obtained results can be mainly attributed to the fact that the higher curing temperature accelerates the hydration of cement. This in turn, leads to the formation of more cement hydration products which reach the dense and finer pore structure. Also, the observation may be associated with a modification of the type of hydrate formed. In cement chemistry, it is well known that the transformation of lamellar hydrates to cubic hydrate is accompanied by a change in volume [25]. Also, Wang et al. [11] analyzed cement kiln dust and fly ash pastes cured at different temperatures and found that when curing temperature increased from 24 to 38 °C, the binder strength increased significantly. They noted that the strength improvement may be related to the microstructure development of the pastes. From Figure 5b, it is noticed that the pore size of samples cured at 5 °C generally differs from that of samples at 25 and 45 °C. Especially, the threshold diameters of samples cured at 5 °C is much larger than the other two samples that have no difference of threshold diameters. This is probably due to the fact that a relatively low curing temperature of 5 °C causes the retarding effect of the hydrate diffusion, resulting in the reduced ultimate degree of hydration. However, as the curing temperature increases from 25 to 45 °C, there is almost no difference of threshold diameters.
Figure 6 explains the effect of CaCl2 concentration on the pore size distributions of cement-stabilized tailings. As shown in Figure 6a, the sample mixed with water has the lower pore volume than the samples with CaCl2 solutions. This result can be explained by noting that in a basic environment caused by adding the alkaline cement, the calcium ion precipitates with the hydroxide from the bulk solution [17,26]. Furthermore, the active Al2O3 and SiO2 are dissolved to react with the residual calcium ion. This reaction produces CSH and CAH as follows [27]
3Ca2+ + 2Si4+ + 14OH− → 3CaO·2SiO2·3H2O + 4H2O
3Ca2+ + 4Al3+ + 20OH− + 3H2O → 3CaO·2Al2O3·Ca(OH)2·12H2O
At the basic environment, meanwhile, the increase in the electrolyte concentration reduces the double layer repulsion and promotes van der Waals attraction for coagulation, which forms an aggregated and flocculated structure [28,29]. This understanding is supported by the results of Figure 6b: the presence of CaCl2 in the samples shifts the dominant pore family toward the right, indicating that an increase in mean pore size in the samples. The higher concentration of CaCl2 means larger critical pore and threshold diameters.
4. Conclusions
The pore size distributions of Portland cement-stabilized gold tailings were characterized using mercury intrusion porosimetry. The effects of tailings and cement proportions, curing temperature, and CaCl2 concentration were investigated. Based on the results from this study, the following conclusions can be drawn:
- A single-porosity structure, in which a single-mode pore size distribution is present, is observed in the gold tailings stabilized with Portland cement. The critical and threshold pore diameters are in the ranges of 1.66–5.07 μm and 3.71–10.69 μm, respectively.
- The total pore volume and mean pore diameter of the mixture samples decrease with increasing the volume fractions of the tailings and cement, indicating a denser microstructure with a finer distribution. This is because higher tailings and cement proportion results in a decrease of the average distance of particle assembly of the cement-stabilized tailings.
- An increase in curing temperature of the mixture samples results in a decrease in the total pore volume. This is mainly attributed to the dependence of the formation of hydration products on temperature. The sample cured at 5 °C has a coarser pore structure than those cured at 25 and 45 °C.
- The mixture sample mixed with water has the lower pore volume than those with CaCl2 solutions. Increasing the CaCl2 concentration leads to a continuous reduction in the mean pore size of the mixed samples. The lower mean pore size is attributed to the formation of aggregated and flocculated structure induced by the change in interparticle forces.
This study provides useful information for understanding of the factors affecting the microstructure of cement-stabilized gold tailings, including the mixture composition, temperature curing, and CaCl2 accelerator. These factors should be taken into account when determining the mix preparation.
Acknowledgments
This work was supported by the National Science and Engineering Research Council of Canada (NSERC). The first author also acknowledges the support of the National Research Foundation of Korea (grant number NRF-2017R1C1B5015371).
Author Contributions
Joon Kyu Lee designed and performed the experiments and wrote the draft of the paper; Julie Q. Shang assisted the interpretation of the data and the writing of the paper.
Conflicts of Interest
The authors declare no conflict of interest.
References
- Rico, M.; Benito, G.; Salgueiro, A.R.; Diez-Herrero, A.; Pereira, H.G. Reported tailings dam failures: A review of the European incidents in the worldwide context. J. Hazard. Mater. 2008, 152, 846–852. [Google Scholar] [CrossRef] [PubMed]
- Lee, J.K.; Shang, J.Q.; Wang, H.; Zhao, C. In-situ study of beneficial utilization of coal fly ash in reactive mine tailings. J. Environ. Manag. 2014, 135, 73–80. [Google Scholar] [CrossRef] [PubMed]
- Shang, J.Q.; Wang, H.L.; Kovac, V.; Fyfe, J. Site-specific study on stabilization of acid-generating mine tailings using coal fly ash. J. Mater. Civ. Eng. 2006, 18, 140–151. [Google Scholar] [CrossRef]
- Nehdi, M.; Tariq, A. Stabilization of sulphidic mine tailings for prevention of metal release and acid drainage using cementitious materials: A review. J. Environ. Eng. Sci. 2007, 6, 423–436. [Google Scholar] [CrossRef]
- Yeheyis, M.B.; Shang, J.Q.; Yanful, E.K. Long-term evaluation of coal fly ash and mine tailings co-placement: A site-specific study. J. Environ. Manag. 2009, 91, 237–244. [Google Scholar] [CrossRef] [PubMed]
- Mitchell, J.K.; Soga, K. Fundamentals of Soil Behavior, 3rd ed.; John Wiley & Sons Inc.: Hoboken, NJ, USA, 2015. [Google Scholar]
- Hills, C.D.; Sweeney, R.E.H.; Buenfeld, N.R. Mircrostructural study of carbonated cement-solidified synthetic heavy metal waste. Waste Manag. 1999, 19, 325–331. [Google Scholar] [CrossRef]
- Belem, T.; Bussiere, B.; Benzaazoua, M. The Effect of Microstructural Evolution on the Physical Properties of Paste Backfill. Proceedings of Tailings and Mine Waste’01, Fort Collins, CO, USA, 16–19 January 2002; pp. 365–374. [Google Scholar]
- Rahman, M.; Siddique, A.; Uddin, K. Microstructure and chemical properties of cement treated soft Bangladesh clays. Soils Found. 2010, 50, 1–7. [Google Scholar] [CrossRef]
- Chen, H.; Zhang, J.; Yan, H. Quantitative evaluation of microstructure characteristics of cement consolidated soil. Bull. Eng. Geol. Environ. 2013, 72, 233–236. [Google Scholar] [CrossRef]
- Wang, K.; Mishulovich, A.; Shah, S.P. Activations and properties of cementitious materials made with cement-kiln dust and class F fly ash. J. Mater. Civ. Eng. 2007, 19, 112–119. [Google Scholar] [CrossRef]
- Sajedi, F.; Razak, H.A. ComParison of different methods for activation of ordinary Portland cement-slag motars. Constr. Build. Mater. 2011, 25, 30–38. [Google Scholar] [CrossRef]
- Shi, C. An overview on the activation of reactivity of natural pozzolans. Can. Geotech. J. 2001, 28, 778–786. [Google Scholar] [CrossRef]
- Ramachandran, V.S.; Feldman, R.F. Time-dependent and intrinsic characteristics of Portland cement hydrated in the presence of calcium chloride. Il Cemento. 1978, 75, 311–322. [Google Scholar]
- Juenger, M.C.G.; Monteiro, P.J.M.; Gartner, E.M.; Denbeaux, G.P. A soft X-ray microscope investigation into the effects of calcium chloride on tricalcium silicate hydration. Cem. Concr. Res. 2005, 35, 19–25. [Google Scholar] [CrossRef]
- Daniels, J.L.; Janardhanam, R. Cold-weather subgrade stabilization. In Soil Improvement; Geotechnical Special Publication; Schaefer, V.R., Filz, G.M., Sehn, A.L., Wissmann, K.J., Eds.; ASCE Press: Denver, CO, USA, 2007; pp. 1–10. [Google Scholar]
- Bowers, B.F.; Daniels, J.L.; Anderson, J.B. Field considerations for calcium chloride modification of soil-cement. J. Mater. Civ. Eng. 2014, 26, 65–70. [Google Scholar] [CrossRef]
- Washburn, E.W. Note on a method of determining the distribution of pore sizes in a porous material. Proc. Natl. Acad. Sci. USA. 1921, 7, 115–116. [Google Scholar] [CrossRef] [PubMed]
- Lee, J.K.; Shang, J.Q.; Jeong, S. Thermo-mechanical properties and microfabric of fly ash-stabilized gold tailings. J. Hazard. Mater. 2014, 276, 323–331. [Google Scholar] [CrossRef] [PubMed]
- HorpibulsUK, S.; Rachan, R.; Chinkulkijniwat, A.; Raksachon, Y.; Suddeepong, A. Analysis of strength development in cement-stabilized silty clay from microstructural considerations. Constr. Bulid. Mater. 2010, 24, 2011–2021. [Google Scholar] [CrossRef]
- Aligizaki, K.K. Pore Structure of Cement-Based Materials: Testing, Interpretation and Requirement; Taylor and Francis: New York, NY, USA, 2006. [Google Scholar]
- Kamruzzaman, A.H.M.; Chew, S.H.; Lee, F.H. Microstructure of cement-treated Singapore marine clay. Proc. Inst. Civ. Eng. Ground Improv. 2006, 10, 113–123. [Google Scholar] [CrossRef]
- Cook, R.A.; Hover, K.C. Mercury porosimetry of hardened cement pastes. Cem. Concr. Res. 1999, 29, 933–943. [Google Scholar] [CrossRef]
- Luo, L.; Ye, G.; Schutter, G.D. Effect of corrosion inhibitors on cement paste pore structure. Proc. Inst. Civ. Eng. Constr. Mater. 2008, 161, 73–84. [Google Scholar] [CrossRef]
- Lemaire, K.; Deneele, D.; Bonnet, S.; Legret, M. Effects of lime and cement treatment on the physicochemical, microstructural and mechanical characteristics of a plastic silt. Eng. Geol. 2013, 166, 255–261. [Google Scholar] [CrossRef]
- Kaya, A.; Yukselen, Y. Zeta potential of clay minerals and quartz contaminated by heavy metal. Can. Geotech. J. 2005, 42, 1280–1289. [Google Scholar] [CrossRef]
- Xing, H.; Yang, X.; Xu, C.; Ye, G. Strength characteristics and mechanics of salt-rich soil-cement. Eng. Geol. 2009, 130, 33–38. [Google Scholar] [CrossRef]
- Van Olphen, H. An Introduction to Clay Colloid Chemistry: For Clay Technologists, Geologists and Soil Scientists; Reprint Version; John Wiley and Sons: New York, NY, USA, 1991. [Google Scholar]
- Wang, Y.H.; Siu, W.K. Structure characteristics and mechanical properties of kaolinite soils. I. Surface charges and structural characterizations. Can. Geotech. J. 2006, 43, 587–600. [Google Scholar] [CrossRef]
Figure 1.
Particle size distribution of materials studied.

Figure 2.
Repeatability of MIP data in identical sample A1: (a) cumulative intrusion curve; (b) differential instruction curve.
Figure 2.
Repeatability of MIP data in identical sample A1: (a) cumulative intrusion curve; (b) differential instruction curve.
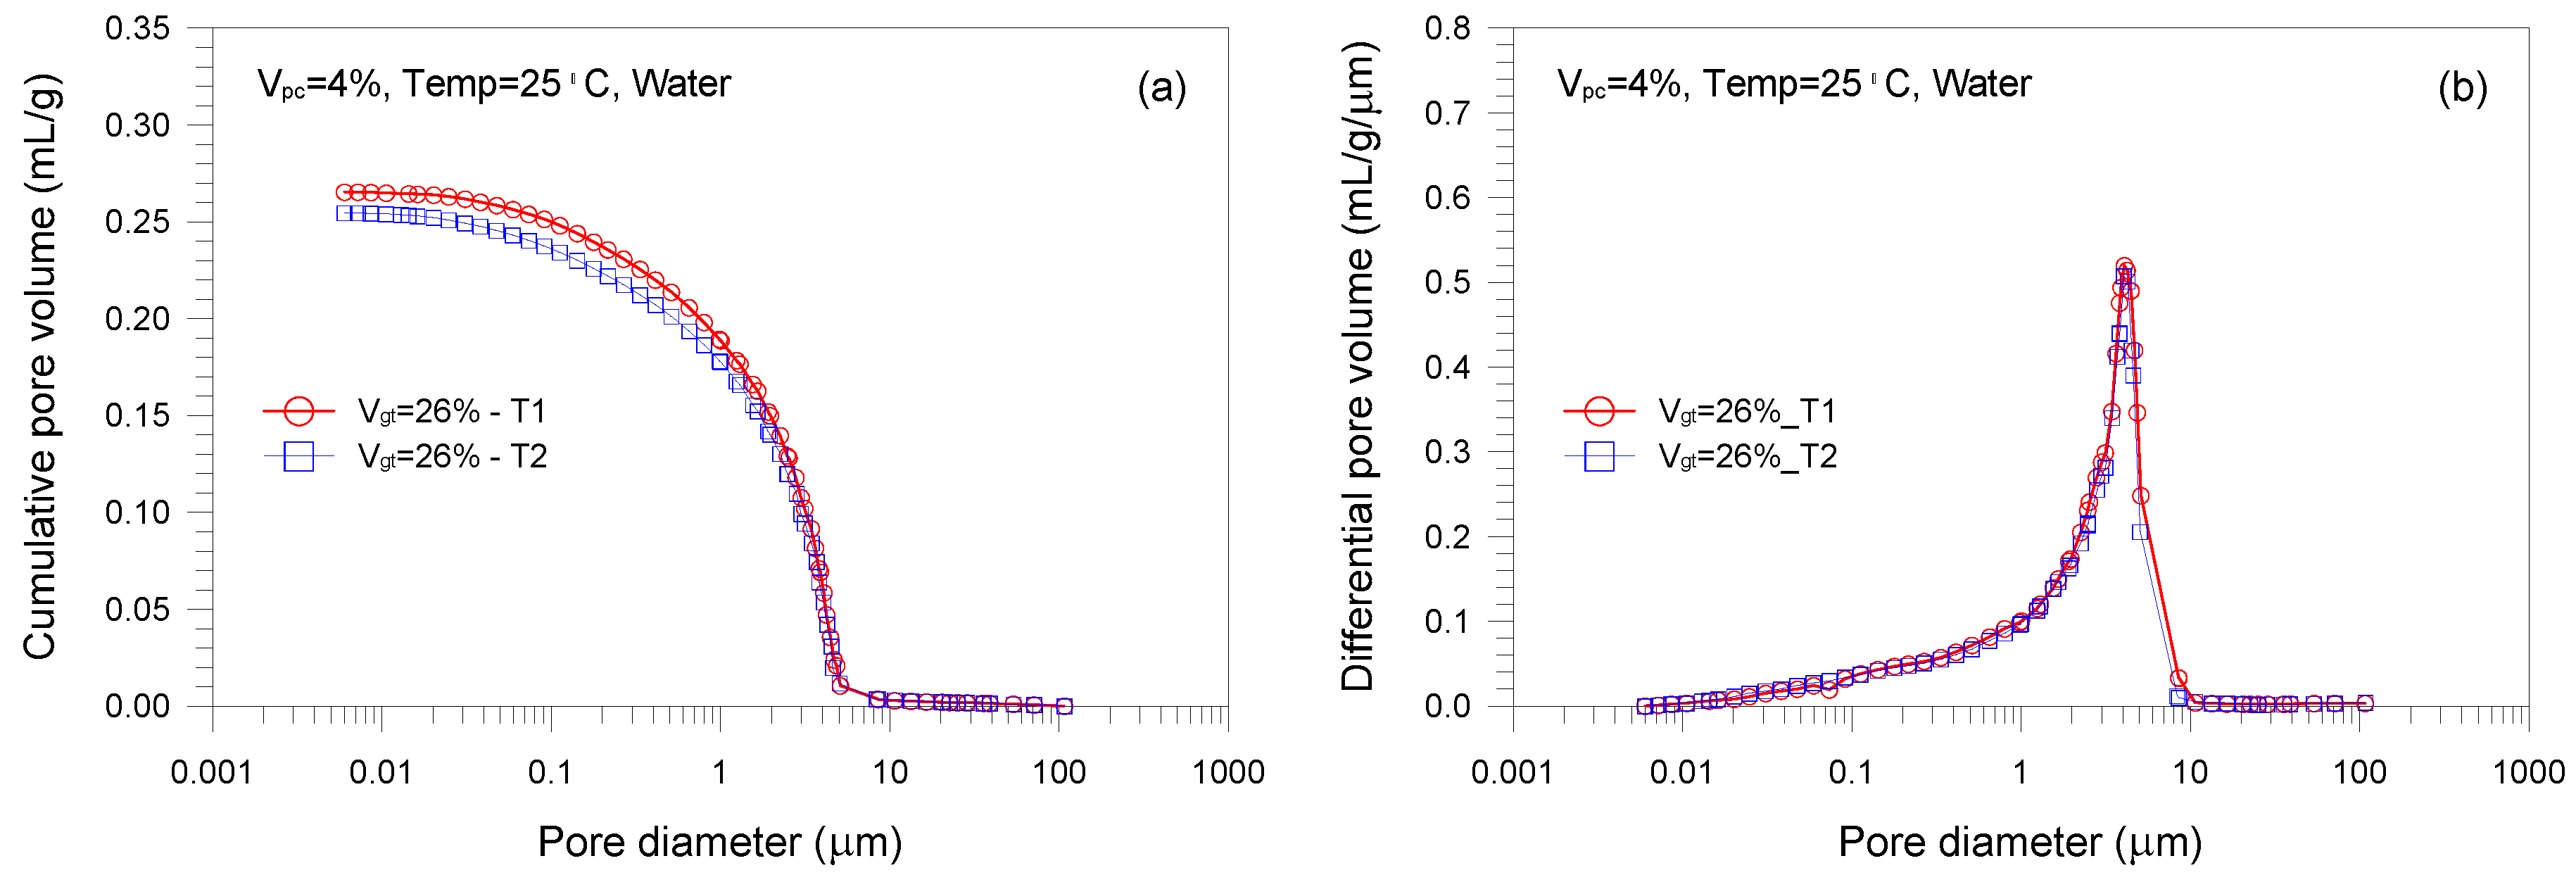
Figure 3.
Effect of tailings volume fraction on pore size distribution of cement-stabilized tailings: (a) cumulative intrusion curve; (b) differential instruction curve.
Figure 3.
Effect of tailings volume fraction on pore size distribution of cement-stabilized tailings: (a) cumulative intrusion curve; (b) differential instruction curve.

Figure 4.
Effect of cement volume fraction on pore size distribution of cement-stabilized tailings: (a) cumulative intrusion curve; (b) differential instruction curve.
Figure 4.
Effect of cement volume fraction on pore size distribution of cement-stabilized tailings: (a) cumulative intrusion curve; (b) differential instruction curve.
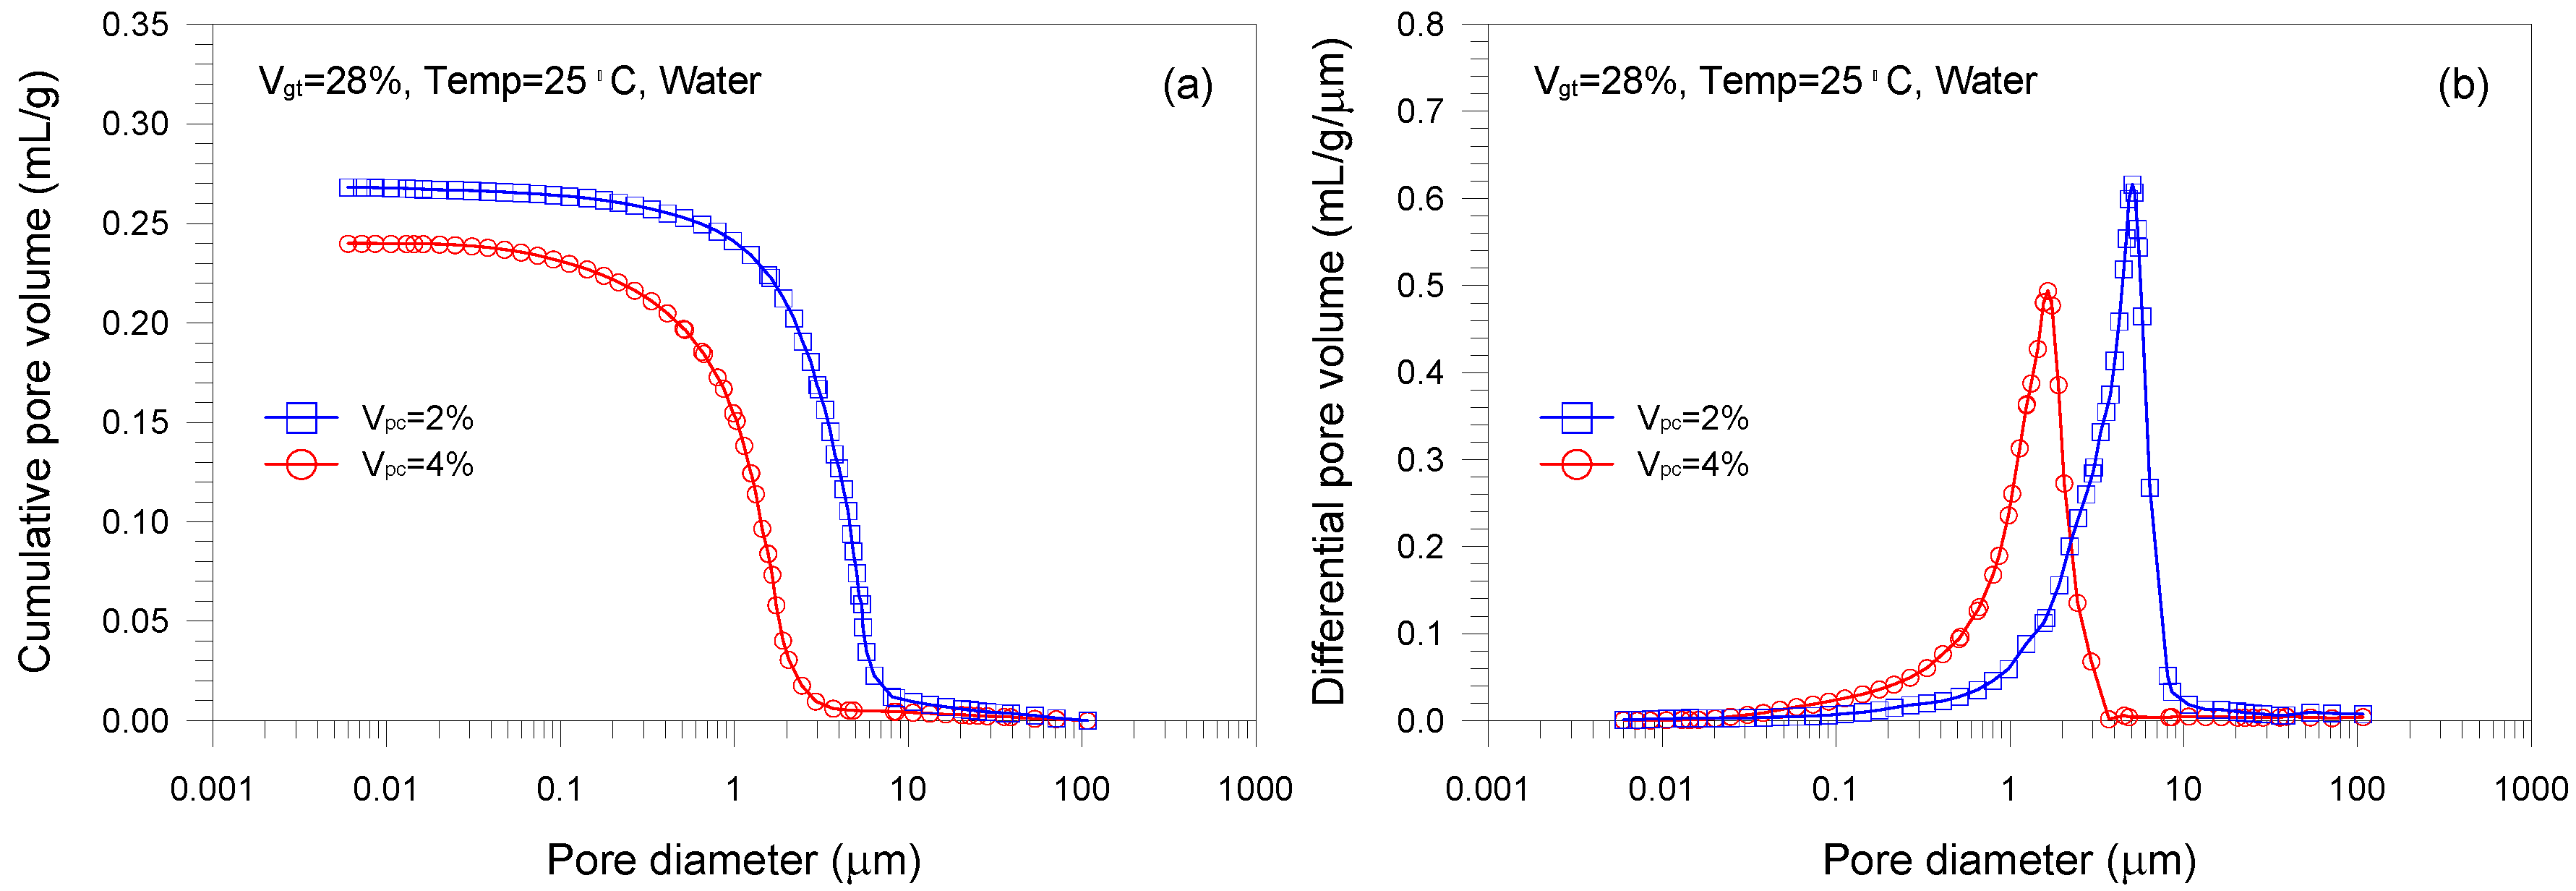
Figure 5.
Effect of curing temperature on pore size distribution of cement-stabilized tailings: (a) cumulative intrusion curve; (b) differential instruction curve.
Figure 5.
Effect of curing temperature on pore size distribution of cement-stabilized tailings: (a) cumulative intrusion curve; (b) differential instruction curve.
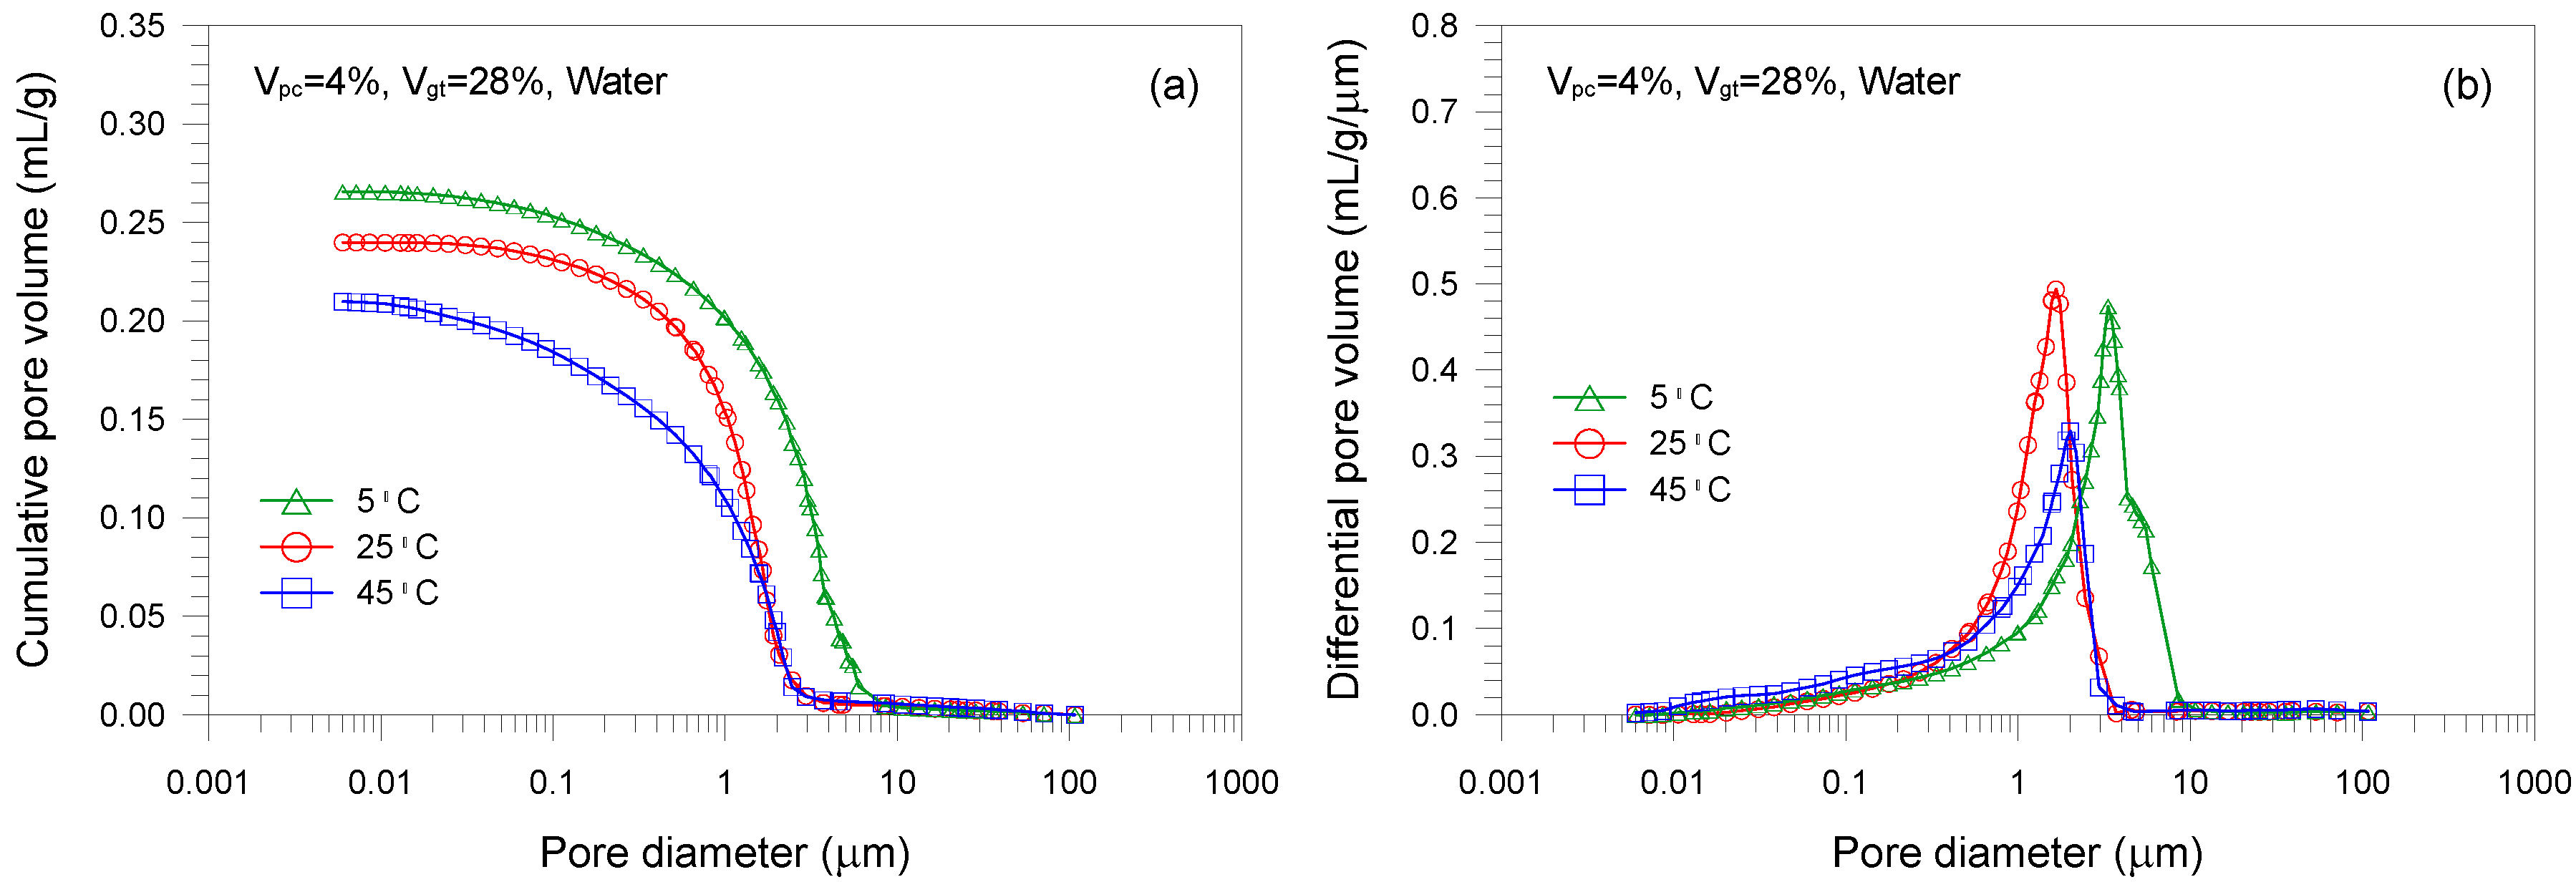
Figure 6.
Effect of CaCl2 concentration on pore size distribution of cement-stabilized tailings: (a) cumulative intrusion curve; (b) differential instruction curve.
Figure 6.
Effect of CaCl2 concentration on pore size distribution of cement-stabilized tailings: (a) cumulative intrusion curve; (b) differential instruction curve.
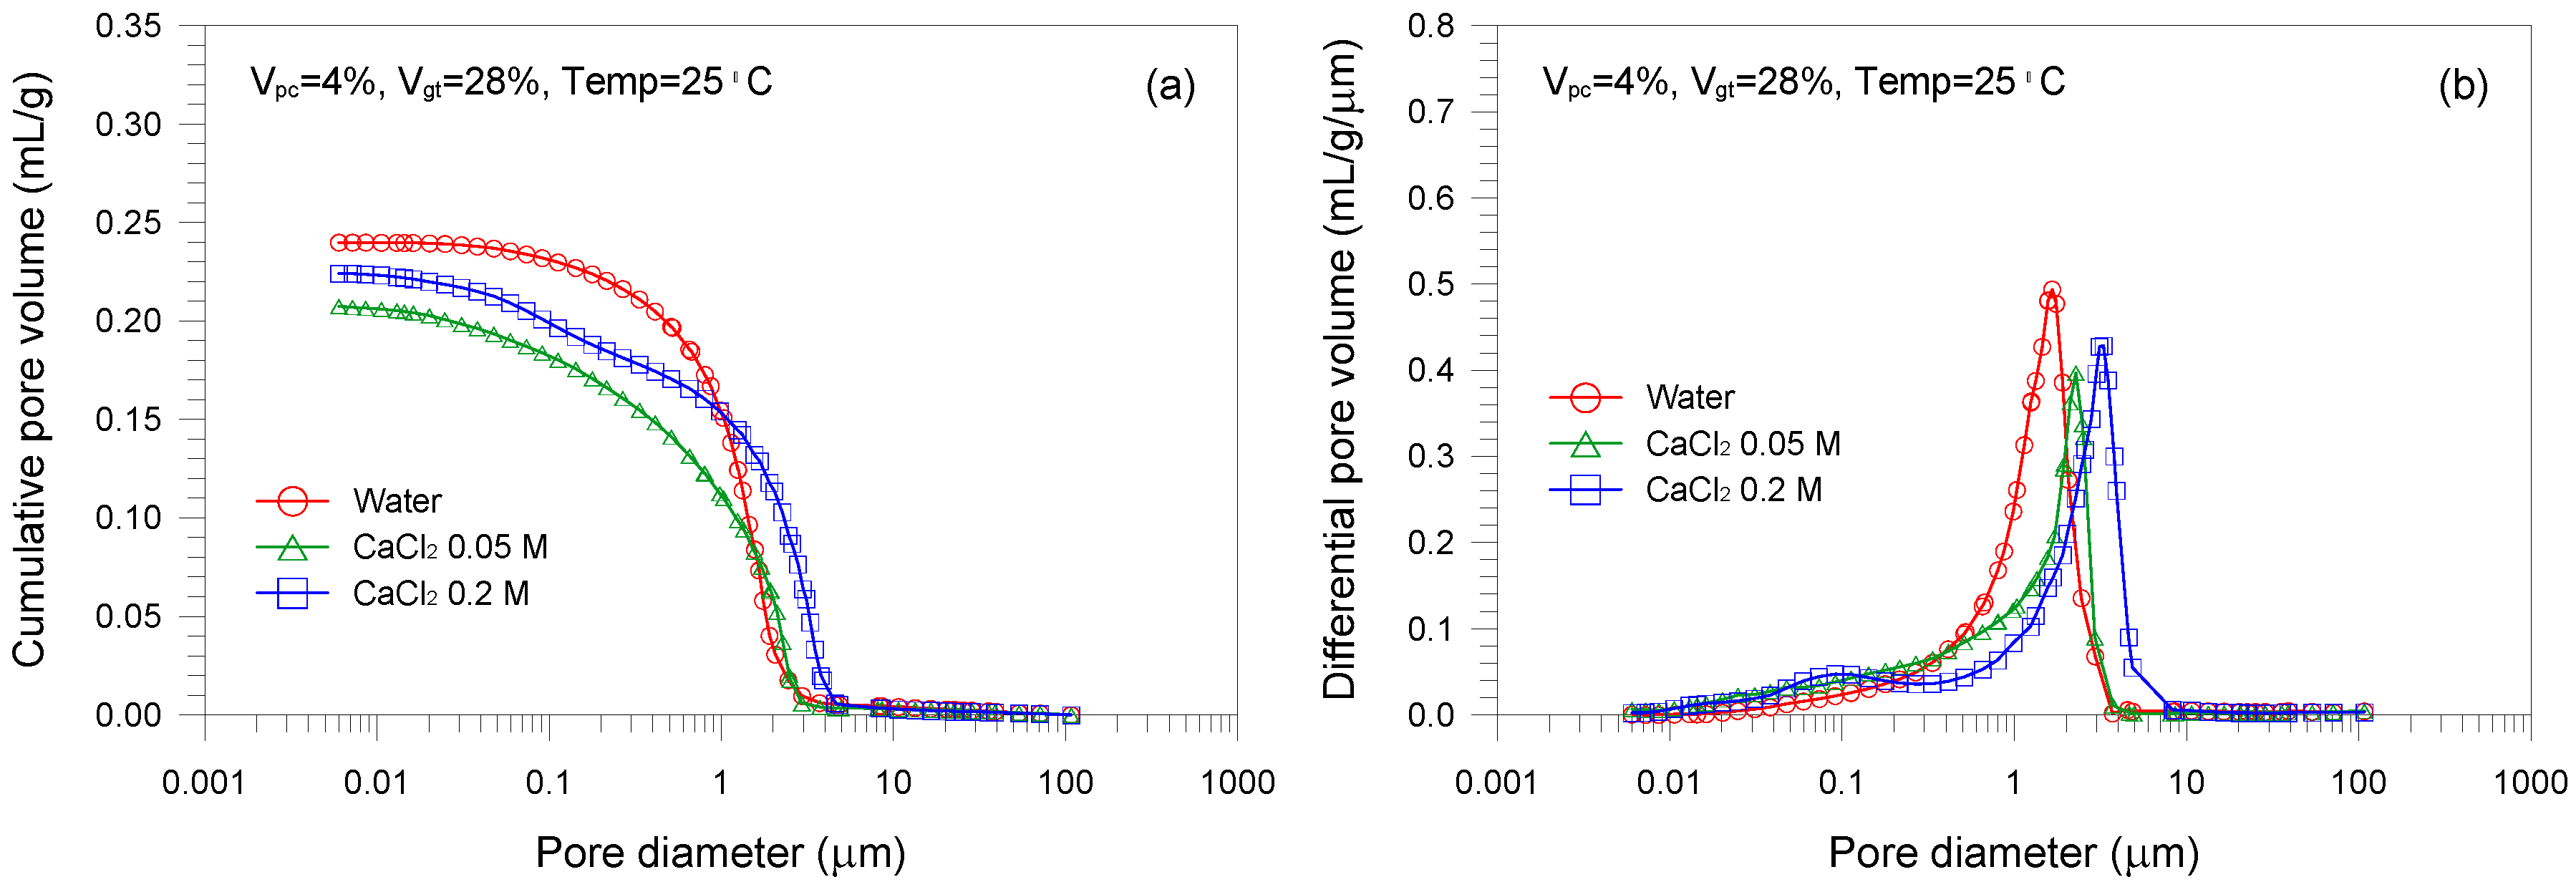
Figure 7.
Critical pore diameter and threshold diameter of cement-stabilized tailings.


Table 1.
Chemical composition of gold tailings and Portland cement.
| Chemical Composition | Gold Tailings (%) | Portland Cement (%) |
|---|---|---|
| Silicon dioxide (SiO2) | 50.82 | 19.48 |
| Ferric oxide (Fe2O3) | 28.97 | 3.05 |
| Aluminium oxide (Al2O3) | 8.87 | 5.14 |
| Magnesium oxide (MgO) | 3.39 | 2.21 |
| Calcium oxide (CaO) | 3.19 | 64.72 |
| Potassium oxide (K2O) | 0.84 | 0.44 |
| Titanium dioxide (TiO2) | 0.45 | ND |
| Magnesium oxide (MnO) | 0.36 | ND |
| Phosphorus pentoxide (P2O5) | 0.15 | ND |
| Sodium oxide (Na2O) | 0.02 | 0.17 |
| Chromium oxide (Cr2O3) | 0.02 | ND |
| Sulphur trioxide (SO3) | 0.05 | 3.36 |
| Loss of ignition (LOI) | 0.05 | 0.96 |
ND = not detected.
Table 2.
Summary of mix proportion and total pore volume
| Sample ID | Vgt | Vpc | Temperature (°C) | CaCl2 Conc. (M) | Total Pore Volume (mL/g) |
|---|---|---|---|---|---|
| Effect of tailings volume faction | |||||
| A1 | 26 | 4 | 25 | 0 | 0.265 |
| A2 | 28 | 4 | 25 | 0 | 0.240 |
| Effect of cement volume faction | |||||
| B1 | 28 | 2 | 25 | 0 | 0.268 |
| B2 (=A2) | 28 | 4 | 25 | 0 | 0.240 |
| Effect of curing temperature | |||||
| C1 | 28 | 4 | 5 | 0 | 0.266 |
| C2 (=A2) | 28 | 4 | 25 | 0 | 0.240 |
| C3 | 28 | 4 | 45 | 0 | 0.210 |
| Effect of CaCl2 concentration | |||||
| D1 (=A2) | 28 | 4 | 25 | 0 | 0.240 |
| D2 | 28 | 4 | 25 | 0.05 | 0.208 |
| D3 | 28 | 4 | 25 | 0.2 | 0.224 |
Note: Vgt = the volume fraction of gold tailings in tailings slurry; Vpc = the volume fraction of Portland cement in cement-tailings slurry mixture; CaCl2 conc. = the concentration of CaCl2 solution.
© 2018 by the authors. Licensee MDPI, Basel, Switzerland. This article is an open access article distributed under the terms and conditions of the Creative Commons Attribution (CC BY) license (http://creativecommons.org/licenses/by/4.0/).
Share and Cite
MDPI and ACS Style
Lee, J.K.; Shang, J.Q. Micropore Structure of Cement-Stabilized Gold Mine Tailings. Minerals 2018, 8, 96. https://doi.org/10.3390/min8030096
AMA Style
Lee JK, Shang JQ. Micropore Structure of Cement-Stabilized Gold Mine Tailings. Minerals. 2018; 8(3):96. https://doi.org/10.3390/min8030096
Chicago/Turabian StyleLee, Joon Kyu, and Julie Q. Shang. 2018. "Micropore Structure of Cement-Stabilized Gold Mine Tailings" Minerals 8, no. 3: 96. https://doi.org/10.3390/min8030096
Note that from the first issue of 2016, this journal uses article numbers instead of page numbers. See further details here.