Influence of Particle Size in Talc Suppression by a Galactomannan Depressant

1
School of Minerals Processing and Bio-Engineering, Central South University, Changsha 410083, China
2
School of Chemical Engineering and Energy, Zhengzhou University, Zhengzhou 450001, China
*
Authors to whom correspondence should be addressed.
Minerals 2018, 8(4), 122; https://doi.org/10.3390/min8040122
Submission received: 28 January 2018
/
Revised: 14 March 2018
/
Accepted: 16 March 2018
/
Published: 21 March 2018
(This article belongs to the Special Issue Flotation Chemistry)
Abstract
:Flotation behavior of different sizes of particles may follow different trends. The influence of particle size in talc suppression by a depressant galactomannan was studied in this research. The flotation response and mechanism were examined by flotation tests, modified flotation rate constant and entrainment recovery calculation, laser particle size experiments, adsorption tests, and advancing contact angle measurement as well as scanning electron microscopy (SEM) and energy dispersive X-ray spectrometry (EDS). The maximum recovery increased with particle size increases in the absence of galactomannan FPY (Fenugreek polysaccharide). The obviously suppressed effect was observed for the size fraction of −74 + 38 μm after reacting with FPY, but low efficiency was received for −38 μm and −10 μm, respectively. Laser particle size analysis indicated that the FPY has a certain function for the flocculation of fine particles. It is beneficial for reducing recovery by entrainment. EDS and advancing contact angle test results showed that the difference in contact angles probably is a result of genuine differences in the quantity of O and Mg bearing surface species, while the contact angle varied with particle size fraction in the absence of FPY. Adsorption and SEM test results demonstrated that in the case of −74 + 38 μm, the depressant adsorption density on the mineral surface is higher than the other two size fractions. On the whole, FPY probably is not enough of a depressant for talc suppression.
1. Introduction
Talc is a 2:1 layer silicate, Mg3(Si2O5)2(OH)2, comprised of sheets linked by weak van der Waals forces [1]. There are two different surfaces formed during grinding. Firstly, the basal cleavage planes contained no broken Si–O and Mg–O bonds formed by the rupture of van der Waals bonds. This surface is neutral and hydrophobic [2]. In contrast, the edges of the mineral sheets exhibit hydrophilic properties as they contain pH-dependent SiOH and MgOH groups [3,4]. Besides, the proportion of edges of mineral sheets gradually increase as the particle size reduces [5]. However, on the whole, talc always exhibits a good natural floatability. Being naturally hydrophobic, as in nickel sulfide processing, talc easily leads to flotation concentrates, thus reducing the concentrate grade and causing downstream processing problems as well as increased smelting costs [6,7,8]. Therefore, it is a major problem in the presence of hydrophobic gangue in the separation between talc and different sulfide ores.
At present, depressants play an important role in affecting the selective separation of sulfide minerals from sulfide ores by flotation. There are numerous reports [4,9,10,11,12,13,14,15] on the application of a polymer as a depressant for talc and other magnesia-bearing minerals present as impurities in various sulfide ores. Meanwhile, guar gum has been one of the most widely used depressants for magnesia-bearing gangue minerals [16,17]. However, this tends to force guar gum pricing to be market-related and it usually suffered the disadvantages of limited availability and high cost [18]. Therefore, there is a demand to develop more selective, cheap, and high performance depressants for the separation of sulfide minerals from magnesia-bearing minerals.
Fenugreek polysaccharide (FPY), is made from the root of the amorphophallus or trigonella plants and is a new high molecular weight polysaccharide, used as a powerful water-soluble dietary fiber supplement in food additives, medicine, chemicals, etc. [19,20,21]. Amorphophallus and trigonella plants are widely grown in Southern China and Japan [18]. Thus, FPY was the advantage of being an abundant resource and low in price compared to guar gum. Zhao et al. [7], according to zeta-potential and infrared spectrum analysis, indicated that FPY could be selectively and strongly adsorb on talc surfaces through chemical adsorption, while a weak physical adsorption occurred between FPY and pentlandite.
At present, most of the published literature commonly used the special mineral particle size as the flotation material in the suppressed efficiency research [11,15,22,23]. However, this ignores the influence of other size fraction particles in the studied depressant, especially for fine particles, even though it has been shown that the behavior of different sizes of particles may follow different trends [24,25].
In this study, the flotation results for −10 μm, −38 μm, and −74 + 38 μm particles with and without FPY were deeply analyzed on the basis of the previous work by Zhao et al. [7]. The depression mechanism of FPY for different size fractions of talc was investigated by modifying the first-order flotation rate constant analysis, the empirical model for the degree of entrainment calculation and adsorption experiments, and the scanning electron microscope (SEM) tests. In order to reveal the genuine differences in surface species, each size fraction was analyzed by energy dispersive X-ray spectrometry (EDS) while at the same time contact angles were measured on each size fraction by the Washburn method.
2. Experimental
2.1. Samples and Reagents
2.1.1. Samples
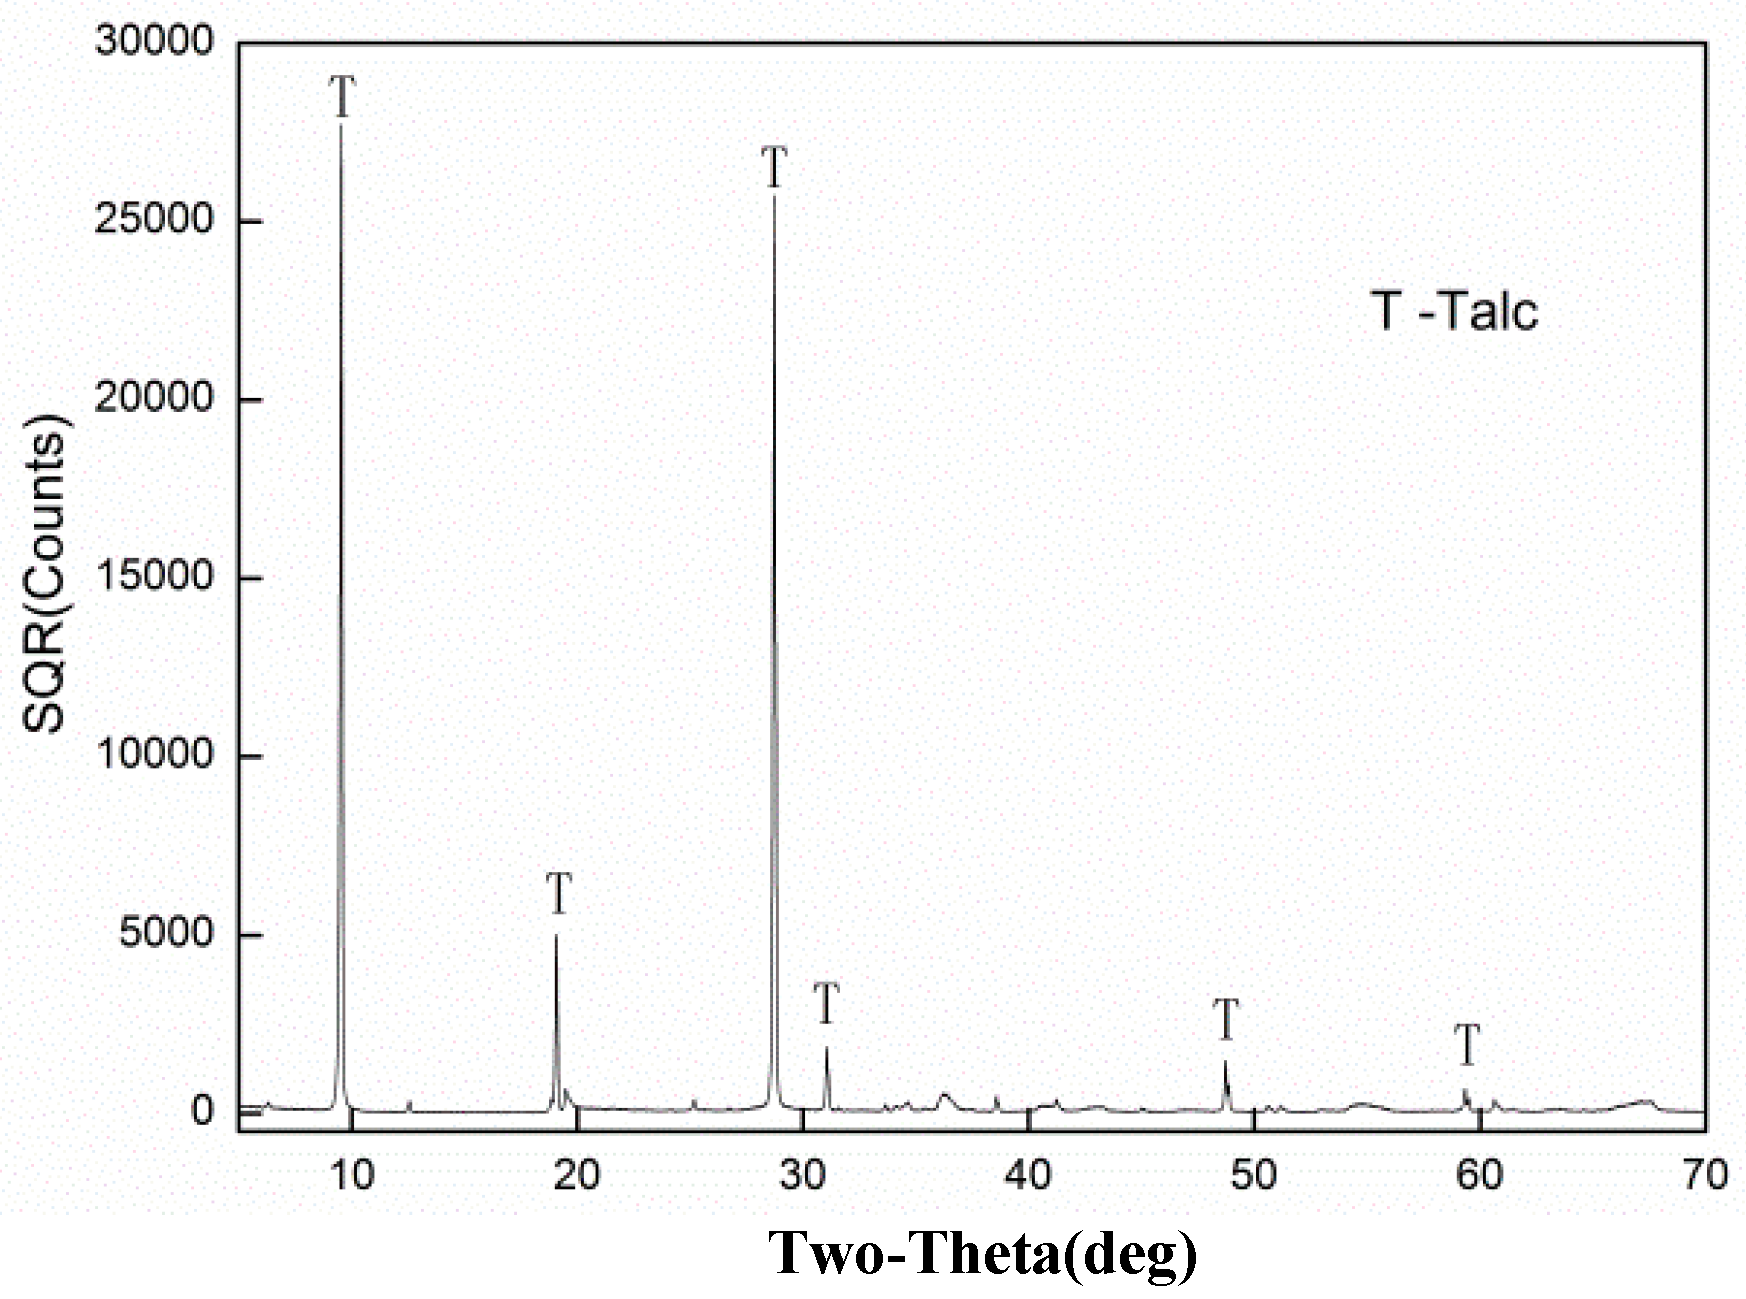
Pure talc samples were obtained from Anhui Mining Corporation, China. The purity of the mineral sample was more than 90% by X-ray diffraction analysis and chemical analysis, as shown in Figure 1 and Table 1. The sample was shown to include the major ash elements S and C at 3.18% and 1.46%, respectively. Hand-selected crystals of these minerals were crushed to −1 mm in a laboratory roll crusher. The crushed products were then ground in a ceramic ball mill and the product was screened into three narrow size fractions: −74 + 38, −38, and −10 µm. It is noted that the size fraction of −10 μm was received in the settlement of hydraulic and the solid mass concentration is 16.6% (sedimentation time, 26 min 12 s) [26]. The size distribution of narrow size fractions is given in Figure 2 and summarized in Table 2.
2.1.2. Reagents
The depressant galactomannan (FPY, structure (C6H10O5)n, >95% purity) was extracted and purified from fenugreek powder. The viscosity of aqueous solutions of 1% (by weight) FPY was 25–30 Pa·s. It was supplied by the Institute of Multipurpose Utilization of Mineral Resources Flotation Reagents Limited Company. The solution was made up to the required volume by adding distilled water and then left to equilibrate overnight. Fresh solutions were prepared every three days. In the micro-flotation tests, FPY, guar gum, or carboxymethyl cellulose (CMC) were used as the depressant, sodium isobutyl xanthate (SIBX) was used as the collector, methyl iso-butyl carbinol (MIBC) was used as the frother, and hydrochloric acid (HCl) and sodium hydroxide (NaOH) were used as the pH regulators. Cyclohexane (analytical grade) was used in advancing contact angle measurements. In addition, all reagents used in micro-flotation tests were of analytical grade. Deionized double distilled water was used for micro-flotation, contact angle tests, and adsorption experiments as well as laser particle size analysis.
2.2. Experiments
2.2.1. Micro-Flotation Tests
A flotation machine of XFG-1600 type (mechanical agitation) with the volume of 40 mL was used in the micro-flotation tests. The mineral suspension was prepared by adding 2.0 g of a single mineral to 40 mL of solutions in single mineral flotation tests. The pH of the mineral suspension was adjusted to the desired operating value by adding HCl or NaOH stock solutions.
For flotation comparison experiments of different depressants (fixed pH = 6.5), the general reagent addition scheme involved depressant, collector, and then frother addition with each stage having a 2-min conditioning period prior to the addition of the next reagent. Flotation concentrates were then collected for a total of 5 min. The floated and un-floated particles were collected, filtered, and dried. The recovery was calculated based on solid weight distribution between the two products. In flotation dynamics tests of talc, the general reagent addition scheme involved depressant and then frother addition with each stage having a 2-min conditioning periods prior to the addition of the next reagent. Concentrates were collected at 20 s, 40 s, 1 min, 2 min, 3 min, and 5 min cumulative flotation time with a scraping rate of one every 2 s. The following conditions were constant in all tests, unless otherwise noted: (1) a superficial gas velocity, Jg of 3.11 cm/s, (2) impeller rotational speed of 1900 rpm, (3) solids concentration of 4.7%, (4) frother addition of 8 mg/L at the beginning of the test, (5) a froth depth of about 0.5 cm. The floated and un-floated particles were collected, filtered, and dried. In single mineral flotation, the recovery was calculated based on solid weight distribution between the two products. Product wet and dry weights were used to determine the water recovery.
2.2.2. Determination of Modified Flotation Rate Constant
Many kinetic models have been proposed to analyze flotation time-recovery profiles by different investigators [27]. Among these models, the classical first-order kinetic model was widely used to evaluate the effect of various parameters such as operating variables for flotation [25,28,29]:
where R(t) (%) is the accumulative combustible recovery by flotation time t (min), R∞ (%) represents the ultimate recovery, and K (min–1) is the rate constant. The model parameters (R∞ and K) can be determined by fitting the experimental data points with Equation (1) and minimizing the residual sum of squares, which can be effectively used to evaluate the effect of variables on the flotation process [30]. However, it is difficult to compare the flotation model parameters between tests or to establish a trend for R∞ and K values under different conditions. Therefore, some researchers have adopted a modified flotation rate, taking constant into account both the ultimate recovery and the rate constant that is applied to analyze the flotation result [31]. In this paper, the modified flotation rate constant was calculated by:
2.2.3. Recovery by Entrainment
Particles were recovered via two primary mechanisms: (1) by true flotation, in which hydrophobic particles were recovered by attachment to air bubbles, and (2) by entrainment, which involves the nonselective recovery of particles in water to the concentrate, irrespective of whether they are hydrophobic or hydrophilic [31,32]. It is worth noting that the water in the cell used in this calculation included both the water initially added to the flotation cell as well as the distilled water which was added to maintain the pulp level. This added water was dosed with frother at the same concentration as that added at the beginning of the test (i.e., 8 mg/L) with the aim of achieving a relatively constant concentration of frother in the cell throughout each experiment. The equation to calculate water recovery is showed as follows:
where is the weight of water in the foam concentrate, is the water initially added to the flotation cell, and is distilled water which was added to maintain the pulp level. Caution should be required when comparing the water recovery values presented in this paper with those presented elsewhere, as they may have been calculated differently.
The recovery by entrainment was virtually the water-recovered value corrected by the degree of entrainment. The simplified model of gangue recovery by entrainment commonly seen in the literature is as follows [33]:
where Rent,i is the recovery by entrainment (for particle size i), Rw is the water recovery, and ENTi is the degree of entrainment for particle size i. An empirical mathematical model [34] for the degree of entrainment was proposed to relate the degree of entrainment to particle size and density, as shown in Equation (4):
where is the specific gravity of the solid particles, is the density of the water, di is the particle diameter, and g is the gravitational acceleration. It should be noted that in the experiments performed in the current study only particle size was varied, while the other operating conditions were kept constant, such as fluid viscosity and particle shape. In addition, the parameters used by the authors are not the same as those used by Wang et al. [34].
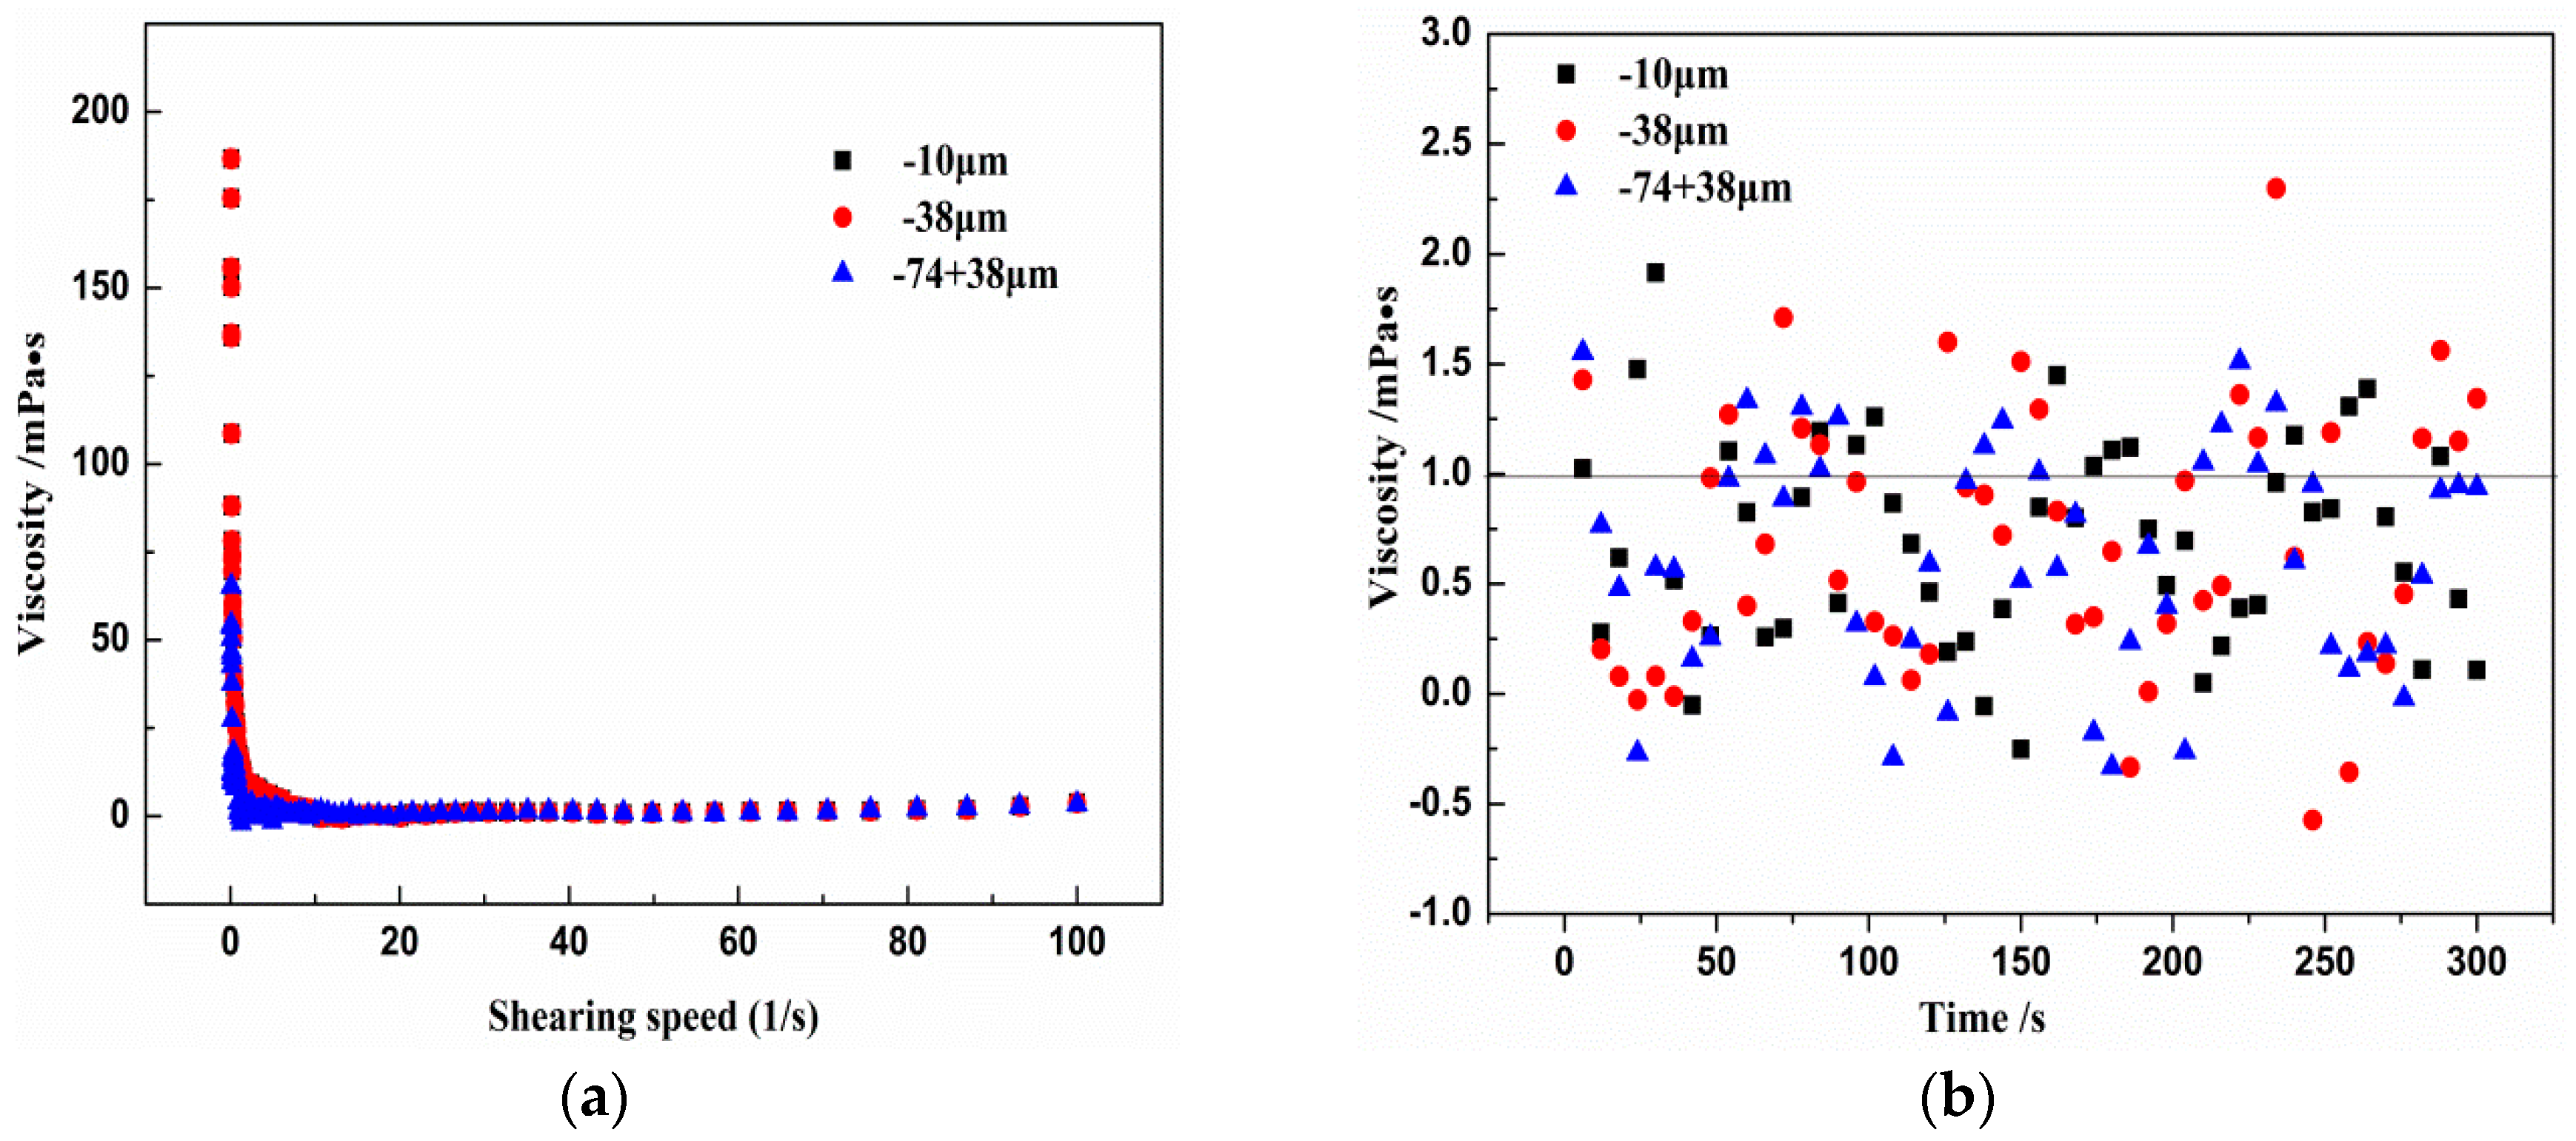
Figure 3 indicates that the fluid viscosity for the three size fractions of talc basically remained consistent all the time. In particular, Figure 3b demonstrates that all fluid viscosity values of the three size fractions of talc are on the verge of 1 mPa·s (the viscosity of water, with a temperature of 20 °C). This is possible due to the low solid concentration (mass percent at 4.7%) in the flotation process. In a word, it is expected that this operating condition, fluid viscosity, was kept constant throughout this study. Secondly, mineral particles almost showed a trend of generating spherical particles through continuous ball-mill grinding with the decrease of grain size. The size of all talc particles used in this research was −74 μm; therefore, it is possible to assume that this operating condition, particle shape, was also kept constant throughout this study, although a difference in particle shape may exist.
2.2.4. Laser Particle Size Experiments
For the particle size analysis, 2.0 g of single mineral was taken and made up to 40 mL after the addition of distilled water in 1000-mL beakers. The corresponding flotation agents, which were the same types as those used in the flotation test, were added into the pulp and stirred for 5 min. The mean size of the pulp was then measured with a laser particle size analyzer at a spindle speed of 1900 rpm (MasterSizer 2000, Malvern, UK).
2.2.5. Adsorption Tests
In the adsorption experiments, 2 g of pure mineral particles was added to 40 mL distilled water in 100-mL beakers, and the desired concentration of FPY was added at a pH equal to 6.5. The suspension was stirred for 3 min and subsequently filtered. The filtrate was centrifuged under the conditions of 25 °C centrifugal temperature and 9000 rpm centrifugal speed for 20 min. Fifteen milliliters of supernatant was transferred to a clean centrifuge tube for the TOC (Total Organic Carbon) test after the centrifugation was completed. The same procedure was used to determine the original TOC of FPY without reacting minerals. The TOC (T1) of FPY remaining in the supernatant was measured using the TOC-L machine supplied by Shimadzu, Japan. It was assumed that the amount of TOC (T2) of FPY depleted from the solution had adsorbed onto one particular mineral phase. The amount of TOC for a single FPY particle was recorded as T0.
2.2.6. Advancing Contact Angle Measurement
In this section, preparation steps for the advancing contact angle measurement of samples with FPY was carried out as follows: 2 g of pure mineral particles was added to 40 mL distilled water in 100-mL beakers, followed by the addition of the desired concentration (25 mg/L) of FPY at a pH equal to 6.5. The suspension was stirred for 3 min and subsequently filtered. Then, the filter residue was washed three times using distilled water and dried in a vacuum drying box at a temperature 40 °C. The Washburn et al. [35] method was chosen for its simplicity and the fact that several measurements can be conducted in a short time with good reproducibility [36]. Conditioned mineral samples were prepared for the contact angle determination in exactly the same manner as was used for the adsorption isotherms. A sample tube with a diameter of 12 mm and a height of 50 mm was used, and marked on one side with a scale of 5-mm increments to a maximum of 40 mm. The 5-mm mark on the tube represented “0” mm on the graduated scale during the experiments. A clean rolled ball of cotton wool was placed at one end of each of the four tubes to act as a porous plug. The open end of each tube was placed twice into a vial containing the particles. The collected particles were maneuvered down the tube, by tapping the tube on a level surface closed end down, until the particles were level and packed. This was repeated until the particles reached the 40-mm level.
Besides, it should be noted that the key to applying the Washburn method is in obtaining two sample tubes with two reproducible packed powder structures [37]. Therefore, we prepared samples by an improved technique proposed by Burt and Fewtrell [38], which comprises preparing beds of powders for the contact angle tests of particles. The method involves the manual filling of sample tubes with the powder under study using a spatula and then compacting the beds by centrifugal force using a laboratory centrifuge. The centrifuge used in this work was a Rotofix 32A (provided by Hettich, Kirchlengern, Germany) in which three samples were prepared in each run. It was found that the method gave three similar reproducible samples and that same packing porosity could be obtained for fine powders [37] by using the same speed of rotation of 3000 rpm for 10 min.
The tubes were placed in solutions of either distilled water or freshly prepared cyclohexane. The time taken for the wetting front to reach each of the 5-mm increments up to the 20-mm mark, starting from “0” mm, was recorded. Two measurements were made for each particle type and each solution. Measurement with distilled water utilizes the following equation:
where H is the liquid height gain, is a material constant, and ρ is the density of the liquid. For the calibrating liquid (cyclohexane), which is fully wetting, Equation (5) becomes:
From Equation (6), is calculated and substituted into Equation (5) to calculate the advancing contact angle. The material constant, which is a geometric factor, reflects the porosity and capillary tortuosity, and is determined by the particle size and bulk density [39]. This method assumes that (1) laminar flow exists, (2) the effect of gravity is negligible, and (3) the material packing structure is the same during the measurement with water and cyclohexane as the wetting liquids.
2.2.7. Scanning Electron Microscopy and Energy Dispersive X-ray Spectrometry Analysis
Each measure of 2 g talc was mixed in a solution of 25 mg/L FPY and conditioned for 10 min at pH 6.5. The solids were then washed with deionized water, air dried and coated with carbon, and then analyzed by a scanning electron microscope (SEM) from Camscan Electron Optics, Ltd., Cambridge, UK. An energy dispersive X-ray spectrometry (EDS) test was carried out for different size fractions of talc without FPY. SEM was used to map the surface topography and identify talc surfaces, while EDS was used to identify elements concentration on talc surfaces and to determine the atomic concentration [40].
3. Results and Discussions
3.1. Comparision of Different Depressants
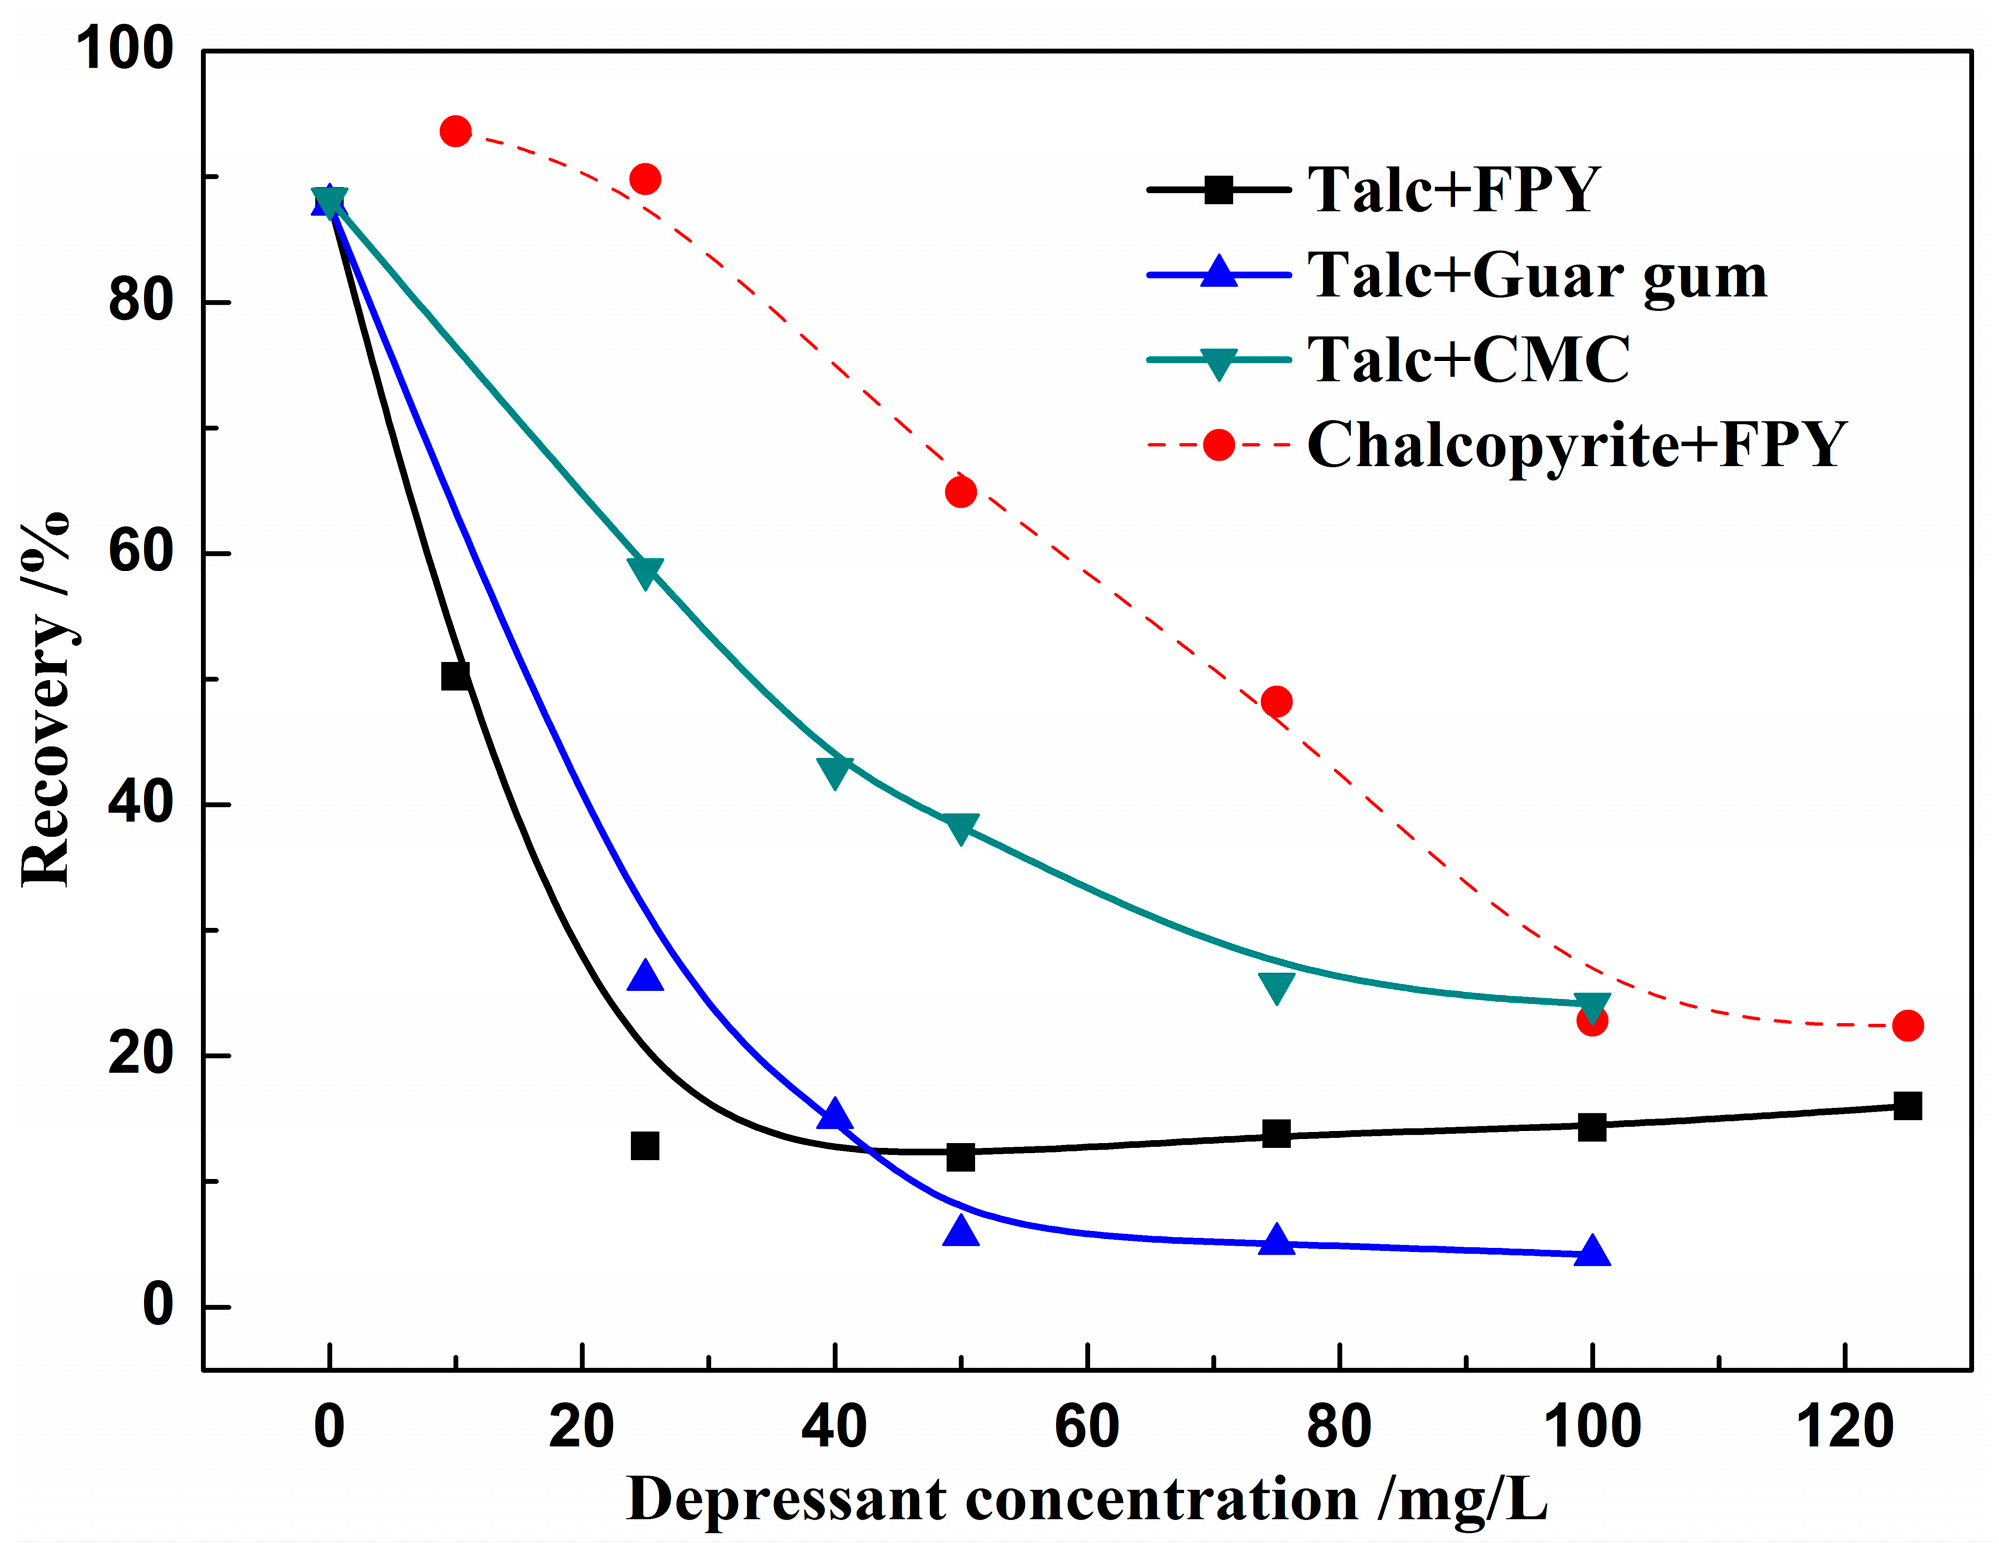
Figure 4 shows the effects of different depressants on the floatability of talc. The results in Figure 4 demonstrated that, compared with CMC and the low dosage of guar gum, the floatability of talc became weaker after adding the FPY depressant at pH = 6.5. It is also indicated that FPY had little depression effect on chalcopyrite, while the talc recovery decreased dramatically with an increase in FPY concentration. In the presence of 25 mg/L FPY, the flotation recovery of talc was about 15%, and the recovery of chalcopyrite was about 90%. The results demonstrated the selective depressive effect of FPY on talc. In addition, the flotation recovery of talc was about 25% with 25 mg/L guar gum. As shown in Figure 4, the results are in accordance with the test by Zhao et al. [41], which reveals that the measurement is reliable. In a word, alternatives could be found to guar gum.
3.2. Flotation of Independent Size Fraction
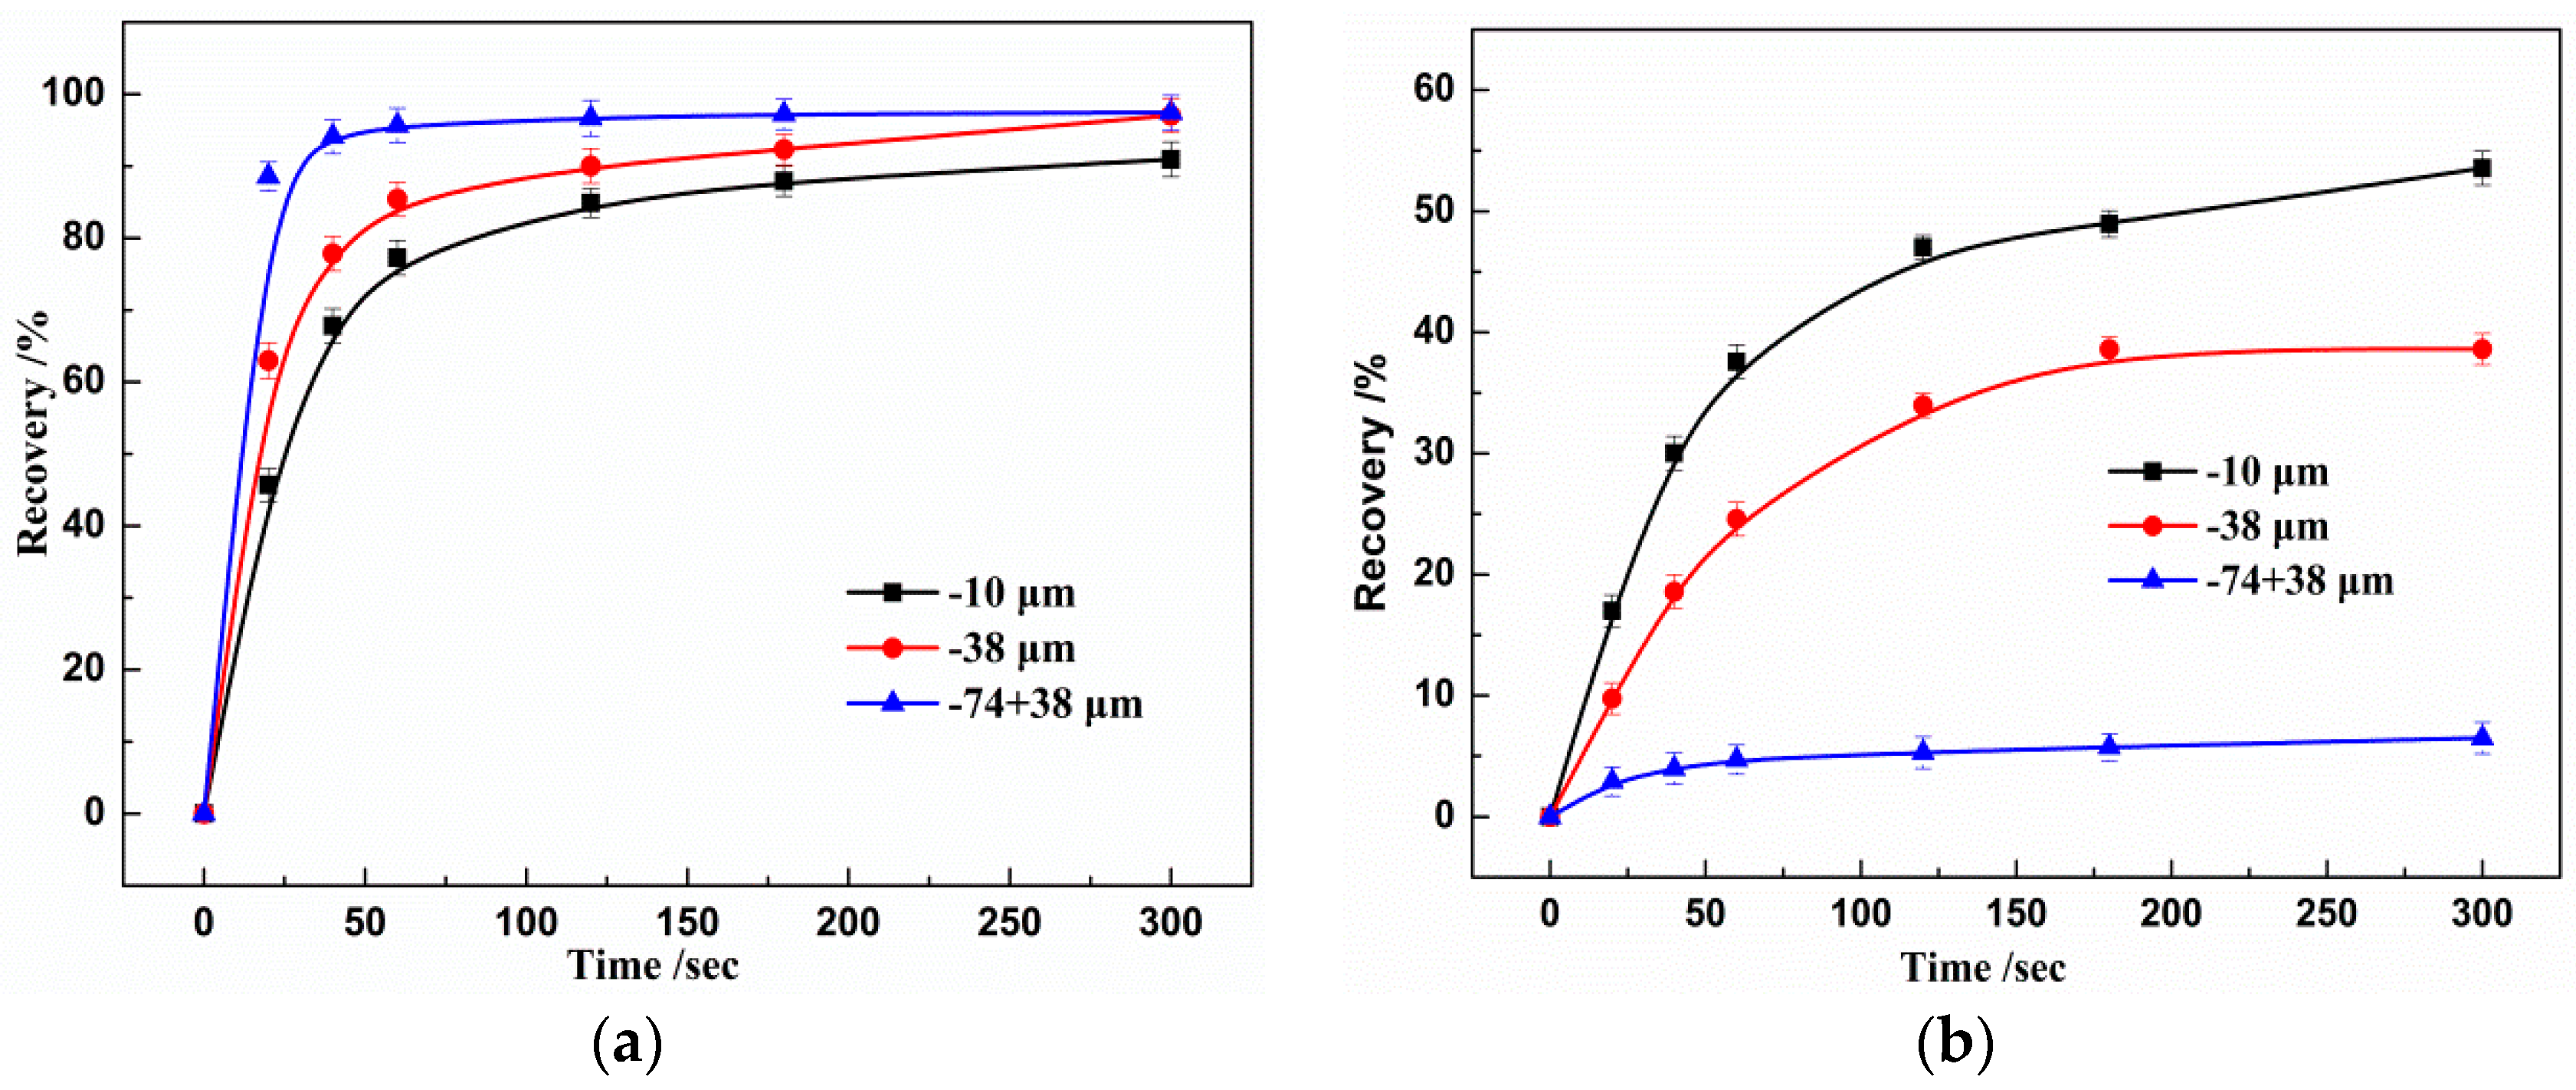
All of the samples were thoroughly equilibrated, and an average recovery value of three individual measurements was recorded for each of the experimental points. Only a small deviation (<2%) was exhibited between the three individual measurement results and the average recovery value. The accumulative recovery results for different size fractions with and without FPY are shown in Figure 5. Table 3 shows the calculated model parameters for the three size fractions of talc. As expressed in Figure 5a, a large portion of the floatable particles is recovered within 1 min. The maximum recovery (t = 5 min) of −74 + 38 μm particles is similar to that of −38 μm particles, above 97%, but both are slightly higher than that of the size fraction −10 μm, 90%. Figure 5b indicates that the obviously suppressed effect is observed for three size fractions after adding FPY, especially for the size fraction of −74 + 38 μm. However, comparatively speaking, the maximum recovery of particle size at −10 μm and −38 μm is higher than that of the size fraction of −74 + 38 μm. Moreover, the recovery difference of size fractions may due to water recovery or entrainment rather than a true flotation via bubble attachment, which can be associated with the small mass and high specific surface area [42]. This issue will be further discussed in the next section.
As shown in Table 3, without FPY, particles at −74 + 38 μm have the highest Km. With the reduction in the particle size of talc particles, the Km value decreases. This may be because fines particles can improve the surface hydrophilicity with particle size decreases even though fine particles can improve the froth stability by reducing bubble coalescence [43]. The Km of the three size fractions of talc after reacting with FPY is decreased compared with the corresponding size particles without FPY. In addition, the Km of coarse particles (−74 + 38 μm) is lower than that of the other size fractions. On the whole, FPY is obviously efficient for the suppression of talc at the −74 + 38 μm particle size, but not enough for the suppression of the size fractions of −38 and −10 μm.
3.3. Recovery by Entrainment Analysis
As mentioned above, the recovery difference of size fractions may be due to water recovery or entrainment rather than a true flotation via bubble attachment. Table 4 shows the recovery of entrainment (Rent.i) for the three size fractions of talc. The density of the fluid and particle is assumed to be 1 g/cm3 and 2.75 g/cm3 and the arithmetic mean particle size (μm) is used in this research. It should be noted that FPY may have a certain function for the flocculation of fine particles. Therefore, the particle size tests operate in the presence and absence of FPY, and corresponding results are shown in Table 4. The results demonstrated that the mean particle size (di) of the fractions at −38 μm and −10 μm increased significantly from 26 μm and 7 μm to 31 μm and 11 μm, respectively, with a FPY dosage of 25 mg/L.
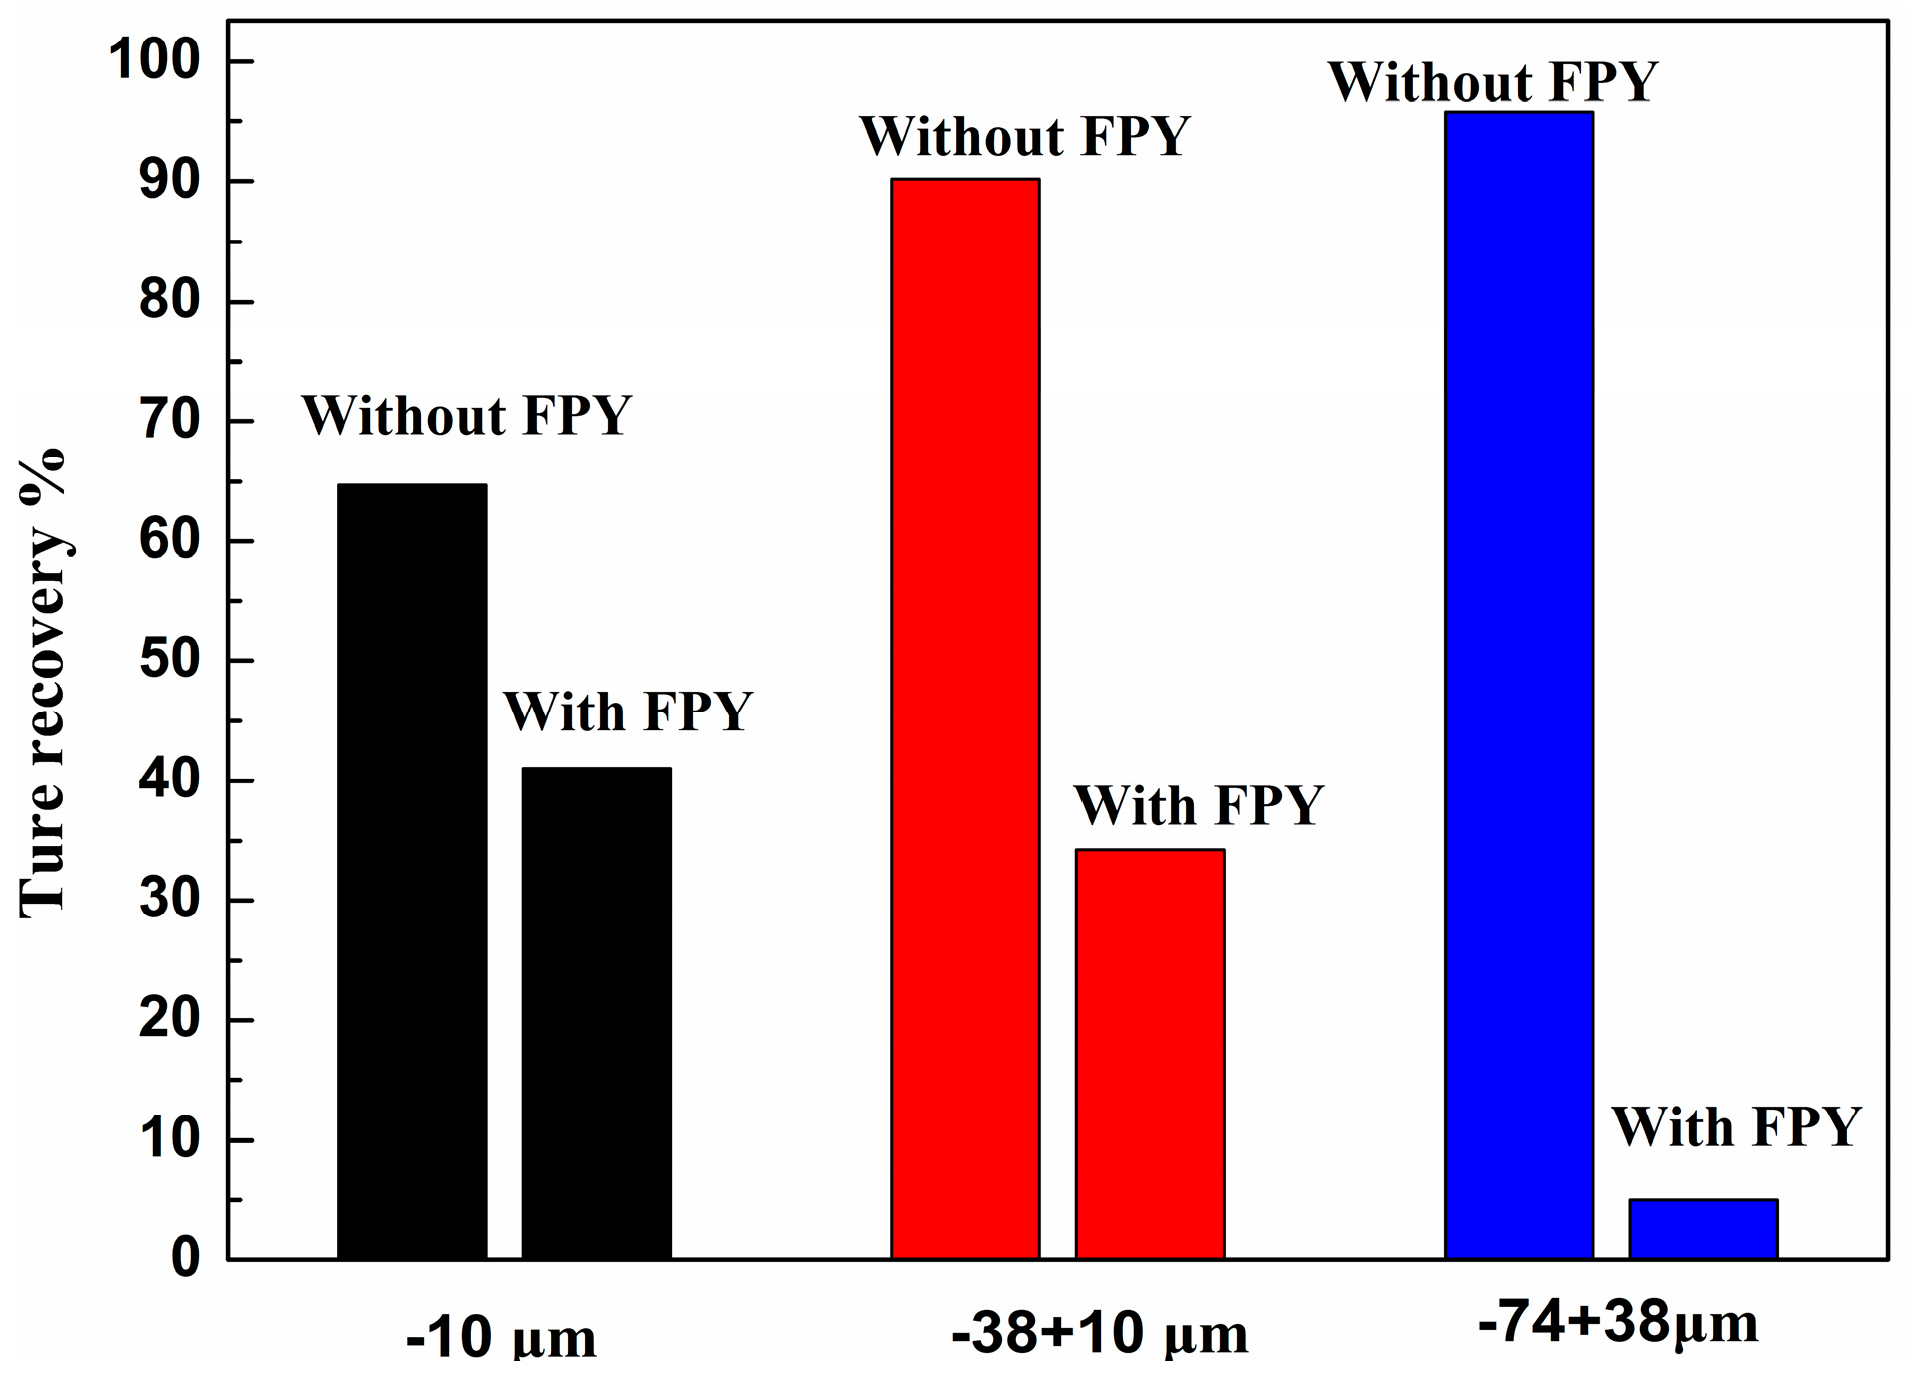
The ENTi values of talc were obtained from the laboratory flotation cell decrease with an increase in particle size with or without FPY. ENT values of the larger sized particles settle faster and experience greater drainage relative to water in comparison to particles with a smaller size [38], indicating significantly lower recovery by entrainment. In addition, the recovery of true flotation via bubble attachment of the three size fractions in the presence and absence of FPY is expressed in Figure 6. It is indicated that FPY as a depressant is effective for the suppression of talc present in different size fractions. Of course, it should be noted that the significant difference of the suppression efficiency for the three size fractions of talc is observed with a dosage of 25 mg/L FPY. The true recovery calculation results indicated that the recovery of talc decreased by 24%, 56%, and 91% for −10 μm, −38 μm, and −74 + 38 μm, respectively, after reacting with FPY. The coarser particles, −74 + 38 μm, indicated a significantly stronger suppression effect by FPY compared with the finer particles, −10 μm. This is probably due to the lower adsorption density of FPY for finer particles with a greater specific surface area than coarse particles. This issue will be further discussed in the next section.
3.4. Contact Angle Variation with Particle Size
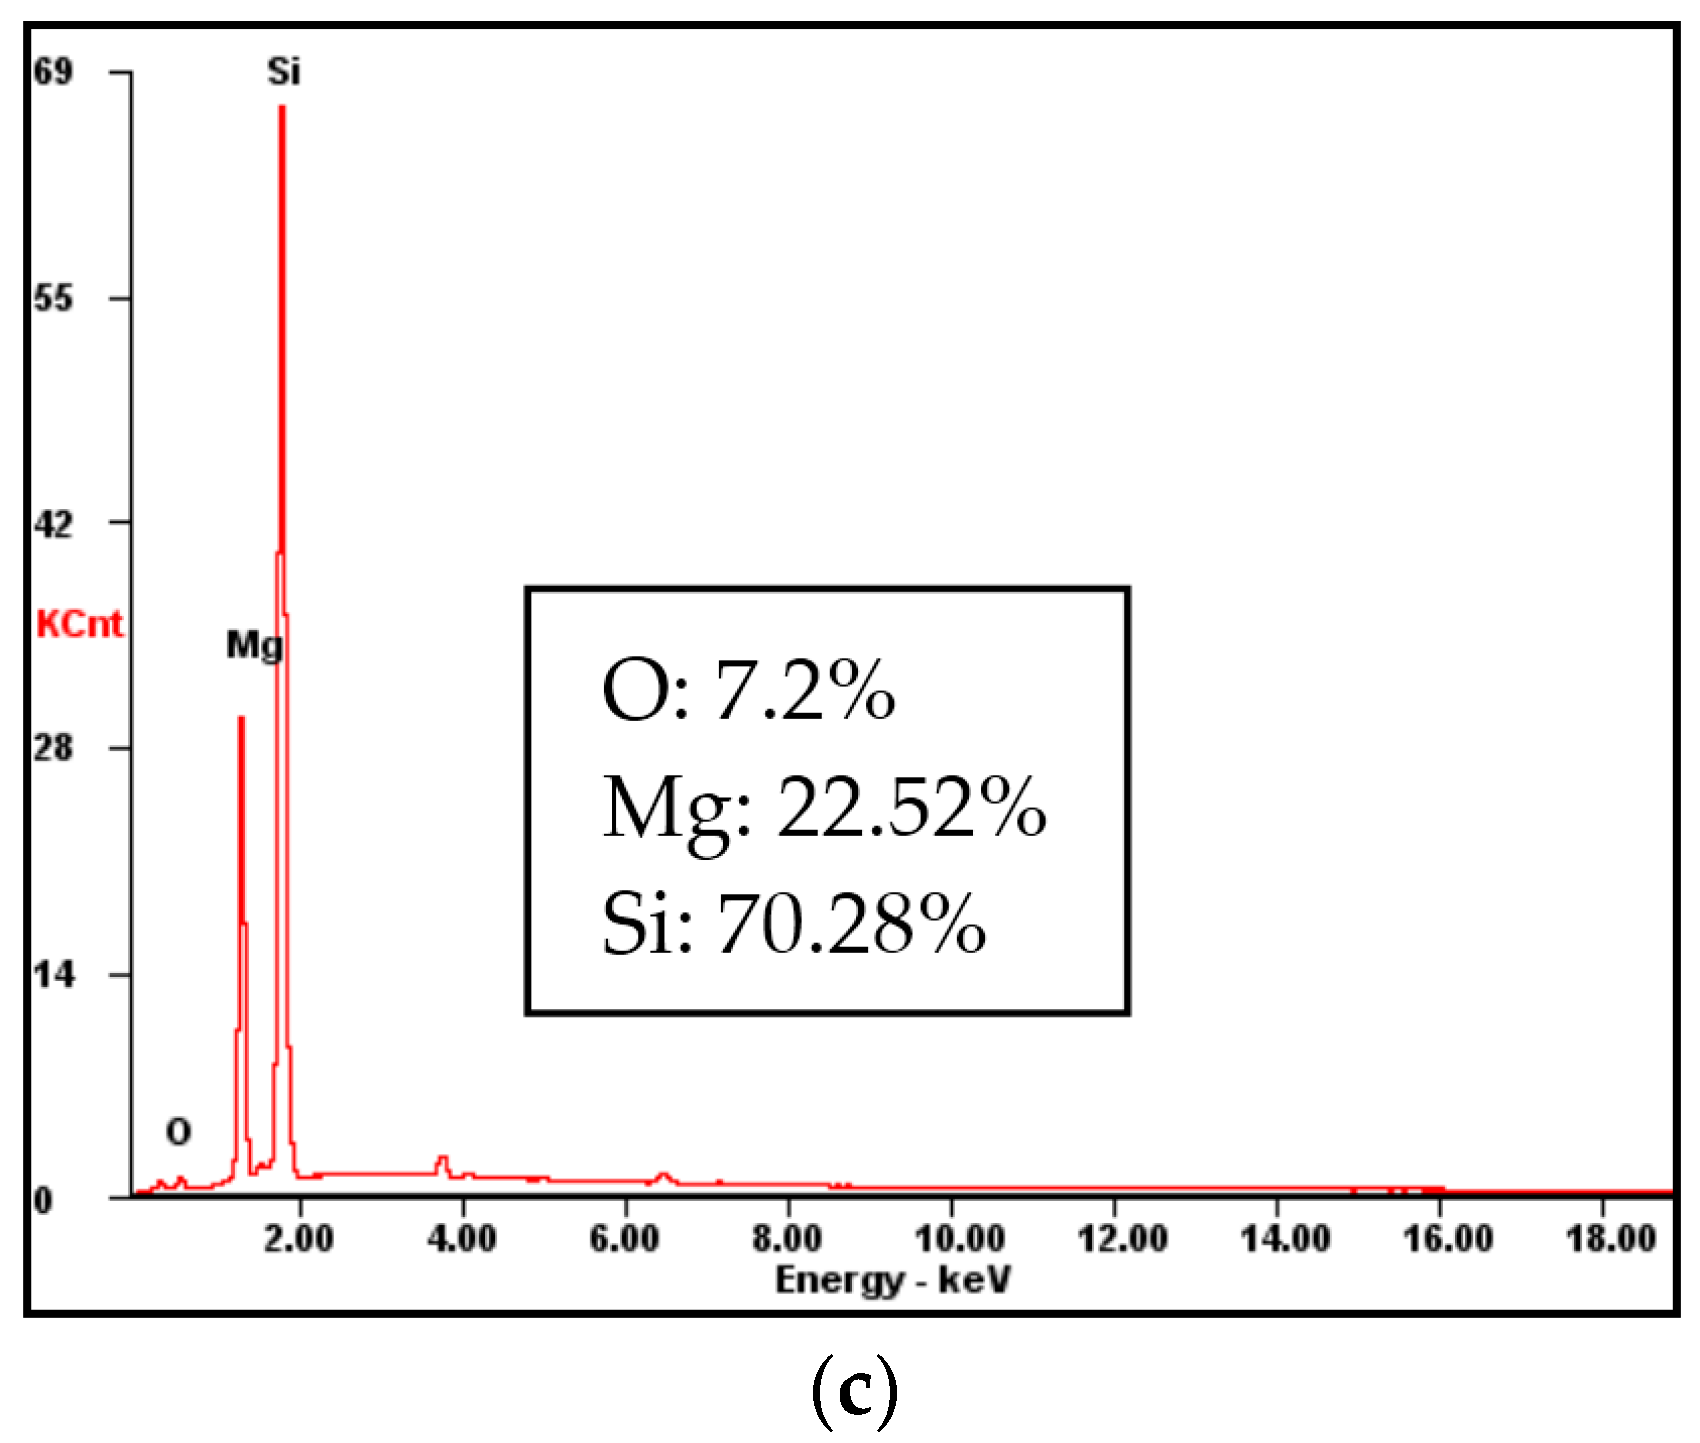
A series of contact angle measurements were carried out to probe the flotation behavior of each particle size fraction as the particle size varied. The advancing contact angle measurement of all size fractions of talc with and without FPY is shown in Table 5. It is indicated that the contact angle obviously decreases as the particle size reduces without any treatment. However, it is not immediately clear whether this variation is due to the intrinsic effects of particle size on the contact angle measurement or due to genuine differences in surface species, as speculated previously [44]. To explore reasons for this variation, a sample of talc particles was prepared without depressant addition. Surface species were analyzed by EDS (Figure 7) before contact angles were measured for each size fraction. It was found that as the contact angle is reduced, either the amount of oxygen increased or magnesium decreases on the surface of talc. The −10 μm size fraction had a lower contact angle due to the higher O and lower Mg content compared to the other size fractions. These results confirm that Mg-containing species are mainly responsible for hydrophobicity in the depressant-less flotation of talc. Thus, while the contact angle varied with particle size fraction (without FPY), the difference in contact angles with particle size is a result of genuine differences in the quantity of O- and Mg-bearing surface species. However, it should be noted that the size of the micro-channels change for the particles of different sizes. So, the change in contact angle can only be partially attributed to the change in surface composition.
In the absence of FPY, the talc faces have a contact angle from 70° to 90° for different size fraction particles. In addition, it is important to note that the impurities may affect the contact angle. After reacting with FPY, the contact angle decreased for the three size fractions. In addition, both size fractions of −38 μm and −10 μm had obviously higher contact angles than the size fraction of −74 + 38 μm. This is possibly caused by a different quantity of depressant FPY that exists or is adsorbed on the talc surfaces. The adsorption capacity and density were calculated to clarify this phenomenon in the next section [34].
3.5. Adsorption Studies
Depressant FPY adsorption results at pH 6.5 for the three size fractions of talc are shown in Figure 8. In contrast to finer particles, such as the −10 μm size fraction, there were large differences between the adsorption densities of FPY on coarse particles at pH 6.5. The adsorption of FPY slightly increased for all size fractions when the dosage of FPY was raised from 10 to 60 mg/L. After the additions of FPY at 25 mg/L, for −10 μm, −38 μm, and −74 + 38 μm talc the adsorption density in the presence of FPY was 0.42 mg/m2, 0.57 mg/m2, and 1.65 mg/m2, respectively. The adsorption density analysis was consistent with the results of the micro-flotation experiments.
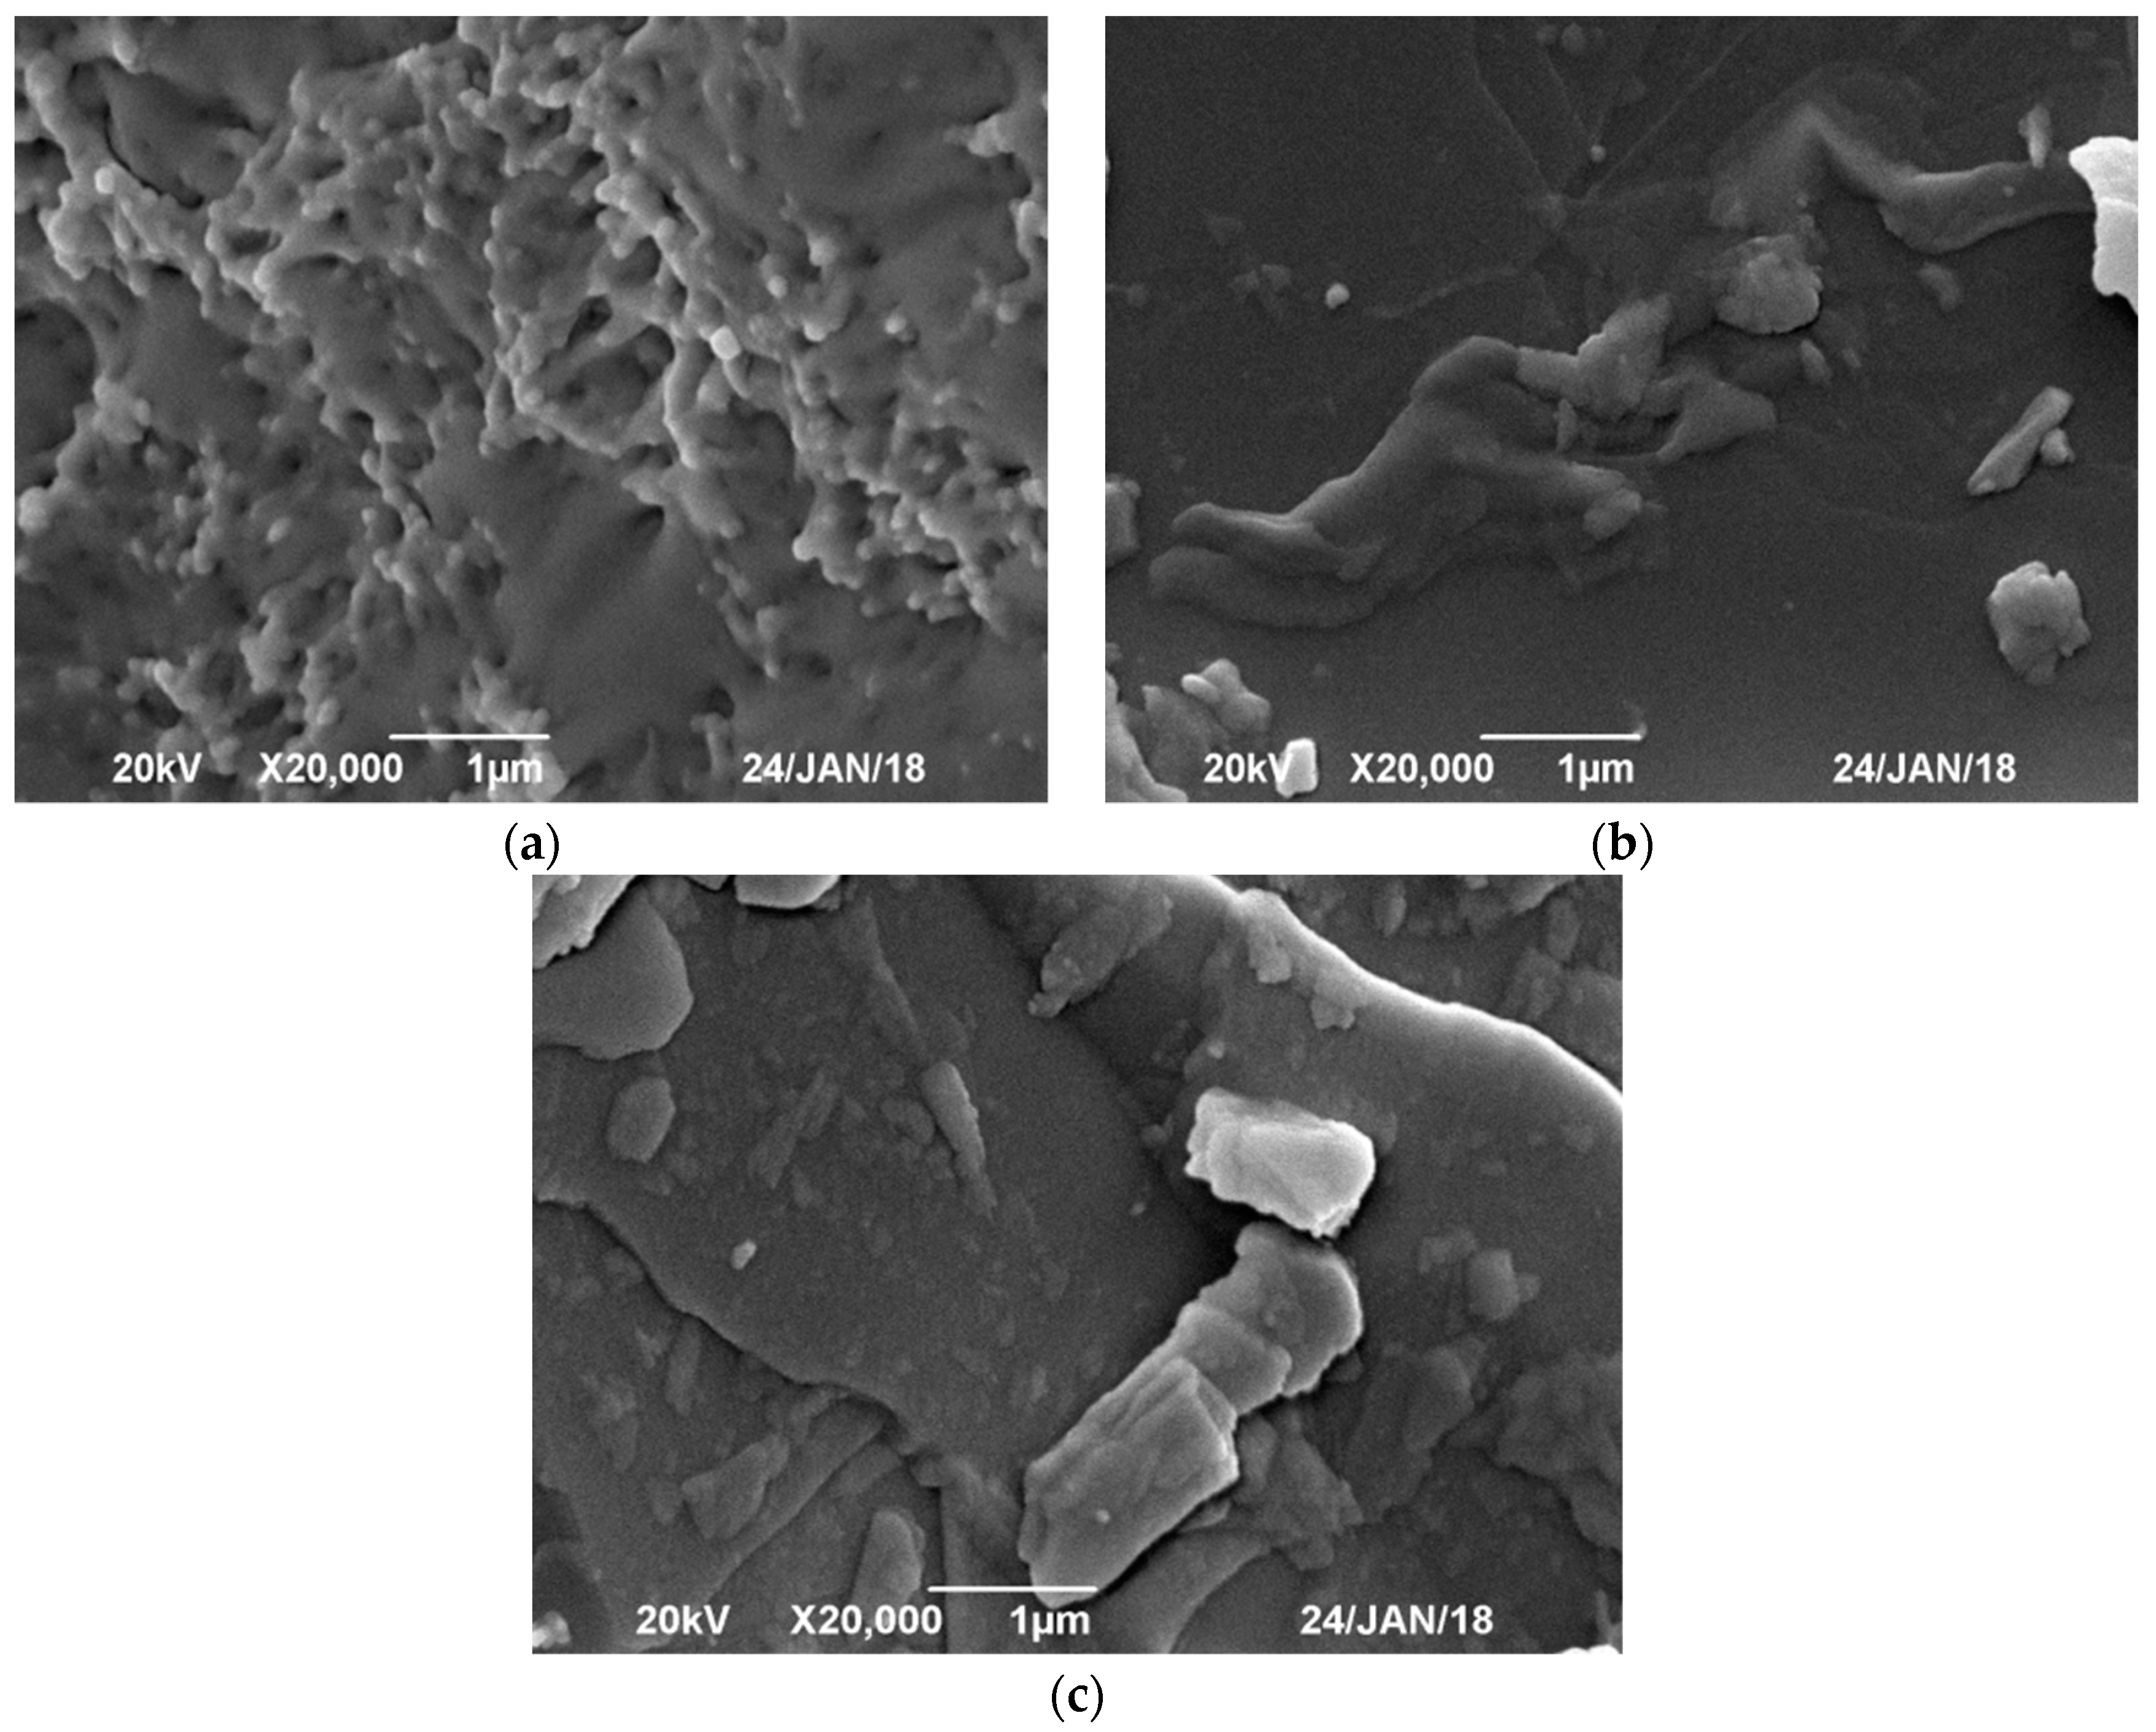
To corroborate this hypothesis, the three size fractions after reacting with FPY were observed under the electron microscope (Figure 9), effectively revealing the presence of gummy precipitates on the surface of talc. In particular, the −74 + 38 μm particles were covered by the netted FPY membrane on the mineral surface (Figure 9c). However, it should be noted that the absorbed capability of FPY for different size fractions decreased gradually in the order of −74 + 38 μm, −38 μm, and −10 μm.
4. Conclusions
In this work, the suppression efficiency for talc with different particle sizes was studied using galactomannan (FPY) as a depressant. The maximum recovery increased with particle size increases in the absence of FPY. The obviously suppressed effect was observed for the size fraction of −74 + 38 μm after reacting with FPY, but low efficiency was observed for −38 μm and −10 μm size fractions. The recovery of entrainment decreased significantly as the particle size increased. Laser particle size analysis indicated that FPY has a certain function for the flocculation of fine particles, which could help reduce the recovery by entrainment. EDS and the advancing contact angle test results showed that the difference of contact angles probably is a result of genuine differences in the quantity of O- and Mg-bearing surface species, while the contact angle varied with particle size fraction in the absence of FPY. Adsorption and SEM test results demonstrated that in the case of the −74 + 38 μm size fraction of talc, the depressant adsorption density on the mineral surface is higher than that on the other two size fractions.
Although the tests were performed with the use of different single size fractions, the flotation results for talc indicate that FPY probably is not a strong enough depressant for efficient talc suppression. In addition, it should be noted that the interactions among particles with different particle sizes have an important influence on the flotation process. Therefore, much work is still required to conclusively demonstrate whether or not FPY can be used in an effective and commercially viable process for the suppression of talc, and further studies of this process are strongly encouraged.
Acknowledgments
The authors acknowledge the support of the National Natural Science Foundation of China (No. 51374249), the National Key Technology R&D Program (No. 2015BAB12B02) and the Science and Technology Planning Project, Guangdong Province, China (No. 2013B090800016), the Fundamental Research Funds for the Central Universities of Central South University (No. 1053320171380).
Author Contributions
Guohua Gu, Zhixiang Chen conceived and designed the experiments; Zhixiang Chen and Shuangke Li performed the experiments and analyzed the data; Shuangke Li and Siyu Song contributed reagents and materials; Zhixiang Chen and Guohua Gu and Chongqing Wang wrote the paper.
Conflicts of Interest
The authors declare no conflict of interest.
References
- Gomes, L.M.B.; Oliveira, J.F. The Control of natural floatability of talc with carboxymethyl cellulose and aluminium chloride. In Fine Particles Processing Flotation, Proceedings of the 17th International Mineral Processing, Dresden, Germany, 23–28 September 1991; Bergakademie Freiberg: Freiberg, Germany, 1991; Volume 2, p. 353. [Google Scholar]
- Morris, G.E.; Fornasiero, D.; Ralston, J. Polymer depressants at the talc–water interface: Adsorption isotherm, micro-flotation and electromagnetic studies. Int. J. Miner. Process. 2002, 67, 211–227. [Google Scholar] [CrossRef]
- Horvat, S.; Sobisch, T.; Lerche, D. Determination of the particle surface properties (hansen solubility parameters) for talc-based pigment by multisample analytical centrifugation. In Proceedings of the 11th Zsigmondy-Colloquium of the Kolloid-Gesellschaft e.V., Bielefeld, Germany, 2–4 March 2015. [Google Scholar]
- Wang, J.; Somasundaran, P.; Nagaraj, D.R. Adsorption mechanism of guar gum at solid–liquid interfaces. Miner. Eng. 2005, 18, 77–81. [Google Scholar] [CrossRef]
- Yetgin, S.H.; Unal, H.; Mimaroglu, A. Influence of foam agent content and talc filler on the microcellular and mechanical properties of injection molded polypropylene and yalc filled polypropylene composite foams. J. Cell. Plast. 2014, 50, 563–576. [Google Scholar] [CrossRef]
- Xu, L.; Wu, H.; Dong, F.; Wang, L.; Wang, Z.; Xiao, J. Flotation and adsorption of mixed cationic/anionic collectors on muscovite mica. Miner. Eng. 2013, 41, 41–45. [Google Scholar] [CrossRef]
- Zhao, K.L.; Gu, G.H.; Wang, H.; Wang, C.L.; Wang, X.H.; Luo, C. The Influence of Depressant Foenum-Graecum on the Flotation of a Sulfide Ore Which Contains Hydrophobic Gangue. Int. J. Miner. Process. 2015, 141, 68–76. [Google Scholar] [CrossRef]
- Beattie, D.A.; Le, H.; Kaggwa, G.B.N.; Ralston, J. The effect of polysaccharides and polyacrylamides on the depression of talc and the flotation of sulfide minerals. Miner. Eng. 2006, 19, 598–608. [Google Scholar] [CrossRef]
- Zhou, X.; Feng, B. The Effect of polyether on the separation of pentlandite and serpentine. J. Mater. Res. Technol. 2015, 4, 429–433. [Google Scholar] [CrossRef]
- Chen, Z.; Gu, G.; Li, S.; Wang, C.; Zhu, R. The effect of seaweed glue in the separation of copper molybdenum sulphide ore by flotation. Minerals 2018, 8, 41. [Google Scholar] [CrossRef]
- Paroles, L.A.S.; Merwe, R.V.D.; Groenmeyer, G.V.; Harris, P.J. The influence of metal cations on the behavior of carboxymethyl celluloses as talc depressants. Colloids Surf. A Physicochem. Eng. Asp. 2008, 317, 109–115. [Google Scholar] [CrossRef]
- Grządka, E. Influence of surfactants on the adsorption and elektrokinetic properties of the system: Guar gum/manganese dioxide. Cellulose 2013, 20, 1313–1328. [Google Scholar] [CrossRef]
- Mhlanga, S.S.; O’Connor, C.T.; Mcfadzean, B. A study of the relative adsorption of guar onto pure minerals. Miner. Eng. 2012, 36, 172–178. [Google Scholar] [CrossRef]
- Mierczynska-Vasilev, A.; Beattie, D.A. The effect of impurities and cleavage characteristics on talc hydrophobicity and polymer adsorption. Int. J. Miner. Process. 2013, 118, 34–42. [Google Scholar] [CrossRef]
- Deng, W.; Xu, L.; Tian, J.; Hu, Y.; Han, Y. Flotation and adsorption of a new polysaccharide depressant on pyrite and talc in the presence of a pre-adsorbed xanthate collector. Minerals 2017, 7, 40. [Google Scholar] [CrossRef]
- Zhao, K.; Yan, W.; Wang, X.; Hui, B.; Gu, G. The flotation separation of pyrite from pyrophyllite using oxidized guar gum as depressant. Int. J. Miner. Process. 2017, 161, 78–82. [Google Scholar] [CrossRef]
- Rath, R.K.; Subramanian, S.; Laskowski, J.S. Adsorption of dextrin and guar gum onto talc. A comparative study. Langmuir 1997, 13, 6260–6266. [Google Scholar] [CrossRef]
- Jiang, J.X.; Jian, H.L.; Zhu, L.W.; Zhang, W.M. Development and Application of the Functional Polysaccharide Gum; China Light Industry Press: Beijing, China, 2012; pp. 5–90. [Google Scholar]
- Zhou, B.; Wang, Y.; Li, B.; Li, J.; Lv, G.Y.; Mei, T.; Cui, B.; Fan, J.S. Preparation and characterization of konjac glucomannan-based cation exchange resin. Carbohydr. Polym. 2012, 87, 1877–1880. [Google Scholar] [CrossRef]
- He, F.; Zhang, Z.; Cui, M.; Liu, L.; Xue, Q. Soft rot disease alters soil characteristics and root-associated, culturable microbial community of Amorphophallus konjac. J. Gen. Plant Pathol. 2017, 84, 44–57. [Google Scholar] [CrossRef]
- Ghasemi, S.N.; Fallah, S.; Pokhrel, L.R.; Rostamnejadi, A. Natural amelioration of zinc oxide nanoparticle toxicity in fenugreek (Trigonella foenum-gracum) by arbuscular mycorrhizal (Glomus intraradices) secretion of glomalin. Plant Physiol. Biochem. 2017, 112, 227–238. [Google Scholar] [CrossRef] [PubMed]
- Xia, L.Y.; Hong, Z.; Liu, G.Y. Utilization of soluble starch as a depressant for the reverse flotation of diaspore from kaolinite. Miner. Eng. 2009, 22, 560–565. [Google Scholar] [CrossRef]
- Peng, H.; Wu, D.; Abdall, M.; Luo, W.; Jiao, W. Study of the effect of sodium sulfide as a selective depressor in the separation of chalcopyrite and molybdenite. Minerals 2017, 7, 51. [Google Scholar] [CrossRef]
- Trahar, W.J. A rational interpretation of the role of particle size in flotation. Int. J. Miner. Process. 1981, 8, 289–327. [Google Scholar] [CrossRef]
- Bu, X.; Xie, G.; Peng, Y. Interaction of fine, medium, and coarse particles in coal fines flotation. Energy Sources Part A Recovery Utiliz. Environ. Effects 2017, 39, 1–7. [Google Scholar]
- Wills, B.A.; Napier-Munn, T. Wills’ Mineral Processing Technology: An Introduction to the Practical Aspects of Ore Treatment and Mineral Recovery, 7th ed.; Butterworth-Heinemann: Oxford, UK, 2006; p. 444. [Google Scholar]
- Bu, X.; Xie, G.; Peng, Y.; Ge, L.; Ni, C. Kinetics of Flotation. Order of Process, Rate Constant Distribution and Ultimate Recovery. Physicochem. Probl. Min. Process. 2017, 53, 342–365. [Google Scholar]
- Bournival, G.; Ata, S.; Jameson, G.J. The influence of submicron particles and salt on the recovery of coarse particles. Miner. Eng. 2014, 69, 146–153. [Google Scholar] [CrossRef]
- Albijanic, B.; Subasinghe, N.; Park, C.H. Flotation kinetic models for fixed and variable pulp chemical conditions. Miner. Eng. 2015, 78, 66–68. [Google Scholar] [CrossRef]
- Lynch, A.J.; Johnson, N.W.; Manlapig, E.V.; Thorne, C.G. Mineral and Coal Flotation Circuits: Their Simulation and Control; Elsevier: Amsterdam, The Netherlands, 1981; pp. 71–75. [Google Scholar]
- Muganda, S. Influence of particle size and contact angle on the flotation of chalcopyrite in a laboratory batch flotation cell. Int. J. Miner. Process. 2011, 98, 150–162. [Google Scholar] [CrossRef]
- Harris, M.C.; Runge, K.C.; Whiten, W.J.; Morrison, R.D. JKSimFloat as a practical tool for flotation process design and optimisation. In Proceedings of the Mineral Processing Plant Design Practice and Control Conference, Vancouver, BC, Canada, 20–24 October 2002; Society for Mining Metallurgy & Exploration: Englewood, CO, USA, 2002; pp. 31–40. [Google Scholar]
- Savassi, O.N.; Alexander, D.J.; Franzidis, J.P.; Manlapig, E.V. An empirical model for entrainment in industrial flotation plants. Miner. Eng. 1998, 11, 243–256. [Google Scholar] [CrossRef]
- Wang, L.; Runge, K.; Peng, Y.; Vos, C. An empirical model for the degree of entrainment in froth flotation based on particle size and density. Miner. Eng. 2016, 98, 187–193. [Google Scholar] [CrossRef]
- Washburn, E.W. The dynamics of capillary flow. Phys. Rev. 1921, 3, 273–283. [Google Scholar] [CrossRef]
- Crawford, R.; Koopal, L.K.; Ralston, J. Contact angles on particles and plates. Colloids Surf. 1987, 27, 57–64. [Google Scholar] [CrossRef]
- Galet, L.; Patry, S.; Dodds, J. Determination of the wettability of powders by the Washburn capillary rise method with bed preparation by a centrifugal packing technique. J. Colloid Interface Sci. 2010, 346, 470–475. [Google Scholar] [CrossRef] [PubMed]
- Burt, M.W.G.; Fewtrell, C.A. The preparation of powder beds by a centrifugal compaction technique. In Particle Size Analysis; Groves, M.J., Wyatt-Sargent, J.L., Eds.; Society for Analytical Chemistry: London, UK, 1970; pp. 321–338. [Google Scholar]
- Jackson, P.V.; Hunt, J.A.; Doherty, P.J.; Cannon, A.; Gilson, P. Hydrophilicity of 3-D biomaterials: The Washburn equation. J. Mater. Sci. 2004, 15, 507–511. [Google Scholar] [CrossRef]
- Wan, H.; Yang, W.; Cao, W.; He, T.; Liu, Y. The interaction between Ca2+ and molybdenite edges and its effect on molybdenum flotation. Minerals 2017, 7, 141. [Google Scholar] [CrossRef]
- Zhao, K.; Gu, G.; Wang, C.; Rao, X.; Wang, X. The effect of a new polysaccharide on the depression of talc and the flotation of a nickel–copper sulfide ore. Miner. Eng. 2015, 77, 99–106. [Google Scholar] [CrossRef]
- Alvarez-Silva, M.; Wiese, J.; O’Connor, C.T. An investigation into the role of froth height and depressant dosage in the recovery of chromite in the flotation of UG2 ore using a laboratory column. Miner. Eng. 2014, 55, 125–131. [Google Scholar] [CrossRef]
- Rahman, R.M.; Ata, S.; Jameson, G.J. The effect of flotation variables on the recovery of different particle size fractions in the froth and the pulp. Int. J. Miner. Process. 2012, 106–109, 70–77. [Google Scholar] [CrossRef]
- Ye, J.; Hongmin, L. Study on the ultra-fine modified air pulverization of talcum. In Proceedings of the China Plastics Processing Industry Association Talcum Powder Application Symposium in Plastics, Changsha, China, 23 May 2005; pp. 110–114. [Google Scholar]
Figure 1.
X-ray diffraction (XRD) spectra of pure talc for tests.

Figure 2.
The size distribution of narrow size fractions.
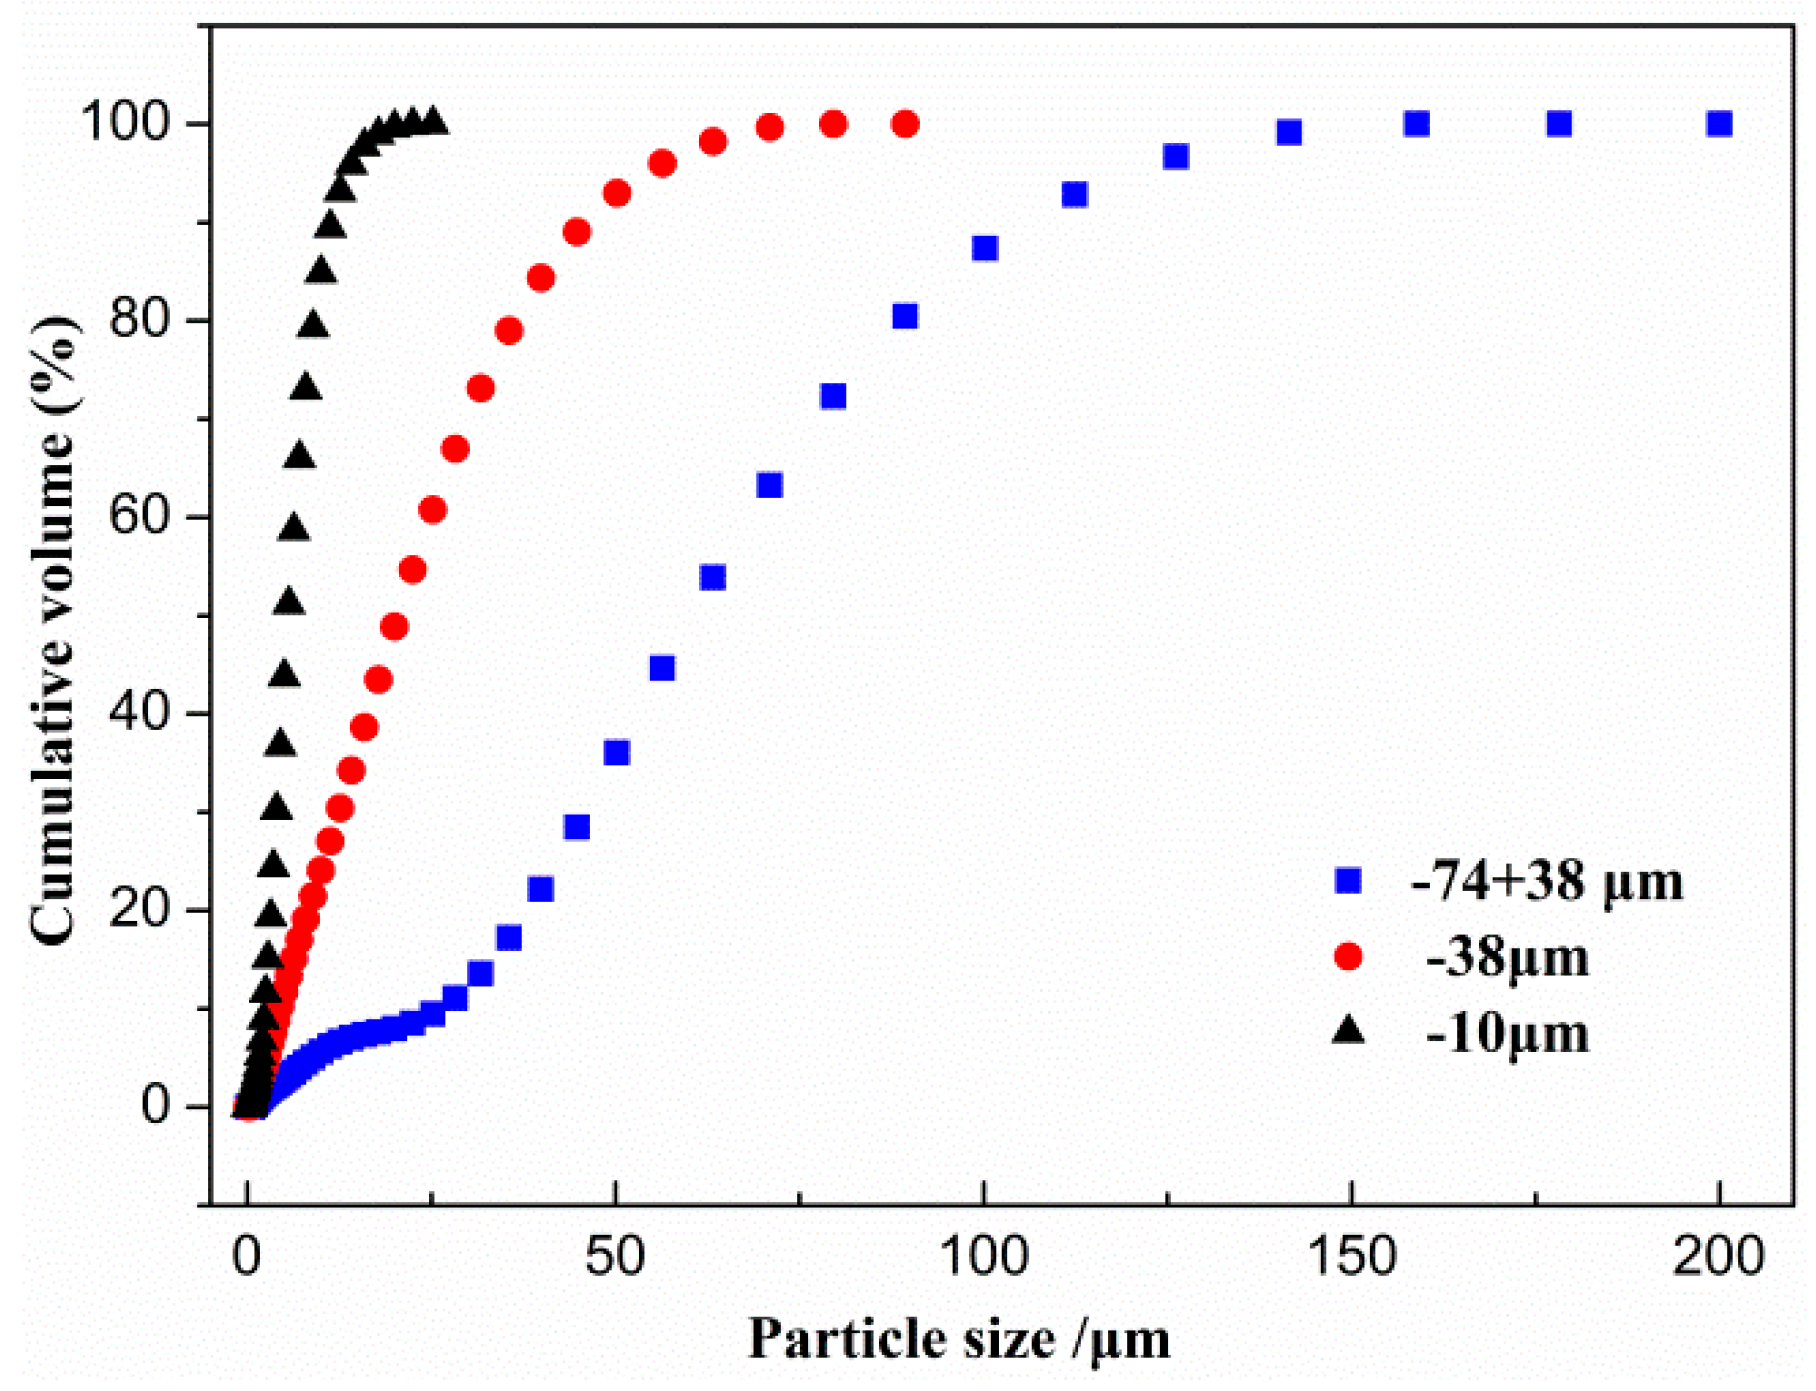
Figure 3.
The viscosity results for different size fractions with respect to the conditions of (a) shearing speed and (b) time.
Figure 3.
The viscosity results for different size fractions with respect to the conditions of (a) shearing speed and (b) time.

Figure 4.
The effect of depressant dosage on the flotation recovery of single minerals (pH 6.5, (sodium isobutyl xanthate (SIBX)) = 0.1 mmol/L, (methyl iso-butyl carbinol (MIBC)) = 8.5 mg/L).
Figure 4.
The effect of depressant dosage on the flotation recovery of single minerals (pH 6.5, (sodium isobutyl xanthate (SIBX)) = 0.1 mmol/L, (methyl iso-butyl carbinol (MIBC)) = 8.5 mg/L).

Figure 5.
Accumulative recovery results for different size fractions (a) in the absence and (b) presence of galactomannan (FPY).
Figure 5.
Accumulative recovery results for different size fractions (a) in the absence and (b) presence of galactomannan (FPY).

Figure 6.
The recovery of true flotation via bubble attachment of the three size fractions in the presence and absence of FPY (25 mg/L, pH = 6.5).
Figure 6.
The recovery of true flotation via bubble attachment of the three size fractions in the presence and absence of FPY (25 mg/L, pH = 6.5).

Figure 7.
Energy dispersive X-ray spectrometry (EDS) atomic concentrations (wt %) on the surface of talc (without adding FPY) of different size fractions: (a) −74 + 38 μm, (b) −38 μm, (c) −10 μm.
Figure 7.
Energy dispersive X-ray spectrometry (EDS) atomic concentrations (wt %) on the surface of talc (without adding FPY) of different size fractions: (a) −74 + 38 μm, (b) −38 μm, (c) −10 μm.
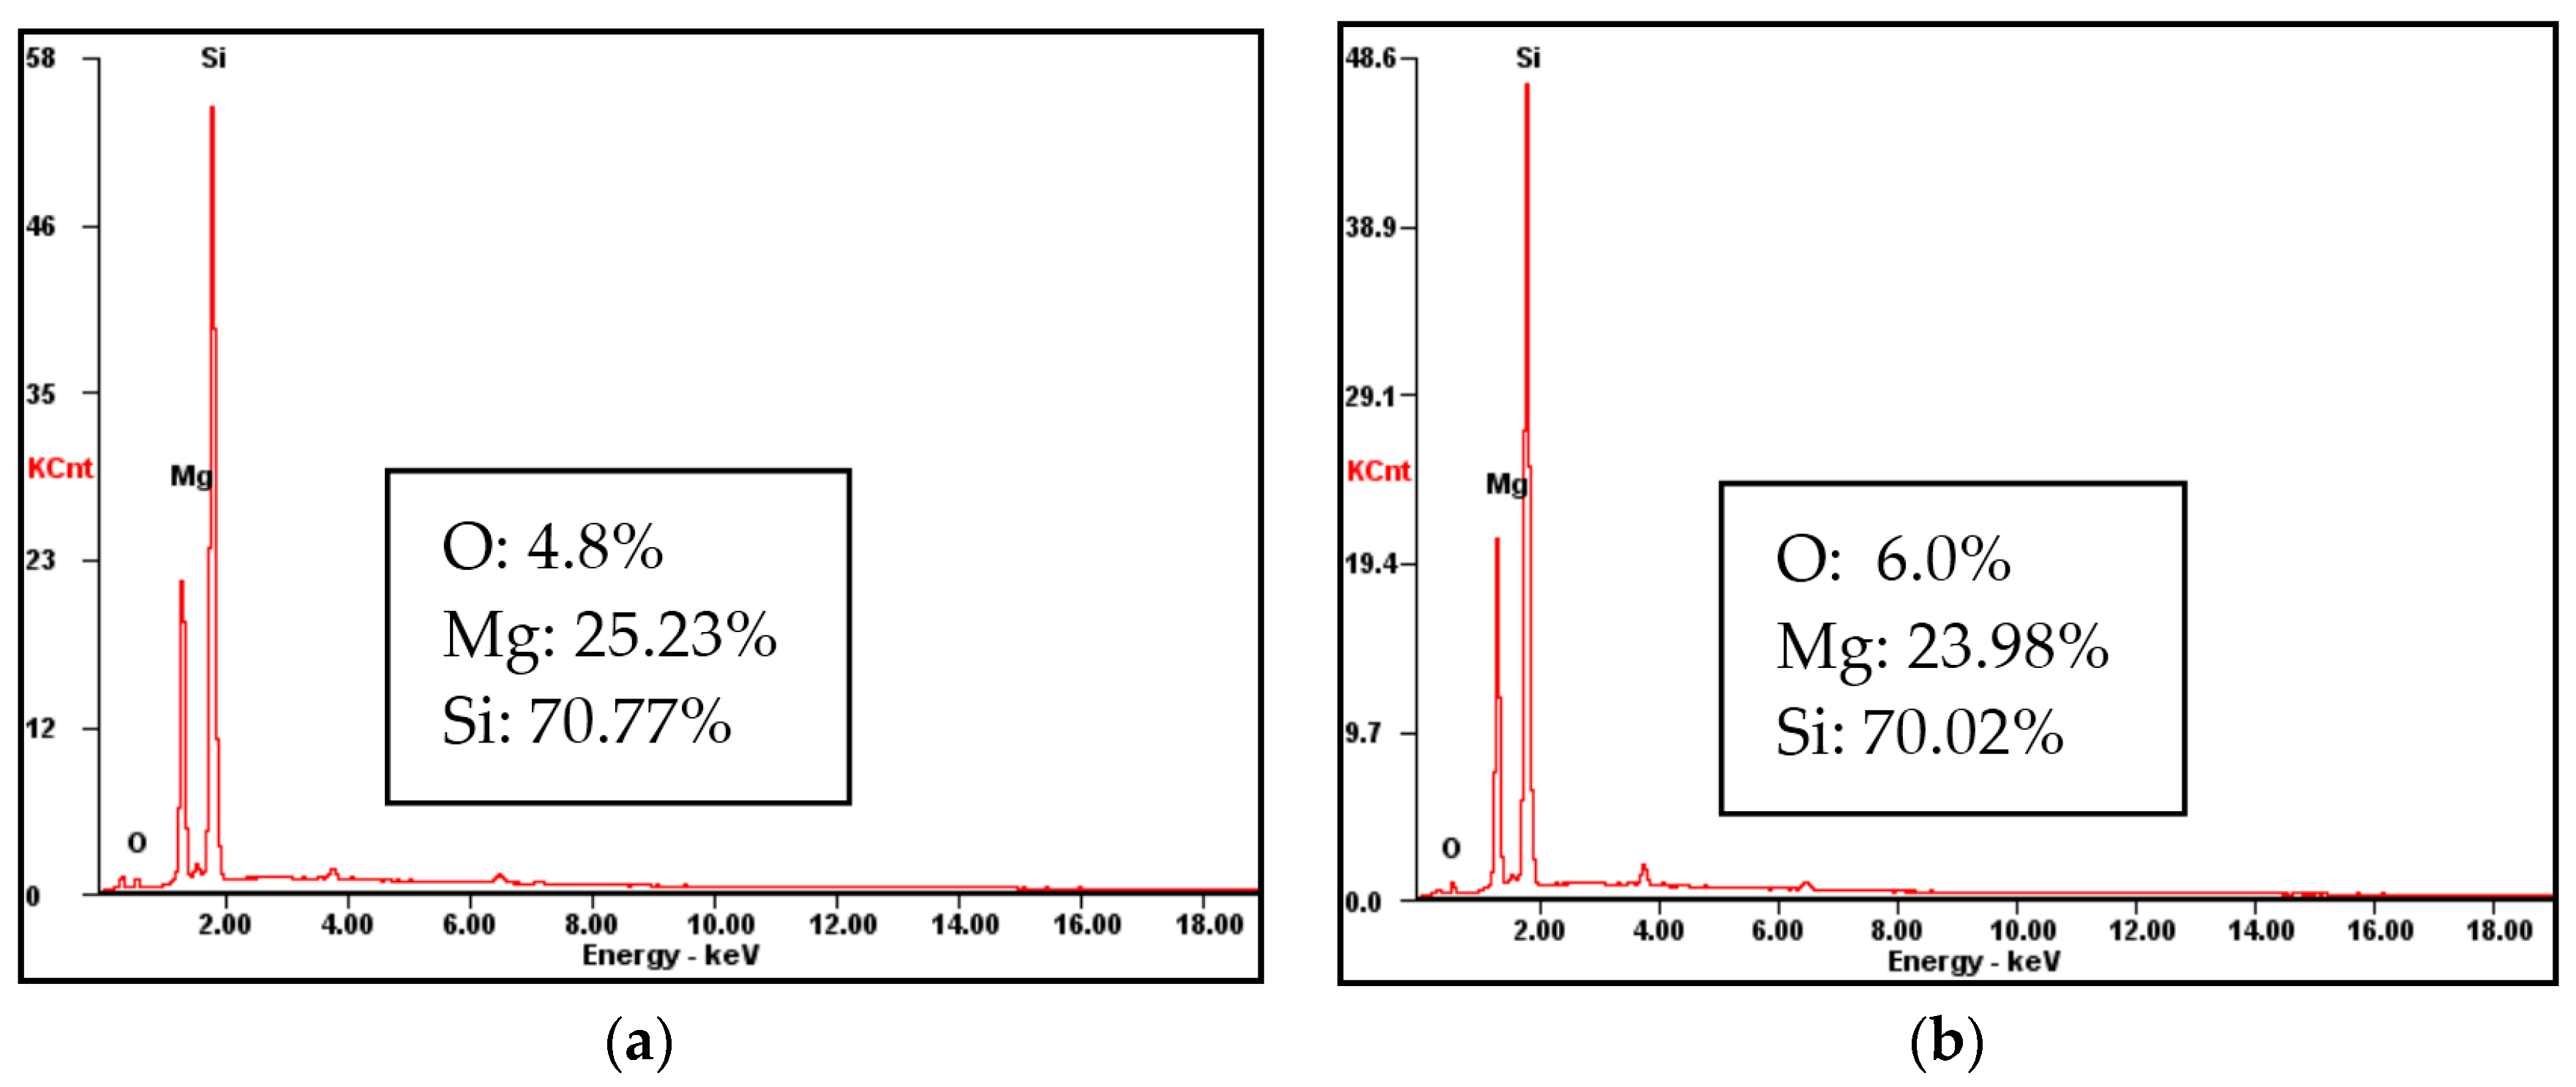

Figure 8.
Depressant FPY adsorption results at pH 6.5 for the three size fractions of talc.
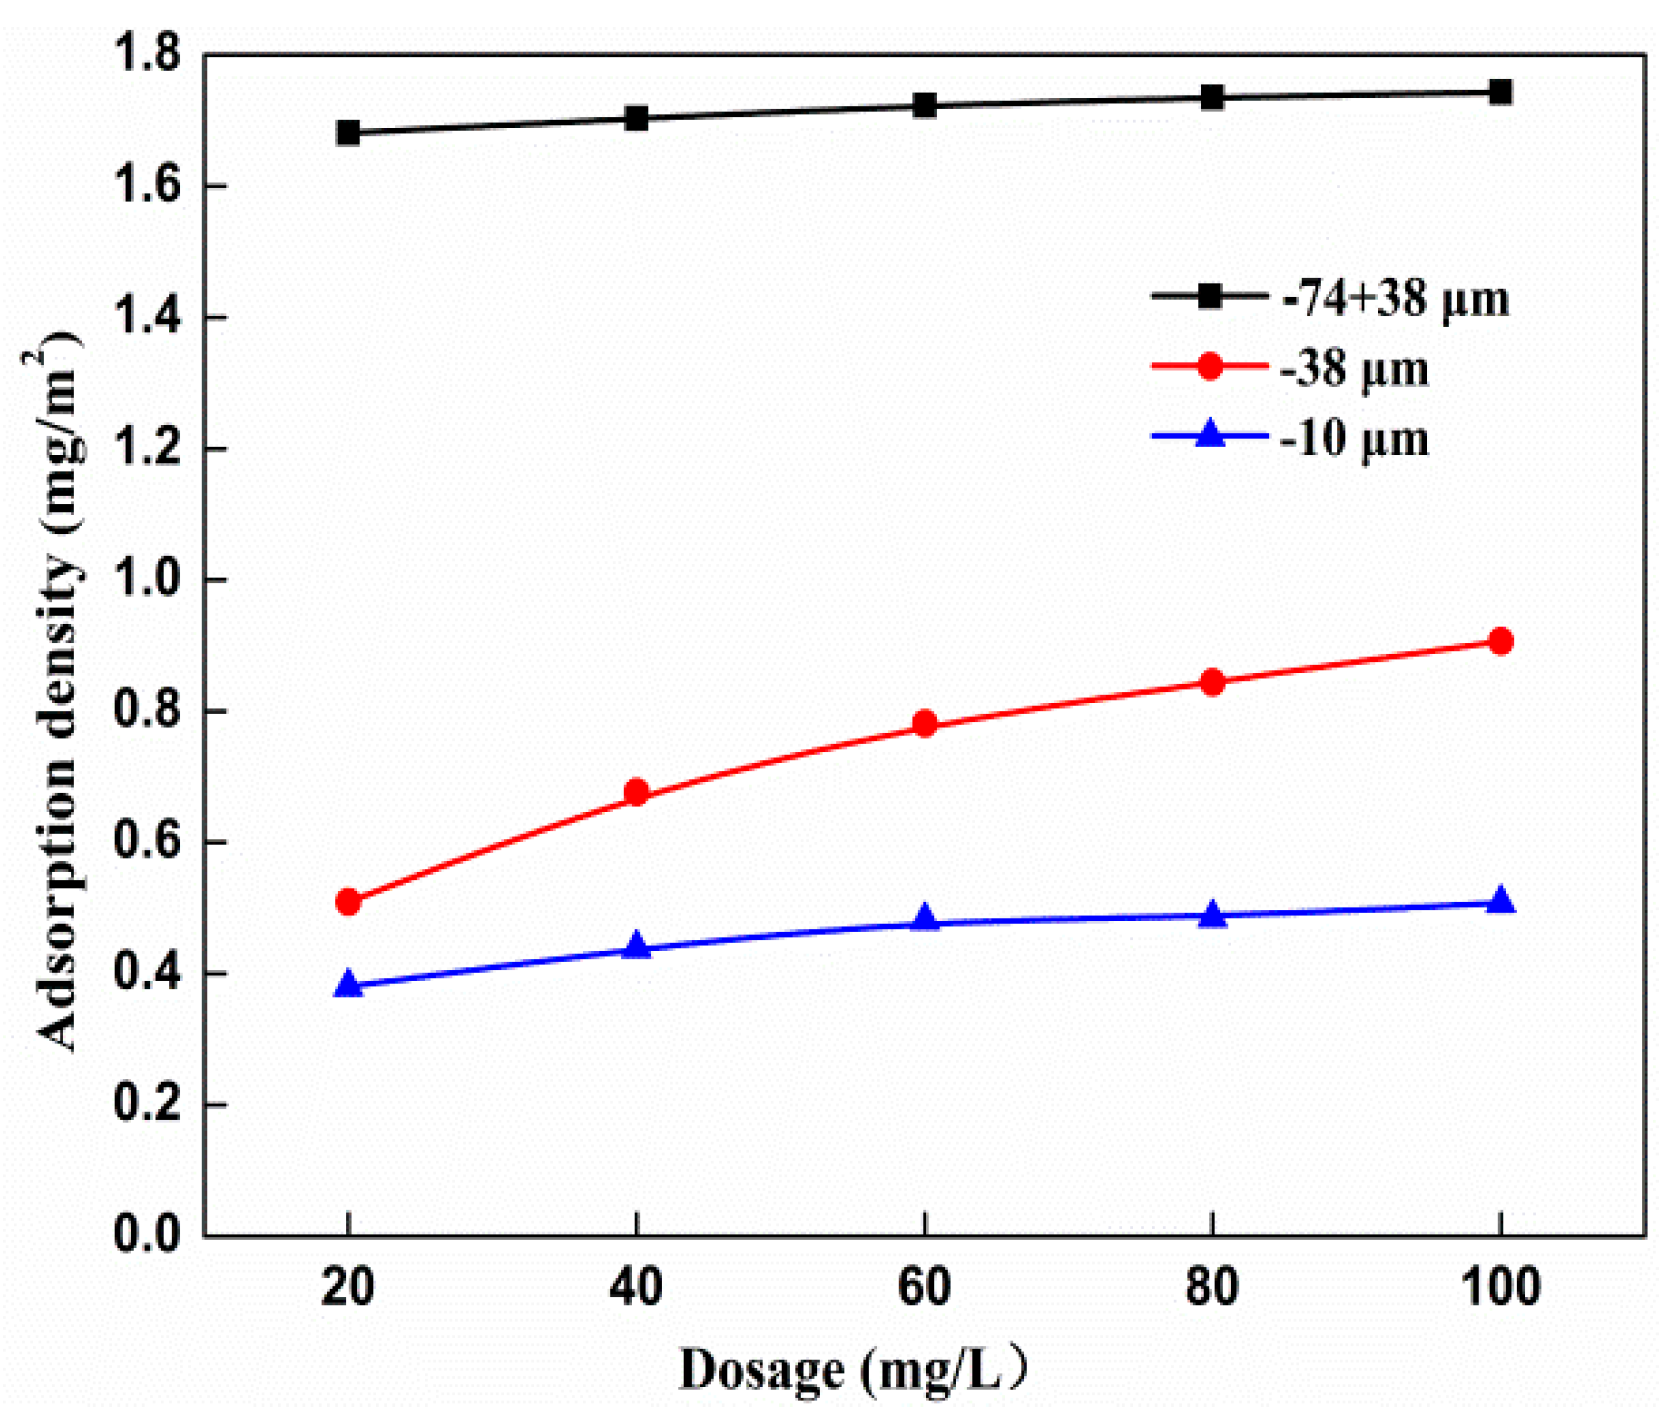
Figure 9.
Scanning electron micrographs (secondary electrons), showing FPY adhered onto the surface of (a) −74 + 38 μm, (b) −38 μm, and (c) −10 μm talc particles conditioned with 60 mg/L FPY at pH 6.5.
Figure 9.
Scanning electron micrographs (secondary electrons), showing FPY adhered onto the surface of (a) −74 + 38 μm, (b) −38 μm, and (c) −10 μm talc particles conditioned with 60 mg/L FPY at pH 6.5.


Table 1.
Chemical analysis results of talc samples.
| Element | MgO | SiO2 | TiO2 | K2O | Fe2O3 | Na2O | NiO | CaO |
|---|---|---|---|---|---|---|---|---|
| Grade (mass fraction)/% | 30.43 | 57.15 | 3.26 | 0.65 | 0.58 | 0.32 | 0.29 | 0.17 |
Table 2.
The size distribution of narrow size fractions.
| Size Fraction/μm | d10/μm | d50/μm | d90/μm | Mean Size/μm |
|---|---|---|---|---|
| −74 + 38 | 29.577 | 67.679 | 118.4446 | 70.767 |
| −38 | 4.924 | 22.966 | 51.579 | 25.985 |
| −10 | 2.647 | 6.211 | 12.813 | 7.096 |
Table 3.
Calculated model parameters for the three size fractions of talc.
| Parameter | Size Fraction | |||||
|---|---|---|---|---|---|---|
| Without FPY | With FPY | |||||
| −10 μm | −38 μm | −74 + 38 μm | −10 μm | −38 μm | −74 + 38 μm | |
| R2 | 0.999 | 0.996 | 0.999 | 0.995 | 0.999 | 0.997 |
| 88.11 | 92.39 | 96.41 | 51.93 | 41.00 | 6.33 | |
| K/min−1 | 0.0362 | 0.0536 | 0.1235 | 0.0207 | 0.0149 | 0.0240 |
| Km/min−1 | 0.032 | 0.050 | 0.119 | 0.011 | 0.006 | 0.002 |
Table 4.
The particle size data for the three size fractions after reacting with or without FPY.
| Conditions | Size Fraction | di (μm) | Rw (%) | ENTi | Rent.i (%) |
|---|---|---|---|---|---|
| Without FPY | −10 μm | 7.096 | 61.289 | 0.4283 | 26.25 |
| −38 μm | 25.985 | 61.433 | 0.1113 | 6.84 | |
| −74 + 38 μm | 70.767 | 54.518 | 0.0305 | 1.66 | |
| With FPY | −10 μm | 11.150 | 43.707 | 0.2867 | 12.53 |
| −38 μm | 31.39 | 50.077 | 0.0880 | 4.41 | |
| −74 μm | 70.791 | 49.232 | 0.0305 | 1.50 |
© 2018 by the authors. Licensee MDPI, Basel, Switzerland. This article is an open access article distributed under the terms and conditions of the Creative Commons Attribution (CC BY) license (http://creativecommons.org/licenses/by/4.0/).
Share and Cite
MDPI and ACS Style
Chen, Z.; Gu, G.; Li, S.; Song, S.; Wang, C. Influence of Particle Size in Talc Suppression by a Galactomannan Depressant. Minerals 2018, 8, 122. https://doi.org/10.3390/min8040122
AMA Style
Chen Z, Gu G, Li S, Song S, Wang C. Influence of Particle Size in Talc Suppression by a Galactomannan Depressant. Minerals. 2018; 8(4):122. https://doi.org/10.3390/min8040122
Chicago/Turabian StyleChen, Zhixiang, Guohua Gu, Shuangke Li, Siyu Song, and Chongqing Wang. 2018. "Influence of Particle Size in Talc Suppression by a Galactomannan Depressant" Minerals 8, no. 4: 122. https://doi.org/10.3390/min8040122
Note that from the first issue of 2016, this journal uses article numbers instead of page numbers. See further details here.