Understanding Cationic Polymer Adsorption on Mineral Surfaces: Kaolinite in Cement Aggregates


1
Lafarge—Centre de Recherche, 95 Rue du Montmurier, BP 15, 38291 Saint Quentin Fallavier, France
2
Department of Physics, Durham University, Lower Mountjoy Site, Stockton Road, Durham DH1 3LE, UK
3
Department of Earth Sciences, Durham University, Lower Mountjoy Site, Stockton Road, Durham DH1 3LE, UK
*
Authors to whom correspondence should be addressed.
Minerals 2018, 8(4), 130; https://doi.org/10.3390/min8040130
Submission received: 15 February 2018
/
Revised: 6 March 2018
/
Accepted: 16 March 2018
/
Published: 23 March 2018
(This article belongs to the Special Issue Organo-Mineral Interactions)
Abstract
:We present a joint experimental and theoretical investigation into the adsorption of polycationic quaternary ammonium polymers on the clay mineral kaolinite. Within the cement and concrete manufacturing industries such polymers are used to improve the final product by inerting the adsorption capacity of the clay minerals for more expensive additives. The adsorption of the presently used polymer (FL22) was compared with both a similar variant, but without a hydroxyl group (Fl22mod) and uncharged polyvinyl alcohol (PVA). Experimental results show that adsorption of FL22 is higher than that of FL22mod at both pH 6 and at pH > 10 and that the adsorption of PVA is the highest. Theoretical density functional theory (DFT) results and simplified models consisting of the basal surfaces of kaolinite, with monomers of FL22, FL22mod and PVA gave monomer coverage per unit surface area of kaolinite, a comparison of the configurations of the relaxed models, formation energies and Mulliken charges. These results show that the polycationic polymers interact with the basal surfaces of kaolinite electrostatically, explaining the high affinity of these polymers for kaolinite surfaces in the experimental results. The hydroxyl groups of FL22 and PVA form hydrogen bonds with the basal surfaces of kaolinite in conditions of pH 6. The joint experimental and theoretical results suggest that, due to the presence of the hydroxyl group, the conformation of FL22 changes under pH, where at neutral pH it lies relatively flat to the kaolinite surfaces, but at higher pH, conformational changes of the polymer occur, thereby increasing the adsorbed quantity of FL22.
1. Introduction
Cementitious materials have provided a robust construction material for hundreds, if not thousands of years. Modern cements are highly technical materials, with the mixtures containing many additives to improve final properties, allow more control of mixing properties and to allow the setting time to be offset as desired. However, such complex systems are very susceptible to the quality of the materials used, and the base materials of cements are natural materials, for example sand, which are heterogeneous and may contain impurity phases. In sand deposits clay minerals are near ubiquitous, usually making up less than 10% by mass fraction. Despite this, owing to their small size, clay minerals fill much of the pore space in sand deposits and also form coatings on quartz grains [1]. Increasingly, as higher purity (i.e., low clay mineral content) sands are exhausted, the cement industry is driven to use sand that has a higher clay mineral fraction than previously encountered. The main clay minerals in sand deposits are kaolinite and montmorillonite. These clay minerals present a problem owing to their propensity to disperse (kaolinite) or swell and disperse (montmorillonite) [2].
Clay minerals are aluminosilicate minerals, comprised of stacks of two-dimensional layers, with each layer comprised of stacking sequences of tetrahedral (T) silicate sheets and octahedral (O) aluminum sheets. Kaolinite, used in this study, is an OT type (1:1) clay mineral. The widely encountered class of smectite clay minerals are TOT type (2:1) clay minerals. The hydration enthalpy of the face of the hydroxylated octahedral sheet on kaolinite leads to the clay mineral, which has high surface area relative to quartz, taking up water and/or expensive polymeric additives from the cement formulation. Upon dispersion, the high surface area of kaolinite adds considerably to the rheology of the cement phase, thereby changing key cement parameters such as workability and setting time, which impacts upon the cement’s performance in terms of strength and stability, potentially having significant longer term impacts [1]. Similar clay mineral hydration issues are also found within the oil and gas sector, where swelling and dispersing clay minerals cause wellbore stability problems [2], and in the preparation of clay-polymer composite materials where the clay minerals need to be made compatible with organic polymers [3].
In order to prevent the clay minerals hydrating, a cationic polymer may be applied that serves a dual role of adsorbing to the net negative charge of kaolinite and then rendering the surface inert to adsorbing other polymers within the cement mixture, such as plasticizer, or hydrating with water, the latter of which is also important in oil and gas operations. A wide variety of water-soluble polymers have been used to treat clay minerals including, for example, acrylamide [4], quaternary ammonium functionalized biopolymers such as starches [5], celluloses [6], or oligomeric water-soluble amines [7].
Owing to the lack of long-range order in clay minerals, especially when hydrated or intercalated with organic molecules, and the dynamic nature of the water at room temperature, there are few experimental techniques that are capable of directly determining structural information about clay minerals. As such, computational chemical methods have been applied extensively to understand how organic matter and water interact with clay mineral surfaces. The size and complexity of clay minerals and polymers means that in many cases large-scale classical molecular dynamics (MD) simulations are employed, whereby the intra-molecular interactions are captured using simple harmonic-type functions, and long-range and short-range inter-molecular interactions are captured with Coulombic and van de Waals functions. The collection of parameters used to describe these interactions is known as a force field [see Leech [8] for an introduction to such methods]. Coupled to very efficient algorithms that can partition simulations over many CPUs, large-scale classical MD is able to run simulations of the order of 106 atoms over many ns of simulated time, sufficient to ensure equilibration of even quite large polymers and mineral interfaces, and also sufficient to capture the structural/compositional complexity of clay minerals [9]. Large-scale MD is able to yield data comparable with a range of experimental analytical methods such as infrared (IR) and nuclear magnetic resonance (NMR) spectroscopy, X-ray diffraction (XRD), inter alia. However, in order to ensure that classical MD captures the interactions correctly, the force field must be carefully selected and optimized, and though most force fields are designed for either organic or inorganic materials, relatively few exist for both [10,11]. Typically, smaller (<103 atoms), but more accurate electronic structure calculations based on quantum mechanics are used to validate the force fields and also to derive key parameters such as charges and key polymer-clay interactions [12]. Combined electronic structure/large-scale classical MD approaches have been used to study a range of cationic oligomers at clay mineral interfaces [13] and recent work has looked at closely coupled multi-scale modelling to go from accurate quantum simulations all the way through to macroscopic coarse-grained simulations [14]. Kaolinite has been studied using both quantum mechanical [12,15,16,17], and classical molecular dynamics simulations [18,19,20], but not thus far in the context of its role in cement aggregates to the authors’ knowledge
To enable cleaner, more efficient chemistries to be designed for use in the aggregate sector, understanding of the role of polymer functional groups on the performance of inerting polymer mineral treatments needs to be gained at a molecular level. In this present work we undertake an experimental investigation to understand the effect of charged cationic and alcohol groups through contrasting a quarternary ammonium polymer with and without an alcohol group, and comparing it with poly-vinyl alcohol. Quantum mechanical simulations are also undertaken to give insight into the binding modes of the different groups and to generate parameters such as charges for future large-scale classical MD simulations. This study gives insight that will help optimize clay-inerting polymers for use in cement aggregate materials, ensuring cement standards continue to be met, and will aid other applications of cationic polymers and deliver improved understanding of mineral interface interactions.
2. Materials and Methods
2.1. Materials Used
The kaolinite clay mineral used in this study was type KGa-1b, a low defect kaolinite, from Washington County, Georgia, USA (The Clay Minerals Society) [21,22,23]. X-ray diffraction (XRD) analysis showed no impurity phases accompanying the raw clay, confirming the high purity of this kaolinite, and the moisture content of the raw material of around 0.5% was eliminated by drying at 40 °C. The cation exchange capacity (CEC) was measured (at ERM, Poitiers) using ammonium acetate exchange [24], and found to be 0.07 meq/g. Quantitative chemical analysis of exchangeable cations (Na+ and Ca2+) was carried out using atomic absorption spectroscopy (AAS, spectrometer Varian, AA240FS) on the solution obtained after exchange with a solution of ammonium acetate. The reference solution was calibrated with a cation concentration of 1 g/L. The main exchangeable species was Na+ at 0.06 meq/g; no Ca2+ ions were released by the kaolinite after exchange. Specific surface area was measured by N2 adsorption at 77 K to be 11.9 m2/g after out-gassing under vacuum at 45 °C. The water-soluble polymers used in the investigation were the following:
- FL22, a quaternary polyammonium cation (Me2N+Cl−CH2CHOHCH2)n used in water clarification processes and mining applications as an organic coagulant (SNF). Its molecular weight is around 25,000 g/mol with a polymerization degree close to 180.
- FL22mod, corresponding to a modified version of FL22. The new polyammonium cation (Me2N+Br−CH2CH2CH2)n does not contain the OH group. The laboratory synthesis of this type of polymer proved to be easier with Br− than Cl−. The molecular weight of the polymer is around 25,000 g/mol with a polymerization degree close to 150.
- PVA, polyvinyl alcohol, [(CH2CHOH)n], an uncharged polymer, Mowiol 4-88, (KURARAY, Tokyo, Japan) which contains 10% residual polyvinyl acetate groups. Its molecular weight is around 31,000 g/mol with a polymerization degree close to 640.
The total water solubility of the polymers was verified under experimental conditions. Table 1 contains further information about these polymers. The other reactants used (KOH, HCl, NaCl) were all analytical grade.
2.2. Determining Charge on Polymers
Two different methods were used to determine the cationic charge of FL22. The first method was derived from a two-phase titration technique originally applied to anionic surfactants [25,26,27], consisting of measuring the conductivity of the cationic polymer charges on neutralisation, which occurs on addition of sodium dodecylsulphate (SDS), a tensioactive molecule consisting of a long, hydrophobic carbon chain and an associated sulphate group. The formation of a water insoluble complex indicates the neutralisation of all the charges, and this neutralisation is marked by the discontinuity in the slope of the associated titration curve. In the case of FL22mod, only this method was employed. For FL22, the second method involved dosing the chloride of the cationic polymer with a solution of silver nitrate. As the synthesis of the polymers liberates one anion per cationic charge created, the dosage of the chloride ions of FL22 on neutralisation therefore represents the charge on the cationic polymers. The conductivity dosage and the point of equivalence as shown by the discontinuity in the slope of the titration curve, enable the calculation of the overall charge of the polymer. The cationic charge values obtained by these two methods for FL22 lead to very similar results.
2.3. Adsorption Studies
Adsorption tests were carried out in a batch process by varying the concentration of polymers with a constant amount of clay, 50 g/L. Each experiment consisted of placing 2 g of kaolinite in a 100 mL hermetically closed, borosilicate flask (SILAX) containing 40 mL of solution. The solution was composed of de-ionized water (with/without a KOH (0.1 M)) and a known quantity of polymer solution. Five solutions of polymer were used: FL22 at 19.9 %w (pH = 7.4); FL22 at 13.9 %w (pH = 10.5 adjusted with KOH); FL22mod at 21.9 %w (pH = 9.6); FL22mod at 21.1 %w (pH = 10.5 adjusted with KOH); PVA at 9.1 %w (pH = 5.6). Each suspension was mixed for 24 h at around 25 °C. Preliminary trials showed that adsorption equilibrium was reached within a few hours (h) with these polymers. After twenty-four hours and following suspension-stability observations, 30 mL of each suspension were put in a Nalgene® centrifuge bottle (volume around 40 mL; diameter 28 mm) and the mixture centrifuged at 75,600 relative centrifugal force (rcf), corresponding to 25,000 rpm for 1 h at 20 °C (Centrifuge-BECKMAN COULTER J-20XP). The supernatant was filtered using a 10 mL Luer Lock syringe and a syringe filter (Titan2; nylon membrane; pore diameter: 0.2 µm). The filtered supernatant was then ready for pH measurements; evaluation of ionic concentration and total organic carbon (TOC) analysis. The powder was dried at 40 °C for analysis. The polymer equilibrium concentration in the supernatants was determined by TOC analysis. The adsorbed polymer amount (Qads) was obtained by calculating the difference between the initial (Ci) and equilibrium (Ce) concentrations.
2.4. Flocculation Test
During the adsorption tests, the mixing of the suspension was stopped after 24 h and the stability of the suspensions observed over ca 20 min. In this way general trends regarding the particle dispersion (no sedimentation front), flocculation (sedimented particles with low density), particles in the supernatant, and very clear supernatant were observed.
2.5. Zeta Potential Measurements
Clay suspensions were prepared with variable pH. For each experiment, 2 g of kaolinite was placed in 40 mL of solution, composed of NaCl (0.001 M) and either HCl (1 M) or KOH (0.1 M). Each suspension was mixed for 24 h on a stirrer mixing plate at around 25 °C. Following suspension-stability observations, 30 mL of each suspension were placed in a Nalgene® centrifuge bottle and the mixture centrifuged at 75,600 rcf (25,000 rpm) for 1 h at 20 °C. The pH of the supernatant was measured and then 20 µL of the initial clay suspension were added to 2 mL of the corresponding supernatant. After the dilution, the particle concentration of each suspension was approximately 0.5 g/L. The particle mobility was then tested.
2.6. Characterization Techniques
Electrophoretic mobility measurements were performed using an automated electrophoresis instrument, Zetasizer Nano ZS (a combination of laser Doppler velocimetry and phase analysis light scattering) supplied by Malvern. The electrophoretic mobility of the particles was measured and the ζ-potential data was calculated using the Henry equation. Polymer concentrations were measured using a TOC analyser (Shimadzu TOC 5000, Shimadzu, Kyoto, Japan). The carbon amount of each polymer was determined by calibration. Table 2 summarizes the results obtained.
If the inaccuracies of the measurement are accounted for, these experimental values lie within 5% of the theoretical carbon values (see Table 1), which themselves have been calculated from the chemical formulae of the products. It is interesting to note that the least close match is with PVA.
2.7. Computer Simulation Method
All calculations were processed with the CASTEP code [28], using a planewave basis set within the DFT formalism [29,30,31]. Convergence testing showed a kinetic energy cut-off of 650 eV gave a difference in total energies of less than 1.3 meV per unit cell for higher cut-offs. The Brillouin zone integrations were performed on a grid containing 2 k-points giving an energy difference between 1, 2, 4 and 5 k-points within the error bound above. We used the generalized gradient approximation (GGA) functional, specifically Perdew, Burke and Ernzerhof (PBE), [32] as this describes molecular bonding to a greater accuracy than the local density approximation (LDA). PBE norm-conserving pseudopotentials were used as these are consistent with the PBE exchange functional, (see Table S1 in the Supplementary Materials) and enable the calculation of spectroscopic data should further studies require this. The (geometry) optimizer was Broyden–Fletcher–Goldfarb–Shanno (BFGS) [33], and the electronic method was ensemble density functional theory (EDFT) [34]. Further convergence details per BFGS iteration are as follows: energy change per ion: dE/ion 2 × 10⁻⁵ eV; electronic energy tolerance: 10−6 eV; maximum force: |F|max 0.05 eV/Å; change in displacement: |dR| 0.002 Å. All calculations were non-spin polarised. The c lattice parameter was held at a fixed value appropriate for the volume between the layers to accommodate the molecules of interest, for which physical judgement based on prior work [12] was used, rather than having to optimize essentially empirical dispersion functionals.
2.8. Computer Simulation Models
A double unit cell (along the b crystal axis) of kaolinite (Al2Si2O5(OH)4) was made [35], and after initial relaxation, the c-cell parameter was expanded to 17.00 Å, shown in Figure 1 to accommodate (separately) three organic monomers of FL22, FL22mod and PVA (see later in this section), and to ensure no interlayer space was created as this does not occur in kaolinite. Cell parameters of the relaxed structure agree well with experimental data [36]. The siloxane surface of kaolinite has a relative positive charge compared to the relatively negative charge of the hydroxyl surface at most pH. This charge difference creates an artefactual electrostatic field between periodic images, which is addressed by fixing all lattice parameters and allowing only the atomic positions to subsequently relax. Monomers FL22 and FL22mod contain quaternary nitrogen atoms, the corresponding polymers of which are produced using a chloride or bromide salt. In periodic models a charged ion (in this study Cl−) could self-interact with its periodic image, an artefact of the methods. Here, these electrostatic effects were tested by replacing the Cl− with a positive background charge [37], which represents the removal of an electron from the clay/monomer system, compared to the chloride ion accepting an electron from the monomer. The models with a charge rather than a Cl− ion are referred to as “no chloride” or “charge-only” from this point onwards. The significance, if any, of the anions on the interaction of the polymers with kaolinite is not known and is difficult to probe experimentally, hence the theoretical investigation of both Cl− and charge-only scenarios allows the investigation of modelling artefacts and provides further insight on the role of anions on quaternary polymer/kaolinite adsorption.
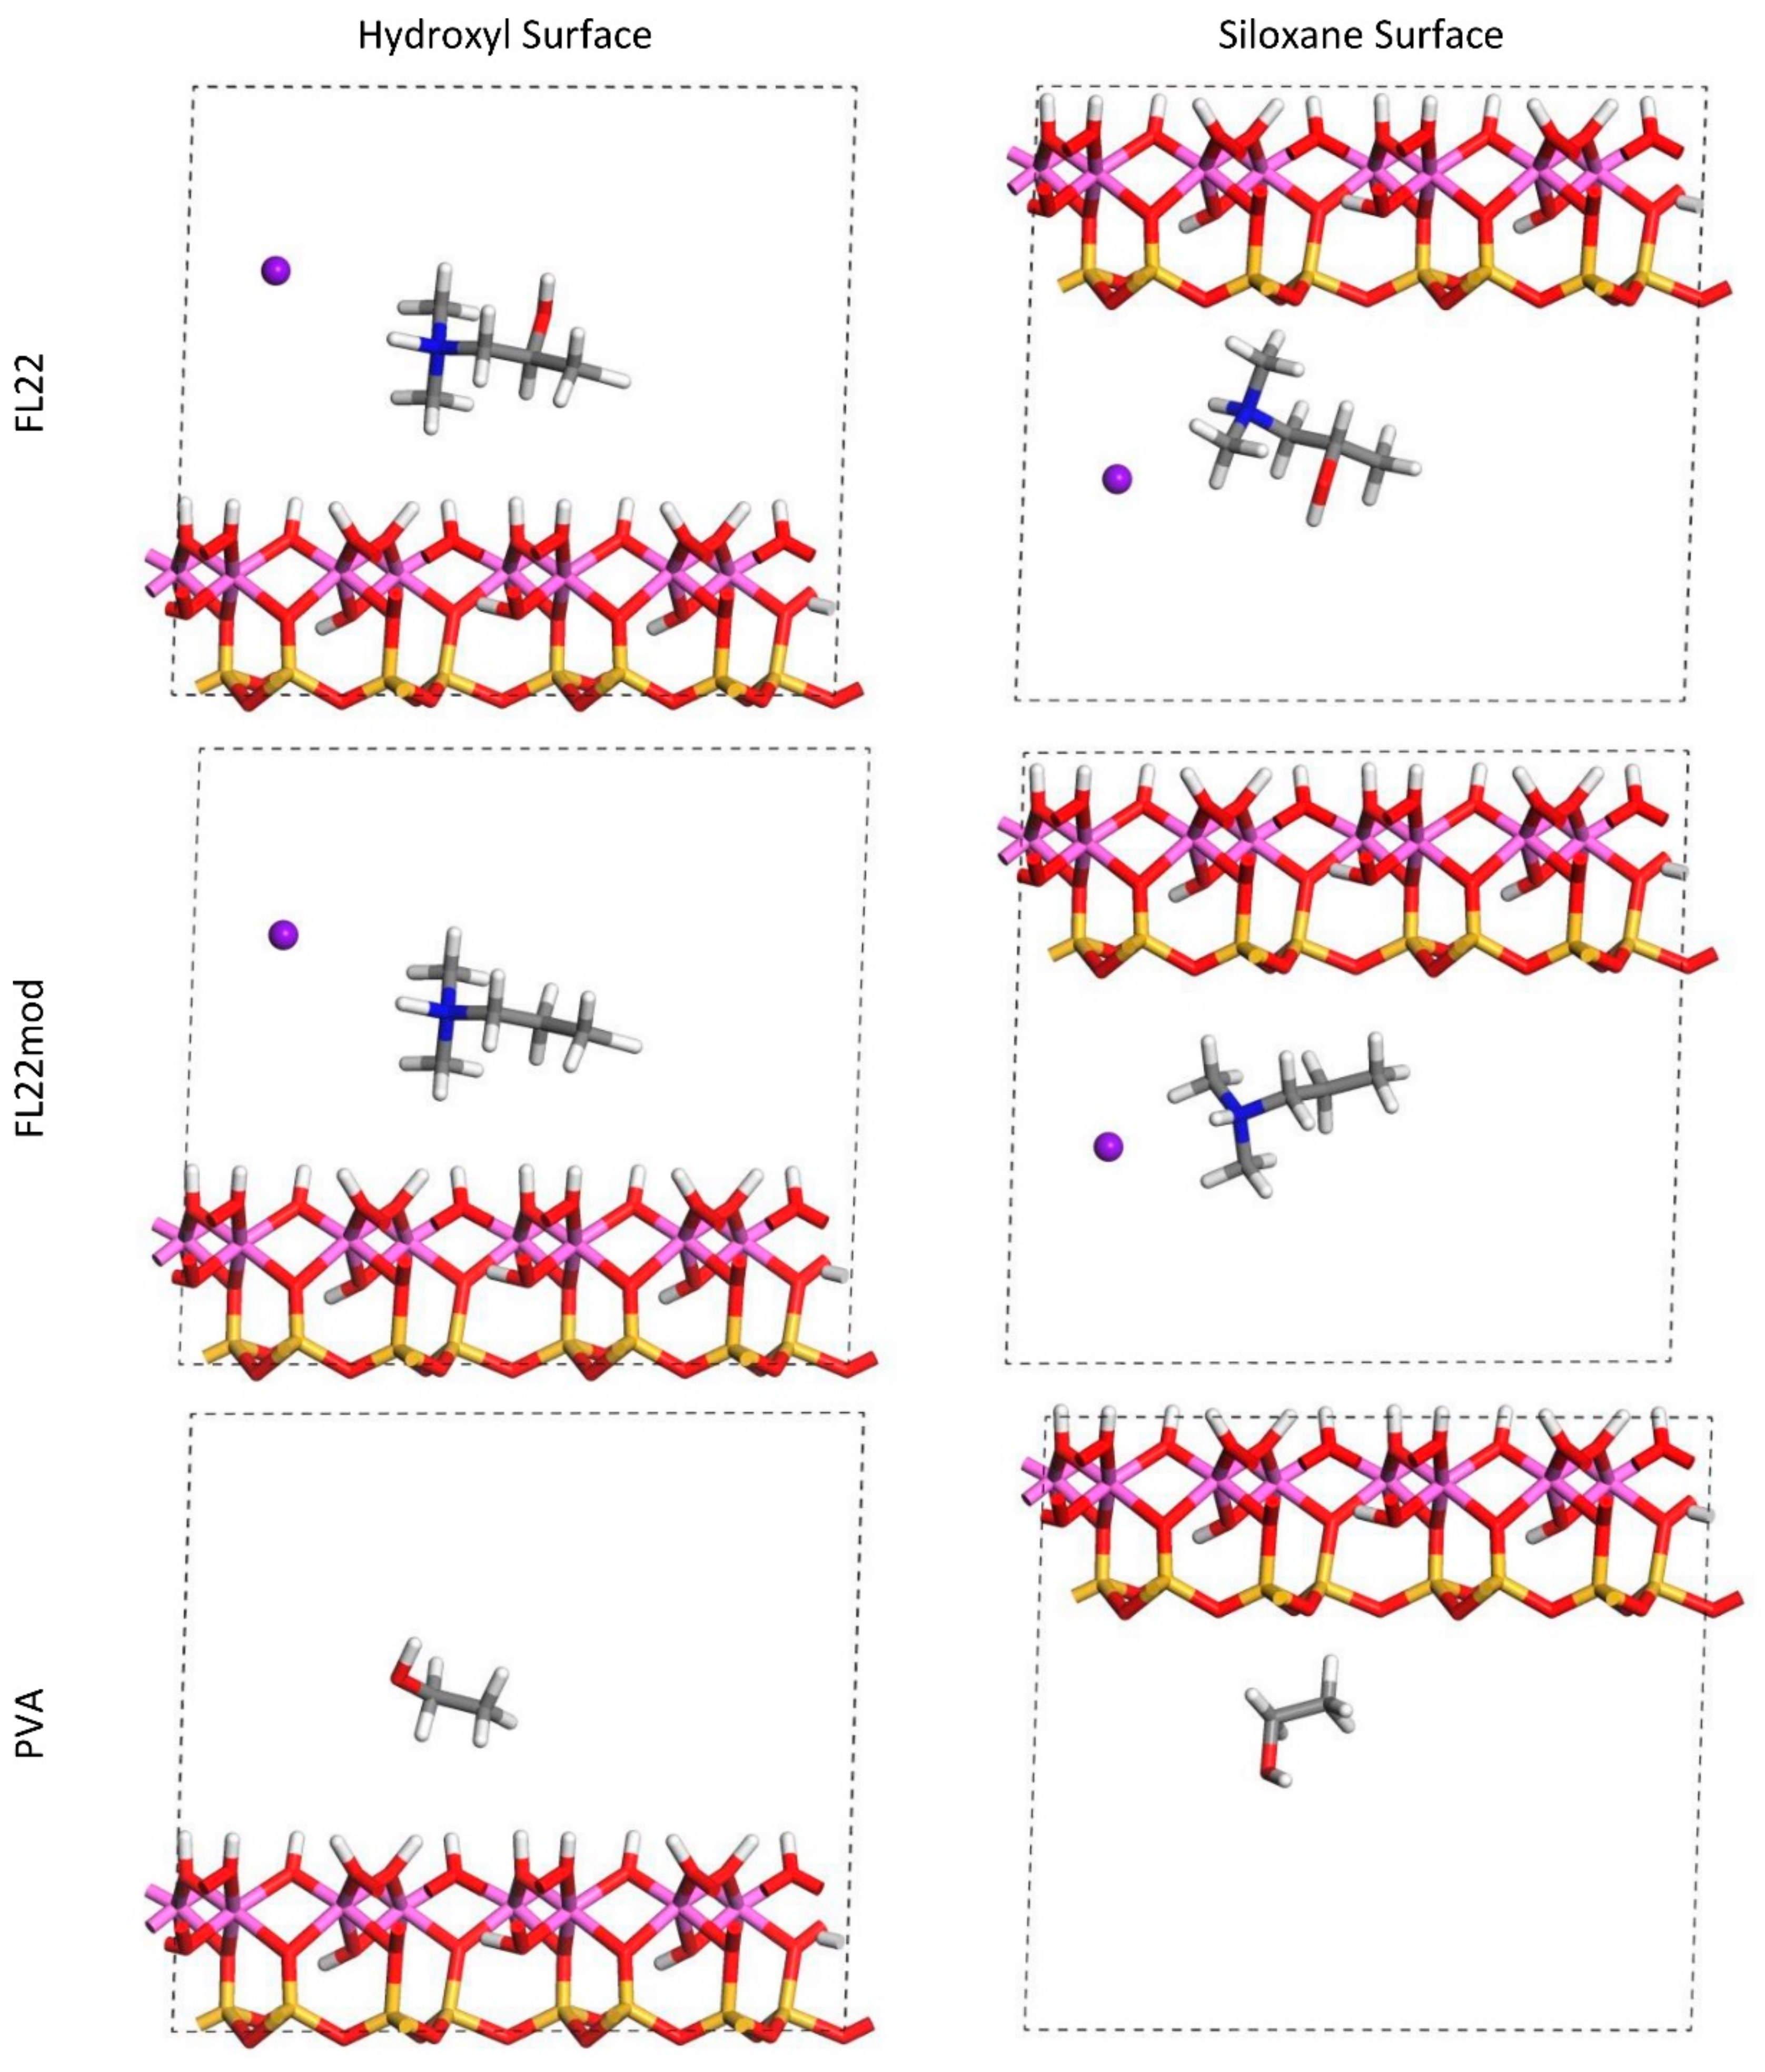
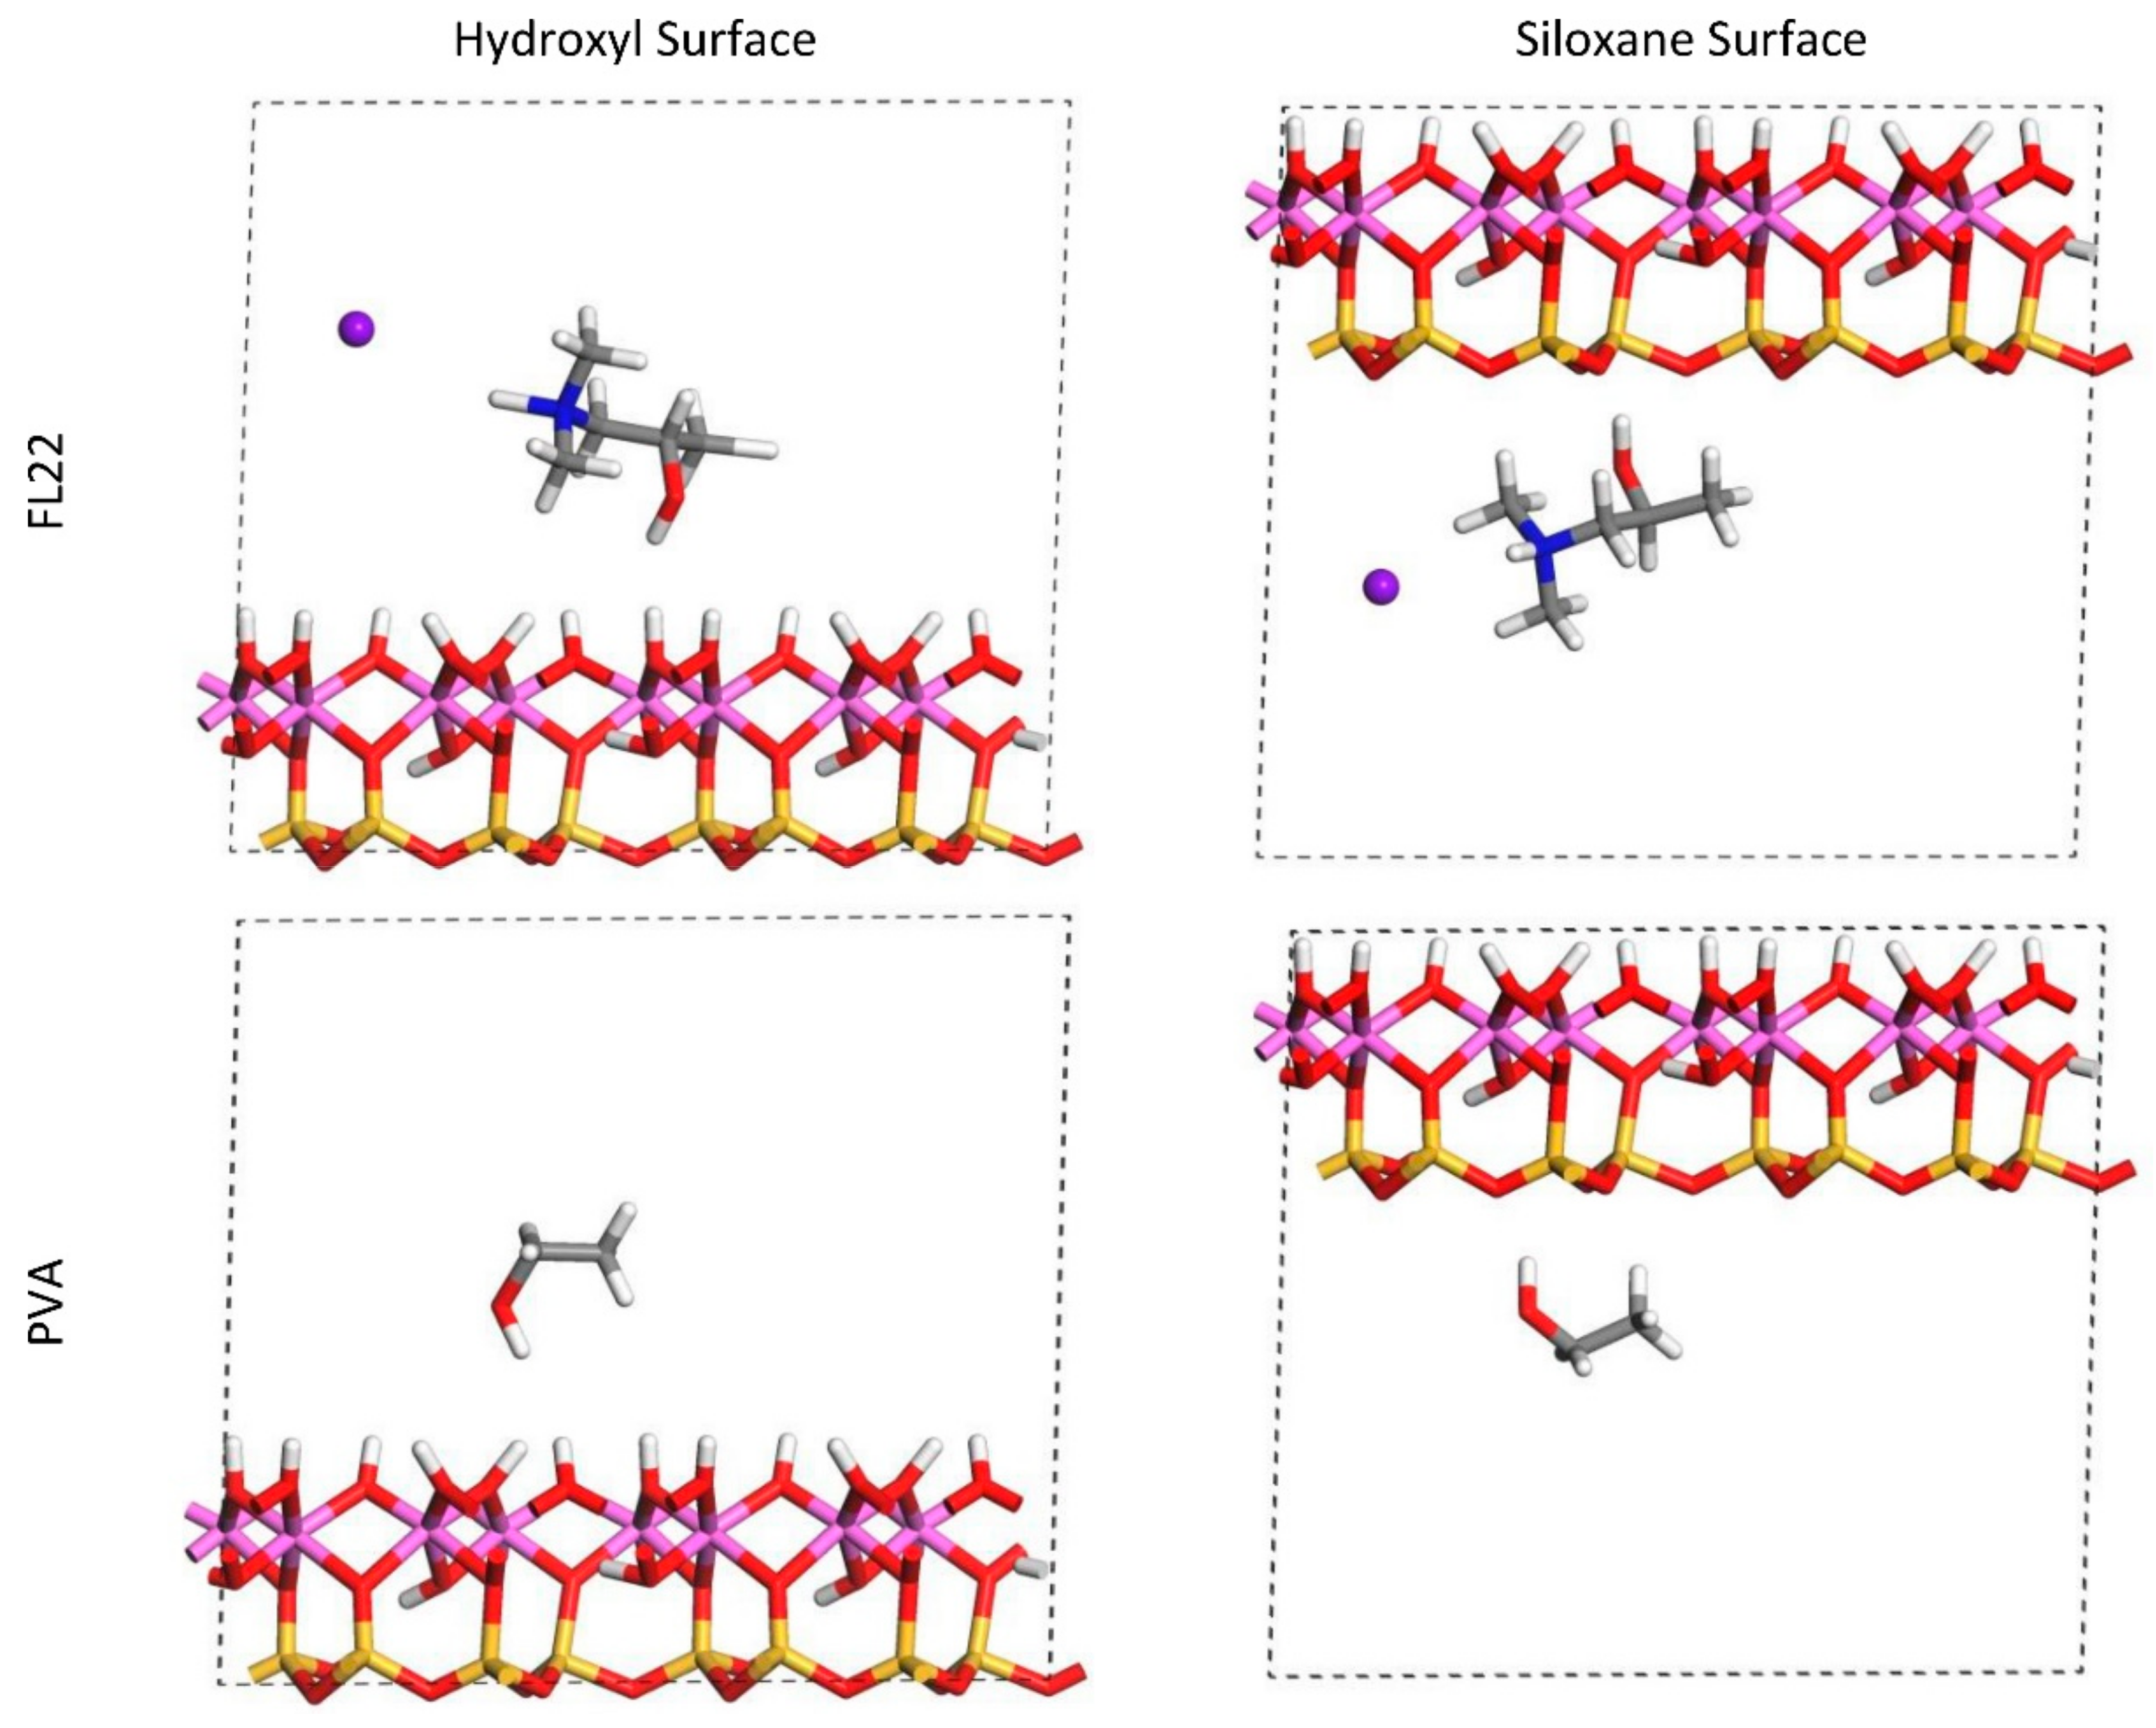
For FL22 and FL22mod, four models were created, with each monomer positioned approximately 4.5 Å from the hydroxyl surface and, separately, the siloxane surface, each of these with Cl− and separately, with a background charge. As PVA has no associated charged ion, this monomer was placed at 4.5 Å from the hydroxyl and siloxane surfaces in the absence of Cl− and charge. FL22 and PVA contain hydroxyl groups with the potential to form hydrogen bonds with the basal surfaces of the clay. This was tested by creating two scenarios labelled orientation 1 (o1) and orientation 2 (o2), where in o1 the hydroxyl groups point away from the basal surface, and in o2 the hydroxyl groups point towards the basal surface. The initial configurations for these monomers are shown in Figure 1 and Figure 2. The atomic positions of these models were then allowed to relax, in accordance with the convergence criteria described in Section 2.7.
To test the effect of polymer size on the results, trimers of all three monomers were constructed, both with and without Cl−, and with the trimers positioned both parallel and diagonal to the surfaces, with the OH-groups pointing towards and away from these surfaces (shown in Figure 3). The size of these models and hence the computational expense required for full geometry relaxations, necessitated the relaxation of the electronic structure only. The orientations of the trimers are based on the relaxed configurations of the monomers, and the range and number of the modelling scenarios was sufficient to extract useful information. From the relaxed geometries of the monomer/clay models the surface coverage of the basal surfaces was calculated, and this was repeated for the trimers to give an indication of the differences that might be seen when using longer chains of polymers. The formation energies of the monomer/kaolinite models and the relative charges of the monomers and trimers using Mulliken analysis were also calculated [38,39,40,41].
3. Results
3.1. Zeta Potential/Electrokinetic Properties
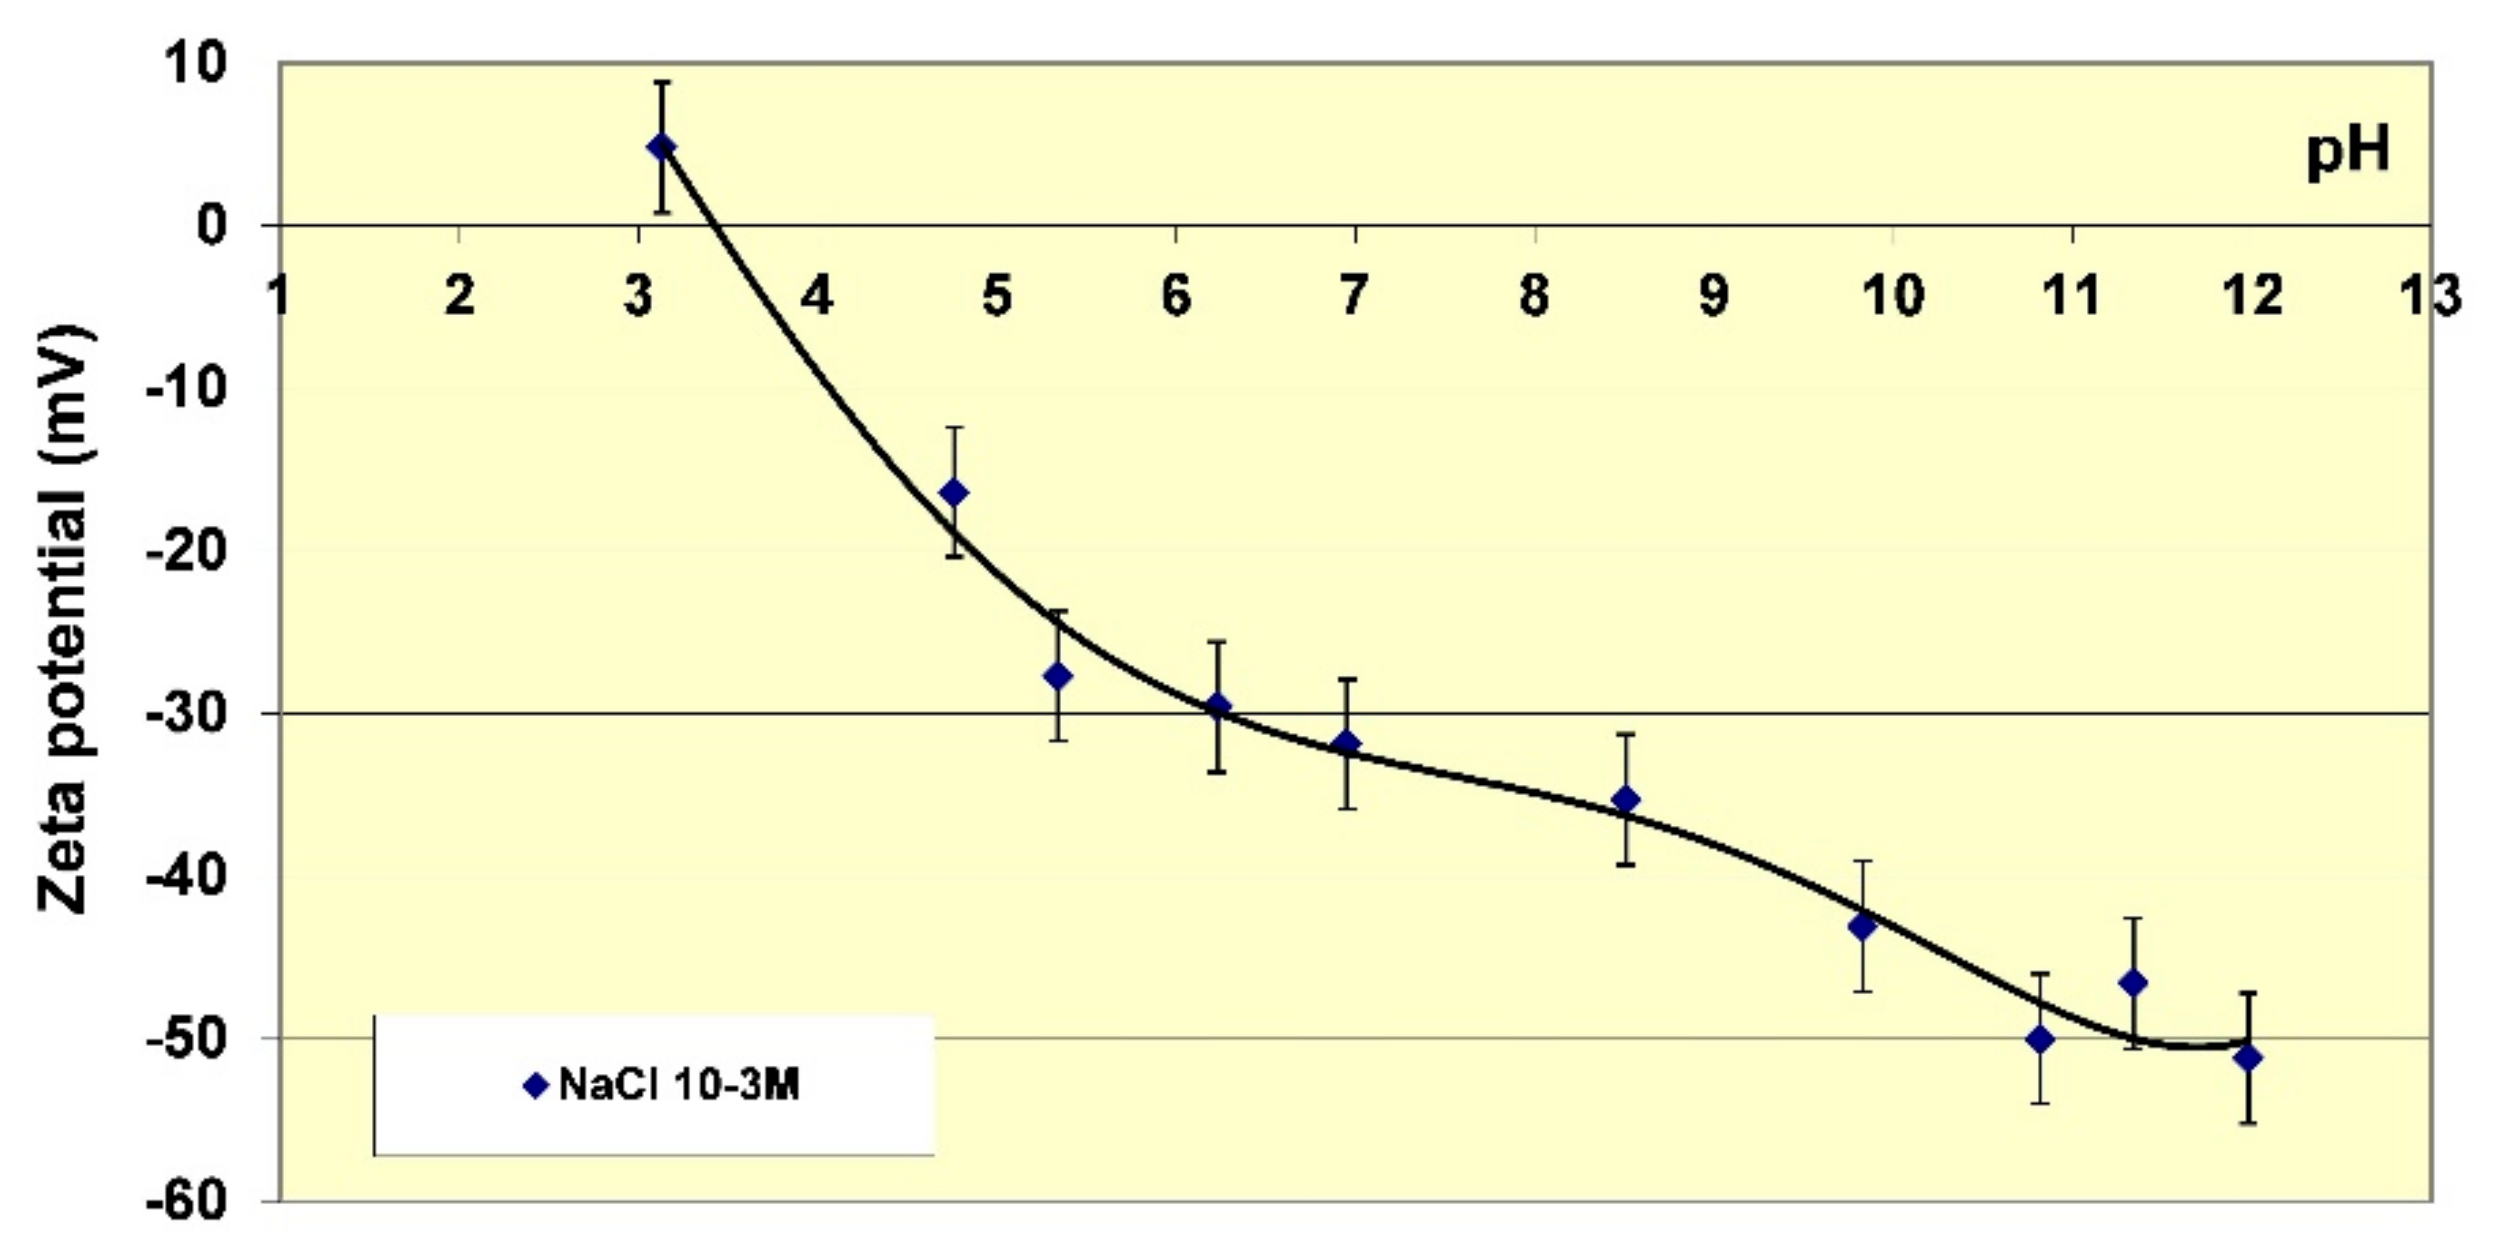
Before undertaking adsorption measurements of the different polymers on kaolinite, it is useful to characterise the electrokinetic properties at different pH. Particle mobility is influenced by ionic force, therefore measurements have been made in solutions of NaCl (0.001 M). Figure 4 shows the zeta potential of the particles as it varies with pH. The electrokinetic properties of this kaolinite are typical for this type of clay mineral [42,43]. The isoelectric point (IEP) is between pH 3 and 4. At this pH the apparent electric charge of the particles is zero; when the pH is increased the zeta potential of the particles becomes increasingly negative. The highest mobility values are achieved for pH values above 10.5. The zeta potential then reaches values around −50 mV, which are sufficiently high enough to allow the formation of very stable kaolinite suspensions i.e., with no settling of particles. A large body of work exists discussing the origin of the surface charges of kaolinite as a function of pH [42,43] and it has been established that the increase of the charge with pH is essentially due to the ionisation of the surface sites of kaolinite. The lateral siloxane surfaces (SiOH) are ionised by losing a proton at pH above the IEP, and the sites on the basal and lateral aluminium (AlOH) surfaces are ionised by capturing protons at acidic pH and losing protons at basic pH, especially above about pH 9. At very high pH, we can therefore consider that all of the ionisable surface groups are in a deprotonated form and therefore anionic.
3.2. Adsorption Studies and Polymer Cationic Nature
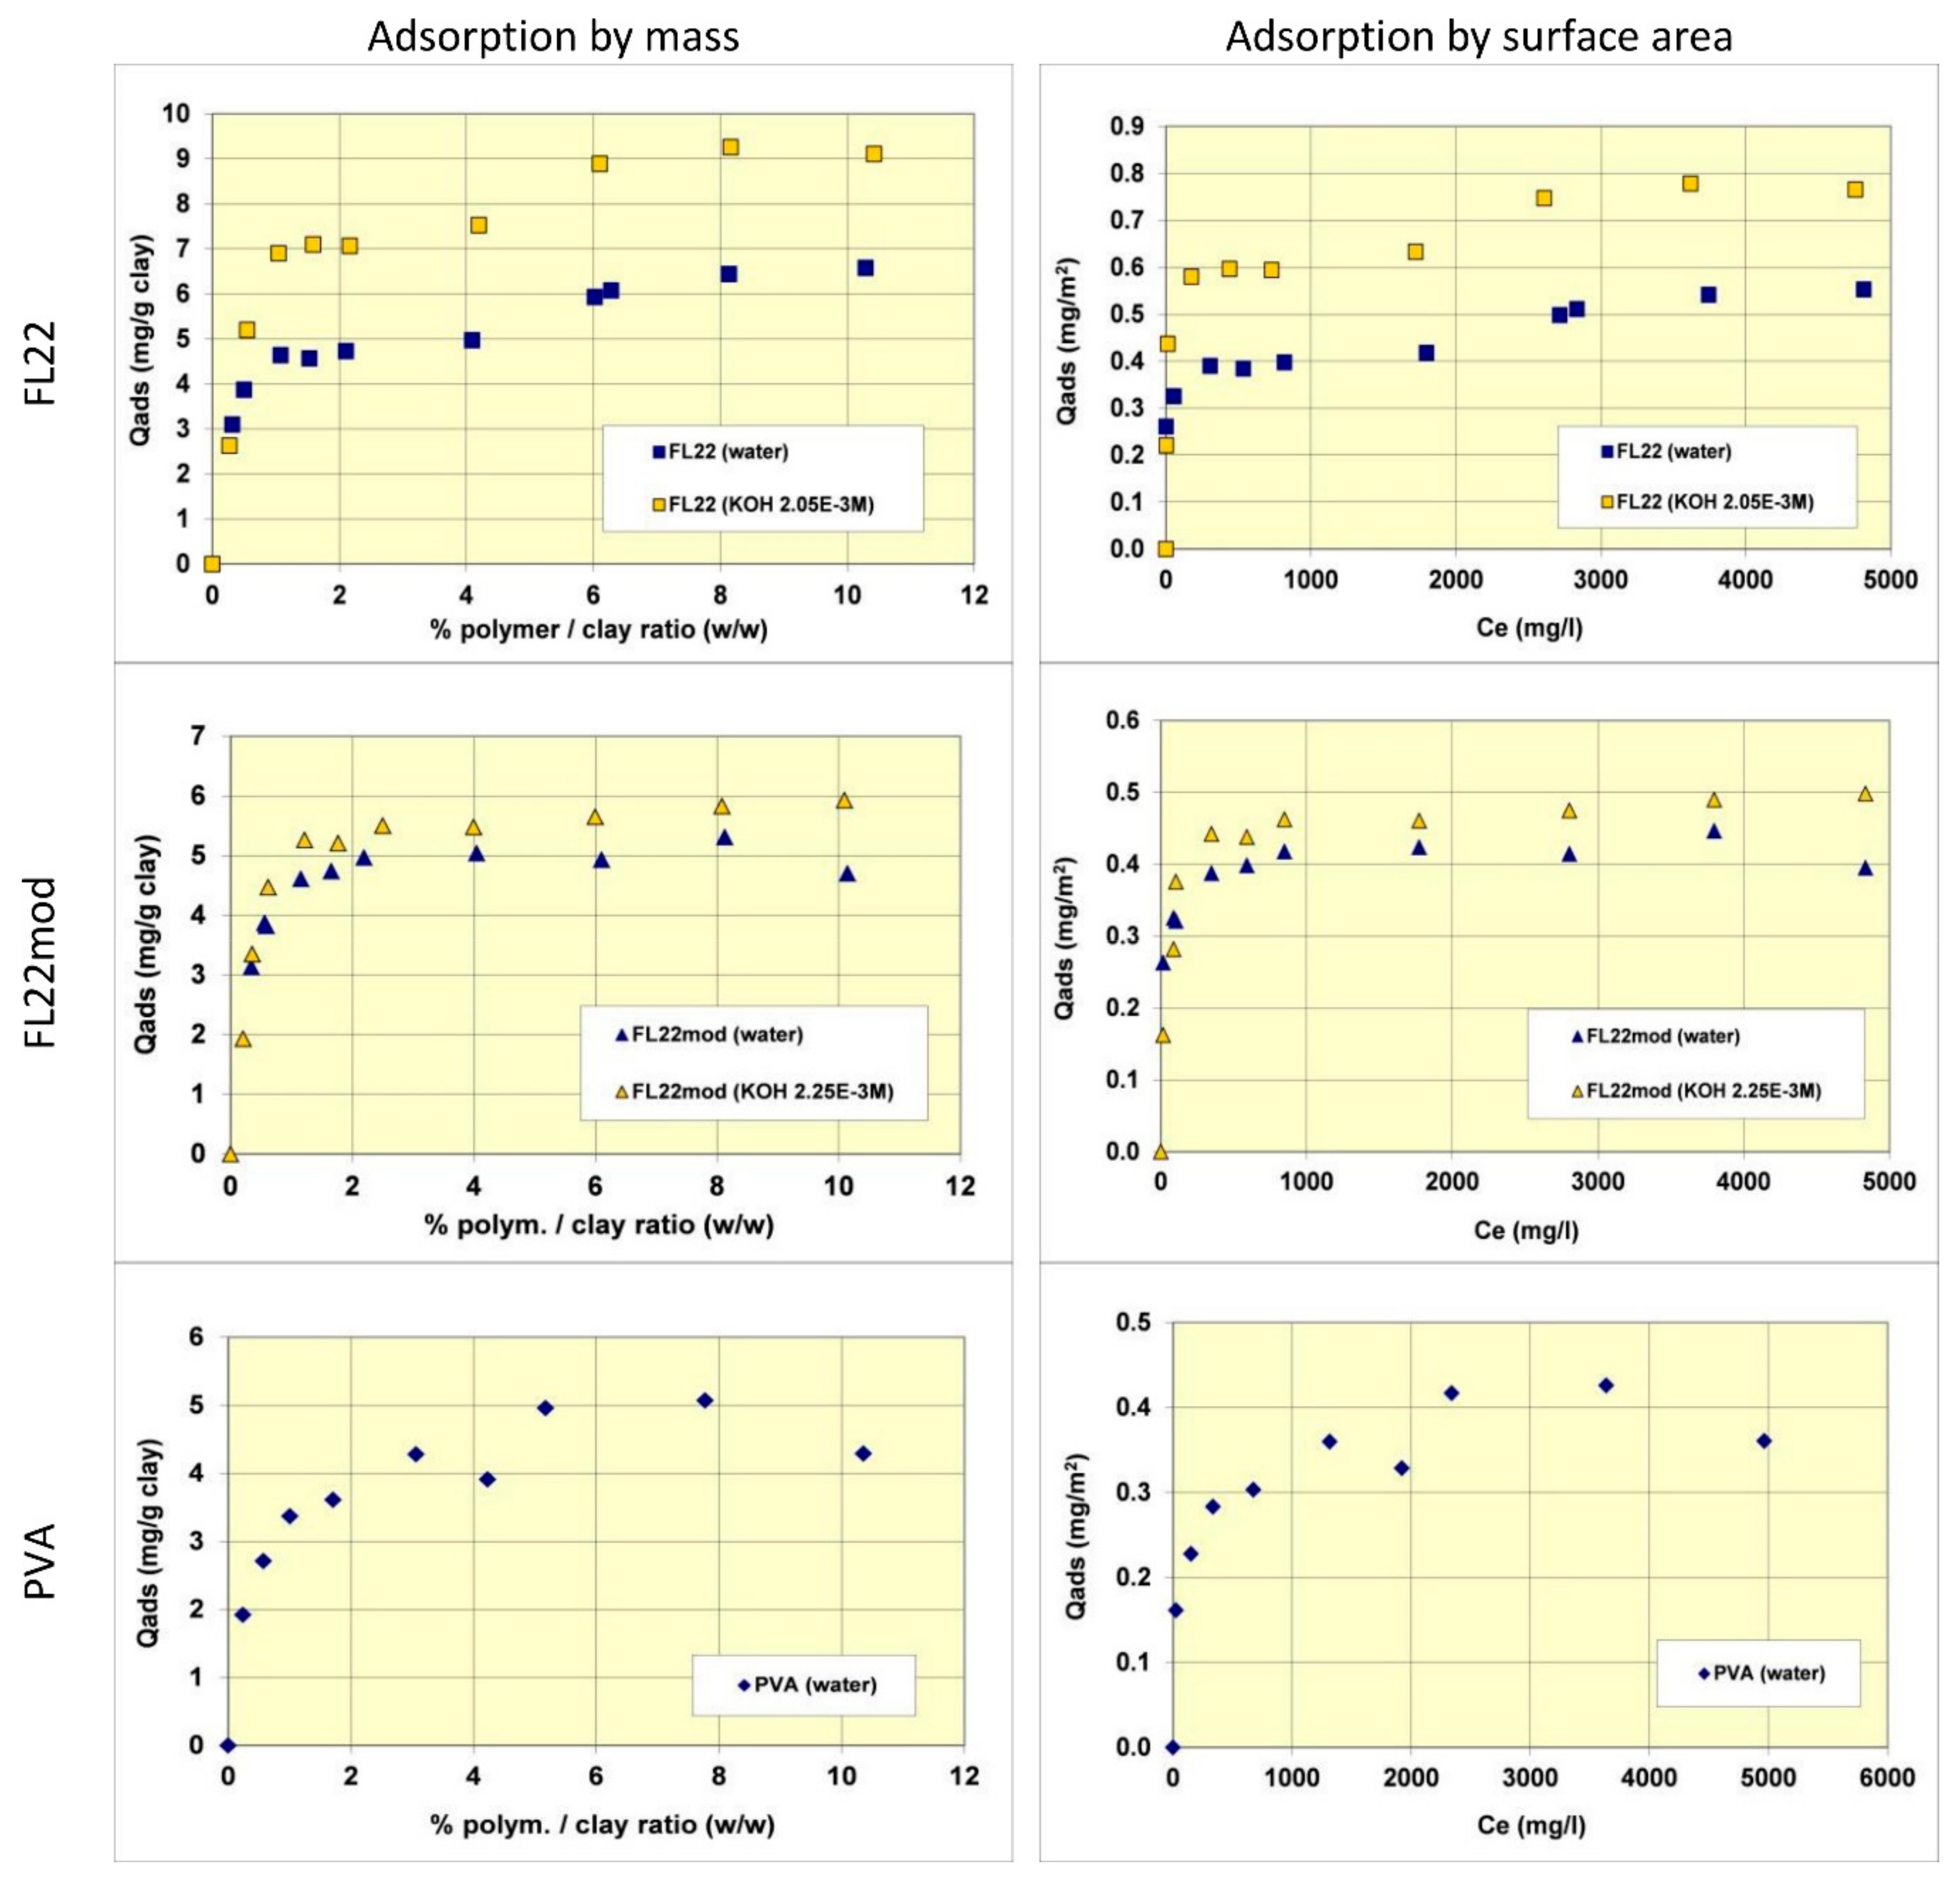
The adsorption isotherms of the three polymers were obtained in suspensions of kaolinite in water. The pH of the mixtures was therefore the natural pH (the pH each polymer solution formed), changing as a function of the ionic exchanges between the medium and the kaolinite surfaces. Subsequently, new isotherms were measured at a basic pH with a known and set quantity of KOH (0.1 M) to study the adsorption at pH values higher than pH 10. As illustrated in Figure 5, the quantities of adsorbed polymers on this kaolinite, having a relatively low specific surface area (11.9 m2/g), were not very high. The maximum adsorbed quantities were indeed lower than 1% by mass of the clay. This finding made it necessary to reproduce certain points of the isotherms several times to confirm the obtained experimental values.
Comparisons of isotherms obtained with different polymers at a natural pH (initial pH of the suspension close to 6) showed that the adsorbed quantities (given by mass) were not very different and did not greatly depend on the nature of the polymer. The obtained quantities were close to 5 mg/g of clay, i.e., 0.4 to 0.5 mg/m2 of clay. It should nevertheless be noted that the affinity of the PVA for kaolinite appeared to be lower than that of the polycationic polymers because the adsorption plateau was reached for higher residual polymer concentrations in solution. Furthermore, it should also be noted that the isotherm of the FL22 showed a second adsorption plateau at 7 mg/g of clay, not present in the other polymers. The obtained value does not correspond to the formation of a second layer of polymer on top of the surface of the first and it is therefore difficult to explain this phenomenon unless interactions between polymeric molecules occurred for the highest dosages of FL22. When considering the impact of the pH on the adsorption isotherms, it was evident that the increase of pH had little impact on the adsorption of the polycationic polymer without an OH group (FL22mod), which reached approximately 5.5 mg/g of clay. However, in the case of the FL22 polymer, adsorption greatly increased at a higher pH to approximately 7 mg/g of clay for the first plateau. A second plateau was always visible for this polymer (9 mg/g).
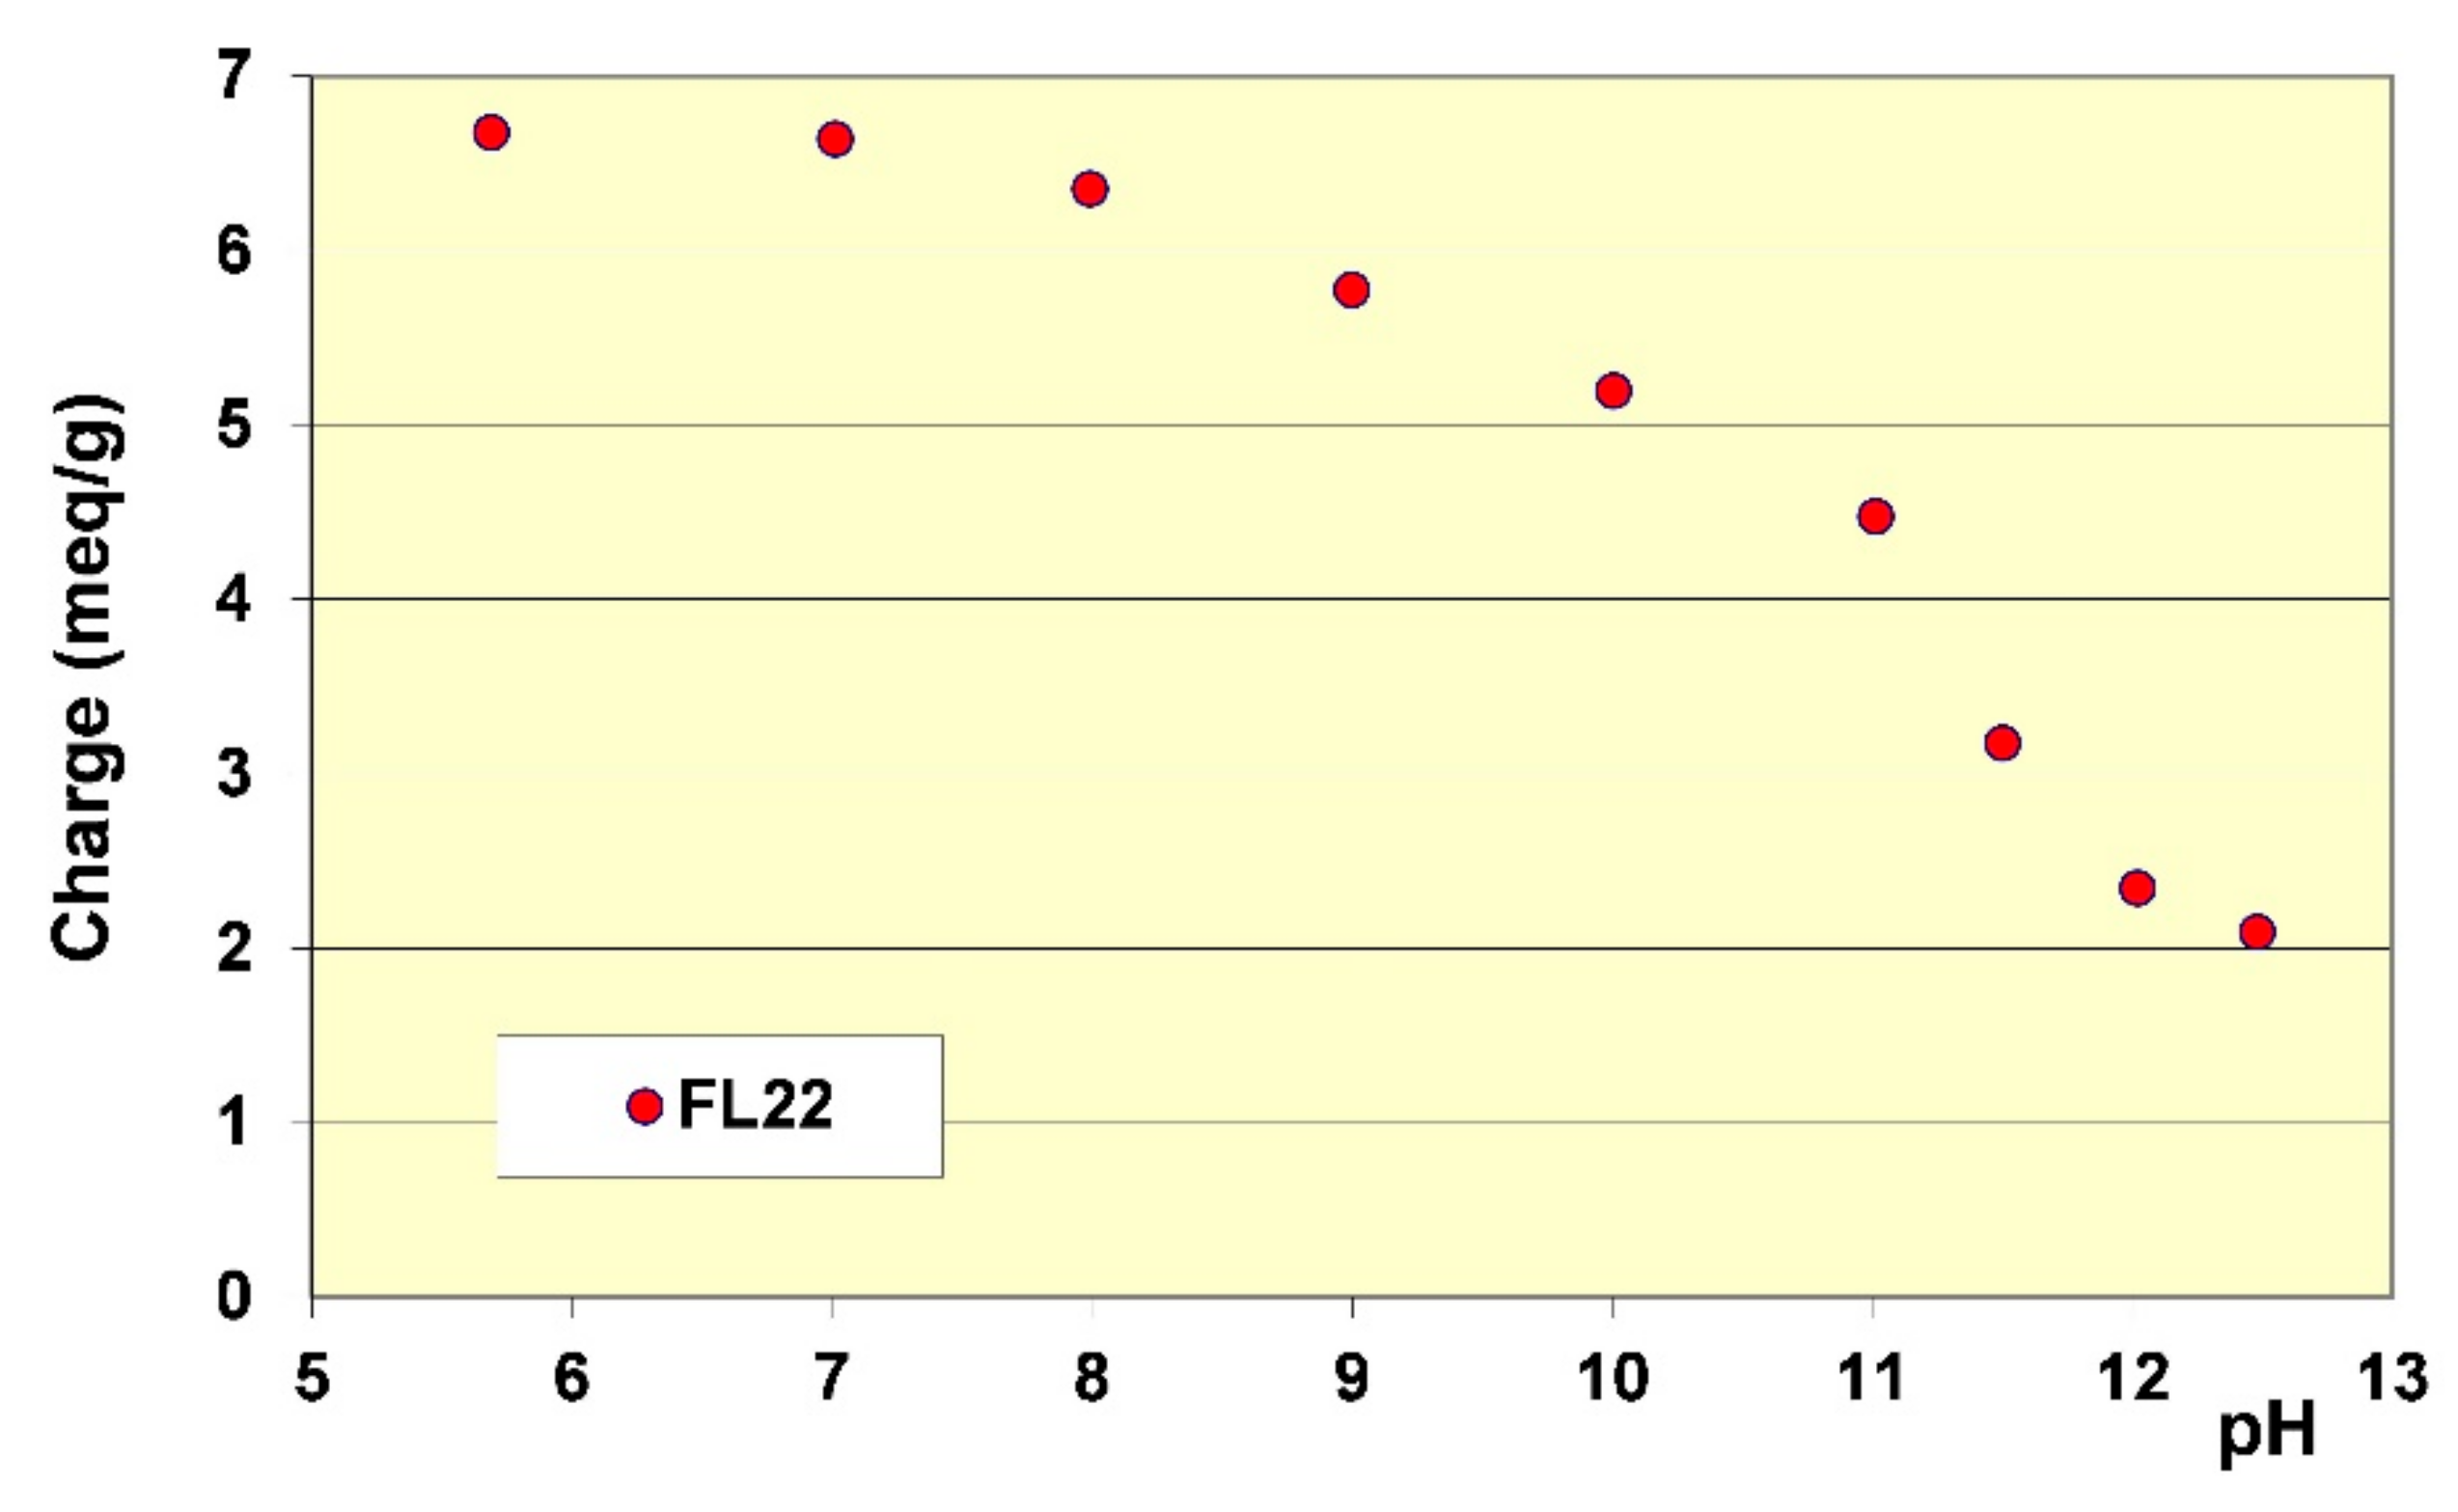
The stability of the OH group of the FL22 polymer at high pH explains these adsorption differences, hence the sensitivity to pH. Cationic charge measurements were carried out on the polymers according to the pH using the method described in Section 2.2. The results showed that while the cationic charge of FL22mod was not influenced by the pH, this was not the case for the FL22 containing the OH group (see Figure 6). It appeared that FL22 lost approximately 30% of cationic charge between pH 6 (6.7 meq/g clay) and pH 10.5 (4.8 meq/g clay). This polymer therefore had a fraction of negative sites on its chain at high pH. It would then be possible to infer that the electrostatic interactions created on this zwitterionic polymer induced an increased difficulty for this polymer to adopt certain configurations in solution, and hence also on the solid surface with which it would interact. When comparing the increase in adsorption of the FL22 with the pH and the increase of ionisation, it can be noted that the two were similar: 30% less charges correlating with some 40% more adsorption. The major part of this adsorption increase at high pH could therefore be explained by the variation of charges of the polymer; this variation would result in poorer adsorption efficiency on the clay mineral and aggregate surfaces.
The additional residual adsorption difference of 10%, which cannot be explained by the variation of the cationic charge, could probably be related to variation of the ionisation on the surface of the kaolinite when the pH increased. It is known, for example, that between pH 6 and pH 10.5, sites of the basal aluminous surface (AlOH) can ionize to form AlO−. When the adsorption variation of the FL22mod polymer was considered, which did not contain an OH group, and where the cationic charge was not related to the pH, it was found that between pH 6 and pH 10.5, the increase was equal to circa 10%.
Finally, the adsorption increase of the FL22 on kaolinite when the pH increased from pH 6 to pH 10.5 was 75%, accounted for by the variation of the polymer’s cationic charge and the remaining 25% accounted for by an increase of ionization on the surface of the clay at high pH. The fact that the adsorption of FL22 or FL22mod on kaolinite induced an increase of surface ionization was furthermore confirmed by measurement of the pH during adsorption (see Figure 7). In the case of the FL22, for example, the addition of a solution of polymer at 19.9% of active matter and at pH 7.4 in a suspension of kaolinite at pH 6 was accompanied during the first additions (complete adsorption of the polymer on the material) by a drop in pH (varying from pH 6 to pH 4.3). Subsequently, and when the supplementary adsorption greatly decreased, further additions of FL22 induced a rise of pH. The FL22mod behaved similarly (see Figure 7). The pH of the solution of polymer at 21.9% was equal to pH 9.6. Its addition in a suspension of kaolinite at pH 6.3 induced a drop of pH, which reached pH 5.5 before increasing when the additions of polymer were more frequent. We conclude from these results that the affinity of these polycationic molecules for kaolinite is extremely high.
In order to better evaluate the surface coverage of the cationic polymers on kaolinite, the adsorption results are given in number of monomers per unit surface area (see Figure 8). It clearly appears that FL22mod is adsorbed a little less than FL22 (with the OH group) at the natural pH of the suspension. These differences between adsorption by mass and adsorption by number of monomers can be explained by the fact that FL22 is a polycationic chloride while FL22mod is a bromide, the molar mass of which is higher (79.9 g/mol for the bromide and 35.5 g/mol for the chloride ions, respectively). At the natural pH of the suspension, the surface coverage of the kaolinite was equal to 1.5 monomers/nm2 for FL22mod and 1.8 monomers/nm2 for FL22.
For high pH, the average coating level increased from 1.7 monomers/nm2 for FL22mod to 2.6 monomers/nm2 for FL22. It should be noted that only the adsorption values obtained on the first adsorption plateau were taken into account here.
In the second part of this study, the aim was to compare the experimental surface coverages obtained at natural pH with those resulting from molecular modelling. Given the differences between the adsorbed quantities of the two polycationic polymers at natural pH (20% by number of monomers), this study was completed by measuring the adsorption isotherm of polyvinyl alcohol (see Figure 8) wherein the monomer is not charged and is much smaller in size (length is approximately 3.8 Å for PVA sub-unit; 5.6 Å for FL22). The surface coverage of the PVA was equal to 5.5 monomers/nm2, i.e., approximately two to three times higher than the level obtained for the polycationic polymers.
Given that the length per monomer of PVA is approximately two fold shorter than the FL22 system monomers, the lower level of coverage for FL22 is perhaps not unexpected, however the conformation space available to each polymer and the polymer specific functional group interactions also need to be accounted for, and we discuss this further when comparing the computational modelling with experiments in Section 3.4.1.
3.3. Flocculation
Finally, the question was raised whether these differences of affinity between FL22 and FL22mod for kaolinite could have an impact on the stability of the kaolinite suspensions (state of flocculation). Observations were therefore made after 24 h of stirring with and without the polymer (see Section 2.4). These observations are recorded in Table 3. At pH 6, the suspension of kaolinite was not stable and all the particles flocculated. If this observation is compared to values of the zeta potential (Figure 4), this result is coherent because the value obtained is within the range of −25 mV and −30 mV, a value usually considered to be too low to stabilize a colloidal suspension. When adding increasing dosages of the three polymers, differences of behaviour were observed. In the case of the polycationic polymer FL22, several phases of deflocculation/flocculation/deflocculation were observed as increasing dosages of the polymer were added. Fines often tended to be present in the supernatant.
This phenomenon could be explained by an inversion of charges of the particles of kaolinite for the highest dosages of FL22. This finding was already noted for this type of polymer at natural pH [44]. In the case of FL22mod, flocculation was maintained after the additions. This polycationic polymer therefore does not allow for a re-dispersion of the clay at these pH values. In the case of PVA, however, the suspension did not change very much in relative terms by the increase of adsorption; flocculation was maintained whatever the dosage. At a high pH (pH of approximately 10.5), and as mentioned in Section 4, the apparent charge of the particles was high and the suspension of kaolinite, when polymer was absent, dispersed. The addition of FL22 induced flocculation, followed by re-dispersion for the higher dosages of polymer. There is every reason to consider that, as in the case of the measurements at natural pH, there was an inversion of the negative charge of the particles of kaolinite. This therefore tends to confirm that surface adsorption is arrested due to the polymer’s N+ charge being more than the sum of the negative charges of the kaolinite, hence the non-optimum surface coverage efficiency. There will then remain residual positive charges on the polycationic polymer after adsorption. In the case of the additions of FL22mod (without an OH group) in the suspension at high pH, flocculation of kaolinite was observed. No re-dispersion was observed and all the particles flocculated at the highest dosages. It is therefore possible to consider that there was no or very little inversion of charge, making it possible to presume better adsorption efficiency on the surfaces with better neutralization of the negative charges on the surface.
These results, even though they originate from relatively simple observations, are therefore coherent with the hypotheses already advanced on the role of the OH group during the adsorption of polycationic polymers on kaolinite.
3.4. Geometry and Surface Coverage from Simulations
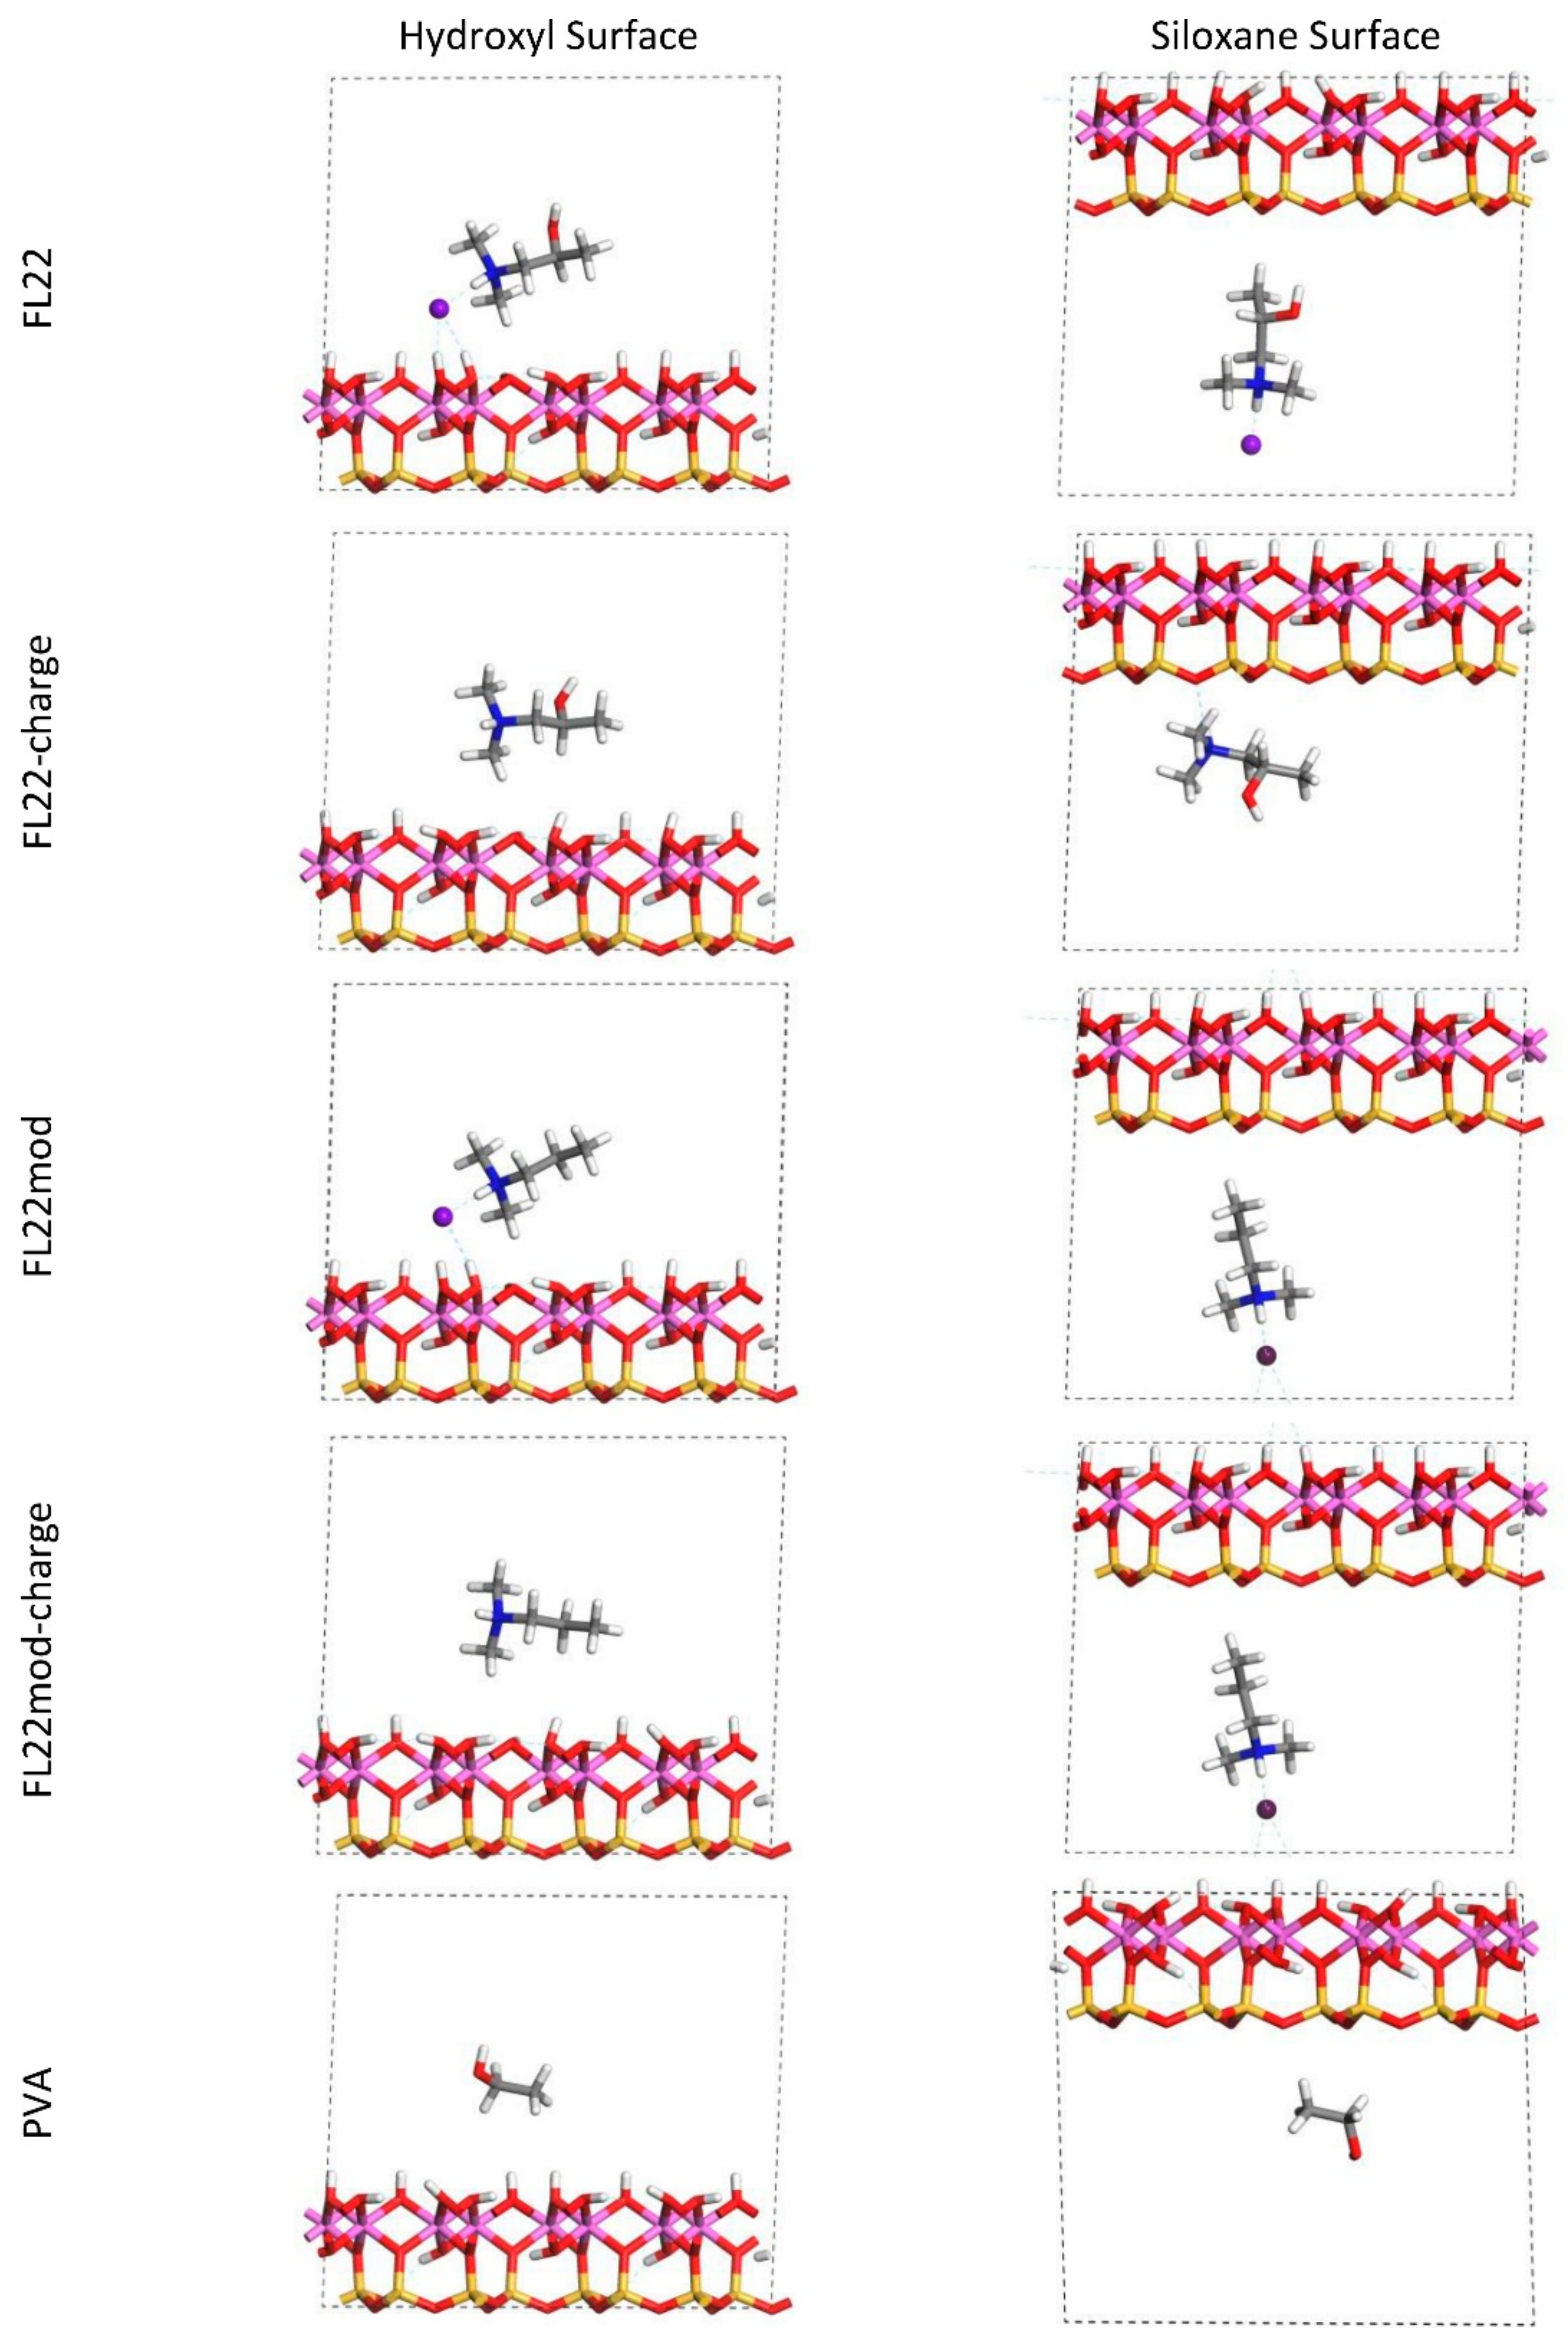
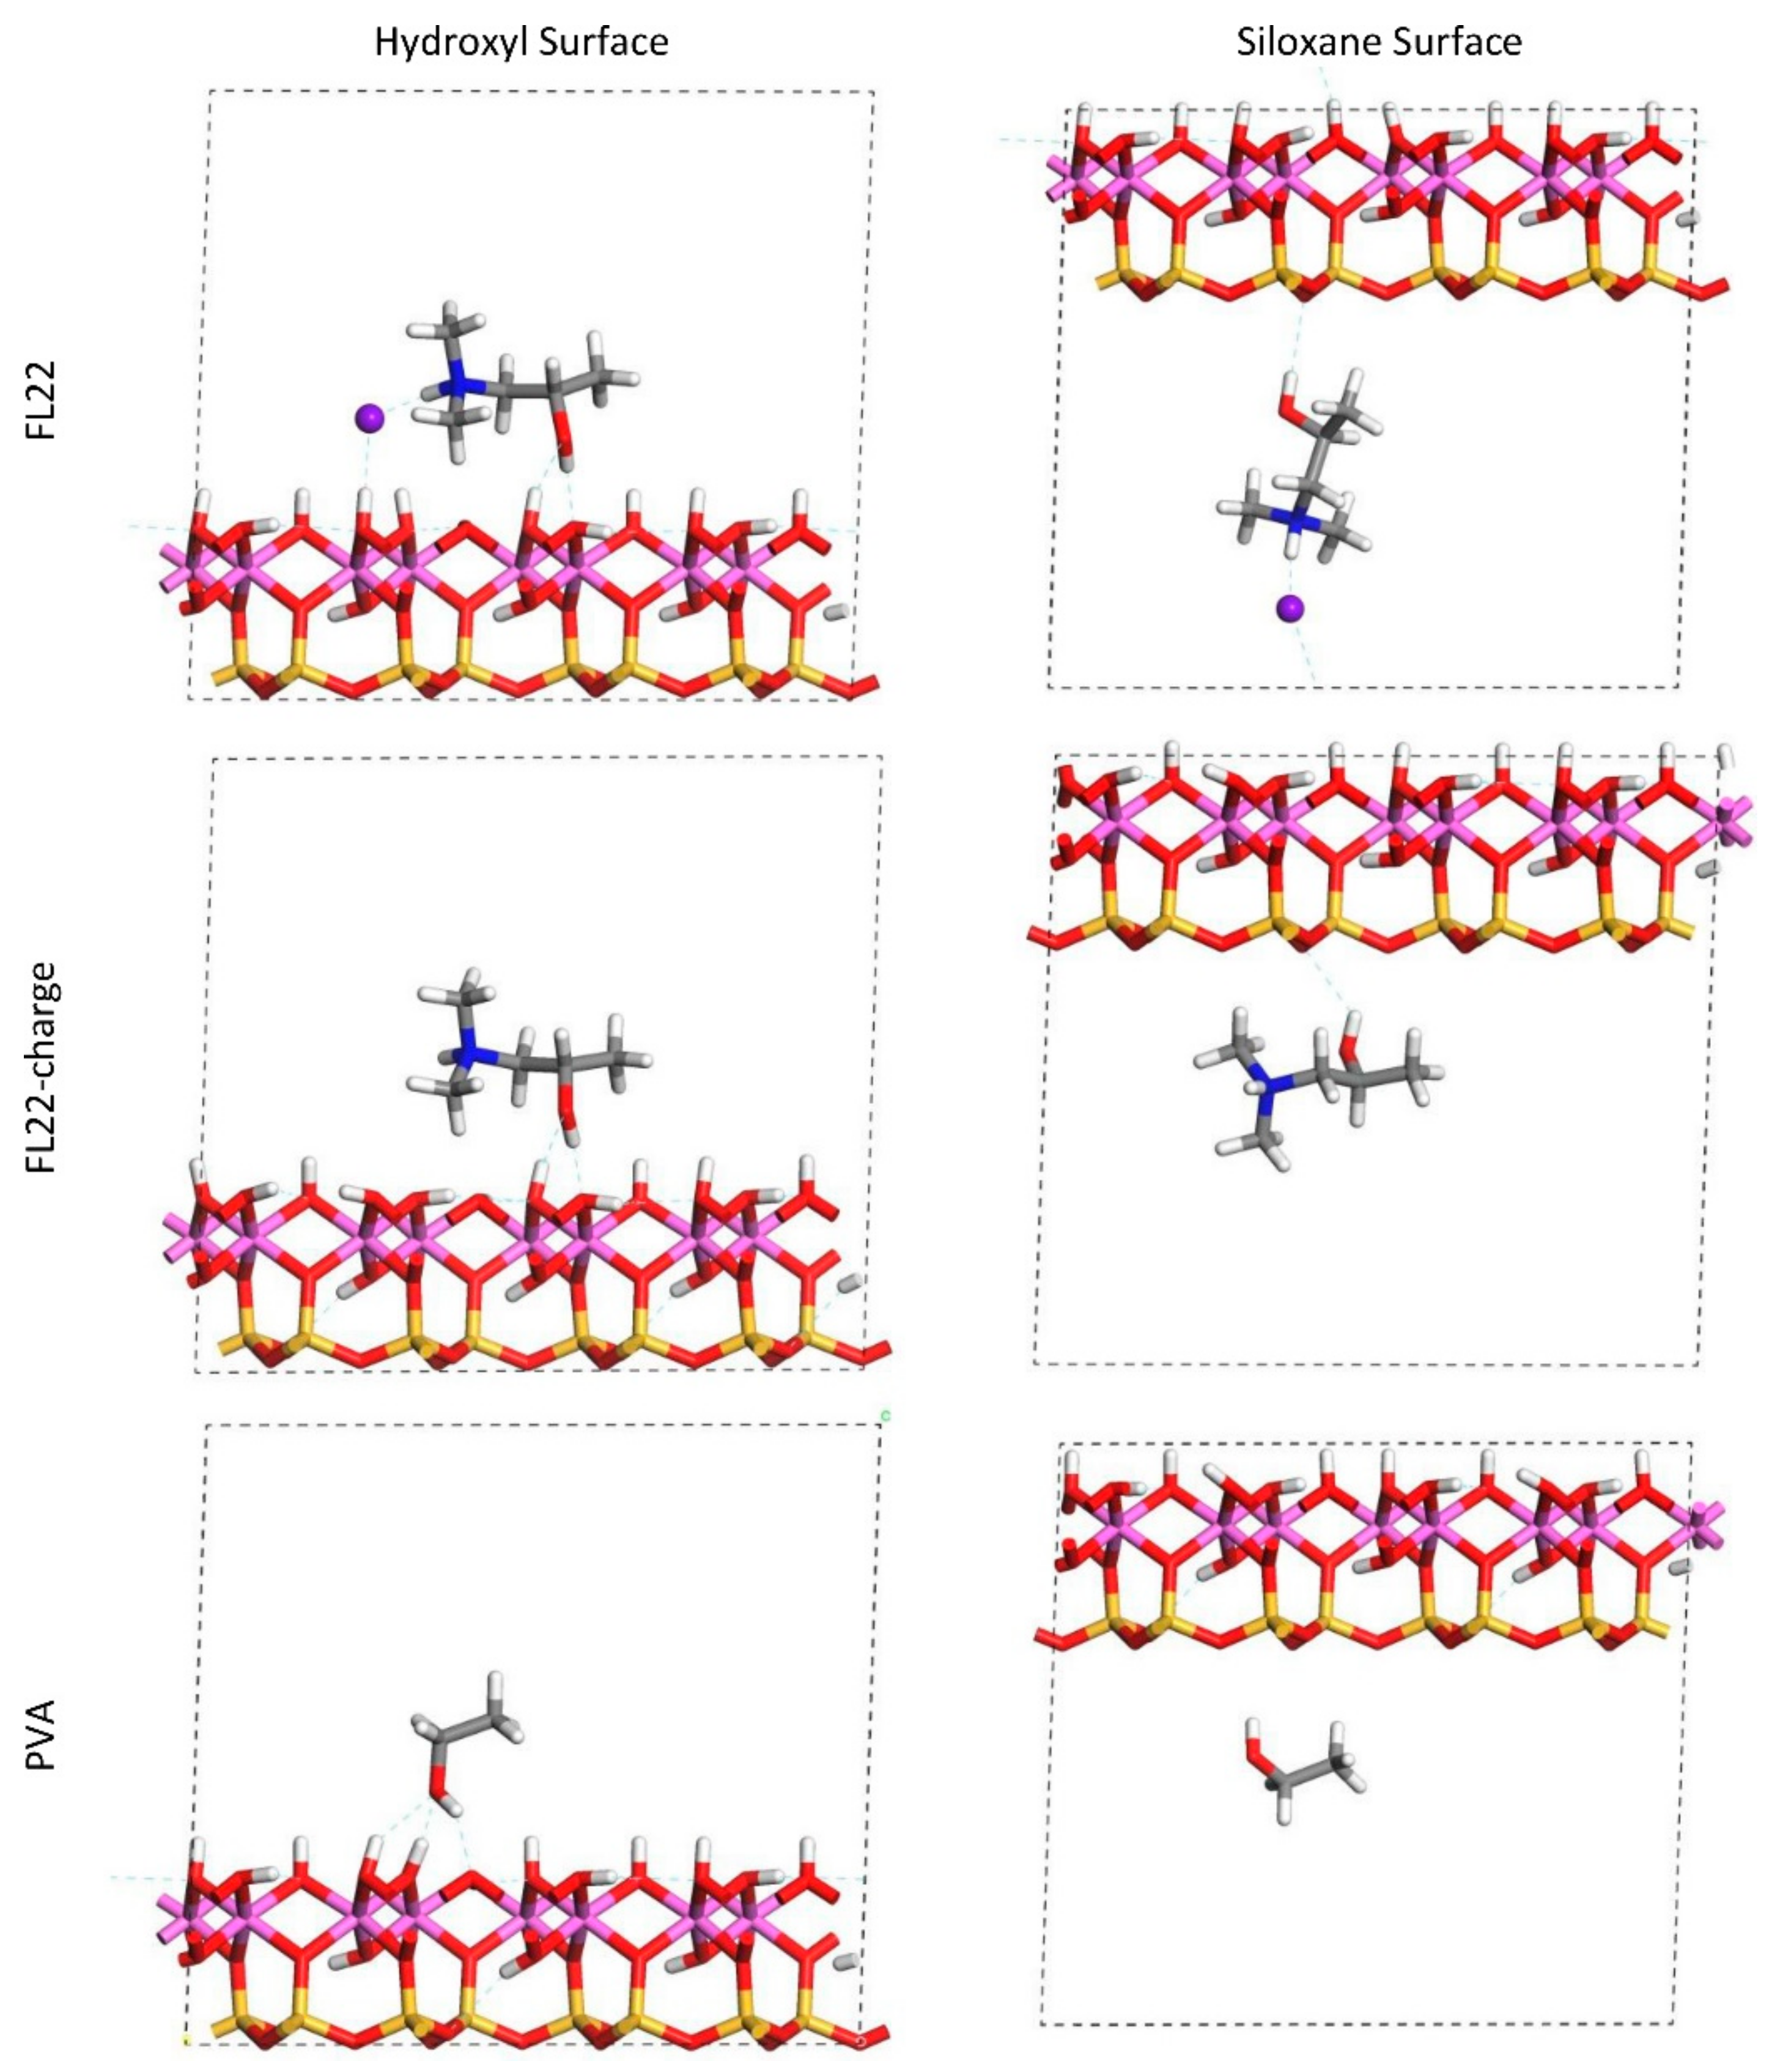
The relaxed configurations of the monomer/kaolinite models can be seen in Figure 9 and Figure 10 and comparing these shows that the initial orientation of the hydroxyl group of the monomer affects formation of hydrogen bonds with the basal surfaces. If the OH-group of the monomer is sufficiently close to the hydroxyl surface, the relaxed configuration exhibits hydrogen bonding between the monomer and this surface. This also occurs at the siloxane surface for FL22 but not for PVA. There is also some hydrogen-bonding between the H of the N–H group and the chloride or basal surface, although this is not as significant as the hydroxyl hydrogen-bonding because there is only one N–H group per polymer, compared to one per monomer, hence this contribution to the interactions is relatively insignificant. The presence of water in the system has been studied for a simple ammonium monomer system [12], and given the hygroscopic nature of the quaternary ammonium group, especially with an adjacent OH group, there may be further hydrogen bonding. However, the previous study showed that addition of explicit water molecules has negligible effect on the orientation of the monomer both with and without chloride, but an analysis of frontier orbitals showed it completely changed the reactivity of the monomer [12].
The presence of chloride compared to charge has the effect of orienting the monomer towards the hydroxyl surface, mostly due to the formation of hydrogen bonds between the chloride and the monomer and the chloride and the hydroxyl surface. This effect is seen for both orientations 1 and 2 for FL22 and FL22mod and is a consequence of using a monomer [12]. The same degree of orientation is not expected to occur for a polymer in the presence of chloride. This difference in orientation created a difference in surface coverage as can be seen in Table 4, where for most models without chloride, the surface coverage is higher.
Surface coverage was calculated by projecting the aspect of the monomer (and chloride where appropriate) facing the basal surface, including the van der Waals radii. Consequently, where a chloride ion lies outside the monomer projection, the total surface coverage is lower, and where it falls within the monomer projection it is higher. This, together with differences in orientation, produces two scenarios where coverage without chloride is lower than with chloride. In the trimer scenarios the positioning of the chlorides was not obvious, while one might lie outside the monomer/surface projection, two of them cannot. As the atomic positions of these models were not relaxed these results serve to indicate what the surface coverage might be, if trimers were oriented as shown in Figure 3.
Comparison with Experiment
If the computational chloride models are excluded due to their exaggerated effect on the monomers, then the surface coverage for FL22 and FL22mod lies between 2.6–2.9 monomers/nm2 and there is no significant difference between the values for the two types of monomers. The experimental values for FL22 in water are 1.84 and 2.39 monomers/nm2 and for FL22mod in water, 1.52 monomers/nm2 (See Figure 8). Not only are these different to each other, they are also different to the theoretical results. This suggests that the polymers do not lie completely flat to the basal surfaces. For PVA the computational value lies between 5.1–7.6 monomers/nm2. This range is wide due to the small size of the monomer, hence slight differences in orientation have greater effects on total surface coverage, than in the cases of FL22 and FL22mod. The experimental value for the adsorption of PVA (in water) is 5.24 monomers/nm2 and is within 5% of the lower theoretical value, suggesting that PVA polymers lie flat to the basal surface, possibly without forming hydrogen bonds with the surface.
3.5. Calculated Formation Energies
In this study, “formation energy” is defined as the difference between the relaxed, full system and the sum of the energies comprising the parts of this relaxed model, e.g., for FL22 with chloride, the “parts” constitute separate models of the clay layer alone, and a monomer of FL22 plus chloride. Formation energies indicate the relative strength of the interactions between the monomers and the surfaces and hence describe one aspect of their relative adsorption (they have not been calculated for the trimers as the atomic positions of the trimers were not allowed to relax). The higher formation energies of the chloride models (see Table 5) indicates the strength of the Coulombic repulsion between periodic images of the chlorides in the chloride/monomer models, which is ameliorated by the presence of the clay in the clay/monomer/chloride models. The columns of Table 5 cannot be compared directly, i.e., the results for the chloride and no chloride models cannot be compared with each other, but the values within each of the columns can be compared. The trends within these two chloride and charge scenarios, however, are comparable. The formation energies of both orientations of FL22 for both surfaces in the chloride models and separately, the charge models, lie within 10% of each other, suggesting that the hydrogen bonding between FL22 and kaolinite surfaces, which is more prevalent in the o2 configurations, does not contribute significantly to the strength of the adsorption of the monomers, as the formation energy does not follow a consistent pattern aligned with the number of hydrogen bonds.
The formation energy of FL22mod is approximately 10% lower than FL22-o1 per comparable scenario, which is not significant, suggesting that the mode of interaction of these two types of monomer and the kaolinite basal surfaces is the same. In all cases the formation energy is lower on the siloxane surface than on the hydroxyl surface. The formation energies of PVA are, in three of the four scenarios, two orders of magnitude higher than those of FL22 and FL22mod. The more negative value of −11.37 kCal/mol for PVA-o2 on the hydroxyl surface, is due to the increased number of hydrogen bonds compared to the numbers in the remaining PVA configurations. Even so, this is still an order of magnitude higher than the formation energies for FL22 and FL22mod, although it does suggest that in the absence of other discernible interactions, hydrogen bonding plays a more significant role. These results say that, in terms of the strength of adsorption, FL22 and FL22mod are comparable and compared to PVA are strongly bound to the kaolinite surface.
3.6. Mulliken Charges
A comparison of the Mulliken charges of the monomers indicates the extent of interaction of the monomer with its environment. Mulliken population analysis is particularly suitable for analysing the results of computations performed using well-converged planewave basis sets, which are the basis set of choice in the CASTEP code [28]. Furthermore, Mulliken charge analysis is a very quick, post-processing step and, although the resulting charges are not valid as absolute charges for the determination of, for example, the quantitative magnitude of chemical bonds [45], they do yield qualitative information when making relative comparisons between like-systems [46].
Table 6 shows that the monomers of FL22-o1 and FL22mod in the chloride models have charges between 0.72 e and 0.76 e and in the models without chloride, this varies from 0.91 e to 0.98 e. Therefore, we can say that the FL22 and FL22mod are positively charged and are interacting with the surfaces electrostatically. The configurations of FL22-o2 contain more hydrogen bonds than those of FL22-o1, which is reflected in the lower charges of FL22-o2 except at the siloxane surface, no chloride models, where FL22-o1 has the lower charge. This is explained by the dissipation of charge occurring on formation of hydrogen bonds and perhaps the NH-group hydrogen bond dissipates more electron density than OH-group hydrogen bonds, although this difference is relatively small (approximately 5% of the total monomer charge).
The Mulliken charges of the PVA monomers are approximately 1% of those of the quaternary ammonium monomers, indicating that PVA and kaolinite do not interact electrostatically. These results mirror the initial charges of these monomers where FL22 and FL22mod are both positively charged and PVA is uncharged, hence there has been relatively little change in electron density in the monomers and kaolinite on their combination.
The relative charges of the trimers show the same trends as for the monomers, i.e., the charges of the FL22 and FL22mod trimers in the no chloride models are positive, ranging from 2.38 e to 2.98 e. It would be reasonable to expect trimer charges to be three times those of the monomers, and would probably be realized if the atomic positions of the trimers were allowed to relax. The differences in relative charges seen in the chloride trimer models are an indication of the difficulty of positioning the chloride ions, especially when their coordinates are constrained, therefore it is probable that the trimer chloride results are not as relevant as those of the no-chloride models. The PVA trimers at the hydroxyl surface have relatively negligible charge, as would be expected but those at the siloxane surface have gained a relatively considerable charge of 1 e for both orientations. Further investigation of the Mulliken charges of both surfaces of kaolinite show that in the siloxane surface models, the charges of the hydrogens of the hydroxyl surface are approximately half the values of the hydrogens of the hydroxyl surface in the hydroxyl surface models. It would be interesting to test whether this positive charge on PVA would decrease and dissipate to the hydrogens on the hydroxyl surface if all atomic positions were allowed to relax, although in this study this is constrained by the nature of the models.
These results show that, with the exception of PVA trimers at the siloxane surface, the trimer models show the same charge trends as the monomer models, and therefore we can state that the interactions of the polymers with the basal surfaces of kaolinite are primarily electrostatic.
4. Conclusions
Natural aggregates continue to be critical to cement production, though high purity sources are increasingly hard to find. In order to prevent clay minerals associated with the aggregates adversely affecting the cement formulation through adsorption of plasticizers with resultant modification of properties, low cost polymers are used to “inert” the aggregate to the cement formulation.
In this study relevant polymer technologies were contacted with a low defect kaolinite clay mineral to understand the effect of polymer functional groups, specifically the presence of alcohol groups in quarternary ammonium polymers, on the adsorption and interactions of the polymer with the clay mineral. Density functional theory simulations were used to further probe surface coverage, functional group—clay mineral interactions and charge distributions. In general, good agreement was found between the simplistic simulations and the experiments, adding insights into the binding modes of the polymers, and the role of the alcohol group in particular. The FL22mod polymer without alcohol groups showed less pH sensitivity in its adsorption isotherm compared to the original FL22 polymer while showing comparable interactions with the kaolinite, aiding refinement of the design of cement aggregate inerting polymer technologies.
The study has wider implications, with clay mineral—cationic polymer interactions being important in the oil and gas drilling industry to stabilise clay minerals in shale formations, within clay-polymer composite materials, and within fracturing fluids, as well as within cement formulations. The simulations run further providing data and parameters useful for ongoing large-scale molecular dynamics simulations.
Supplementary Materials
The following are available online at https://www.mdpi.com/2075-163X/8/4/130/s1, Table S1: Electronic structure of the norm-conserving pseudopotentials (GGA-PBE where available).
Acknowledgments
This work made use of the facilities of HECToR, the UK’s national high-performance computing service, which is provided by UoE HPCx Ltd. at the University of Edinburgh, Cray Inc. and NAG Ltd. and funded by the Office of Science and Technology through EPSRC’s High End Computing Programme. Thanks to the Lafarge Group for providing financial support for this research project, and also to the EPSRC and Durham University’s Knowledge Transfer Scheme for funding the work of Dawn L. Geatches, H. Christopher Greenwell thanks the Royal Society for an Industry Fellowship.
Author Contributions
All the authors contributed to the design of the experiments and simulations; Alain Jacquet performed the experiments; Dawn L. Geatches performed the computer simulations. Alain Jacquet and Dawn L. Geatches analysed the data; H. Christopher Greenwell contributed reagents/materials/analysis tools; all the authors contributed in the writing of the paper.
Conflicts of Interest
Alain Jacquet was an employee of Lafarge Group during the period this study was undertaken. The other authors declare no conflict of interest.
References
- Nehdi, M.L. Clay in cement-based materials: Critical overview of state-of-the-art. Constr. Build. Mater. 2014, 51, 372–382. [Google Scholar] [CrossRef]
- Anderson, R.L.; Ratcliffe, I.; Greenwell, H.C.; Williams, P.A.; Cliffe, S.; Coveney, P.V. Controlling Clay Swelling—A Challenge in Oilfield Geochemistry. Earth Sci. Rev. 2010, 8, 201–216. [Google Scholar] [CrossRef]
- Chen, B.; Evans, J.R.G.; Greenwell, H.C.; Boulet, P.; Coveney, P.V.; Bowden, A.A.; Whiting, A. A critical appraisal of polymer-clay nanocomposites. Chem. Soc. Rev. 2008, 37, 568–594. [Google Scholar] [CrossRef] [PubMed]
- Bailey, L.; Keall, M.; Audibert, A.; Lecourtier, J. Effect of Clay/Polymer Interactions on Shale Stabilization during Drilling. Langmuir 1994, 10, 1544–1549. [Google Scholar] [CrossRef]
- Chen, Y.; Liu, S.; Wang, G. A kinetic investigation of cationic starch adsorption and flocculation in kaolin suspension. Chem. Eng. J. 2007, 133, 325–333. [Google Scholar] [CrossRef]
- Villada, Y.; Gallardo, F.; Erdmann, E.; Casis, N.; Olivares, L.; Estenoz, D. Functional characterization on colloidal suspensions containing xanthan gum (XGD) and polyanionic cellulose (PAC) used in drilling fluids for a shale formation. Appl. Clay Sci. 2017, 149, 59–66. [Google Scholar] [CrossRef]
- Bowden, A.A.; Boulet, B.; Greenwell, H.C.; Chen, B.; Evans, J.R.G.; Coveney, P.V.; Whiting, A. Intercalation and in situ polymerization of poly(alkylene oxide) derivatives within M+-montmorillonite (M = Li, Na, K). J. Mater. Chem. 2006, 16, 1082–1094. [Google Scholar]
- Leech, A.R. Molecular Modeling: Principles and Applications, 2nd ed.; Addison Wesley Longman Limited: Essex, UK, 1996. [Google Scholar]
- Anderson, R.L.; Suter, J.L.; Greenwell, H.C.; Coveney, P.V. Recent Advances in Large-Scale Atomistic and Coarse-Grained Molecular Dynamics Simulation of Clay Minerals. J. Mater. Chem. 2009, 19, 2482–2493. [Google Scholar]
- Heinz, H.; Lin, T.-J.; Mishra, R.K.; Emami, F.S. Thermodynamically Consistent Force Fields for the Assembly of Inorganic, Organic, and Biological Nanostructures: The INTERFACE Force Field. Langmuir 2013, 29, 1754–1765. [Google Scholar] [CrossRef] [PubMed]
- Cygan, R.T.; Liang, J.-J.; Kalinichev, A.G. Molecular Models of Hydroxide, Oxyhydroxide, and Clay Phases and the Development of a General Force Field. J. Phys. Chem. B 2004, 108, 1255–1266. [Google Scholar] [CrossRef]
- Geatches, D.L.; Jacquet, A.; Clark, S.J.; Greenwell, H.C. Monomer Adsorption on Kaolinite: Modeling the Essential Ingredients. J. Phys. Chem. C 2012, 116, 22365–22374. [Google Scholar] [CrossRef]
- Suter, J.L.; Coveney, P.V.; Anderson, R.L.; Greenwell, H.C.; Cliffe, S. Rule based design of clay-swelling inhibitors. Energy Environ. Sci. 2011, 4, 4572–4586. [Google Scholar] [CrossRef]
- Suter, J.L.; Groen, D.; Coveney, P.V. Chemically Specific Multiscale Modeling of Clay-Polymer Nanocomposites Reveals Intercalation Dynamics, Tactoid Self-Assembly and Emergent Materials Properties. Adv. Mater. 2015, 27, 966–984. [Google Scholar] [CrossRef] [PubMed]
- Greathouse, J.A.; Geatches, D.L.; Pike, D.Q.; Greenwell, H.C.; Johnston, C.T.; Wilcox, J.; Cygan, R.T. Methylene Blue Adsorption on the Basal Surfaces of Kaolinite: Structure and Thermodynamics from Quantum and Classical Molecular Simulation. Clays Clay Miner. 2015, 63, 185–198. [Google Scholar] [CrossRef]
- Benco, L.; Tunega, D.; Hafner, J.; Lischka, H. Orientation of OH groups in kaolinite and dickite: Ab initio molecular dynamics study. Am. Miner. 2001, 86, 1057–1065. [Google Scholar] [CrossRef]
- Sato, H.; Ono, K.; Johnston, C.T.; Yamagishi, A. First-prinicples studies on the elastic constants of a 1:1 layered kaolinite mineral. Am. Miner. 2005, 90, 1824–1826. [Google Scholar] [CrossRef]
- Tian, S.; Erastova, V.; Lu, S.; Greenwell, H.C.; Underwood, T.R.; Xue, H.; Zeng, F.; Chen, G.; Wu, C.; Zhao, R. Understanding Model Crude Oil Component Interactions on Kaolinite Silicate and Aluminol Surfaces: Toward Improved Understanding of Shale Oil Recovery. Energy Fuels 2018. [Google Scholar] [CrossRef]
- Greathouse, J.A.; Cygan, R.T.; Fredrich, J.T.; Jerauld, G.R. Adsorption of Aqueous Crude Oil Components on the Basal Surfaces of Clay Minerals: Molecular Simulations Including Salinity and Temperature Effects. J. Phys. Chem. C 2017, 121, 22773–22786. [Google Scholar] [CrossRef]
- Underwood, T.R.; Erastova, V.; Greenwell, H.C. Wetting Effects and Molecular Adsorption at Hydrated Kaolinite Clay Mineral Surfaces. J. Phys. Chem. C 2016, 120, 11433–11449. [Google Scholar] [CrossRef]
- Pruett, R.J.; Webb, H.L. Sampling and analysis of KGa-1B well-crystallized kaolin source clay. Clays Clay Miner. 1993, 41, 514–519. [Google Scholar] [CrossRef]
- Schroth, B.K.; Sposito, G. Surface charge properties of kaolinite. Clays Clay Miner. 1997, 45, 85–91. [Google Scholar] [CrossRef]
- Ward, D.B.; Brady, P.V. Effect of Al and organic acids on the surface chemistry of kaolinite. Clays Clay Miner. 1998, 46, 453–465. [Google Scholar] [CrossRef]
- Jackson, M.L. Soil Chemical Analysis, 3rd ed.; Prentice Hall Inc.: Upper Saddle River, NJ, USA, 1964. [Google Scholar]
- Sabah, E. Adsorption mechanism of cationic surfactants onto acid- and heat-activated sepiolites. Water Res. 2002, 36, 3957–3964. [Google Scholar] [CrossRef]
- Power, G.W. The Volumetric Determination of Organic Sulfates or Sulfonates by the Double Indicator Method. In Communication C-225; Amoco Production Co.: Tulsa, OK, USA, 1970. [Google Scholar]
- Reid, W.W.; Longman, G.F.; Heinert, E. Determination of anionic-active detergents by two-phase titration. Tenside 1967, 4, 292–304. [Google Scholar]
- Clark, S.J.; Segall, M.D.; Pickard, C.J.; Hasnip, P.J.; Probert, M.J.; Refson, K.; Payne, M.C. Castep v5.0. Z. Kristallogr. 2005, 220, 567–570. [Google Scholar]
- Kohn, W.; Sham, L.J. Self-consistent equations including exchange and correlation effects. Phys. Rev. 1965, 140, A1133–A1138. [Google Scholar] [CrossRef]
- Hohenberg, P.; Kohn, W. Inhomogeneous Electron Gas. Phys. Rev. 1964, 136, B846. [Google Scholar] [CrossRef]
- Payne, M.C.; Teter, M.P.; Allan, D.C.; Arias, T.A.; Joannopoulos, J.D. Iterative minimization techniques for ab initio total-energy calculations: Molecular dynamics and conjugate gradients. Rev. Mod. Phys. 1992, 64, 1045–1097. [Google Scholar] [CrossRef]
- Perdew, J.P.; Burke, K.; Ernzerhof, M. Generalized gradient approximation made simple. Phys. Rev. Lett. 1996, 77, 3865–3868. [Google Scholar] [CrossRef] [PubMed]
- Pfrommer, B.G.; Côté, M.; Louie, S.G.; Cohen, M.L. Relaxation of crystals with the Quasi-Newton Method. J. Comput. Phys. 1997, 131, 233–240. [Google Scholar] [CrossRef]
- Mazari, N.; Vanderbilt, D.; Payne, M.C. Ensemble density functional theory for ab initio molecular dynamics of metals and finite-temperature insulators. Phys. Rev. Lett. 1997, 79, 1337–1340. [Google Scholar] [CrossRef]
- Dassault Systèmes BIOVIA. Materials Studio, V 5.0; Dassault Systèmes: San Diego, CA, USA, 2011. [Google Scholar]
- Neder, R.B.; Burghammer, M.; Grasl, T.; Schulz, H.; Bram, A.; Fiedler, S. Refinement of the kaolinite structure from single-crystal synchrotron data. Clays Clay Miner. 1999, 47, 487–494. [Google Scholar] [CrossRef]
- Ceperley, D.M.; Alder, B.J. Ground state of the electron gas by a stochastic method. Phys. Rev. Lett. 1980, 45, 566–569. [Google Scholar] [CrossRef]
- Mulliken, R.S. Electronic population analysis on LCAO-MO molecular wave functions 1. J. Chem. Phys. 1955, 23, 1833–1840. [Google Scholar] [CrossRef]
- Mulliken, R.S. Electronic population analysis on LCAO-MO molecular wave functions. IV. Bonding and antibonding in LCAO and valence-bond theories. J. Chem. Phys. 1955, 23, 2343–2346. [Google Scholar] [CrossRef]
- Segall, M.D.; Pickard, C.J.; Shah, R.; Payne, M.C. Population analysis in plane wave electronic structure calculations. Mol. Phys. 1996, 89, 571–577. [Google Scholar] [CrossRef]
- Sanchez-Portal, D.; Artacho, E.; Soler, J.M. Projection of plane-wave calculations into atomic orbitals. Sol. State Commun. 1995, 95, 685–690. [Google Scholar] [CrossRef]
- Brady, P.V.; Cygan, R.T.; Nagy, K.L. Molecular Controls on Kaolinite Surface Charge. J. Colloid Interface Sci. 1996, 183, 356–364. [Google Scholar] [CrossRef] [PubMed]
- Gupta, V.; Miller, J.D. Surface Force Measurements at the Basal Planes of Ordered Kaolinite Particles. J. Colloid Interface Sci. 2010, 344, 362–371. [Google Scholar] [CrossRef] [PubMed]
- Blachier, C.; Michot, L.; Bihannic, I.; Barrès, O.; Jacquet, A.; Mosquet, M. Adsorption of polyamine on clay minerals. J. Coll. Inter. Sci. 2009, 336, 599–606. [Google Scholar] [CrossRef] [PubMed]
- Guerra, C.F.; Handgraaf, J.-W.; Baerends, E.J.; Bickelhaupt, F.M. Voronoi deformation density (VDD) charges: Assessment of the Mulliken, Bader, Hirshfeld, Weinhold, and (VDD) methods for charge analysis. J. Comput. Chem. 2004, 25, 189–210. [Google Scholar] [CrossRef] [PubMed]
- Segall, M.D.; Shah, R.; Pickard, C.J.; Payne, M.C. Population analysis in plane wave electronic structure calculations of bulk materials. Phys. Rev. B 1996, 54, 16317–16320. [Google Scholar] [CrossRef]
Figure 1.
Orientation 1—Initial configurations of the monomer/surface models where the OH-group of the monomer points away from the surface. Colour scheme (used for all figures): white—hydrogen; red—oxygen; pink—aluminium; yellow—silicon; grey—carbon; blue—nitrogen; purple—chloride.
Figure 1.
Orientation 1—Initial configurations of the monomer/surface models where the OH-group of the monomer points away from the surface. Colour scheme (used for all figures): white—hydrogen; red—oxygen; pink—aluminium; yellow—silicon; grey—carbon; blue—nitrogen; purple—chloride.

Figure 2.
Orientation 2—Initial configurations of the monomer/surface models where the OH-group of the monomer points towards the surface.
Figure 2.
Orientation 2—Initial configurations of the monomer/surface models where the OH-group of the monomer points towards the surface.

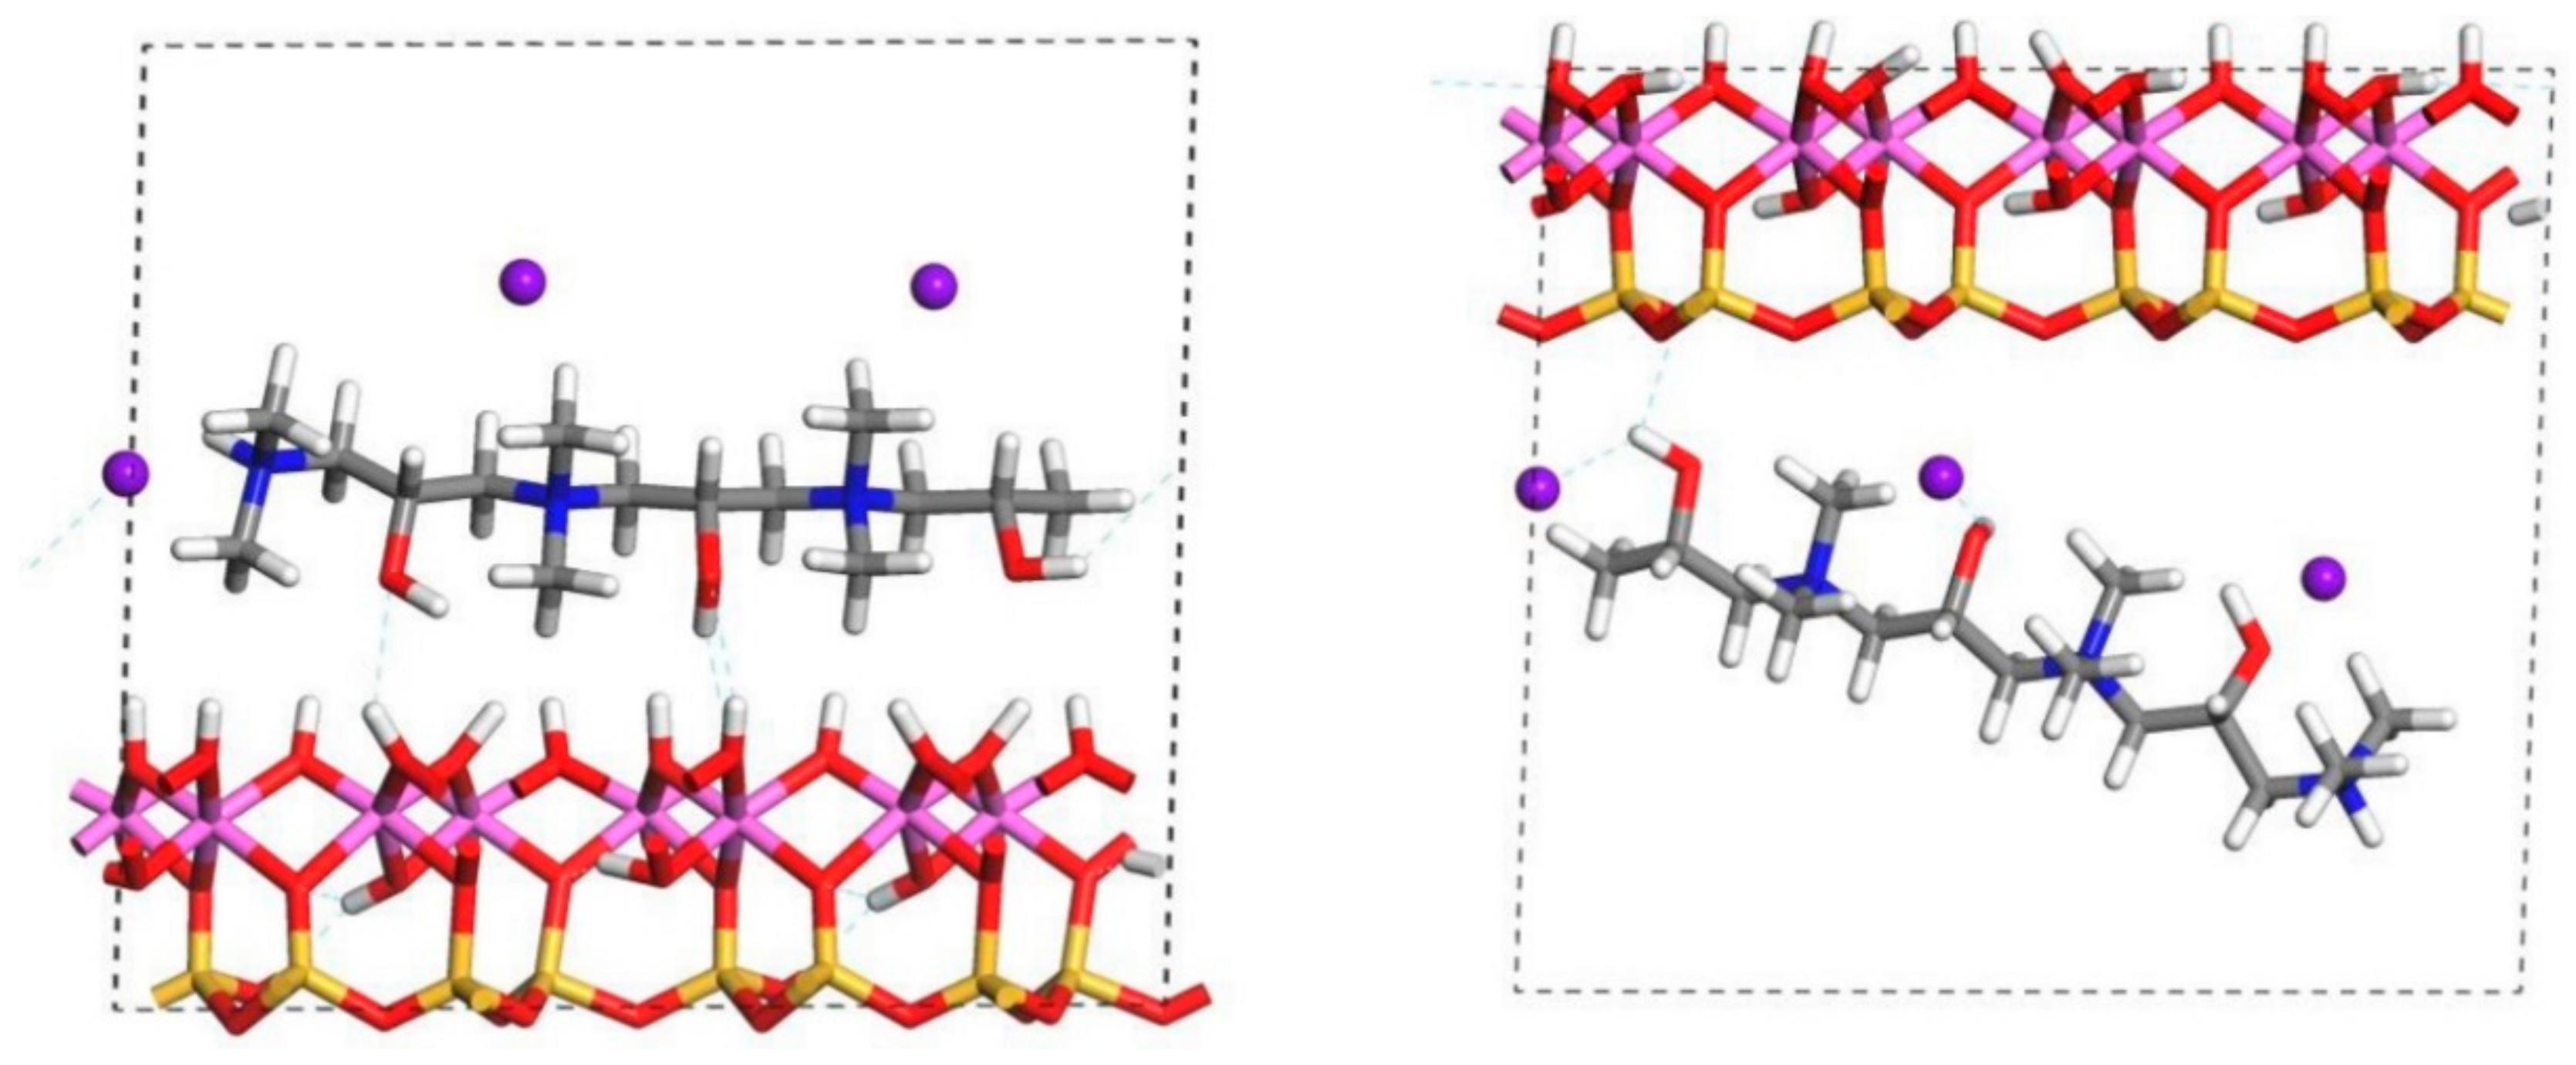
Figure 3.
Examples of a trimer of FL22 in Orientation 2—i.e., where the OH-groups point toward the surface (o2) and are either parallel (p) as in the left image, or diagonal (d) to the surface, as in the right image.
Figure 3.
Examples of a trimer of FL22 in Orientation 2—i.e., where the OH-groups point toward the surface (o2) and are either parallel (p) as in the left image, or diagonal (d) to the surface, as in the right image.

Figure 4.
Zeta potential measurements of the kaolinite clay mineral used in this study, in NaCl (0.001 M) as a function of pH.
Figure 4.
Zeta potential measurements of the kaolinite clay mineral used in this study, in NaCl (0.001 M) as a function of pH.

Figure 5.
Adsorption isotherms for the polymers, FL22, FL22mod and PVA on kaolinite. The left hand column shows adsorption by mass, while the right hand shows adsorption as a function of surface area. For the ammonium based polymers the effect of pH is also tested with natural and high pH conditions shown.

Figure 6.
Variation of cationic charge on FL22 polymer as a function of the pH.

Figure 7.
Observed pH as a function of FL22 (upper) and FL22mod (lower) polymer adsorption.
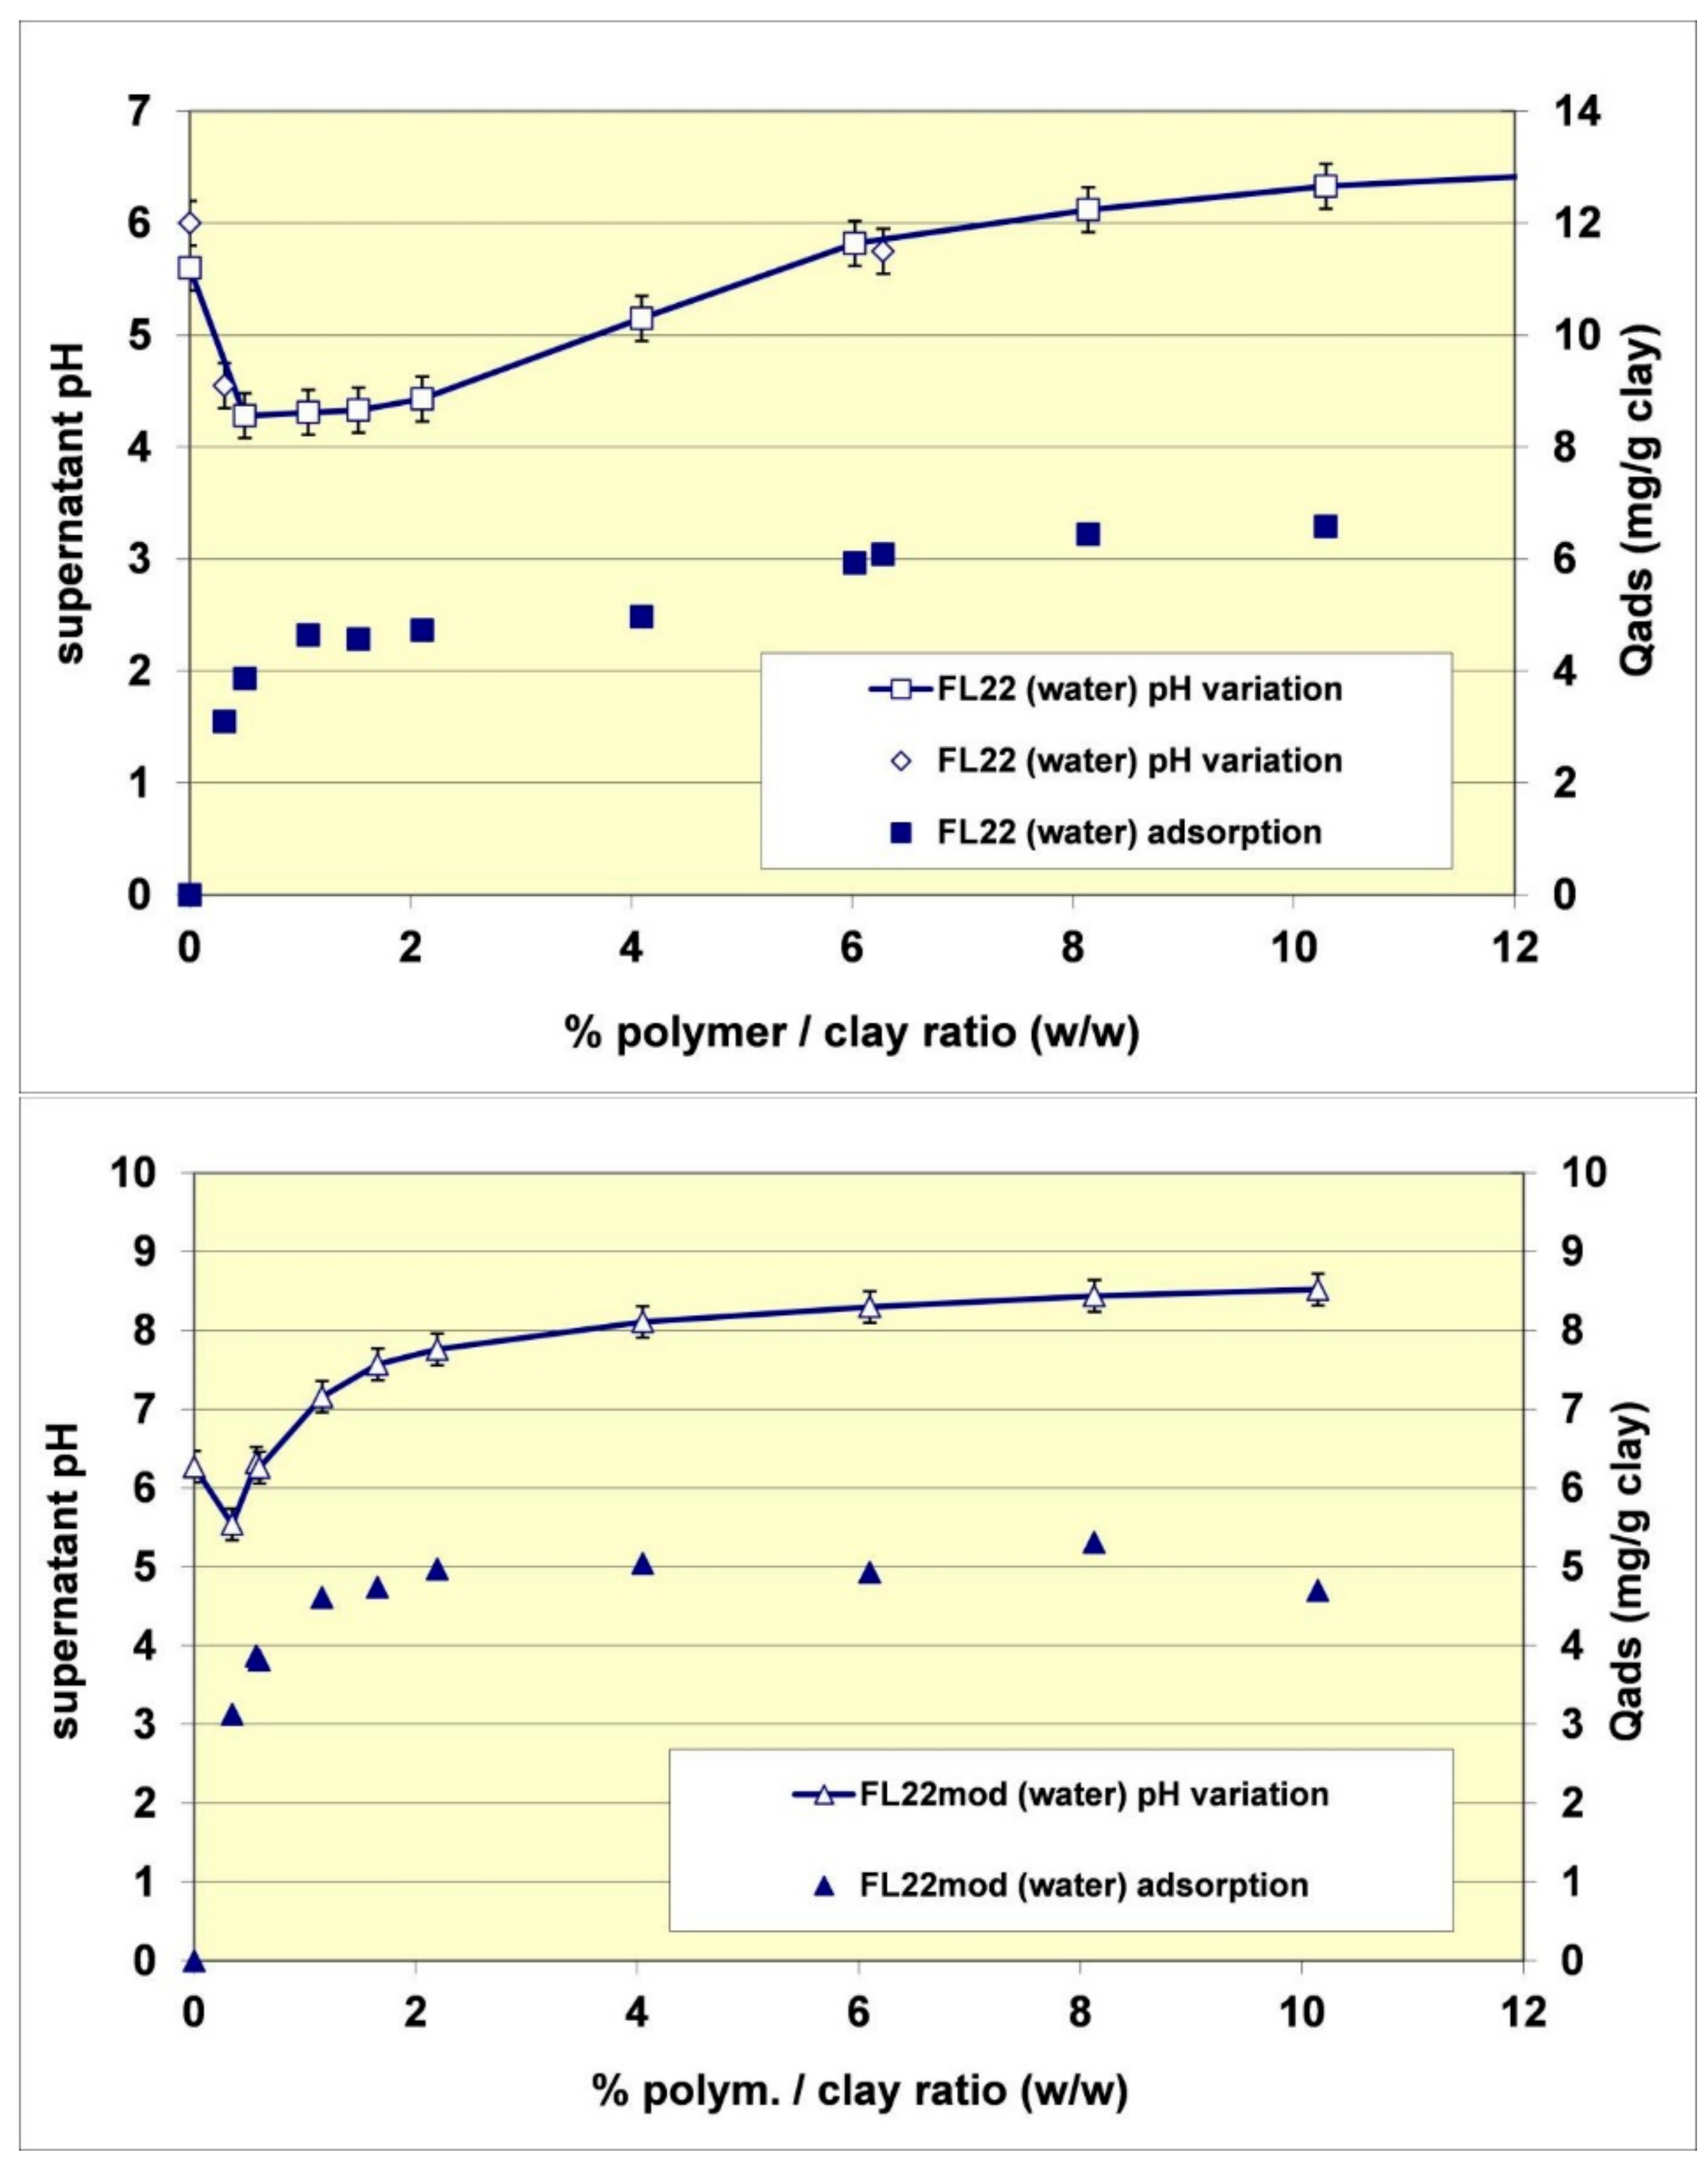
Figure 8.
Surface coverage of the polymers tested on kaolinite as a function of equilibrium concentration of polymer in solution.
Figure 8.
Surface coverage of the polymers tested on kaolinite as a function of equilibrium concentration of polymer in solution.
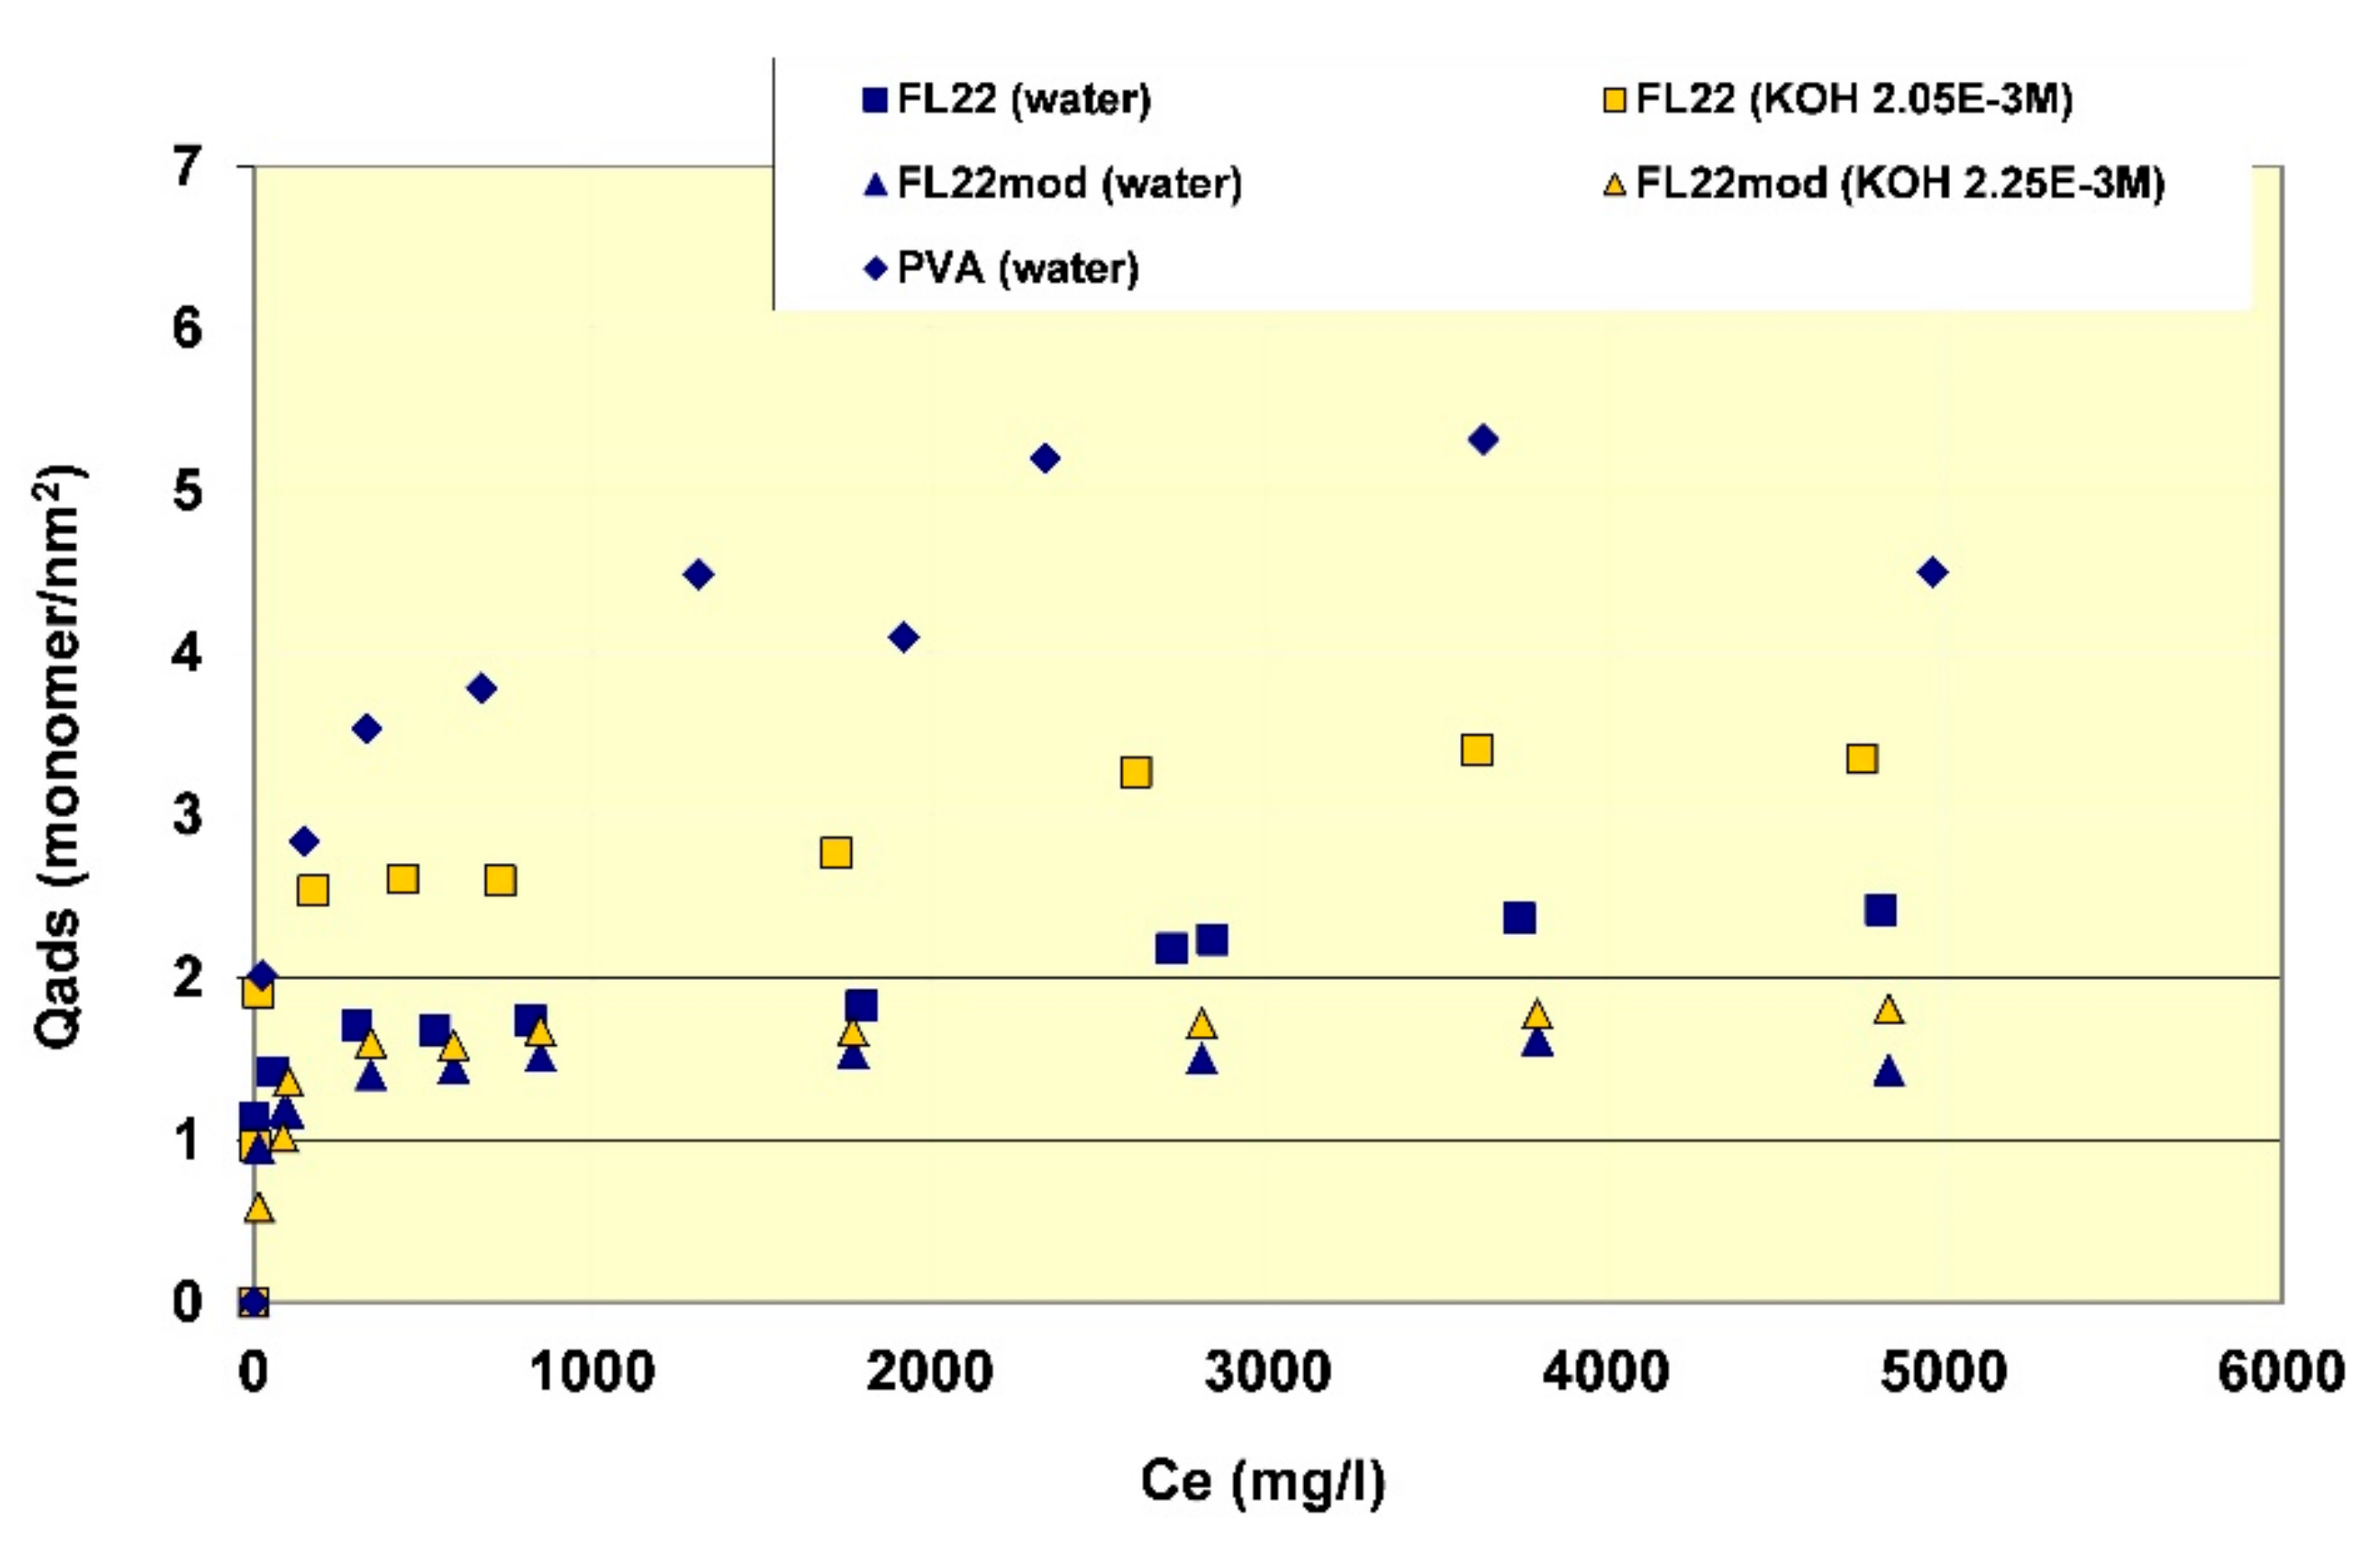
Figure 9.
Orientation 1 (o1)—configurations after relaxation of the simulated monomer unit and kaolinite surface in the chloride models.
Figure 9.
Orientation 1 (o1)—configurations after relaxation of the simulated monomer unit and kaolinite surface in the chloride models.

Figure 10.
Orientation 2 (o2)—configurations after relaxation of the simulated monomer unit and kaolinite surface in the chloride and charge only models.
Figure 10.
Orientation 2 (o2)—configurations after relaxation of the simulated monomer unit and kaolinite surface in the chloride and charge only models.


Table 1.
Polymer description: cationic charge, ideal formulae, and the carbon, chloride/bromide content are % by weight.
Table 1.
Polymer description: cationic charge, ideal formulae, and the carbon, chloride/bromide content are % by weight.
| Polymer | Formulae | Charge (meq) | Carbon Content (%) | Anion Content (%) |
|---|---|---|---|---|
| FL22 | (Me2N+Cl−CH2CHOHCH2)n | 7.27 | 43.6 | 25.8 |
| FL22mod | (Me2N+Br−CH2CH2CH2)n | 6.02 | 36.2 | 48.1 |
| PVA | (CH2CHOH)n | 0 | 54.8 | 0 |
Table 2.
Measured polymer carbon content.
| Polymer | Carbon Content (% by Weight) |
|---|---|
| FL22 | 42.3 |
| FL22mod | 36.9 |
| PVA | 57.2 |
Table 3.
Description of the changes observed on increasing the polymer/clay ratio during flocculation experiments. Fines = fine particles in supernatant observed.
Table 3.
Description of the changes observed on increasing the polymer/clay ratio during flocculation experiments. Fines = fine particles in supernatant observed.
| Experimental Conditions | Stability | pH | Observations on Increased Polymer/Clay Ratio |
|---|---|---|---|
| FL22 in water | Flocculates, no fines in supernatant | 6.0 | Deflocculates with fines; flocculates, fines clear; deflocculates with fines. |
| FL22 in KOH (2.05 × 10⁻³ mol/L) | Deflocculates | 10.3 | Flocculates with fines; deflocculates with fines, then without fines, and finally with fines. |
| FL22mod in water | Flocculates, no fines in supernatant | 6.3 | Flocculates, no fines in supernatant |
| FL22mod in KOH (2.25 × 10⁻³ mol/L) | Deflocculates | 10.2 | Flocculation increases, supernatant with fines then clears. |
| PVA in water | Flocculates, no fines in supernatant | 6.3 | Always flocculates, no fines in supernatant. |
Table 4.
Two examples of surface coverage for two of the trimers lying parallel (p) and diagonal (d) to the surfaces (Figure 3), and surface coverage of kaolinite basal surfaces for the relaxed configurations of the orientations 1 (o1) and 2 (o2) of FL22, FL22mod and PVA, (Figure 9 and Figure 10). Units in monomers/nm2.
| Hydroxyl Surface | Silicate Surface | |||
|---|---|---|---|---|
| Monomer | Chloride | No Chloride | Chloride | No Chloride |
| FL22-o1 | 2.5 | 2.9 | 2.7 | 2.9 |
| FL22-o2 | 2.2 | 2.7 | 3.4 | 2.6 |
| FL22mod | 2.5 | 2.9 | 3.4 | 2.9 |
| PVA-o1 | N/A | 5.8 | N/A | 5.1 |
| PVA-o2 | N/A | 7.6 | N/A | 5.8 |
| FL22 trimer-o2p | 3.0 | 3.9 | N/A | N/A |
| FL22 trimer-o2d | N/A | N/A | 3.3 | 3.8 |
Table 5.
Formation energies of the models, where ‘formation energy’ is as described in the main text. Units are kCal/mol. o1: Orientation 1 (OH-group pointing away from surface) and o2: orientation 2 (OH-group pointing towards surface).
Table 5.
Formation energies of the models, where ‘formation energy’ is as described in the main text. Units are kCal/mol. o1: Orientation 1 (OH-group pointing away from surface) and o2: orientation 2 (OH-group pointing towards surface).
| Hydroxyl Surface | Silicate Surface | |||
|---|---|---|---|---|
| Monomer | Chloride | No Chloride | Chloride | No Chloride |
| FL22-o1 | −23.41 | −105.59 | −26.94 | −130.35 |
| FL22-o2 | −25.92 | −113.44 | −25.46 | −122.50 |
| FL22mod | −21.10 | −104.50 | −22.00 | −123.20 |
| PVA-o1 | N/A | −1.66 | N/A | −1.93 |
| PVA-o2 | N/A | −11.37 | N/A | −1.90 |
Table 6.
Mulliken charges (e) of the monomers post relaxation in orientations 1 (o1) and 2 (o2) and the trimer configurations lying either parallel (p) or diagonal (d) to the surface.
Table 6.
Mulliken charges (e) of the monomers post relaxation in orientations 1 (o1) and 2 (o2) and the trimer configurations lying either parallel (p) or diagonal (d) to the surface.
| Hydroxyl Surface | Silicate Surface | |||
|---|---|---|---|---|
| Monomer | Chloride | No Chloride | Chloride | No Chloride |
| FL22-o1 | 0.76 | 0.95 | 0.75 | 0.91 |
| FL22-o2 | 0.65 | 0.82 | 0.70 | 0.95 |
| FL22mod | 0.74 | 0.98 | 0.72 | 0.97 |
| PVA-o1 | N/A | 0.01 | N/A | −0.03 |
| PVA-o2 | N/A | 0.01 | N/A | −0.04 |
| FL22 trimer-o1p | 1.53 | 2.42 | 1.68 | 2.39 |
| FL22 trimer-o1d | N/A | N/A | 2.32 | 2.98 |
| FL22 trimer–o2p | 1.81 | 2.38 | N/A | N/A |
| FL22 trimer–o2d | N/A | N/A | 2.62 | 2.89 |
| FL22mod-trimer-p | 1.96 | 2.41 | 2.07 | 2.75 |
| FL22mod-trimer-d | 2.38 | 2.75 | 2.03 | 2.55 |
| PVA-trimer-o1-p | N/A | −0.12 | N/A | 1.03 |
| PVA-trimer-o1-d | N/A | −0.13 | N/A | 1.00 |
© 2018 by the authors. Licensee MDPI, Basel, Switzerland. This article is an open access article distributed under the terms and conditions of the Creative Commons Attribution (CC BY) license (http://creativecommons.org/licenses/by/4.0/).
Share and Cite
MDPI and ACS Style
Jacquet, A.; Geatches, D.L.; Clark, S.J.; Greenwell, H.C. Understanding Cationic Polymer Adsorption on Mineral Surfaces: Kaolinite in Cement Aggregates. Minerals 2018, 8, 130. https://doi.org/10.3390/min8040130
AMA Style
Jacquet A, Geatches DL, Clark SJ, Greenwell HC. Understanding Cationic Polymer Adsorption on Mineral Surfaces: Kaolinite in Cement Aggregates. Minerals. 2018; 8(4):130. https://doi.org/10.3390/min8040130
Chicago/Turabian StyleJacquet, Alain, Dawn L. Geatches, Stewart J. Clark, and H. Christopher Greenwell. 2018. "Understanding Cationic Polymer Adsorption on Mineral Surfaces: Kaolinite in Cement Aggregates" Minerals 8, no. 4: 130. https://doi.org/10.3390/min8040130
Note that from the first issue of 2016, this journal uses article numbers instead of page numbers. See further details here.