Surface Chemical Characterisation of Pyrite Exposed to Acidithiobacillus ferrooxidans and Associated Extracellular Polymeric Substances

 ,
,
Abstract
:
1. Introduction
2. Materials and Methods
2.1. Culturing Microorganisms
2.2. Pyrite Tile Preparation and Exposure to A. ferrooxidans
2.3. Scanning Electron Microscopy (SEM)
2.4. Captive Bubble Contact Angle
2.5. Photoemission Electron Microscopy (PEEM)
2.6. Time of Flight-Secondary Ion Mass Spectrometry (ToF-SIMS)
3. Results
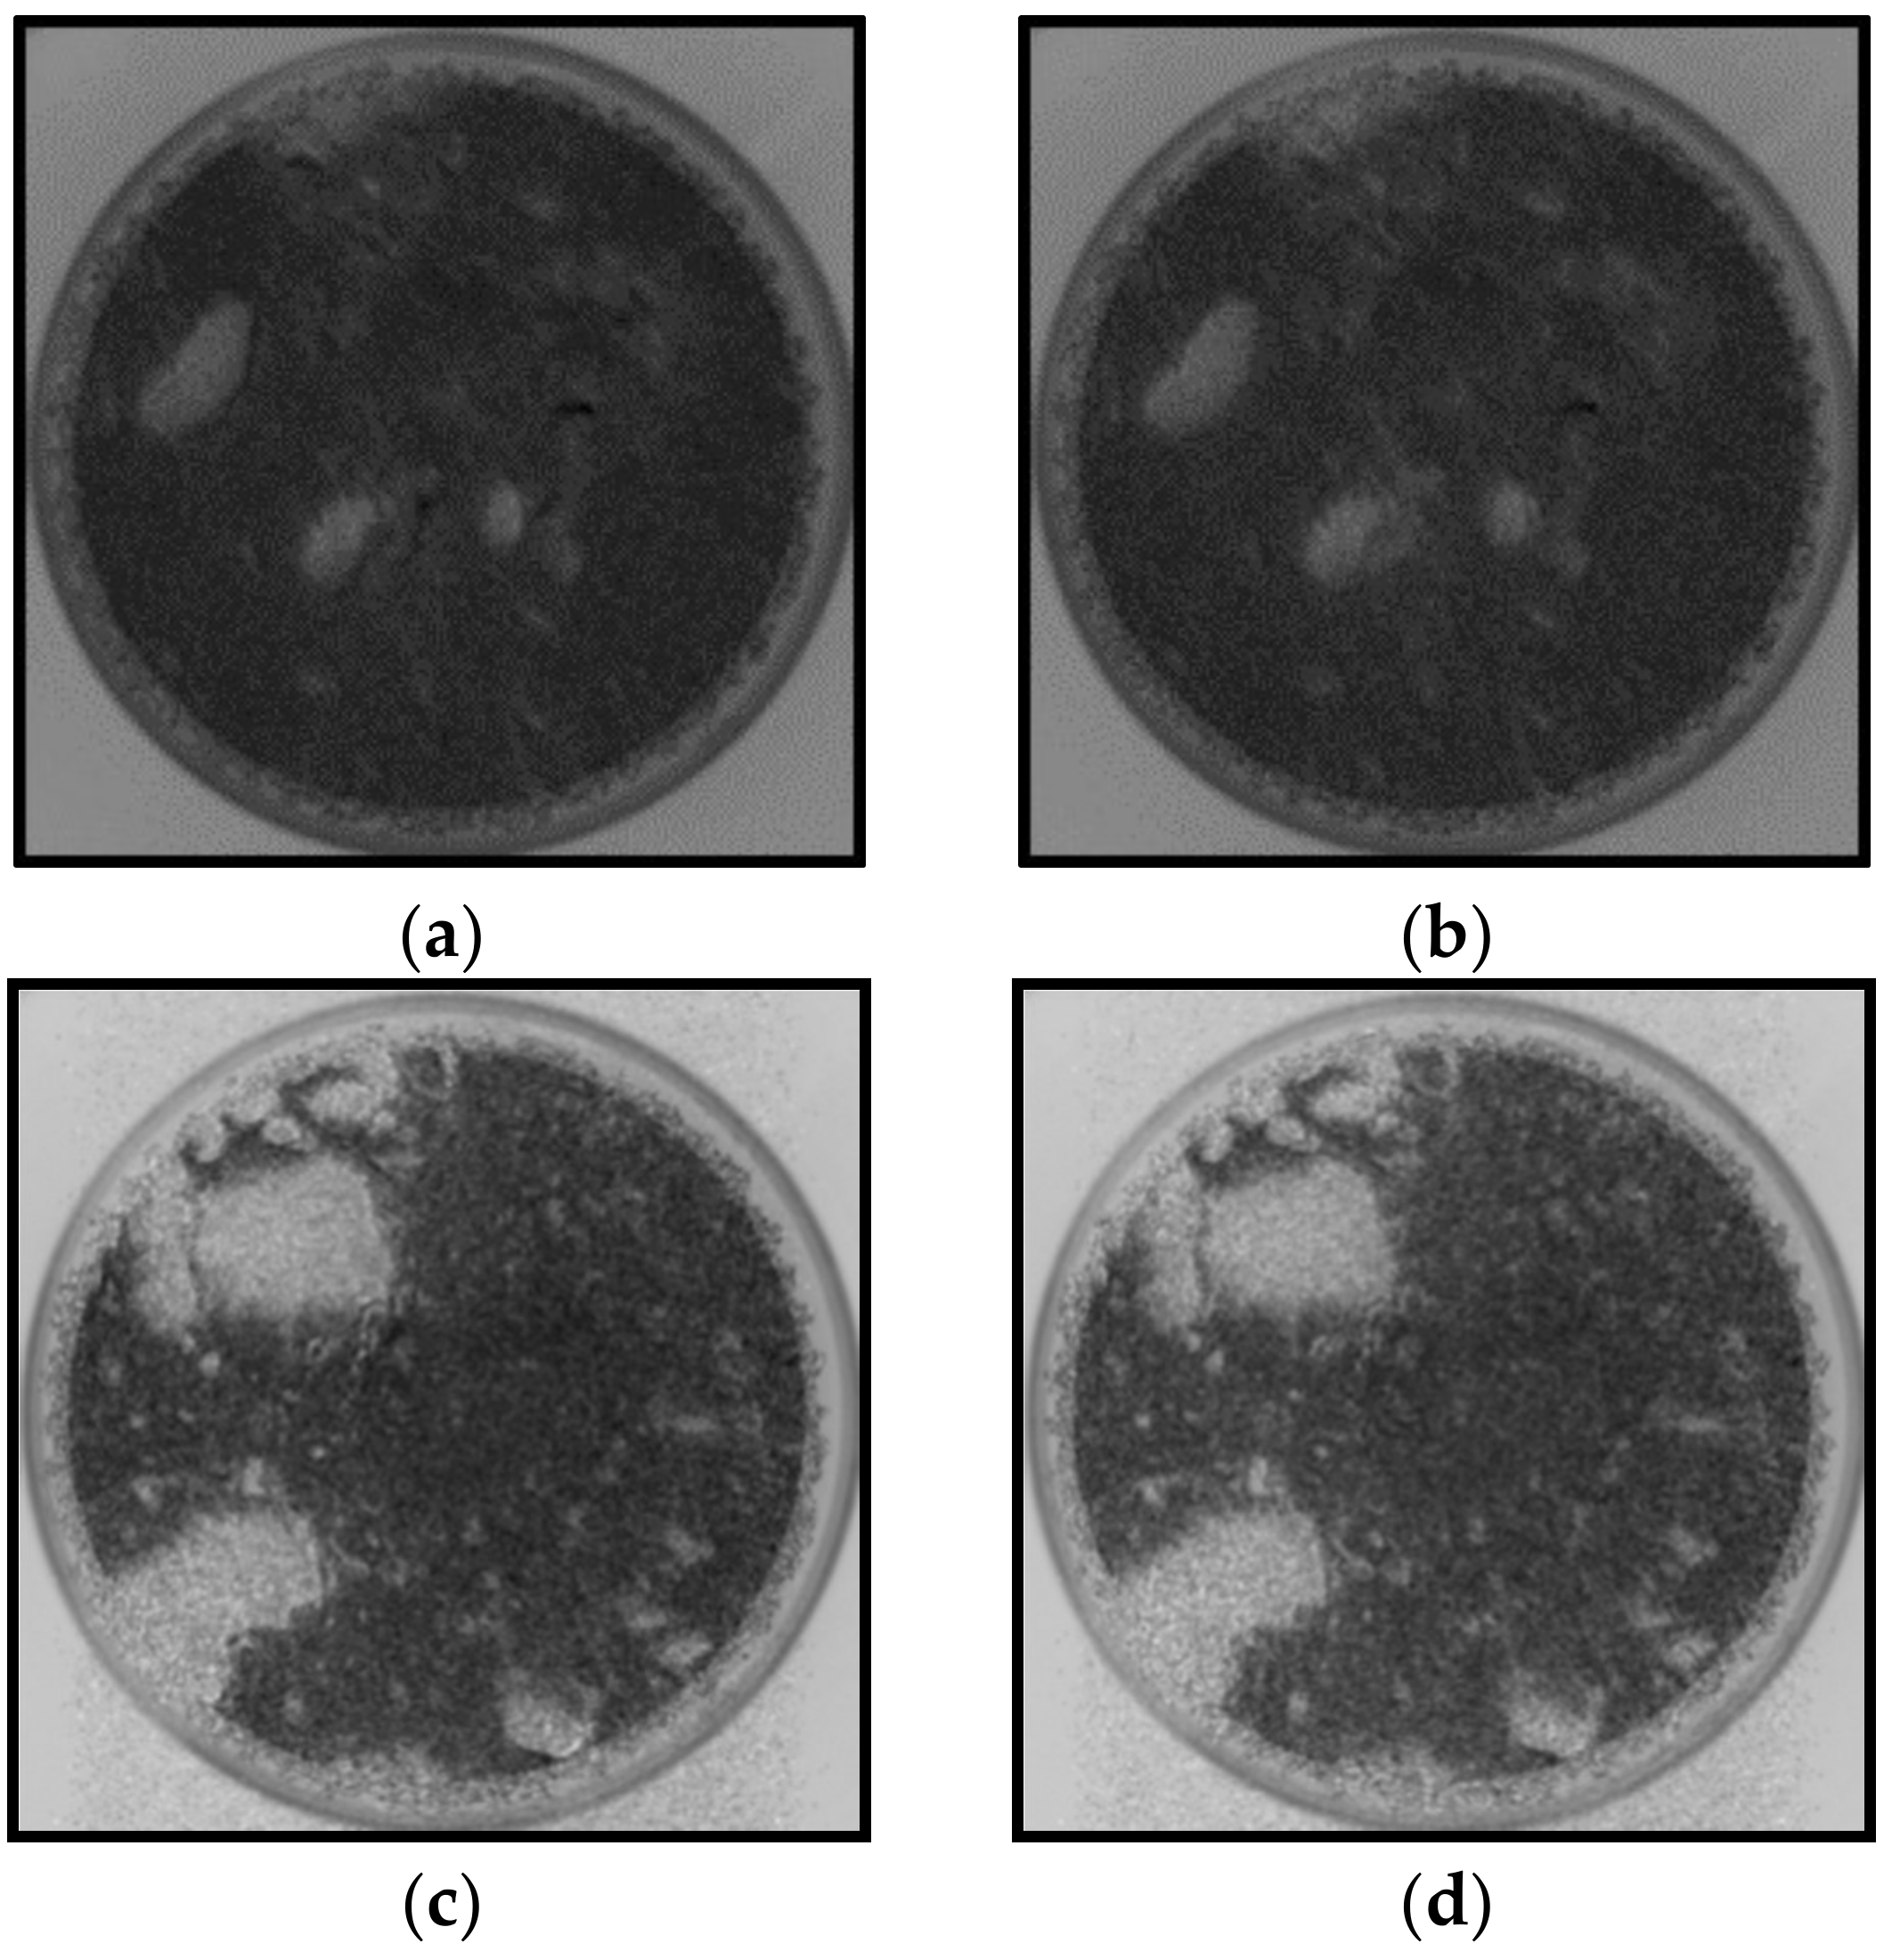
3.1. SEM
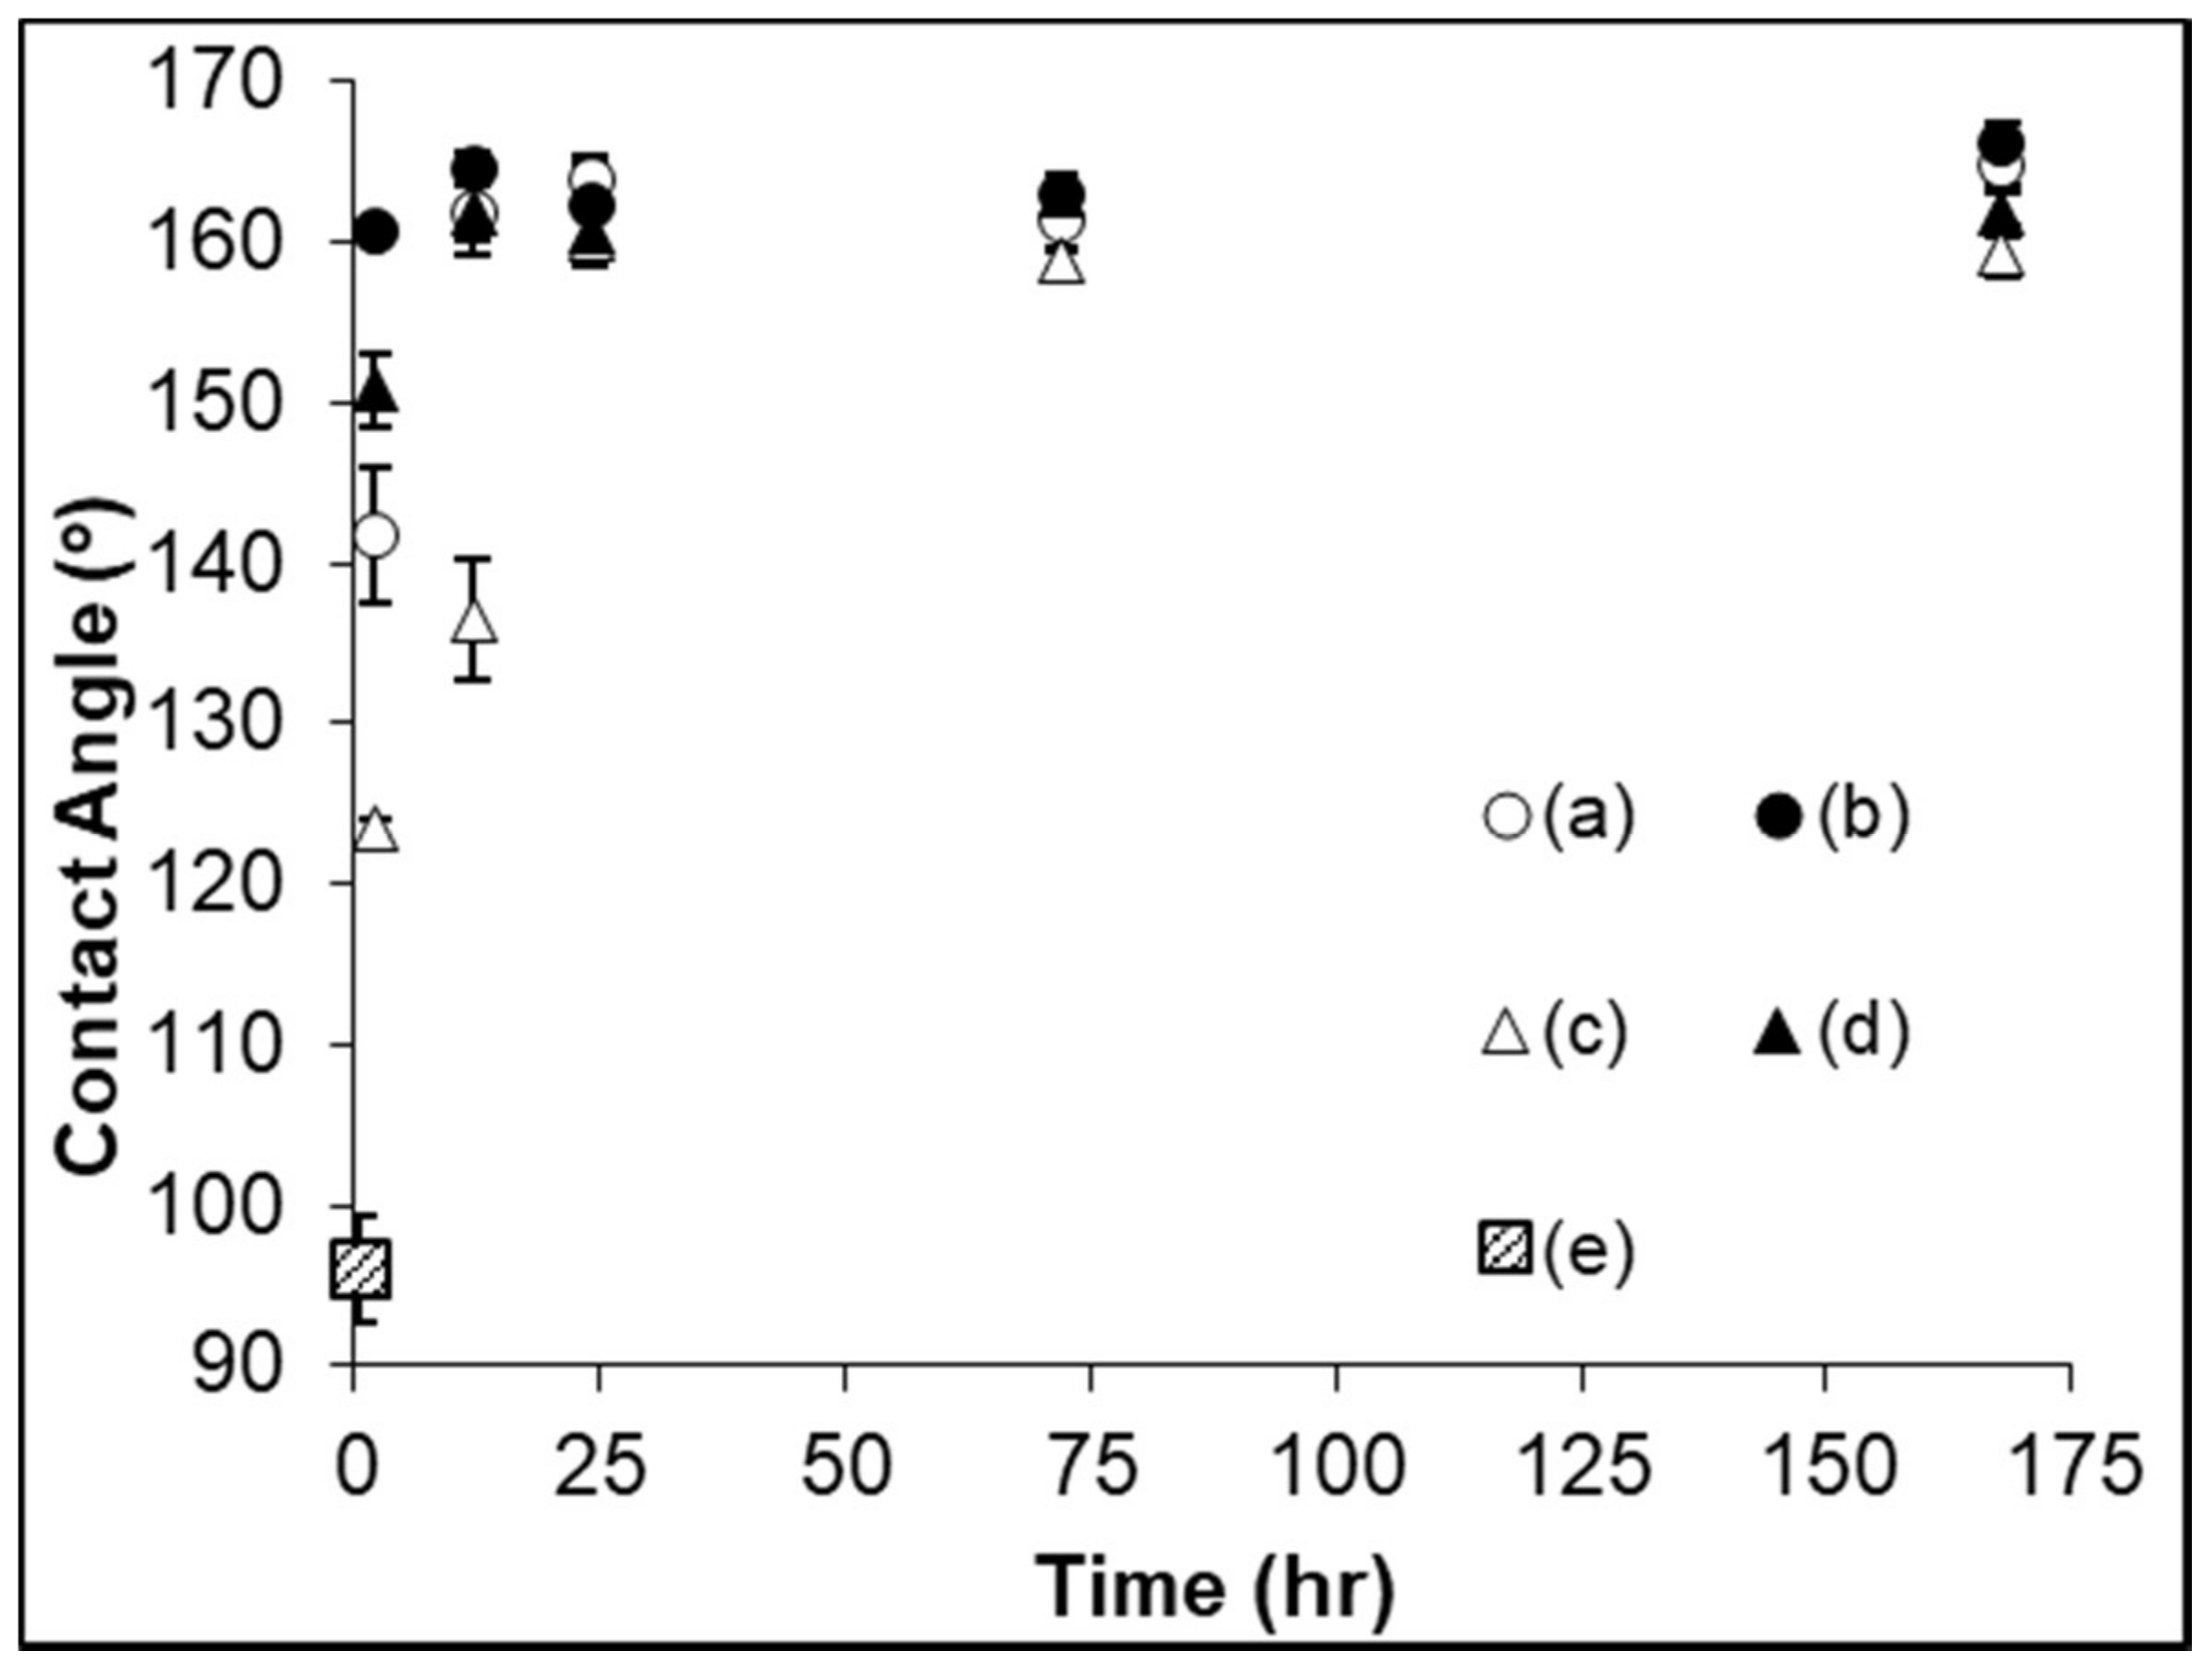
3.2. Captive Bubble Contact Angle
3.3. Fe L-edge PEEM and NEXAFS
3.4. C K-edge NEXAFS
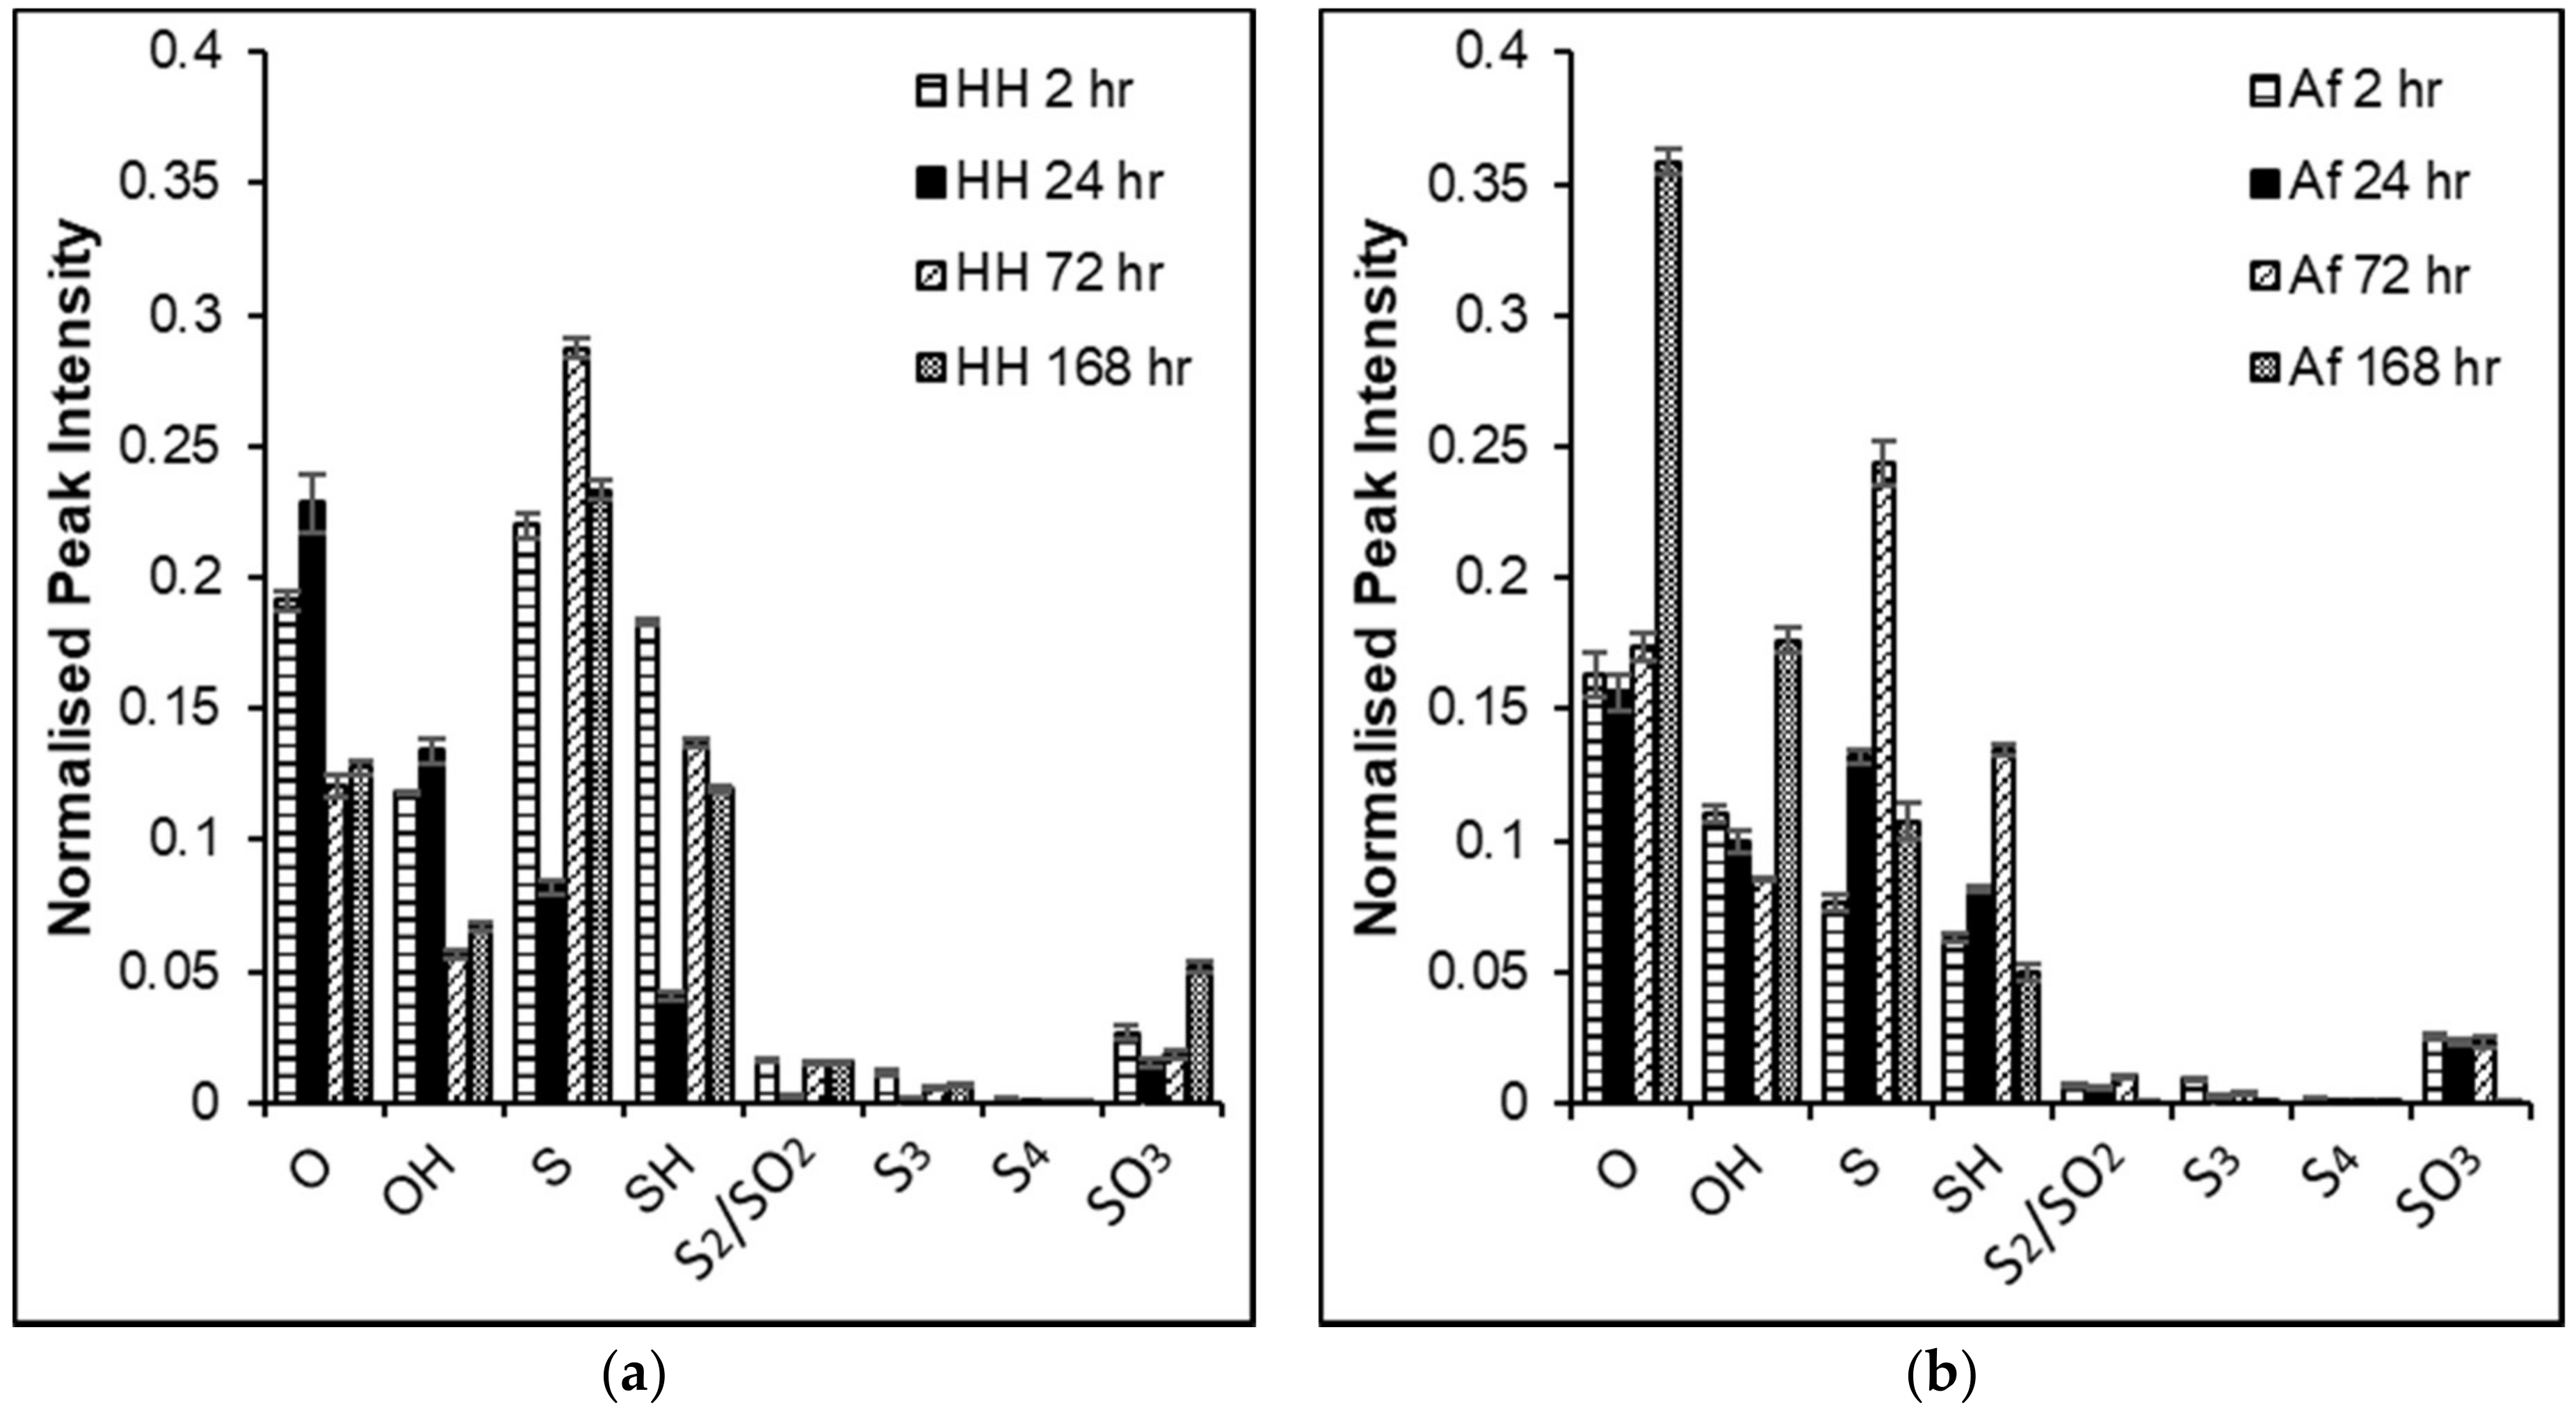
3.5. ToF-SIMS
4. Discussion
5. Conclusions
Acknowledgments
Author Contributions
Conflicts of Interest
References
- Li, J.; Dabrowski, B.; Miller, J.D.; Acar, S.; Dietrich, M.; Le Vier, K.M.; Wan, R.Y. The influence of pyrite pre-oxidation on gold recovery by cyanidation. Miner. Eng. 2006, 19, 883–895. [Google Scholar] [CrossRef]
- Hodgkinson, G.; Sandenberght, R.F.; Hunter, C.J.; De Wet, J.R. Pyrite flotation from gold leach residues. Miner. Eng. 1994, 7, 691–698. [Google Scholar] [CrossRef]
- Yan, D.S. Selective flotation of pyrite and gold tellurides. Miner. Eng. 1997, 10, 327–337. [Google Scholar] [CrossRef]
- Mu, Y.; Peng, Y.; Lauten, R.A. The depression of pyrite in selective flotation by different reagent systems—A literature review. Miner. Eng. 2016, 96, 143–156. [Google Scholar] [CrossRef]
- Wills, B.A. Wills’ Mineral Processing Technology, 7th ed.; Elsevier: Oxford, UK, 2006; p. 444. [Google Scholar]
- Nagaraj, D.R. Minerals recovery and processing. In Kirk-Othmer Encyclopedia of Chemical Technology; John Wiley & Sons, Inc.: Hoboken, NJ, USA, 2000; Volume 16, pp. 595–679. [Google Scholar]
- Kawatra, S.K. Flotation fundamentals. In Mining Engineering Handbook; Michigan Technological University: Houghton, MI, USA, 2009; p. 30. [Google Scholar]
- Fuerstenau, M.C.; Chander, S.; Woods, R. Sulphide mineral flotation. In Froth Flotation: A Century of Innovation; Fuerstenau, M.C., Jameson, G., Yoon, R.-H., Eds.; Society for Mining, Metallurgy, and Exploration: Littleton, CO, USA, 2007; pp. 425–464. [Google Scholar]
- Farahat, M.; Hirajima, T.; Sasaki, K.; Aiba, Y.; Doi, K. Adsorption of sip e. Coli onto quartz and its applications in froth flotation. Miner. Eng. 2008, 21, 389–395. [Google Scholar] [CrossRef]
- Langwaldt, J.; Kalapudas, R. Bio-benefication of multimetal black shale ore by flotation. Physico. Probl. Miner. Process. 2007, 41, 291–299. [Google Scholar]
- Mehrabani, J.V.; Mousavi, S.M.; Noaparast, M. Evaluation of the replacement of nacn with acidithiobacillus ferrooxidans in the flotation of high-pyrite, low-grade lead–zinc ore. Sep. Purif. Technol. 2011, 80, 202–208. [Google Scholar] [CrossRef]
- Smith, R.W.; Miettinen, M. Microorganisms in flotation and flocculation: Future technology or laboratory curiosity? Miner. Eng. 2006, 19, 548–553. [Google Scholar] [CrossRef]
- Rao, H.K.; Vilinska, A.; Chernyshova, I.V. Minerals bioprocessing: R & d needs in mineral biobeneficiation. Hydrometallurgy 2010, 104, 465–470. [Google Scholar]
- Mehrabani, J.V.; Noaparast, M.; Mousavi, S.M.; Dehghan, R.; Rasooli, E.; Hajizadeh, H. Depression of pyrite in the flotation of high pyrite low-grade lead–zinc ore using acidithiobacillus ferrooxidans. Miner. Eng. 2010, 23, 10–16. [Google Scholar] [CrossRef]
- Chandraprabha, M.N.; Natarajan, K.A.; Somasundaran, P. Selective separation of pyrite from chalcopyrite and arsenopyrite by biomodulation using acidithiobacillus ferrooxidans. Int. J. Miner. Process. 2005, 75, 113–122. [Google Scholar] [CrossRef]
- Crundwell, F.K. How do bacteria interact with minerals? Hydrometallurgy 2003, 71, 75–81. [Google Scholar] [CrossRef]
- Sand, W.; Gehrke, T.; Jozsa, P.-G.; Schippers, A. (Bio)chemistry of bacterial leaching—Direct vs. Indirect bioleaching. Hydrometallurgy 2001, 59, 159–175. [Google Scholar] [CrossRef]
- Kinzler, K.; Gehrke, T.; Telegdi, J.; Sand, W. Bioleaching—A result of interfacial processes caused by extracellular polymeric substances (eps). Hydrometallurgy 2003, 71, 83–88. [Google Scholar] [CrossRef]
- Comte, S.; Guibaud, G.; Baudu, M. Relations between extraction protocols for activated sludge extracellular polymeric substances (eps) and eps complexation properties: Part i. Comparison of the efficiency of eight eps extraction methods. Enzyme Microb. Technol. 2006, 38, 237–245. [Google Scholar] [CrossRef]
- Sharma, P.K.; Das, A.; Hanumantha Rao, K.; Forssberg, K.S.E. Surface characterization of acidithiobacillus ferrooxidans cells grown under different conditions. Hydrometallurgy 2003, 71, 285–292. [Google Scholar] [CrossRef]
- Watling, H.R. The bioleaching of sulphide minerals with emphasis on copper sulphides—A review. Hydrometallurgy 2006, 84, 81–108. [Google Scholar] [CrossRef]
- Rohwerder, T.; Sand, W. Mechanisms and biochemical fundamentals of bacterial metal sulfide oxidation. In Microbial Processing of Metal Sulfides; Sand, E.R.D.A.W., Ed.; Springer: Berlin, Germany, 2007; pp. 35–58. [Google Scholar]
- Harneit, K.; Göksel, A.; Kock, D.; Klock, J.H.; Gehrke, T.; Sand, W. Adhesion to metal sulfide surfaces by cells of acidithiobacillus ferrooxidans, acidithiobacillus thiooxidans and leptospirillum ferrooxidans. Hydrometallurgy 2006, 83, 245–254. [Google Scholar] [CrossRef]
- Poorni, S.; Natarajan, K.A. Flocculation behaviour of hematite–kaolinite suspensions in presence of extracellular bacterial proteins and polysaccharides. Coll. Surf. B Biointerfaces 2014, 114, 186–192. [Google Scholar] [CrossRef] [PubMed]
- Vilinska, A.; Hanumantha Rao, K. Leptospirillum ferrooxidans-sulfide mineral interactions with reference to bioflotation and bioflocculation. Trans. Nonferrous Met. Soc. China 2008, 18, 1403–1409. [Google Scholar] [CrossRef]
- Dague, E.; Delcorte, A.; Latgé, J.P.; Dufrêne, Y.F. Combined use of atomic force microscopy, X-ray photoelectron spectroscopy, and secondary ion mass spectrometry for cell surface analysis. Langmuir 2008, 24, 2955–2959. [Google Scholar] [CrossRef] [PubMed]
- Stohr, J. Nexafs Spectroscopy; Springer-Verlag: Berlin/Heidelberg, Germany, 1992; Volume 25, p. 404. [Google Scholar]
- Wei, D.H.; Chan, Y.L.; Hsu, Y.J. Exploring the magnetic and organic microstructures with photoemission electron microscope. J. Electron Spectrosc. Relat. Phenom. 2012, 185, 429–435. [Google Scholar] [CrossRef]
- Wei, D.H.; Hsu, Y.J.; Klauser, R.; Hong, I.H.; Yin, G.C.; Chuang, T.J. Photoelectron microscopy projects at srrc. Surf. Rev. Lett. 2003, 10, 617–624. [Google Scholar]
- Acres, R.G.; Harmer, S.L.; Beattie, D.A. Synchrotron peem and tof-sims study of oxidized heterogenous pentlandite, pyrrhotite and chalcopyrite. J. Synchrotron Radiat. 2010, 17, 606–615. [Google Scholar] [PubMed]
- Acres, R.G.; Harmer, S.L.; Beattie, D.A. Synchrotron xps, nexafs, and tof-sims studies of solution exposed chalcopyrite and heterogeneous chalcopyrite with pyrite. Miner. Eng. 2010, 23, 928–936. [Google Scholar] [CrossRef]
- Belu, A.M.; Graham, D.J.; Castner, D.G. Time-of-flight secondary ion mass spectrometry: Techniques and applications for the characterization of biomaterial surfaces. Biomaterials 2003, 24, 3635–3653. [Google Scholar] [CrossRef]
- Briggs, D.; Vickerman, J.C. Tof-Sims: Surface Analysis by Mass Spectrometry; SurfaceSpectra Chichester: Manchester, UK, 2001. [Google Scholar]
- Belu, A.M.; Davies, M.C.; Newton, J.M.; Patel, N. Tof-sims characterization and imaging of controlled-release drug delivery systems. Anal. Chem. 2000, 72, 5625–5638. [Google Scholar] [CrossRef] [PubMed]
- Berman, E.S.F.; Kulp, K.S.; Knize, M.G.; Wu, L.; Nelson, E.J.; Nelson, D.O.; Wu, K.J. Distinguishing monosaccharide stereo- and structural isomers with tof-sims and multivariate statistical analysis. Anal. Chem. 2006, 78, 6497–6503. [Google Scholar] [CrossRef] [PubMed]
- De Brouwer, J.F.C.; Cooksey, K.E.; Wigglesworth-Cooksey, B.; Staal, M.J.; Stal, L.J.; Avci, R. Time of flight-secondary ion mass spectrometry on isolated extracellular fractions and intact biofilms of three species of benthic diatoms. J. Microbiol. Methods 2006, 65, 562–572. [Google Scholar] [CrossRef] [PubMed]
- Murphy, R.; Strongin, D.R. Surface reactivity of pyrite and related sulfides. Surf. Sci. Rep. 2009, 64, 1–45. [Google Scholar] [CrossRef]
- Franzblau, R.E.; Daughney, C.J.; Swedlund, P.J.; Weisener, C.G.; Moreau, M.; Johannessen, B.; Harmer, S.L. Cu(IIii) removal by anoxybacillus flavithermus–iron oxide composites during the addition of Fe(II)aq. Geochimica et Cosmochimica Acta 2016, 172, 139–158. [Google Scholar] [CrossRef]
- Bui, L.M.G.; Turnidge, J.D.; Kidd, S.P. The induction of staphylococcus aureus biofilm formation or small colony variants is a strain-specific response to host-generated chemical stresses. Microbes Infect. 2015, 17, 77–82. [Google Scholar] [CrossRef] [PubMed]
- Tan, S.N.; Chen, M. Early stage adsorption behaviour of acidithiobacillus ferrooxidans on minerals I: An experimental approach. Hydrometallurgy 2012, 119, 87–94. [Google Scholar] [CrossRef]
- Read, M.L.; Morgan, P.B.; Kelly, J.M.; Maldonado-Codina, C. Dynamic contact angle analysis of silicone hydrogel contact lenses. J. Biomater. Appl. 2010, 26, 85–99. [Google Scholar] [CrossRef] [PubMed]
- Campbell, D.; Carnell, S.M.; Eden, R.J. Applicability of contact angle techniques used in the analysis of contact lenses, part 1: Comparative methodologies. Eye Contact Lens 2013, 39, 254–262. [Google Scholar] [CrossRef] [PubMed]
- Beaussart, A.; Mierczynska-Vasilev, A.M.; Harmer, S.L.; Beattie, D.A. The role of mineral surface chemistry in modified dextrin adsorption. J. Colloid Interface Sci. 2011, 357, 510–520. [Google Scholar] [CrossRef] [PubMed]
- Yin, G.C.; Wei, D.H.; Hsu, Y.J.; Tsang, K.L. The Image Acquisition and Analysis Program for Peem Station. In Proceedings of the AIP Conference Proceedings, San Fransisco, California, USA, 25–29 August 2003; American Institute of Physics: College Park, MD, USA, 2004; p. 897. [Google Scholar]
- Goh, S.W.; Buckley, A.N.; Lamb, R.N.; Rosenberg, R.A.; Moran, D. The oxidation states of copper and iron in mineral sulfides, and the oxides formed on initial exposure of chalcopyrite and bornite to air. Geochim. Cosmochim. Acta 2006, 70, 2210–2228. [Google Scholar] [CrossRef]
- Brandes, J.A.; Cody, G.D.; Rumble, D.; Haberstroh, P.; Wirick, S.; Gelinas, Y. Carbon k-edge xanes spectromicroscopy of natural graphite. Carbon 2008, 46, 1424–1434. [Google Scholar] [CrossRef]
- Hitchcock, A.P.; Morin, C.; Zhang, X.; Araki, T.; Dynes, J.J.; Stöver, H.; Brash, J.; Lawrence, J.R.; Leppard, G.G. Soft X-ray spectromicroscopy of biological and synthetic polymer systems. J. Electron Spectrosc. Relat. Phenom. 2005, 144, 259–269. [Google Scholar] [CrossRef]
- Hitchcock, A.P.; Morin, C.; Heng, Y.M.; Cornelius, R.M.; Brash, J.L. Towards practical soft X-ray spectromicroscopy of biomaterials. J. Biomater. Sci. Polym. Ed. 2002, 13, 919–937. [Google Scholar] [CrossRef] [PubMed]
- Ravel, B.; Newville, M. Athena, artemis, hephaestus: Data analysis for X-ray absorption spectroscopy using ifeffit. J. Synchrotron Radiat. 2005, 12, 537–541. [Google Scholar] [CrossRef] [PubMed]
- Smart, R.S.C.; Jasieniak, M.; Prince, K.E.; Skinner, W.M. Sims studies of oxidation mechanisms and polysulfide formation in reacted sulfide surfaces. Miner. Eng. 2000, 13, 857–870. [Google Scholar] [CrossRef]
- Piantadosi, C.; Smart, R.S.C. Statistical comparison of hydrophobic and hydrophilic species on galena and pyrite particles in flotation concentrates and tails from tof-sims evidence. Int. J. Miner. Process. 2002, 64, 43–54. [Google Scholar] [CrossRef]
- Pradier, C.M.; Rubio, C.; Poleunis, C.; Bertrand, P.; Marcus, P.; Compère, C. Surface characterization of three marine bacterial strains by fourier transform ir, X-ray photoelectron spectroscopy, and time-of-flight secondary-ion mass spectrometry, correlation with adhesion on stainless steel surfaces. J. Phys. Chem. B 2005, 109, 9540–9549. [Google Scholar] [CrossRef] [PubMed]
- Gleisner, M.; Herbert, R.B.; Frogner Kockum, P.C. Pyrite oxidation by acidithiobacillus ferrooxidans at various concentrations of dissolved oxygen. Chem. Geol. 2006, 225, 16–29. [Google Scholar] [CrossRef]
- Liu, H.; Gu, G.; Xu, Y. Surface properties of pyrite in the course of bioleaching by pure culture of acidithiobacillus ferrooxidans and a mixed culture of acidithiobacillus ferrooxidans and acidithiobacillus thiooxidans. Hydrometallurgy 2011, 108, 143–148. [Google Scholar] [CrossRef]
- Yu, J.-Y.; McGenity, T.J.; Coleman, M.L. Solution chemistry during the lag phase and exponential phase of pyrite oxidation by thiobacillus ferrooxidans. Chem. Geol. 2001, 175, 307–317. [Google Scholar] [CrossRef]
- Karavaiko, G.I.; Smolskaja, L.S.; Golyshina, O.K.; Jagovkina, M.A.; Egorova, E.Y. Bacterial pyrite oxidation: Influence of morphological, physical and chemical properties. Fuel Process. Technol. 1994, 40, 151–165. [Google Scholar] [CrossRef]
- Edwards, K.J.; Rutenberg, A.D. Microbial response to surface microtopography: The role of metabolism in localized mineral dissolution. Chem. Geol. 2001, 180, 19–32. [Google Scholar] [CrossRef]
- Mitsunobu, S.; Zhu, M.; Takeichi, Y.; Ohigashi, T.; Suga, H.; Jinno, M.; Makita, H.; Sakata, M.; Ono, K.; Mase, K.; et al. Direct detection of Fe(ii) in extracellular polymeric substances (eps) at the mineral-microbe Interface in bacterial pyrite leaching. Microbes Environ. 2016, 31, 63–69. [Google Scholar] [CrossRef] [PubMed]
- Xia, J.L.; Yang, Y.; He, H.; Zhao, X.J.; Liang, C.L.; Zheng, L.; Ma, C.Y.; Zhao, Y.D.; Nie, Z.Y.; Qiu, G.Z. Surface analysis of sulfur speciation on pyrite bioleached by extreme thermophile acidianus manzaensis using raman and xanes spectroscopy. Hydrometallurgy 2010, 100, 129–135. [Google Scholar] [CrossRef]
- Vilinska, A.; Hanumantha Rao, K. Surface thermodynamics and extended dlvo theory of acidithiobacillus ferrooxidans cells adhesion on pyrite and chalcopyrite. Open Colloid Sci. J. 2009, 2, 1–14. [Google Scholar] [CrossRef]
- Ohmura, N.; Kitamura, K.; Saiki, H. Selective adhesion of thiobacillus ferrooxidans to pyrite. Appl. Environ. Microbiol. 1993, 59, 4044–4050. [Google Scholar] [PubMed]
- Nagaoka, T.; Ohmura, N.; Saiki, H. A novel mineral processing by flotation using thiobacillus ferrooxidans. In Process Metallurgy; Amils, R., Ballester, A., Eds.; Elsevier: Amsterdam, The Nertherlands, 1999; Volume 9, pp. 335–342. [Google Scholar]
- Womes, M.; Karnatak, R.C.; Esteva, J.M.; Lefebvre, I.; Allan, G.; Olivier-Fourcades, J.; Jumas, J.C. Electronic structures of FeS and FeS2: X-ray absorption spectroscopy and band structure calculations. J. Phys. Chem. Solids 1997, 58, 345–352. [Google Scholar] [CrossRef]
- Fleet, M.E. Xanes spectroscopy of sulphur in earth materials. Can. Miner. 2005, 43, 1811–1838. [Google Scholar] [CrossRef]
- Von Oertzen, G.U.; Jones, R.T.; Gerson, A.R. Electronic and optical properties of Fe, Zn and Pb sulfides. Phys. Chem. Miner. 2005, 32, 255–268. [Google Scholar] [CrossRef]
- Miedema, P.S.; de Groot, F.M.F. The iron l edges: Fe 2p X-ray absorption and electron energy loss spectroscopy. J. Electron Spectrosc. Relat. Phenom. 2013, 187, 32–48. [Google Scholar] [CrossRef]
- Van Aken, P.A.; Lauterbach, S. Strong magnetic linear dichroism in Fe L23 and O K electron energy-loss near-edge spectra of antiferromagnetic hematite α-Fe2O3. Phys. Chem. Miner. 2003, 30, 469–477. [Google Scholar] [CrossRef]
- Van Aken, P.A.; Liebscher, B. Quantification of ferrous/ferric ratios in minerals: New evaluation schemes of Fe L23 electron energy-loss near-edge spectra. Phys. Chem. Miner. 2002, 29, 188–200. [Google Scholar] [CrossRef]
- Doyle, C.S.; Kendelewicz, T.; Bostick, B.C.; Brown, G.E. Soft X-ray spectroscopic studies of the reaction of fractured pyrite surfaces with Cr(vi)-containing aqueous solutions. Geochim. Cosmochim. Acta 2004, 68, 4287–4299. [Google Scholar] [CrossRef]
- Kalegowda, Y.; Harmer, S.L. Classification of time-of-flight secondary ion mass spectrometry spectra from complex Cu-Fe sulphides by principal component analysis and artificial neural networks. Anal. Chim. Acta 2013, 759, 21–27. [Google Scholar] [CrossRef] [PubMed]
- Kalegowda, Y.; Chan, Y.L.; Wei, D.H.; Harmer, S.L. X-peem, xps and tof-sims characterisation of xanthate induced chalcopyrite flotation: Effect of pulp potential. Surf. Sci. 2015, 635, 70–77. [Google Scholar] [CrossRef]
- Buckley, A.N.; Woods, R. An X-ray photoelectron spectroscopic study of the oxidation of chalcopyrite. Aust. J. Chem. 1984, 37, 2403–2413. [Google Scholar] [CrossRef]
- Kaznacheyev, K.; Osanna, A.; Jacobsen, C.; Plashkevych, O.; Vahtras, O.; Ågren, H.; Carravetta, V.; Hitchcock, A.P. Innershell absorption spectroscopy of amino acids. J. Phys. Chem. A 2002, 106, 3153–3168. [Google Scholar] [CrossRef]
- Stewart-Ornstein, J.; Hitchcock, A.P.; Hernandez Cruz, D.; Henklein, P.; Overhage, J.; Hilpert, K.; Hale, J.D.; Hancock, R.E. Using intrinsic X-ray absorption spectral differences to identify and map peptides and proteins. J. Phys. Chem. B 2007, 111, 7691–7699. [Google Scholar] [CrossRef] [PubMed]
- Solomon, D.; Lehmann, J.; Harden, J.; Wang, J.; Kinyangi, J.; Heymann, K.; Karunakaran, C.; Lu, Y.; Wirick, S.; Jacobsen, C. Micro- and nano-environments of carbon sequestration: Multi-element stxm–nexafs spectromicroscopy assessment of microbial carbon and mineral associations. Chem. Geol. 2012, 329, 53–73. [Google Scholar] [CrossRef]
- Wan, J.; Tyliszczak, T.; Tokunaga, T.K. Organic carbon distribution, speciation, and elemental correlations within soil microaggregates: Applications of stxm and nexafs spectroscopy. Geochim. Cosmochim. Acta 2007, 71, 5439–5449. [Google Scholar] [CrossRef]
- Miot, J.; Benzerara, K.; Morin, G.; Kappler, A.; Bernard, S.; Obst, M.; Férard, C.; Skouri-Panet, F.; Guigner, J.-M.; Posth, N.; et al. Iron biomineralization by anaerobic neutrophilic iron-oxidizing bacteria. Geochim. Cosmochim. Acta 2009, 73, 696–711. [Google Scholar] [CrossRef]
- Rightor, E.G.; Hitchcock, A.P.; Ade, H.; Leapman, R.D.; Urquhart, S.G.; Smith, A.P.; Mitchell, G.; Fischer, D.; Shin, H.J.; Warwick, T. Spectromicroscopy of poly(ethylene terephthalate): Comparison of spectra and radiation damage rates in X-ray absorption and electron energy loss. J. Phys. Chem. B 1997, 101, 1950–1960. [Google Scholar] [CrossRef]
- Zubavichus, Y.; Fuchs, O.; Weinhardt, L.; Heske, C.; Umbach, E.; Denlinger, J.D.; Grunze, M. Soft X-ray-induced decomposition of amino acids: An xps, mass spectrometry, and nexafs study. Radiat. Res. 2004, 161, 346–358. [Google Scholar] [CrossRef] [PubMed]
- Watts, B.; Thomsen, L.; Dastoor, P.C. Methods in carbon k-edge nexafs: Experiment and analysis. J. Electron Spectrosc. Relat. Phenom. 2006, 151, 105–120. [Google Scholar] [CrossRef]
- Dynes, J.J.; Lawrence, J.R.; Korber, D.R.; Swerhone, G.D.; Leppard, G.G.; Hitchcock, A.P. Morphological and biochemical changes in pseudomonas fluorescens biofilms induced by sub-inhibitory exposure to antimicrobial agents. Can. J. Microbiol. 2009, 55, 163–178. [Google Scholar] [CrossRef] [PubMed]
- Boese, J.; Osanna, A.; Jacobsen, C.; Kirz, J. Carbon edge xanes spectroscopy of amino acids and peptides. J. Electron Spectrosc. Relat. Phenom. 1997, 85, 9–15. [Google Scholar] [CrossRef]
- Coker, V.S.; Byrne, J.M.; Telling, N.D.; Van Der Laan, G.; Lloyd, J.R.; Hitchcock, A.P.; Wang, J.; Pattrick, R.A.D. Characterisation of the dissimilatory reduction of fe(iii)-oxyhydroxide at the microbe—Mineral interface: The application of stxm–xmcd. Geobiology 2012, 10, 347–354. [Google Scholar] [CrossRef] [PubMed]
- Morin, C.; Hitchcock, A.P.; Cornelius, R.M.; Brash, J.L.; Urquhart, S.G.; Scholl, A.; Doran, A. Selective adsorption of protein on polymer surfaces studied by soft X-ray photoemission electron microscopy. J. Electron Spectrosc. Relat. Phenom. 2004, 137, 785–794. [Google Scholar] [CrossRef]
- Chan, C.S.; Fakra, S.C.; Edwards, D.C.; Emerson, D.; Banfield, J.F. Iron oxyhydroxide mineralization on microbial extracellular polysaccharides. Geochim. Cosmochim. Acta 2009, 73, 3807–3818. [Google Scholar] [CrossRef]
- Lillian, C.; Hsu, A.; Jean Fang, B.; Diana, A.; Borca-Tasciuc, C.; Randy, W.; Worobo, A.; Carmen, I. Morarua effect of micro- and nanoscale topography on the adhesion of bacterial cells to solid surfaces. Appl. Environ. Microbiol. 2013, 79, 2703–2712. [Google Scholar]
- Li, Q.; Wang, Q.; Zhu, J.; Zhou, S.; Gan, M.; Jiang, H.; Sand, W. Effect of extracellular polymeric substances on surface properties and attachment behavior of acidithiobacillus ferrooxidans. Minerals 2016, 6, 100. [Google Scholar] [CrossRef]
- Beech, I.B.; Sunner, J. Biocorrosion: Towards understanding interactions between biofilms and metals. Curr. Opin. Biotechnol. 2004, 15, 181–186. [Google Scholar] [CrossRef] [PubMed]
- Rojas-Chapana, J.A.; Tributsch, H. Bio-leaching of pyrite accelerated by cysteine. Process Biochem. 2000, 35, 815–824. [Google Scholar] [CrossRef]
- Otsuki, A.; Ohshima, H. Use of microorganisms for complex ore beneficiation: Bioflotation as an example. In Encyclopedia of Biocolloid and Biointerface Science 2v Set; John Wiley & Sons, Inc.: Hoboken, NJ, USA, 2016; pp. 108–117. [Google Scholar]


© 2018 by the authors. Licensee MDPI, Basel, Switzerland. This article is an open access article distributed under the terms and conditions of the Creative Commons Attribution (CC BY) license (http://creativecommons.org/licenses/by/4.0/).
Share and Cite
La Vars, S.M.; Newton, K.; Quinton, J.S.; Cheng, P.-Y.; Wei, D.-H.; Chan, Y.-L.; Harmer, S.L. Surface Chemical Characterisation of Pyrite Exposed to Acidithiobacillus ferrooxidans and Associated Extracellular Polymeric Substances. Minerals 2018, 8, 132. https://doi.org/10.3390/min8040132
La Vars SM, Newton K, Quinton JS, Cheng P-Y, Wei D-H, Chan Y-L, Harmer SL. Surface Chemical Characterisation of Pyrite Exposed to Acidithiobacillus ferrooxidans and Associated Extracellular Polymeric Substances. Minerals. 2018; 8(4):132. https://doi.org/10.3390/min8040132
Chicago/Turabian StyleLa Vars, Sian M., Kelly Newton, Jamie S. Quinton, Pei-Yu Cheng, Der-Hsin Wei, Yuet-Loy Chan, and Sarah L. Harmer. 2018. "Surface Chemical Characterisation of Pyrite Exposed to Acidithiobacillus ferrooxidans and Associated Extracellular Polymeric Substances" Minerals 8, no. 4: 132. https://doi.org/10.3390/min8040132