Article

The Carbonation of Wollastonite: A Model Reaction to Test Natural and Biomimetic Catalysts for Enhanced CO2 Sequestration

by
Fulvio Di Lorenzo
1,
Cristina Ruiz-Agudo
2,
Aurelia Ibañez-Velasco
1,
Rodrigo Gil-San Millán
3,
Jorge A. R. Navarro
3,
Encarnacion Ruiz-Agudo
1 and
Carlos Rodriguez-Navarro
1,*
1
Department of Mineralogy and Petrology, University of Granada, 18071 Granada, Spain
2
Department of Physical Chemistry, University of Konstanz, 78457 Konstanz, Germany
3
Department of Inorganic Chemistry, University of Granada, 18071 Granada, Spain
*
Author to whom correspondence should be addressed.
Minerals 2018, 8(5), 209; https://doi.org/10.3390/min8050209
Submission received: 13 April 2018 / Revised: 7 May 2018 / Accepted: 8 May 2018 / Published: 11 May 2018
(This article belongs to the Special Issue Mineral Surface Reactions at the Nanoscale)

Abstract

:
One of the most promising strategies for the safe and permanent disposal of anthropogenic CO2 is its conversion into carbonate minerals via the carbonation of calcium and magnesium silicates. However, the mechanism of such a reaction is not well constrained, and its slow kinetics is a handicap for the implementation of silicate mineral carbonation as an effective method for CO2 capture and storage (CCS). Here, we studied the different steps of wollastonite (CaSiO3) carbonation (silicate dissolution → carbonate precipitation) as a model CCS system for the screening of natural and biomimetic catalysts for this reaction. Tested catalysts included carbonic anhydrase (CA), a natural enzyme that catalyzes the reversible hydration of CO2(aq), and biomimetic metal-organic frameworks (MOFs). Our results show that dissolution is the rate-limiting step for wollastonite carbonation. The overall reaction progresses anisotropically along different [hkl] directions via a pseudomorphic interface-coupled dissolution–precipitation mechanism, leading to partial passivation via secondary surface precipitation of amorphous silica and calcite, which in both cases is anisotropic (i.e., (hkl)-specific). CA accelerates the final carbonate precipitation step but hinders the overall carbonation of wollastonite. Remarkably, one of the tested Zr-based MOFs accelerates the dissolution of the silicate. The use of MOFs for enhanced silicate dissolution alone or in combination with other natural or biomimetic catalysts for accelerated carbonation could represent a potentially effective strategy for enhanced mineral CCS.

1. Introduction

The alarming increase in the concentration of atmospheric CO2 from pre-industrial levels of ~280 ppmv to current levels of ~400 ppmv and the effects this greenhouse gas can have on the Earth system [1], have prompted extensive research aiming at reducing anthropogenic CO2 emissions and its capture and storage [2,3]. Among the different solutions under investigation [4,5,6], the conversion of calcium and magnesium (and/or ferrous iron) silicate minerals (e.g., olivine, pyroxenes, wollastonite, amphiboles, serpentine, and Ca-plagioclase) into carbonates, the so-called Urey-type or carbonation reaction [7], i.e., MSiO3 + CO2 = MCO3 + SiO2, where M is a divalent metal cation such as Ca2+ and Mg2+ (or Fe2+), has been proposed and tested for the safe and long-term storage of this greenhouse gas [2,8,9].
Carbonation of primary silicates is a natural weathering process [10] that has regulated Earth’s atmospheric CO2 concentration and climate over geologic time-scales [11,12,13,14,15]. Such a natural process is the basis of several current ex situ and in situ technologies for carbon capture and storage (CCS) [4,6,16,17]. Among the many ex situ methods proposed so far, involving either solid–gas or liquid–gas carbonation reactions, the most promising ones are those based on aqueous mineral carbonation [6,18]. This is the case, for instance, of the acid-promoted dissolution of primary silicates in a reactor followed by the injection of CO2 in the resulting Ca- and/or Mg-rich solution, whose pH is increased to favor carbonate precipitation [17]. This two-stage mineral carbonation is known as the “pH-swing” process [19,20]. Ex situ silicate carbonation in solution following a one step process (i.e., direct carbonation) would be more cost-effective, but typically requires circumneutral pH conditions, which limit silicate dissolution [6,16]. Silicate activation by means of heat treatment and/or intensive grinding can result in enhanced dissolution during ex situ mineral carbonation, but these processes have a high energy penalty and are too costly [2,4], which may make such an approach impractical [18]. Alternatively, complexing agents (e.g., ethylenediaminetetraacetic acid, EDTA) and weak organic acids (e.g., acetic acid) can enhance silicate dissolution at moderately acid (pH 2–4.5) or circumneutral pH conditions [21,22,23], but their cost and complex recycling are strong handicaps for their widespread implementation. In situ carbonation involves the direct deep injection of CO2 (e.g., dissolved in water as a brine) into mafic and ultramafic silicate rock formations [2,4,24]. The reactive brine (with very low pH) induces the dissolution of the alkaline-earth silicates (or silicate glass), a process which consumes protons. The subsequent pH increase ultimately favors carbonate precipitation [24]. A successful example of in situ carbon mineral sequestration via silicate carbonation is the case of the pilot test CarbFix (Iceland), which involved injection of reactive CO2 brines into basaltic rocks [24,25]. Matter et al. [24] report that over 95% of the CO2 injected into the CarbFix site might have been mineralized in less than two years.
Silicate minerals transform into carbonates via a combined dissolution–precipitation process. The alkaline-earth metal cations released by the dissolution of the silicate mineral act as building units for the formation of secondary carbonate phases [26,27,28]. The final result is the incorporation of CO2 as carbonate structural units into the product phases. The thermodynamic driving force behind the overall carbonation process is the undersaturation with respect to the silicate minerals of the (carbon-rich) aqueous solution interacting with natural silicate rocks [26,27]. As soon as silicate minerals’ dissolution starts, the aqueous phase becomes increasingly richer in alkaline-earth metal cations until a critical supersaturation with respect to the carbonate minerals is reached, triggering their precipitation [4,26,27]. The overall ΔG of the dissolution–precipitation reactions is negative, so this process takes place spontaneously [27,29]. As an example, the overall carbonation of wollastonite is exothermic, with a ΔH of −87 kJ∙mol−1 and ΔG of −44 kJ∙mol−1 at standard T and P conditions [9,29]. However, the kinetics of these coupled dissolution–precipitation reactions are typically very slow, which poses a strong handicap for the effective implementation of this CCS strategy [22]. The use of catalysts that can speed up both the silicate dissolution and the carbonate precipitation reactions (neither being consumed by the reaction nor needing a costly recycling) would thus represent a significant advance for the effective and widespread implementation of mineral carbonation for CCS.
The hydration of CO2 via the overall reaction CO2(aq) + H2O = HCO3 + H+ is the rate-limiting step of the carbonate precipitation reaction [30,31]. This reaction is significantly accelerated by carbonic anhydrase (CA) enzyme and, as a result, CA also accelerates the precipitation of alkaline-earth carbonates [32,33,34]. CAs are an ubiquitous family of natural metalloenzymes, its main function being the catalysis of the reversible hydration of carbon dioxide to form bicarbonate ions [35], thereby playing a critical role in various cellular functions, such as pH-regulation, CO2 transport, and bone resorption [36], as well as in the biomineralization of CaCO3 [37]. The active site of CA is formed by a Zn atom tetrahedrally coordinated to three histidine residues and a water molecule. Histidine residues polarize the electronic cloud around the metallic atom and facilitate anchoring of bonded OH (formed after water splitting) to the electrophilic carbon of dissolved CO2, resulting in its hydration (nucleophilic attack) to form HCO3. The bicarbonate ion is then displaced from Zn by a water molecule, which again undergoes protolysis, rendering the active site ready to catalyze the hydration of another CO2 molecule [35]. CA is one of the fastest enzymes known, with a turnover of up to 106 s−1 [34]. Such a biocatalyst has been found to be effective for enzymatic pre- and post-combustion (flue gas) CO2 capture [6,38], and for accelerated ex situ CO2 capture and storage via carbonation of industrial alkaline brines [32], Ca(OH)2 solutions [39] and pastes [31], and Mg(OH)2 slurries [34], as well as solutions produced during the pH-swing process [40,41].
In addition to its “hydrase” catalytic activity, CA also acts as an “esterase” enzyme, being able to hydrolyze a range of ester bonds [38]. Despite its proved catalytic effect on carbonate precipitation, it is not known if CA plays any catalytic role on the dissolution of silicate minerals subjected to carbonation, which is the rate-limiting step in most studied systems [4,16,20,22,26,27], or on the development of secondary amorphous silica layers, also known as silica altered layers, SALs [42,43], which reportedly have a detrimental effect on mineral carbonation [20,29,44,45,46,47,48,49]. Because CA can catalyze the breaking of ester bonds [38], this enzyme could potentially be able to facilitate silicate dissolution or contribute to the dissolution of passivating SALs via Si–O ester-like bond breaking. Interestingly, some sponges that are able to dissolve amorphous silica, express an enzyme called silicase that belongs to the family of CAs [50]. CA and silicase possess the same active site (i.e., the Zn atom coordinated to three histidine residues). However, while silicase can also catalyze the reversible hydration of CO2 [50], its main biochemical role is to catalyze the breaking of Si–O ester-like bonds producing silicic acid [50,51], thereby speeding the dissolution and/or precipitation of silica. The structural similarity of silicase and CA gives some bearing to the notion that CA could accelerate the dissolution of silicate minerals as recently proposed by Xiao et al. [52]. Conversely, the proved capacity of silicase to break Si–O bonds would make it an ideal biocatalyst for the accelerated dissolution of Ca and/or Mg silicates, prior to carbonate precipitation. Unfortunately, silicase extraction (from SiO2-biomineralizing sponges) is very complex [50], and at present this enzyme is not commercially available. In contrast, CA from bovine serum is commercially available. Hence, here we decided to explore the potential silicase-like (i.e., esterase) role of CA during the dissolution stage of wollastonite subjected to carbonation.
In any case, the limited availability of natural enzymes, and their poor stability (i.e., rapid denaturation) are strong handicaps for their widespread use in CCS [6]. Therefore, it would be of advantage to evaluate the potential of biomimetic synthetic metalloenzymes for the accelerated dissolution of silicates and the subsequent precipitation of carbonates. While several biomimetic catalysts used as CA substitutes for accelerated CO2 capture and carbonate precipitation exist [53,54,55,56,57], to our knowledge, no biomimetic catalyst for the dissolution of silicates has been developed. In this context, the catalytic potential offered by the recent development of metal-organic frameworks (MOFs) [58] could represent a significant step-ahead for CCS. MOFs are extremely porous crystalline materials containing metal cations (or metal nanoclusters) bonded by multidentate organic ligands that have been shown to be effective substrates for a range of chemical processes, including pre- and post-combustion CO2 capture [57,59]. MOFs have also been thoroughly investigated as effective and economic alternatives to natural enzymes [58]. The advantages of using MOFs as catalysts instead of enzymes are several: (i) the cost of MOFs is significant lower because of the easier synthesis and purification process; (ii) their physical/chemical resistance is extremely high in comparison with enzymes, which tend to suffer denaturation; and (iii) the catalytic properties of MOFs can be tuned through an easy variation of substrates or through tailoring synthesis reactions [58]. Their main disadvantage is the lower catalytic effect exerted by the metal clusters in MOFs compared to the active metal sites of enzymes. It should be remarked, however, that the number of metal clusters in a MOF particle can be several orders of magnitude higher than the number of active sites present in an enzyme, so MOFs can achieve an overall comparable catalytic efficiency [58]. In this context, we decided to test the catalytic effect on silicate dissolution exerted by chemically resistant Zr-based MOFs such as UiO-66 [60], MOF-808 [61], and the analogous Mg(OH)2-doped MOF-808@Mg(OH)2 (Figure 1) [62]. Zr-based MOFs have been demonstrated to be highly catalytically active in the detoxification of chemical-warfare agents (CWAs) [63], because they are able to induce the hydrolysis of the very strong phosphate ester bonds (P–O, P–F) due to the suitable combination of the strong Lewis acidic nature of Zr4+ ions and basic oxide and hydroxide bridging ligands giving rise to a phosphotriesterase-like activity [64]. We expected that Zr-based MOFs could also have the capacity to break the (very strong) Si–O ester-like bond of silicates, thereby accelerating their dissolution in a similar way to silicase. Here, the catalytic effect on silicate dissolution of Zr-based MOFs and CA are compared.
The main goal of the present study is to screen, test, and validate effective natural and biomimetic catalysts to enhance the conversion of silicates into carbonate minerals. For this task, we used wollastonite as a model alkaline-earth metal silicate mineral. Wollastonite is a single chain silicate with non-pyroxene structure (space group P 1 ¯ 1) that commonly forms during contact metamorphism [65]. Its dissolution and carbonation have been widely studied due to its availability, mineral significance, relatively high reactivity in comparison with other primary silicate minerals, and its tendency to form SALs [22,23,26,27,29,42,43,45,48,49,66,67,68,69,70,71,72,73,74,75,76,77,78,79,80]. These characteristics make it the perfect “standard silicate mineral” for mineral carbonation studies. We present an experimental study on the effect of CA as a catalyst during the dissolution of wollastonite and the subsequent precipitation of calcium carbonate. We also explored the catalytic effect exerted by CA and Zr-based MOFs on the initial dissolution step of the carbonation reaction. To do so, we developed a fast and reproducible experimental protocol that was validated and used to test the catalytic effect of both natural and biomimetic (MOFs) enzymes on silicate dissolution, and which can also be used to test any material aimed at enhancing silicate carbonation for CCS purposes.

2. Materials and Methods

2.1. Materials

Natural wollastonite crystals from South Africa were ground in an agate mortar and sieved to a size range of 251 < φ < 66 μm. Their surface area was determined by N2-adsorption using the Brunauer–Emmett–Teller (BET) method (1.9 ± 0.1 m2/g). Prior to testing and characterization, powder samples were washed with 10 mL of absolute ethanol (Sigma-Aldrich, Merck, Darmstadt, Germany) and ultrasonically cleaned for 5 min. Subsequently, the liquid phase was removed and the process was repeated five times. Afterwards, the crystals were cleaned with 10 mL of H2O to remove the excess ethanol and dried overnight at 60 °C [78]. The purity of the solids was checked by X-ray diffraction analysis showing no crystalline phase other than wollastonite. However, a few μm-sized isolated Mg-rich olivine crystals were observed during scanning electron microscopy analyses. Due to their scarcity, their influence on the results presented and discussed here is considered negligible. Experiments were conducted using ultrapure H2O (Millipore-MilliQ®, resistivity = 18.2 MΩ·cm), 0.1 M HCl (Scharlab S.L., Barcelona, Spain), and NaHCO3 (Sigma-Aldrich, Merck, Darmstadt, Germany).
The catalysts used in the present study are CA from bovine serum erythrocytes (Sigma-Aldrich, Merck, Darmstadt, Germany) and three different Zr-based MOFs—namely, UiO-66, MOF-808, and MOF-808@Mg(OH)2 (Figure 1)—synthesized at the Department of Inorganic Chemistry of the University of Granada. Catalysts were tested individually and experiments were repeated three times to ensure reproducibility.

2.2. Carbonation Experiments

Carbonation experiments involved the initial dissolution of wollastonite and the subsequent precipitation of calcium carbonate. To investigate such coupled dissolution–precipitation reactions taking place during the overall carbonation reaction, Falcon® tubes (Vtot = 15 mL) were filled with 50 mg of wollastonite crystals and 10 mL of a 0.1 M NaHCO3 aqueous solution acidified to pH 7.5 (using HCl). At this pH a significant fraction of bicarbonate ions will be present as dissolved CO2(aq). This ensures that the addition of CA catalyst used to speed up the hydration of CO2 to form bicarbonate ions is still a relevant reaction in our system. Inorganic carbon lost due to CO2 degassing at this pH (standard temperature and pressure, STP) should be lower than the maximum of 5 mol % reached at equilibrium, as predicted by PHREEQC computer simulation (version 3.3.12, USGS, Reston, VA, USA) [81]. CA was added to the solutions at a concentration of 6 µM (175 ppm). The Falcon® tubes were sealed with Parafilm® and inserted into a thermostatic chamber equipped with an orbital rotator to maintain the particles in suspension. Experiments were performed at 40 °C under vigorous stirring (200 rpm). To analyze the evolution of the mineral replacement reaction, Falcon® tubes were collected at pre-set reaction time intervals and centrifuged (5 min, 2500 rpm) to separate the solids from the supernatant. Both the liquid and solid phases were subsequently analyzed (see below).

2.3. Dissolution Experiments

In order to single out the effect of the studied catalysts on the first stage of silicate carbonation (i.e., silicate dissolution), tests were performed focusing on the dissolution of wollastonite in the absence of a carbon source. Dissolution experiments were performed using PTFE (polytetrafluoroethylene) reactors. As in the previous case, plastic reactors were used to avoid potential silicon contamination from borosilicate glassware. The dissolution process was monitored using an automatic titration system (Titrando 905, Metrohm, Gallen, Switzerland) equipped with an automatic burette (Vtot = 2 mL, Metrohm, Gallen, Switzerland), pH and conductivity probes (Metrohm, Gallen, Switzerland), and an ion selective electrode for calcium (Ca2+ ISE, Mettler Toledo, Twinsburg, OH, USA). The instrument was controlled with the Tiamo software (version 2.5, Metrohm¸ Gallen, Switzerland) to achieve a pH-stat system where the pH increase due to silicate dissolution was compensated by the addition of the proper amount of HCl. Dissolution tests were run at 25 ± 1 °C (this T was selected to be able to compare dissolution rates with those previously published) and at a constant pH of 4. The reaction vessel was filled with 169.8 mL H2O, the catalyst (30 ppm) and the necessary HCl to achieve pH 4 (about 0.15 mL). Such a relatively low pH was selected to speed up the dissolution of wollastonite and to minimize CO2 dissolution in the reaction cell. After pH stabilization, wollastonite crystals (100 mg) were added to the solution and dissolution started. After 1 h elapsed time, the experiment was stopped and the solution was filtered under low-vacuum (Millipore®, φ < 0.2 μm) to recover the reacted wollastonite crystals. Crystals were stored in sealed plastic vials until further analysis.

2.4. Characterization of Reactant/Product Phases and Geochemical Modeling

Reactant and product solid phases were analyzed by means of X-ray diffraction (XRD, PANalytical X’pert Pro, Eindhoven, The Netherlands); Cu kα radiation (λ= 1.5405 Å), voltage 45 kV, current 40 mA, 3–80° 2θ exploration range and 0.01° 2 θ s−1 scanning rate). Detailed µ-XRD analyses of individual reacted wollastonite crystals were performed using a Bruker Discover8 (Bruker, Karlsruhe, Germany) microdiffractometer equipped with a Cu microfocus X-ray source and a 2D area detector, which enabled obtaining better XRD patterns in the cases of reacted wollastonite (i.e., with a higher signal to noise ratio). Textural and compositional details were analyzed using a field emission scanning electron microscope (FESEM) (FEI Qemscan 650F, Hillsboro, OR, USA and/or Zeiss Auriga, Jena, Germany) equipped with energy dispersive X-ray spectroscopy (EDS) for elemental analysis. To quantify the final ratio between residual wollastonite and newly formed CaCO3 we used thermogravimetric analysis (TG/DSC1, Mettler Toledo, Twinsburg, OH, USA) according to the procedure described by Huijgen et al. [29]. The concentration of Ca and Si in the aqueous phase during carbonation experiments was analyzed by ICP-OES (Optima 8300, Perkin Elmer, Waltham, MA, USA). In the case of the dissolution-only experiments, the free Ca was determined using the ion-selective electrode and Si calculated from HCl addition using the equation
m L H C l · c o n c H C l ( = m m o l H C l ) 2 = m m o l H 2 S i O 4 2     m m o l C a 2 + = c o n c C a 2 + · V t o t
where mLHCl = volume of HCl (mL) automatically dosed to keep a constant pH, concHCl = concentration of HCl solution (mmol∙mL−1), concCa2+ = concentration of free Ca measured by the ISE (mmol∙mL−1), mmolH2SiO42− = amount of silicate ions released by the mineral (mmol), mmolCa2+ = amount of Ca ions released by the mineral (mmol), and Vtot = total volume of the solution (L).
Geochemical calculations and solution speciation were performed using PHREEQC computer code (version 3.3.12, USGS, Reston, VA, USA) and the minteq.dat database [81].

3. Results

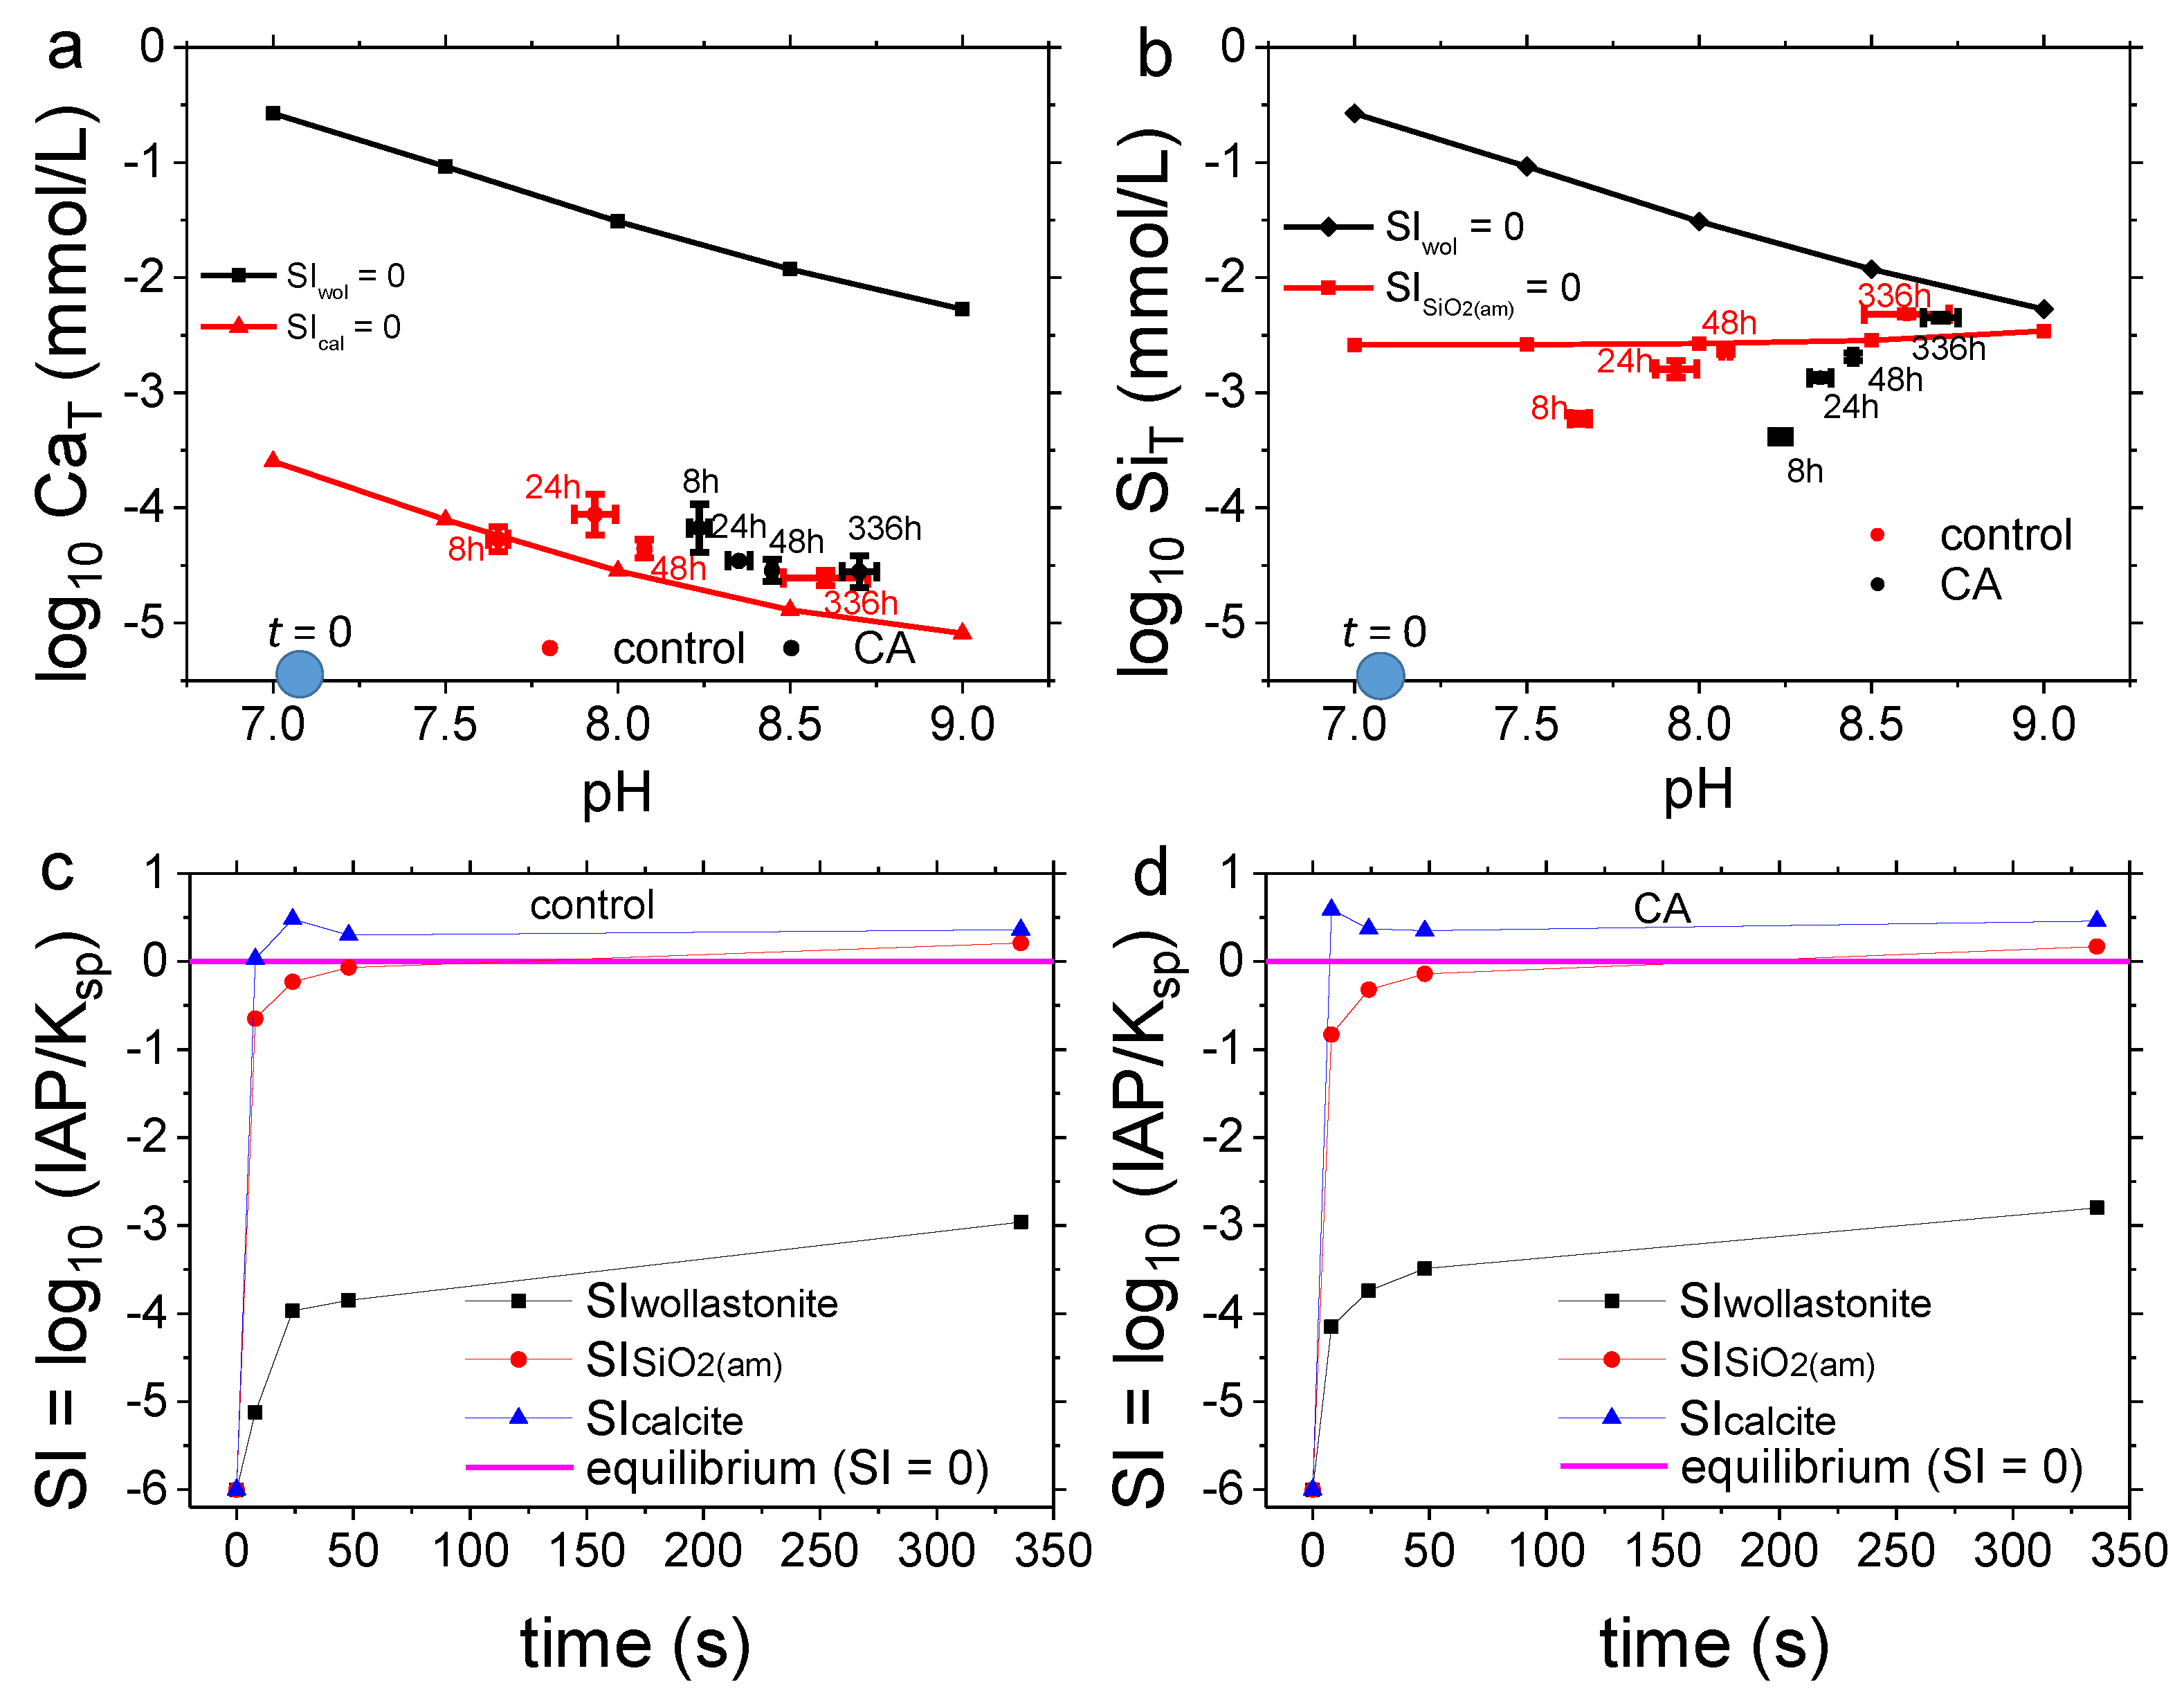
3.1. Carbonation of Wollastonite in the Presence of CA

Figure 2 shows the time-evolution of the Si and Ca concentration in solution during carbonation experiments determined by ICP-OES analysis. Systems with and without CA followed the same trend. The Si concentration increased continuously with time during the carbonation experiments due to its continuous release from dissolving wollastonite. However, the Si release rate decreased with time, pointing to the precipitation of amorphous silica on wollastonite surfaces and their partial passivation—also associated with calcite precipitation (see below). In contrast, the Ca concentration reached a maximum during the first 8–24 h of the experiments and then decreased. This drop was related to calcite precipitation as demonstrated by the XRD analysis (Figure 3). Note that the molar Ca concentration measured at 24 h was already one order of magnitude lower than that of Si. However, previous studies showed that wollastonite dissolution over a range of pHs is non-stoichiometric (apparently incongruent, although related to the secondary precipitation of silica-rich layers, see References [42,43]), with the release rate of Ca being higher than that of Si [42,66,70,72,77]. Our Ca and Si analysis results thus suggest that carbonate precipitation was already taking place before 24 h. This was confirmed by SEM-EDX analyses (see below).
The time evolution of both aqueous Si and Ca concentrations showed the effect of CA. The amount of Si released after wollastonite dissolution was slightly lower than in the control during the whole carbonation experiment, which may imply a (minor) inhibitory effect of this enzyme on wollastonite dissolution and/or a passivation-induced effect (see discussion below). In the case of Ca, its decrease in concentration occurred earlier and faster in the presence of the enzyme. This is in agreement with previous studies reporting that CA catalyzes calcite precipitation [31,39].
Figure 2c shows the pH evolution during the carbonation test. A rapid increase in pH took place during the early stages of the dissolution process, which is consistent with the reported proton consumption that takes place during dissolution of primary silicate minerals [10]. Interestingly, after 48 h, the pH continued to increase, although at a much lower rate, when calcium carbonate precipitation had already started. Note that carbonate precipitation releases one mole of H+ per mole of CaCO3 formed [27]. This would result in a net pH reduction. In contrast, the observed continuous increase in pH can only be explained if wollastonite dissolution continued over the course of the carbonation experiment, consuming two moles of H+ per mole of wollastonite dissolved via the (overall) reaction CaSiO3 + 2H+ + H2O = Ca2+ + H4SiO4 [67]. Figure 2c also shows a faster and higher pH increase in the presence of CA compared with the control run. This could be due to either a faster dissolution of wollastonite associated with an esterase-like catalytic effect of CA (see, however, the results of the dissolution tests, below), or (more likely) a possible CA-catalyzed dehydration of HCO3 resulting in (limited) CO2 outgassing.
TG analyses enabled us to determine the extent of the replacement process (Figure 4). The amount of calcite formed was determined by the mass loss between 550–800 °C (Figure 4a), which corresponds to the loss of CO2 from structural carbonate ions [82]. The amount of calcite formed after 14 days reaction in the presence of CA was systematically lower (6.6 ± 1.5 mol %) than in the control experiments (13.9 ± 2.2 mol %) (Figure 4b).
The TG results are consistent with the XRD results showing more intense calcite Bragg peaks in the control run as compared with the CA run, and the opposite in the case of wollastonite (Figure 3). TG (and XRD) results also show that only a minor fraction of wollastonite was converted into calcium carbonate (i.e., maximum conversion of ~15 mol %) at the circumneutral pH, relatively low T (40 °C) and short time-spam of the experiment (14 days). These results show that CA does not seem to be a suitable catalyst for the overall carbonation of wollastonite under our experimental conditions. Despite its observed acceleration of carbonate precipitation, the overall effect of CA was to limit the conversion of wollastonite into CaCO3.
Figure 5 shows FESEM images of the very early stages of the carbonation of wollastonite crystals (i.e., 8 h reaction time). It was observed that regardless of the presence or absence of CA, abundant dissolution pits formed on the different faces of the prismatic crystals, being more abundant and better developed on {100} prismatic faces (Figure 5b,d,e). Such dissolution pits were elongated parallel to [010], with narrow sidewalls parallel to (001) planes and, in more evolved pits, deep along [100] direction. This clearly shows that the dissolution for this mineral is markedly anisotropic (i.e., faster along [010]). Note that {100} and {001} prism faces of wollastonite are easily identifiable because the later display prominent {100} cleavage planes parallel to the [010] direction, whereas {001} cleavage planes present on {100} faces are less marked (or absent) [65]. Nearly all the crystals only showed these two prismatic faces, which are the most common (stable) prismatic faces of wollastonite [65]. Any other {h0l} prismatic faces, such as {101}, which should be easily identified because it appears at an angle of ~45° with respect to the {100} and {001} faces, were not observed in our samples. This is likely due to the fact that the wollastonite crystals used here were subjected to grinding prior to testing, thereby promoting their cleavage along the {100} and {001} cleavage planes. In some cases, coalescence of deep dissolution pits led to a rough surface with prominent pyramidal hillocks, more evident in sections normal to {100} cleavage planes (Figure 5e). In all cases, abundant Si-rich (according to EDS results) nanogranular precipitates corresponding to amorphous silica [28], were observed covering areas close to dissolution pits (Figure 5b,c,f). Individual nanoparticles were ~20–30 nm in size (Figure 5c), and tended to coalesce forming SALs, as those depicted in Figure 5f, where the individual nanoparticles were still visible. The Si-rich nanoparticles making up SALs observed here were nearly identical to the amorphous silica nanoparticles observed by Béarat et al. [44] on olivine crystals subjected to carbonation and developing abundant SALs.
At such an early stage of reaction, calcite crystals (identified by their habit and Ca content in EDS maps) were already present and in some areas—such as cracks, edges of macrosteps, cleavage planes, and {010} faces—they were particularly abundant (Figure 6). Remarkably, in the presence of CA, calcite precipitates tended to coalesce forming a layer of equally oriented crystals on the {100} faces of wollastonite (Figure 6f,g).
Figure 7 and Figure 8 show time-resolved SEM photomicrographs of samples carbonated for 1, 2, and 14 days in the absence and presence of CA, respectively. Backscattered electron images in combination with EDS elemental maps allowed us to distinguish between wollastonite (light grey), amorphous silica (grey) and calcite (dark grey) due to their compositional differences. Irrespectively of the presence or absence of CA, Si-rich layers corresponding to SALs were observed as rims in proximity of etch pits and/or lining fractures and cleavage planes on wollastonite faces. They were predominantly concentrated on {010} and {100} faces of wollastonite, as previously observed in this mineral that shows anisotropic dissolution [42].
It was remarkable the thickness (up to ~5 μm) reached in just 14 days by SALs developed on the {010} faces of wollastonite (Figure 7d and Figure 8e). It was also noticeable how on {001} faces SALs developed along {100} cleavage planes and grew (thickened) in directions normal to these planes (i.e., <100>) and along <010> directions (Figure 8e,f). These results show that SALs preferentially grow along the <hkl> directions where wollastonite dissolution is apparently fastest (i.e., <010> and, to a lesser extent, <100>).
Irrespectively of the presence or absence of CA, most calcite crystals appeared with a poorly defined habit during the initial stages of reaction (one and two days) (Figure 7a,b and Figure 8a–d). Ageing favored morphology development of calcite crystals and their growth. Over time, calcite aggregates formed thick coatings, particularly thick on wollastonite {010} and {100} faces. In the case of the control, thick aggregates (up to ~40 μm in thickness) of elongated prismatic calcite crystals growing nearly normal to {100} faces, and almost parallel to {001} faces, were observed after 14 days (Figure 7c). Figure 7d shows the EDS compositional map overlapped on the secondary electron image of a control wollastonite reacted for 14 days: the distribution of Si and Ca helped us to identify areas where SALs and calcite crystals developed, validating the phase assignation by backscattered electron images. In the presence of CA, we observed calcite crystals growing on top of wollastonite, especially on {010} (Figure 8a) and on {100} faces (Figure 8b). The carbonate coatings showed calcite crystals with rough, and stepped faces made up of an aggregate of nanoparticles, especially during the first days of reaction (Figure 8c). Calcite crystals with a clearly defined rhombohedral habit were observed after 14 days reaction time (Figure 8e,f). The thickness of these dense calcite layers varied between ~10 and ~40 μm and, irrespectively of the presence or absence of CA, they were preferentially formed on {010} and {100} faces of wollastonite, thereby tending to concentrate where SALs were more abundant and better developed. Interestingly, one of the Bragg reflections that experienced a more significant relative intensity reduction following 14 days carbonation was that corresponding to (200) planes (Figure 3). This is consistent with the masking effect induced by massive calcite precipitation on the {100} faces observed with FESEM. Note, however, that changes in the relative intensity of different wollastonite Bragg peaks have to be interpreted with caution due to the possible preferred orientation of such fibrous/prismatic crystals. In any case, these observations suggest that calcite crystals nucleated on the areas where most active dissolution of wollastonite and surface precipitation of amorphous silica was taking place. Calcite and amorphous silica precipitates thus appear to be acting as passivating layers, precisely where most active dissolution of wollastonite was taking place. This can help explain why the Si release rate and the rate of pH rise showed a continuous decrease over the time-span of the experiment, and why the conversion of wollastonite into calcite was so limited.

3.2. Dissolution Experiments

A fast protocol was designed in this work to test the effects of a range of potential catalysts on silicate dissolution kinetics. It allowed the online recording of free Ca2+ concentration measured by a Ca-ISE and the dosed amount of HCl necessary to maintain a constant pH of 4. The time evolution of these two experimental values enabled us to calculate the amount (mmol) of H2SiO42− and Ca2+ released during the dissolution process (Figure 9a,b).
The total amount of ions released to the solution varied almost linearly with time after an initial stage (less than five minutes) when the dissolution rate slightly decreased. This is likely due to the progressive elimination of the most reactive areas/sites of the fresh wollastonite crystals, although a partial, limited passivation by the early formation of SALs cannot be ruled out (see Ruiz-Agudo et al. [42]). Control experiments were performed up to 35,000 s and only a very slight or negligible change in the slope of Ca release curves was observed after this initial rapid reduction in the dissolution rate. The very minor divergence from a straight line that we observed was due to the fact that as soon as dissolution starts, ion concentration raises and the related change in the ionic strength induces a very minor difference between the free Ca2+ measured by ISE and the total Ca released by the mineral. These results are in agreement with those of Bailey and Reesman [66] who showed that, at a constant pH of 4, the concentration of Ca released after dissolution of wollastonite (at 25 °C, in the absence of CO2) increases linearly with time. Our results also suggest that the SALs that reportedly form at this pH [28,42,72] do not seem to act as an effective passivating layer, at least during the relatively short time-span of our dissolution experiments.
Figure 9a,b shows that UiO-66 MOF induced a faster release of Ca2+ and H2SiO42− than the control. The effect of CA was the opposite: it decreased the release rate of these ionic species as compared with the control. The two other tested MOFs did not show any significant difference as compared with the control (data not plotted in Figure 9a,b for the sake of clarity).
From these results, the actual dissolution rates of wollastonite were calculated considering the 1000–3500 s interval (Figure 9c). The rate constants for wollastonite dissolution in the absence and presence of the different catalysts tested were calculated considering the average BET surface area of unreacted wollastonite crystals and are reported in Figure 9d and Table 1. UiO-66 achieved a moderate catalytic effect on wollastonite dissolution. The other MOFs (MOF-808 and MOF-808@Mg(OH)2) showed no significant catalytic effect. Dissolution experiments confirmed that despite its structural and chemical similarity to silicase, CA had no catalytic effect on this process. In fact, CA showed a weak inhibition effect confirming that the observed catalysis of the carbonate precipitation reaction achieved by using this enzyme (see above), appears to be the results of its ability to increase the availability of carbonate ions, but not because it can enhance silicate dissolution. Figure 9c,d also shows that dissolution rates calculated independently using free Ca2+ and dosed HCl (i.e., for neutralization of H2SiO42− to form H4SiO4) were identical within experimental error.

4. Discussion

4.1. Carbonation of Wollastonite

The time evolution of the aqueous Ca and Si concentrations are fundamental parameter to understand the chemistry of our mineral–solution system. In the case of calcium, it was determined by the relative rates of Ca supply via wollastonite dissolution and Ca consumption via calcite precipitation. Figure 10a shows calculations using PHREEQC, which demonstrate that in our system, the Ca concentration necessary to achieve equilibrium with respect to wollastonite (black line) was more than three orders of magnitude larger than that at equilibrium with calcite in a 0.1 M NaHCO3 solution at 40 °C (red line). This is reflected in the calculated values of SIwollastnite (saturation index, SI = lg(IAP/Ksp), where IAP is the ion activity product and Ksp is the solubility product of a particular phase), which are below 0 for the whole duration of the experiment (Figure 10a,b). This is also reflected by the affinity values (i.e., free energy of reaction, ΔG = −R∙T∙ln(IAP/Ksp), where R is the gas constant and T = 313 K) presented in Table 2. Such a degree of undersaturation (i.e., very high negative ΔG values) favored wollastonite dissolution throughout the whole time-span of the carbonation experiment and favored the precipitation of calcite. The competition between silicate dissolution and carbonate precipitation reactions implies that the actual time-evolution of Ca concentration depends on the relative rates of these two processes. During the initial stages of the reaction the most reactive sites of wollastonite crystals (point defects, kinks, and step edges) would significantly contribute to the initial high rates of calcium and silicon release [42]. However, after 8 h, the system was already supersaturated with respect to calcite in the presence (SIcalcite = 0.59; ΔG = 3.3 ± 1.3 kJ∙mol−1) and in the absence of CA (SIcalcite = 0.03; ΔG = 0.1 ± 0.7 kJ∙mol−1). The fact that in the CA-bearing system the SIcalcite (and ΔG) was significantly higher at an earlier point in time than in the control (compare Figure 10a,c; see also Table 2) demonstrates that CA acted as a catalyst for calcite precipitation. Massive calcite precipitation, especially after 48 h, led to the observed Ca depletion in the solution (Figure 10a) and the reduction in the supersaturation with respect to calcite (Figure 10c,d). This behavior demonstrates that the rate-controlling step in the overall carbonation reaction after calcite starts forming is the dissolution of the silicate. This is consistent with previous studies on the carbonation of wollastonite [27]. Nonetheless, it should be pointed out that the pool of aqueous Ca was not fully consumed during the experiment. Indeed, the solution remained supersaturated with respect to calcite, irrespectively of the presence/absence of CA. This means that equilibrium with respect to wollastonite is unachievable under these conditions (after two weeks, SIwollastonite = −2.96 and ΔG = −17.8 ± 1.2 kJ∙mol−1 for the control and SIwollastonite = −2.80 and ΔG = −16.9 ± 0.3 kJ∙mol1 in presence of CA). As a result, wollastonite continued to dissolve throughout the whole time-span of the experiment, although at a lower rate than during the early stages. It could be argued that this is due to a reduction in the SI (and ΔG) associated with the observed increase in pH taking place over the course of the experiments. However, as indicated above, the precipitation of amorphous silica and calcite kept the system undersaturated with respect to wollastonite at a very high value, consistent with the above reported SI and ΔG values. This should enable wollastonite dissolution and carbonation to progress at higher rates than those observed. A partial passivation of the silicate surface due to both the secondary precipitation of an amorphous silica layer or SAL, especially on the most reactive sites (defects, steps, and cleavage zones) of the most reactive (hkl) faces of wollastonite [42,77], and the heterogeneous precipitation of calcite on the silicate surface and/or SALs [26,27] can explain the observed reduction in dissolution and carbonation rates. A passivation effect can also explain why under very similar SI and ΔG conditions, the carbonation rate (and carbonate yield) is smaller in the case of the CA run as compared with the control run. Note that although it has been reported that SALs developed on wollastonite are not necessarily “passivating” layers [27,66], over time they can undergo ageing by condensation/repolymerization [69], forming a more dense and less porous layer that may actually act as a diffusional barrier [29,49], especially if secondary precipitates such as Ca-phyllosilicates and Ca-carbonates form within the SALs [26,27]. Recent results by Daval et al. [77] show that while on some faces of wollastonite (e.g., (010)) SALs do not act as diffusional barriers, on other faces (e.g., (001)) they can actually form passivating layers because in this later case SALs densify with time, leading to an overall (although minor) reduction in the dissolution rates on such specific faces, typically the less reactive ones showing the slowest initial dissolution rate.
In our system a steady-state “equilibrium” between wollastonite dissolution and calcite precipitation was achieved. At this steady state, the precipitation of calcite and its growth continued, but at a relatively slower rate due to the lower supersaturation of the system (SIcalcite = 0.36 for the control and SIcalcite = 0.46 in the presence of CA). Note, that it has been experimentally shown that there is a positive relationship between SIcalcite and calcite growth rates [83,84,85]. This means that during the latter stages of the carbonation process, and after the rapid initial precipitation and growth of calcite at a relatively higher SIcalcite (i.e., maximum SIcalcite values of 0.48 and 0.59 for the control and CA systems) further growth of this carbonate will be limited by the supply of Ca released after the dissolution of wollastonite, whose complete passivation is not achieved during the experimental time-span.
The system was undersaturated with respect to amorphous silica during the early stages of the carbonation experiment (up to 48 h), being supersaturated after 14 days (Figure 10b–d; and Table 2). However, the formation of SALs at specific areas of the reacted wollastonite was already observed after 8 h from the start of the experiment. This is fully consistent with previous studies showing that amorphous silica can form SALs on dissolving wollastonite in systems where the bulk fluid is undersaturated with respect to this phase [42]. This led some researchers to propose that the formation of such SALs occurred by diffusion of Ca ions out of the wollastonite structure via an exchange with H+ coming from the solution, leaving behind a Ca-depleted amorphous silica layer, the so-called “leached layer”, leading to an apparent incongruent (non-stoichiometric) dissolution of this silicate [69,79]. However, it has been experimentally shown that dissolution of wollastonite over a range of pH conditions is in fact congruent and takes place via an interface-coupled dissolution–precipitation mechanism [42,43]. Dissolution occurs via etch pit formation and spreading, resulting in the actual stoichiometric release of Ca and Si. Such dissolution pits have been detected in our FESEM analysis (Figure 5, Figure 6, Figure 7 and Figure 8), spread during the course of the experiments and were blanketed by a layer (SAL) of silica nanoparticles deposited on their stepped faces. Precipitation of silica nanoparticles forming SALs on wollastonite, as shown here, can take place at the mineral–fluid interface were strong compositional gradients have been measured [43]. Such strong compositional gradients can lead to local supersaturation with respect to amorphous silica and its precipitation forming SALs, despite the fact that the bulk fluid is undersaturated with respect to this phase [42,43]. This is fully consistent with our experimental results and observations. Remarkably, such a compositional gradient also exists for the case of released Ca, so it was not unexpected that calcite precipitation also occurred preferentially on the areas where a more active dissolution is taking place, and where SALs are preferentially formed, as observed here. It follows that, as occurs in the case of SALs [42,43], calcite precipitation after wollastonite dissolution occurs via an interface-coupled dissolution–precipitation mechanism.
Importantly, thicker SALs can form in batch experiments and under acidic conditions, compared to those formed in flow-through experiments and under circum-neutral conditions [10,26,27]. Thus, it seems that parameters of the solution such as the composition or flow regime could ultimately dictate the formation or not of silica altered layers. While Schott et al. [79] reported that SALs do not form on wollastonite in mixed-flow reactors at 25 °C for pH > 4 (at a very high undersaturation with respect to amorphous silica), in our specific case, working at circumneutral conditions and using batch reactors, thick SALs formed after 14 days at 40 °C. In parallel, we observed a continuous reduction in the Si release rate, which demonstrates that a passivation effect was taking place. As indicated above, this effect cannot be only ascribed to the formation of SALs but also to the formation of thick carbonate coatings, specifically on the most reactive sites/surfaces of wollastonite. Our results are thus consistent with those of Daval et al. [27] who observed that passivation was due to the formation of SAL plus carbonate coatings. These authors indicated that the sole formation of SALs was not sufficient to induce significant passivation.
Remarkably, the progress of dissolution, degree of SALs development, and amount of heterogeneous carbonate precipitation on wollastonite were clearly face- and direction-specific. This is fully consistent with the fact that wollastonite has an anisotropic structure (Figure 11).
It has long been known that the anisotropic structure of many primary silicates strongly affects their dissolution rate along different crystallographic directions [86,87]. Acidic dissolution of silicates takes place via H-promoted attack to Si–O–Si bonds linking silica tetrahedra and M–O bonds of metal cations in octahedral coordination directly facing the solution. Protons adsorbed on the mineral surface can polarize the metal–oxygen bonds, thereby weakening the bonding with the underlying lattice [10]. As a result, metal-oxygen bonds are hydrolyzed, being the breaking of the strong Si–O bonds the rate controlling step for the dissolution of multicomponent silicate minerals [10].
Hydrolysis (i.e., proton-promoted Si–O bond breaking) of chain silicates would preferentially occur at the ends of tetrahedral chains where Q1 tetrahedra (i.e., SiO4 tetrahedra sharing one oxygen) and associated metal octahedra directly face the solution. In the case of wollastonite, such structural units are concentrated on the {010} faces (Figure 11c). In these faces, hydrolysis of one single oxygen bond linking two terminal tetrahedra would lead to the release of one Si (i.e., the terminal Q1 tetrahedron). In contrast, in the case of prismatic faces (Figure 11b,d), at least two oxygen bonds linking two Q2 tetrahedra (i.e., tetrahedra sharing two oxygens) have to be broken to release one Si tetrahedron, leaving behind two Q1 tetrahedra for dissolution to progress in opposite directions along the (now broken) tetrahedral chain. This explains why the {010} faces of wollastonite show the highest dissolution rate of all faces in this mineral [77]. This also helps explaining why dissolution progresses faster along <010> in wollastonite, as shown here by the elongated shape of dissolution pits formed on {100}, or along <001> in chain silicates such as diopside [88]. The prismatic faces of wollastonite reportedly show a lower dissolution rate as compared with the basal {010} faces [77]. Of the two main prismatic faces, {100} faces dissolve faster than {001} faces [77]. The higher reactivity of {100} faces as compared with that of {001} ones is consistent with the presence of a higher density of Q2 tetrahedra with Si–O–Si bonds directly facing the solution (compare Figure 11c,d). Those can be preferentially attacked by protons, leading to their hydrolysis. Daval et al. [77] suggested that an additional effect that can help explaining the faster dissolution along [010] and [100] is the higher density of outcropping dislocations on (010) and (100) faces, which would facilitate the progress of dissolution via a classic step-wave mechanism [89]. However, under far-from-equilibrium conditions such as those taking place in most reported wollastonite dissolution and carbonation experiments, dissolution rates would be controlled by etch pits nucleated at point defects, not by dislocations [90]. Indeed, our previous AFM studies of wollastonite dissolution in acidic solutions showed that dissolution of {100} faces progressed via the nucleation of abundant shallow etch pits and the subsequent retreat of their step edges (not by unwinding of steps at emerging dislocations) [42]. It follows that the most likely and straightforward explanation for the anisotropic dissolution of wollastonite is the distinctive structural differences along different [hkl] directions. Overall, the structural anisotropy of wollastonite is reflected by the highly anisotropic dissolution of this chain-silicate. This is a prominent feature of this mineral that has been previously underlined [42,43,77]. Because in the case of wollastonite, as well as several other silicates—such as olivine, pyroxenes, amphiboles, and feldspars where dissolution results in the formation of SALs—the dissolution step is tightly coupled at the mineral–fluid interface with the precipitation of a secondary amorphous silica phase (i.e., the nanoparticles observed here) and not to a diffusional leaching of Ca, the thickness and density of the SALs is directly related to the reactivity (dissolution rate) of the faces on which SALs develop, as shown by Daval et al. [77]. The authors observed that the dissolution rate R(hkl) of the main faces of wollastonite followed the trend R(010) > R(100) > R(001), as did the thickness of SALs. The relation between the structural features of silicates and their anisotropic dissolution and SALs development appears to be general, as also demonstrated by the anisotropic dissolution of olivine [46], diopside [88], and K-feldspar [91]. Overall, these results are fully consistent with our observations of the anisotropic progress of dissolution and SALs formation during wollastonite carbonation.
More significantly, carbonate precipitation on wollastonite surfaces was also anisotropic. Calcite crystals were concentrated primarily on {010} and {100} wollastonite faces, forming thick coatings. This appears to be directly related to the higher rate of dissolution of these specific faces, which can lead to a faster release of Ca and the subsequent build-up of a high supersaturation with respect to calcite in the solution at the mineral–fluid interface. This can result in the coupling of both the formation of SALs and the subsequent precipitation of calcite via an interface-coupled dissolution–precipitation mechanism. This is consistent with results reported by Daval et al. [26,27], showing that at circumneutral conditions calcite tends to form on and within SALs developed on wollastonite subjected to carbonation, thereby acting as a passivating coating. In our case, the formation of SALs plus calcite passivating coatings on the most reactive {010} and {100} faces helps to explain the observed drastic reduction in the Si release rates and the very limited carbonate yield.
Regarding the effect of CA, our results show that its main role during carbonation of wollastonite is the acceleration of calcium carbonate precipitation. CA also seems to affect the morphology of the precipitates due to its adsorption on specific calcite (hkl) faces. The latter results in rhombohedral calcite crystals with stepped, rounded edges and an overall nanogranular surface structure. This is likely due to adsorption of this protein via interaction of its deprotonated carboxylic groups (at the alkaline pH conditions reached during carbonate precipitation) on terraces and growth steps of calcite. CA can thus induce step pinning, poisoning crystal growth along specific [hkl] directions, and thereby altering the overall morphology of calcite crystals [85]. Moreover, the nanogranular surface structure is consistent with non-classical aggregation-based growth mechanisms (possibly via an amorphous calcium carbonate precursor) promoted by the presence of this organic additive [84,85]. In contrast, we observed no silicase-like catalytic effect of CA on wollastonite dissolution, which was the rate-limiting step of the overall carbonation process. Actually, the overall CA effect was to limit the extent of carbonation. This appears to be due to an enhanced passivation effect associated with the very fast, early precipitation of calcite on the most reactive sites and faces of wollastonite. Passivation was more effective than in the case of the control because: (i) CA induced the formation of calcite coatings on specific faces of wollastonite such as the reactive {100} faces, as shown by our SEM observations. This is likely due to a template effect exerted by adsorbed CA on such specific faces that favors the heterogeneous and oriented nucleation (possibly epitaxial) of calcite forming a continuous surface layer, as described for the case of other minerals such as sulfates growing epitaxially on calcite following the formation of an organic template on the calcite substrate [92], and (ii) the higher supersaturation reached in the presence of CA at the early stages of carbonate formation, compared to the control, leading to a higher nucleation density. Such a higher density of calcite crystals nucleated on specific faces of wollastonite (i.e., the most reactive ones) favored the development of a passivating layer. As discussed above, the precipitation of abundant calcite along with SALs on wollastonite has a strong passivation effect [26,27].

4.2. Dissolution Experiments

The dissolution of wollastonite (CaSiO3) could be described by Equations (2) and (3),
CaSiO3 + H2O ↔ Ca2+ + H2SiO42−
H2SiO42− + 2H3O+ ↔ H4SiO4 + 2H2O (for pH < 10)
these reactions are strongly pH-dependent, as shown by Figure 12a. Figure 12a shows a PHREEQC simulation of the amount of wollastonite dissolved at different pH values after 10 mol of wollastonite were added in 1 L of water. It is shown that at pH > 9 almost no wollastonite is dissolved. Conversely, at pH < 9 a significant fraction of the dosed wollastonite is dissolved. For instance, at pH 4 about 50% of dosed wollastonite is dissolved. During dissolution, the release of SiO32−, that instantaneously hydrates in water to form H2SiO42−, corresponds to the addition of a strong base to the solution (i.e., Equation (2)). The resulting pH increase would hinder further dissolution (Figure 12a). However, in our dissolution experiments, the increase in pH induced by the dissolution of CaSiO3 was compensated by the addition of HCl to keep a constant pH of 4. This enabled dissolution at a constant rate, thereby avoiding the inhibition effect induced by the increase in pH. On the one hand, by measuring the free Ca2+ concentration using the ISE electrode, we could measure the Ca release rate and the (Ca-based) dissolution rate of wollastonite (RCa). Note that at pH 4, the total concentration of calcium can be reasonably approximated by the free ion concentration [Ca2+] recorded with the probe due to the weakness of the ion pairing constants for Ca2+ in acidic media (Figure 12b). On the other hand, the amount (mol) of HCl added during the experiments corresponded to half of the SiO32− dissolved from the crystals because, at the experimental pH, the most stable species of silicate ion is the orthosilicic acid, H4SiO4 (Figure 12c) that forms according to Equation (3). Overall, two protons per mole of Si released to the solution were consumed. From the dosed amount of HCl, the dissolution rate of wollastonite R H 2 SiO 4 2 was thus also determined.
We have chosen to represent the dissolution of wollastonite according to Equations (2) and (3) for the sake of clarity and to underline that proton consumption is associated with the release of Si species. Note, however, that from a mechanistic point of view, Equation (2) might imply that dissolution of wollastonite is not proton-promoted, but rather occurs via direct nucleophilic attack by water followed by proton consumption according to Equation (3) once a Si species is released. This is not what Equations (2) and (3) are intended to represent, because both should be coupled into one single event in order to enable the proton-promoted stoichiometric dissolution of wollastonite, as we have shown to occur previously [42,43]. A more accurate description of the overall proton-promoted dissolution of wollastonite integrating Equations (2) and (3) would thus be the following equation,
CaSiO3 + 2H3O+ ↔ Ca2+ + H4SiO4 + H2O
regardless whether we considered the coupled Equations (2) and (3) or the overall Equation (4) to describe wollastonite dissolution, we want to stress that proton consumption is related to the release of highly basic Si species and their neutralization to form H4SiO4.
It is worth noting that the process of silicate carbonation relies on the combination of a H+ consuming process (silicate dissolution) and a H+ releasing process (carbonate precipitation). This coupling prevents both reactions from self-inhibition. The latter explains why in our carbonation experiments equilibrium was never reached, despite the observed reduction in the rates of wollastonite dissolution and carbonate precipitation.
The dissolution rates RCa (1.28 ± 0.14 × 10⁻⁸ mol∙m−2∙s−1) and R H 2 SiO 4 2 (1.19 ± 0.11 × 10⁻⁸ mol∙m−2∙s−1) of wollastonite at pH 4 obtained using our experimental set up are in good agreement with the RCa values of ~0.9–3.2 × 10⁻⁸ mol∙m−2∙s−1 (based on Ca release rate and normalized to the initial surface area) reported by Weissbart and Rimstidt [72] and Schott et al. [79] for experiments conducted at pH 4 and 25 °C, as well as the RCa value of ~0.5 × 10⁻⁸ mol∙m−2∙s−1 reported by Ruiz-Agudo et al. [42] (RCa value interpolated here to pH 4 from the results corresponding to the pH range 1.5–5.9). This gives us confidence about the reliability of our method to test silicate dissolution kinetics. Our values are, however, about one order of magnitude lower than those reported by Daval et al. [77] for (100) and (010) faces dissolved in batch reactors at pH 4 and 22 °C, but they approach the values reported by the authors for the case of (001) face (i.e., the less reactive face of wollastonite, as also shown here). As pointed out by Daval et al. [77], our lower rates and the lower rates reported in the literature could be simply due to the preponderance of the {001} faces in powdered wollastonite. Hence, RCa reported for powder samples would tend to approach the RCa of the (001) face.
The very good agreement between the dissolution rates measured using free Ca and dosed HCl shows that the dissolution of wollastonite under our experimental conditions is stoichiometric, despite the fact that SALs reportedly form during wollastonite dissolution at pH 4 [77]. Note that amorphous silica precipitation from dissolved H4SiO4, does not affect pH; therefore, its precipitation and the formation of SALs would not affect the dosed HCl. The observation of stoichiometric wollastonite dissolution is fully consistent with our previous studies demonstrating that the acid-promoted dissolution of this silicate is congruent and therefore stoichiometric [42,43]. The apparent incongruent dissolution of wollastonite, resulting in the reported non-stoichiometric release of Ca and Si [42,72,77], is due to the above-mentioned SAL formation via an interface-coupled dissolution–precipitation mechanism, leading to the reduction in the amount of Si in solution compared with Ca. This is a side-effect due to amorphous silica precipitation, not a consequence of a hypothetical incongruent and non-stoichiometric dissolution process. We are, however, aware of the fact that dissolution of wollastonite via the ion interdiffusion mechanism described above [69], would also lead to the same results using our experimental dissolution protocol. Nonetheless, an interdiffusion mechanism would not explain all the textural features of wollastonite dissolution and SALs formation shown here and elsewhere [42,43,77], such as the formation of dissolution pits, the advancement of dissolution along specific [hkl] direction (at different rates), or the formation of amorphous silica nanogranular precipitates and their coalescence to form SALs.
Because no carbonate precipitation took place during the dissolution experiments, the dissolution rate was nearly constant over the time spam of the experiment, despite our previous observations that at such pH, SALs formed [42]. These results demonstrate that under our experimental conditions SALs did not act as effective passivating layers, although they seem to play a role in the slight reduction of the dissolution rate observed at the very early stages of the dissolution experiments. Note, however, that under different experimental conditions SALs formed on wollastonite during acid dissolution can act as a passivating layer [42]. Similarly, SALs formed during dissolution of other silicates such as olivine, reportedly act as passivating layers [44,46,88]. It follows that the passivating (or not passivating) effect of SALs is experimental and mineral-specific.
Our dissolution experiments disclosed that CA has no catalytic “silicase-like” effect on the dissolution of wollastonite. Actually, CA slightly reduced the dissolution rate of this silicate. This could be explained considering that the backbone of this protein includes numerous carboxylic groups that may likely favor its adsorption (for instance, via H-bonding) to the surface of wollastonite, as indicated above for the case of calcite precipitation, thereby acting as a passivating organic surface coating. However, adsorption is likely not a general phenomenon due to non-favorable (negative) charging of the protein functional groups and the wollastonite surface [79] at the experimental acid pH. This may explain why the inhibitory effect is so reduced. In any case, it is surprising to find out that despite the compositional and structural similarities between CA and silicase, the former does not enhance silicate dissolution whereas the later does [50]. It seems that there are some subtle structural differences between these two enzymes that determine their specific catalytic activity. Future studies should focus on disclosing such structural differences, which may help to explain why silicase can catalyze Si–O bond breaking and CA cannot.
Regarding the dissolution-enhancement observed in the case of UiO-66 MOF, it is likely that the Lewis acidic Zr and basic hydroxide sites present on the surface of this compound [60] directly interacted with the surface of wollastonite favoring the hydrolysis of Si–O–Si bonds, thereby increasing the dissolution rate of the silicate by ~10%. This increase is, however, modest, most probably because the crystalline (insoluble) MOF particles used here, with a relatively large size (intergrown cubic crystals with size ~1–2 µm) [60], were not efficiently interacting with the surfaces of wollastonite crystals. We are currently working on ways to bypass this handicap, preparing nanosized MOFs, with higher amounts of metal nanoclusters, to foster reactivity.
Finally, we have to state that these results demonstrate that the experimental protocol presented here for the determination of dissolution rates of silicates and used to screen the effect of natural and biomimetic catalysts on the dissolution of wollastonite is simple and highly reliable, and could be used as a routine protocol for the screening of other (bio)catalysts.

5. Conclusions

The present study reports two types of experimental studies aimed at observing the possible catalytic effect of CA and Zr-based MOFs toward the reaction of replacement of a silicate mineral (wollastonite) into a carbonate (calcite). The first set of experiments involved the whole carbonation process. Wollastonite crystals were put in contact with concentrated bicarbonate solutions, in the presence and absence of CA. Our analysis of the evolution of the carbonation reaction shows that the dissolution step progresses anisotropically along the different faces of wollastonite exposed to the solution. Dissolution was coupled to the precipitation of amorphous silica nanoparticles which formed thick SALs on specific faces of the silicate, i.e., mainly on the {010} and {100} faces. Those faces were the most reactive ones. Similarly, precipitation of calcite on reacted wollastonite preferentially occurred on the areas where dissolution progressed at a faster rate. The thick SALs and carbonate coatings formed on the most reactive surfaces of wollastonite acted as passivating layers leading to a significant reduction in the dissolution and carbonation rates over the time-course of the experiment. Such a passivating effect helps explaining why the conversion of wollastonite into calcite was so limited (up to 14 mol %) under our experimental conditions. Our study also demonstrates that CA is not effective at catalyzing such a reaction probably because its main catalytic effect involves the hydration of carbon dioxide while the rate-determining step of the process is calcium release to solution by wollastonite dissolution. For this reason, we decided to search for more effective biomimetic catalysts to speed up the dissolution of the silicate mineral. To screen their effectiveness, we designed and validated a new test to study the dissolution rate of wollastonite crystals in water using an automatic titration system. The protocol was used to evaluate the catalytic effect exerted by three different Zr-based MOFs. The results were compared with the uncatalyzed system and with CA. Our experiments revealed that only UiO-66 MOF induced an increase of the wollastonite dissolution rate. It is important to note that under the experimental conditions tested (T = 25 °C and pH = 4), CA did not demonstrate any catalytic effect on wollastonite dissolution (whose rate decreased in the presence of this enzyme) an observation that could seem unexpected considering the biochemical similarity between CA and silicase. Further studies will be performed to test the catalytic effect of novel materials on silicate dissolution using the fast and reliable protocol designed and validated here. Finally, the study of the different stages that constitute the process of silicate replacement by carbonate offers the possibility to discover catalysts active on a specific reaction step and the possibility to use combination of catalysts with a synergic effect for a more effective CCS.

Author Contributions

E.R.-A., J.A.R.N., and C.R.-N. conceived and designed the experiments; F.D.L., C.R.-A., and A.I.-V. performed the experiments; E.R.A., F.D.L., and C.R.-N. analyzed the data; J.A.R.N. and R.G.-S.M. designed and synthesized MOFs; C.R.-N. and F.D.L. wrote the paper with contribution by all authors.

Acknowledgments

This research was funded by the Spanish Government (grants CGL2015-70642-R, CGL2015-73103-EXP, CTQ2017-84692-R), EU FEDER funding, the University of Granada (“Unidad Científica de Excelencia” UCE-PP2016-05) and the Junta de Andalucía (grant P11-RNM-7550 and Research Group RNM-179). We thank the personnel of the Centro de Instrumentación Científica (CIC) of the University of Granada for their help during TG-DSC, FESEM, µ-XRD, and ICP-OES analyses.

Conflicts of Interest

The authors declare no conflict of interest.

References

  1. Falkowski, P.; Scholes, R.J.; Boyle, E.E.A.; Canadell, J.; Canfield, D.; Elser, J.; Gruber, N.; Hibbard, K.; Högberg, P.; Linder, S.; et al. The global carbon cycle: A test of our knowledge of Earth as a system. Science 2000, 290, 291–296. [Google Scholar] [CrossRef] [PubMed]
  2. Lackner, K.S. A guide for CO2 sequestration. Science 2003, 300, 1677–1678. [Google Scholar] [CrossRef] [PubMed]
  3. IPCC. Climate Change 2014. Synthesis Report: Contribution of Working Groups I, II and III to the Fifth Assessment Report of the Intergovernmental Panel on Climate Change; Pachauri, R.K., Meyer, L.A., Eds.; IPCC: Geneva, Switzerland, 2014; 151p. [Google Scholar]
  4. Oelkers, E.H.; Gislason, S.R.; Matter, J. Mineral carbonation of CO2. Elements 2008, 4, 333–337. [Google Scholar] [CrossRef]
  5. Cole, D.R.; Oelkers, E.H. Carbon dioxide sequestration. Elements 2008, 4, 287–362. [Google Scholar]
  6. Sanna, A.; Uibu, M.; Caramanna, G.; Kuusik, R.; Maroto-Valer, M.M. A review of mineral carbonation technologies to sequester CO2. Chem. Soc. Rev. 2014, 43, 8049–8080. [Google Scholar] [CrossRef] [PubMed] [Green Version]
  7. Urey, H.C. The Planets: Their Origin and Development; Yale University Press: New Haven, CT, USA, 1952; 245p. [Google Scholar]
  8. Siefritz, W. CO2 disposal by means of silicates. Nature 1990, 345, 486. [Google Scholar] [CrossRef]
  9. Lackner, K.S.; Wendt, C.H.; Butt, D.P.; Joyce, E.L.; Sharp, D.H. Carbon dioxide disposal in carbonate minerals. Energy 1995, 20, 1153–1170. [Google Scholar] [CrossRef]
  10. Brantley, S.L. Kinetics of mineral dissolution. In Kinetics of Water-Rock Interaction; Brantley, S.L., Kubicki, J.D., White, A.F., Eds.; Springer: New York, NY, USA, 2008; pp. 151–210. [Google Scholar]
  11. Walker, J.C.G.; Hays, P.B.; Kasting, J.F. A negative feedback mechanism for the long-term stabilization of Earth’s surface temperature. J. Geophys. Res. 1981, 86, 9776–9782. [Google Scholar] [CrossRef]
  12. Berner, R.A.; Lasaga, A.; Garrels, R.M. The carbonate-silicate geochemical cycle and its effect on atmospheric carbon dioxide over the past 100 million years. Am. J. Sci. 1983, 283, 641–683. [Google Scholar] [CrossRef]
  13. Brady, P.V. The effect of silicate weathering on global temperature and atmospheric CO2. J. Geophys. Res. Solid Earth 1991, 96, 18101–18106. [Google Scholar] [CrossRef]
  14. Berner, R.A. The long-term carbon cycle, fossil fuels and atmospheric composition. Nature 2003, 426, 323–326. [Google Scholar] [CrossRef] [PubMed]
  15. Houghton, R.A. Balancing the global carbon budget. Annu. Rev. Earth Planet. Sci. 2007, 35, 313–347. [Google Scholar] [CrossRef]
  16. Power, I.M.; Harrison, A.L.; Dipple, G.M.; Wilson, S.A.; Kelemen, P.B.; Hitch, M.; Southam, G. Carbon mineralization: From natural analogues to engineered systems. Rev. Miner. Geochem. 2013, 77, 305–360. [Google Scholar] [CrossRef]
  17. Azdarpour, A.; Asadullah, M.; Mohammadian, E.; Hamidi, H.; Junin, R.; Karaei, M.A. A review on carbon dioxide mineral carbonation through pH-swing process. Chem. Eng. J. 2015, 279, 615–630. [Google Scholar] [CrossRef]
  18. Gerdemann, S.J.; O’Connor, W.K.; Dahlin, D.C.; Penner, L.R.; Rush, H. Ex situ aqueous mineral carbonation. Environ. Sci. Technol. 2007, 41, 2587–2593. [Google Scholar] [CrossRef] [PubMed]
  19. Park, A.H.A.; Jadhav, R.; Fan, L.S. CO2 mineral sequestration: Chemically enhanced aqueous carbonation of serpentine. Can. J. Chem. Eng. 2003, 81, 885–890. [Google Scholar] [CrossRef]
  20. Park, A.A.; Fan, L. CO2 mineral sequestration: Physically activated dissolution of serpentine and pH swing process. Chem. Eng. Sci. 2004, 59, 5241–5247. [Google Scholar] [CrossRef]
  21. Krevor, S.C.; Lackner, K.S. Enhancing process kinetics for mineral carbon sequestration. Energ. Procedia 2009, 1, 4867–4871. [Google Scholar] [CrossRef]
  22. Zhao, H.; Park, Y.; Lee, D.H.; Park, A.H.A. Tuning the dissolution kinetics of wollastonite via chelating agents for CO2 sequestration with integrated synthesis of precipitated calcium carbonates. Phys. Chem. Chem. Phys. 2013, 15, 15185–15192. [Google Scholar] [CrossRef] [PubMed]
  23. Ghoorah, M.; Dlugogorski, B.Z.; Balucan, R.D.; Kennedy, E.M. Selection of acid for weak acid processing of wollastonite for mineralisation of CO2. Fuel 2014, 122, 277–286. [Google Scholar] [CrossRef]
  24. Matter, J.M.; Stute, M.; Snæbjörnsdottir, S.Ó.; Oelkers, E.H.; Gislason, S.R.; Aradottir, E.S.; Sigfusson, B.; Gunnarsson, I.; Sigurdardottir, H.; Gunnlaugsson, E.; et al. Rapid carbon mineralization for permanent disposal of anthropogenic carbon dioxide emissions. Science 2016, 352, 1312–1314. [Google Scholar] [CrossRef] [PubMed]
  25. Gislason, S.R.; Oelkers, E.H. Carbon storage in basalt. Science 2014, 344, 373–374. [Google Scholar] [CrossRef] [PubMed]
  26. Daval, D.; Martinez, I.; Guigner, J.M.; Hellmann, R.; Corvisier, J.; Findling, N.; Dominici, C.; Goffé, B.; Guyot, F. Mechanism of wollastonite carbonation deduced from micro-to nanometer length scale observations. Am. Miner. 2009, 94, 1707–1726. [Google Scholar] [CrossRef]
  27. Daval, D.; Martinez, I.; Corvisier, J.; Findling, N.; Goffé, B.; Guyot, F. Carbonation of Ca-bearing silicates, the case of wollastonite: Experimental investigations and kinetic modeling. Chem. Geol. 2009, 265, 63–78. [Google Scholar] [CrossRef]
  28. Ruiz-Agudo, E.; Putnis, C.V.; Di Lorenzo, F.; Ruiz-Agudo, C.; Rodriguez-Navarro, C. Interfacial and surface controls on wollastonite carbonation: Insights from texture observations and geochemical modeling. Am. J. Sci. under review.
  29. Huijgen, W.J.; Witkamp, G.J.; Comans, R.N. Mechanisms of aqueous wollastonite carbonation as a possible CO2 sequestration process. Chem. Eng. Sci. 2006, 61, 4242–4251. [Google Scholar] [CrossRef]
  30. Dreybrodt, W.; Eisenlohr, L.; Madry, B.; Ringer, S. Precipitation kinetics of calcite in the system CaCO3-H2O-CO2: The conversion to CO2 by the slow process H+ + HCO3 → CO2 + H2O as a rate limiting step. Geochim. Cosmochim. Acta 1997, 61, 3897–3904. [Google Scholar] [CrossRef]
  31. Cizer, Ö.; Ruiz-Agudo, E.; Rodriguez-Navarro, C. Kinetic effect of carbonic anhydrase enzyme on the carbonation reaction of lime mortar. Int. J. Archit. Heritage 2018. [Google Scholar] [CrossRef]
  32. Bond, G.M.; Stringer, J.; Brandvold, D.K.; Simsek, F.A.; Medina, M.G.; Egeland, G. Development of integrated system for biomimetic CO2 sequestration using the enzyme carbonic anhydrase. Energy Fuels 2001, 15, 309–316. [Google Scholar] [CrossRef]
  33. Vinoba, M.; Bhagiyalakshmi, M.; Jeong, S.K.; Nam, S.C.; Yoon, Y. Carbonic anhydrase immobilized on encapsulated magnetic nanoparticles for CO2 sequestration. Chem. Eur. J. 2012, 18, 12028–12034. [Google Scholar] [CrossRef] [PubMed]
  34. Power, I.M.; Harrison, A.L.; Dipple, G.M. Accelerating mineral carbonation using carbonic anhydrase. Environ. Sci. Technol. 2016, 50, 2610–2618. [Google Scholar] [CrossRef] [PubMed]
  35. Silverman, D.N.; Lindskog, S. The catalytic mechanism of carbonic anhydrase: Implications of a rate-limiting protolysis of water. Acc. Chem. Res. 1988, 21, 30–36. [Google Scholar] [CrossRef]
  36. Frost, S.C.; McKenna, R. (Eds.) Carbonic Anhydrase: Mechanism, Regulation, Links to Disease and Industrial Applications; Springer: London, UK, 2014; Volume 75, 429p. [Google Scholar]
  37. Miyamoto, H.; Miyashita, T.; Okushima, M.; Nakano, S.; Morita, T.; Matsushiro, A. A carbonic anhydrase from the nacreous layer in oyster pearls. Proc. Natl. Acad. Sci. USA 1996, 93, 9657–9660. [Google Scholar] [CrossRef] [PubMed]
  38. Pierre, A.C. Enzymatic carbon dioxide capture. ISRN Chem. Eng. 2012, 2012, 1–22. [Google Scholar] [CrossRef]
  39. Molva, M.; Kilic, S.; Ozdemir, E. Effect of carbonic anhydrase on CaCO3 crystallization in alkaline solution. Energy Fuels 2016, 30, 10686–10695. [Google Scholar] [CrossRef]
  40. Patel, T.N.; Park, A.H.A.; Banta, S. Periplasmic expression of carbonic anhydrase in Escherichia coli: A new biocatalyst for CO2 hydration. Biotechnol. Bioeng. 2013, 110, 1865–1873. [Google Scholar] [CrossRef] [PubMed]
  41. Gadikota, G.; Park, A.H.A. Accelerated carbonation of Ca-and Mg-bearing minerals and industrial wastes using CO2. In Carbon Dioxide Utilisation; Styring, P., Quadrelli, E.A., Armstrong, K., Eds.; Elsevier: Amsterdam, The Netherlands, 2015; pp. 15–137. [Google Scholar]
  42. Ruiz-Agudo, E.; Putnis, C.V.; Rodriguez-Navarro, C.; Putnis, A. The mechanism of leached layer formation during chemical weathering of silicate minerals. Geology 2012, 40, 947–950. [Google Scholar] [CrossRef]
  43. Ruiz-Agudo, E.; King, H.E.; Patiño-López, L.D.; Putnis, C.V.; Geisler, T.; Rodriguez-Navarro, C.; Putnis, A. Control of silicate weathering by interface-coupled dissolution–precipitation processes at the mineral-solution interface. Geology 2016, 44, 567–570. [Google Scholar] [CrossRef]
  44. Béarat, H.; McKelvy, M.J.; Chizmeshya, A.V.; Gormley, D.; Nunez, R.; Carpenter, R.W.; Squires, K.; Wolf, G.H. Carbon sequestration via aqueous olivine mineral carbonation: Role of passivating layer formation. Environ. Sci. Technol. 2006, 40, 4802–4808. [Google Scholar] [CrossRef] [PubMed]
  45. Whitfield, P.S.; Mitchell, L.D. In situ laboratory X-ray powder diffraction study of wollastonite carbonation using a high-pressure stage. Appl. Geochem. 2009, 24, 1635–1639. [Google Scholar] [CrossRef]
  46. King, H.E.; Plümper, O.; Putnis, A. Effect of secondary phase formation on the carbonation of olivine. Environ. Sci. Technol. 2010, 44, 6503–6509. [Google Scholar] [CrossRef] [PubMed]
  47. Daval, D.; Sissmann, O.; Menguy, N.; Saldi, G.D.; Guyot, F.; Martinez, I.; Corvisier, J.; García, B.; Machouk, I.; Knauss, K.G.; Hellmann, R. Influence of amorphous silica layer formation on the dissolution rate of olivine at 90 °C and elevated pCO2. Chem. Geol. 2011, 284, 193–209. [Google Scholar] [CrossRef]
  48. Miller, Q.R.S.; Thompson, C.J.; Loring, J.S.; Windisch, C.F.; Bowden, M.E.; Hoyt, D.W.; Hu, J.Z.; Arey, B.W.; Rosso, K.M.; Schaef, H.T. Insights into silicate carbonation processes in water-bearing supercritical CO2 fluids. Int. J. Greenhouse Gas Control 2013, 15, 104–118. [Google Scholar] [CrossRef]
  49. Min, Y.; Li, Q.; Voltolini, M.; Kneafsey, T.; Jun, Y.S. Wollastonite carbonation in water-bearing supercritical CO2: Effects of particle size. Environ. Sci. Technol. 2017, 51, 13044–13053. [Google Scholar] [CrossRef] [PubMed]
  50. Schröder, H.C.; Krasko, A.; Le Pennec, G.; Adell, T.; Wiens, M.; Hassanein, H.; Müller, I.M.; Müller, W.E.G. Silicon Biomineralization; Springer: Berlin, Germany, 2003; 341p. [Google Scholar]
  51. Ehrlich, H.; Demadis, K.D.; Pokrovsky, O.S.; Koutsoukos, P.G. Modern views on desilicification: Biosilica and abiotic silica dissolution in natural and artificial environments. Chem. Rev. 2010, 110, 4656–4689. [Google Scholar] [CrossRef] [PubMed]
  52. Xiao, L.; Lian, B.; Hao, J.; Liu, C.; Wang, S. Effect of carbonic anhydrase on silicate weathering and carbonate formation at present day CO2 concentrations compared to primordial values. Sci. Rep. 2015, 5, 7733. [Google Scholar] [CrossRef] [PubMed]
  53. Nakata, K.; Shimomura, N.; Shiina, N.; Izumi, M.; Ichikawa, K.; Shiro, M. Kinetic study of catalytic CO2 hydration by water-soluble model compound of carbonic anhydrase and anion inhibition effect on CO2 hydration. J. Biochem. 2002, 89, 255–266. [Google Scholar] [CrossRef]
  54. Ibrahim, M.M.; Shaban, S.Y.; Ichikawa, K. A promising structural zinc enzyme model for CO2 fixation and calcification. Tetrahedron Lett. 2008, 49, 7303–7306. [Google Scholar] [CrossRef]
  55. Zastrow, M.L.; Peacock, A.F.; Stuckey, J.A.; Pecoraro, V.L. Hydrolytic catalysis and structural stabilization in a designed metalloprotein. Nat. Chem. 2012, 4, 118–123. [Google Scholar] [CrossRef] [PubMed]
  56. Bhaduri, G.A.; Šiller, L. Nickel nanoparticles catalyse reversible hydration of carbon dioxide for mineralization carbon capture and storage. Catal. Sci. Technol. 2013, 3, 1234–1239. [Google Scholar] [CrossRef]
  57. Sabouni, R.; Kazemian, H.; Rohani, S. Carbon dioxide capturing technologies: A review focusing on metal organic framework materials (MOFs). Environ. Sci. Pollut. Res. 2014, 21, 5427–5449. [Google Scholar] [CrossRef] [PubMed]
  58. Nath, I.; Chakraborty, J.; Verpoort, F. Metal organic frameworks mimicking natural enzymes: A structural and functional analogy. Chem. Soc. Rev. 2016, 45, 4127–4170. [Google Scholar] [CrossRef] [PubMed]
  59. D’Alessandro, D.M.; Smit, B.; Long, J.R. Carbon dioxide capture: Prospects for new materials. Angew. Chem. Int. Ed. 2010, 49, 6058–6082. [Google Scholar] [CrossRef] [PubMed]
  60. Cavka, J.H.; Jakobsen, S.; Olsbye, U.; Guillou, N.; Lamberti, C.; Bordiga, S.; Lillerud, K.P. A new zirconium inorganic building brick forming metal organic frameworks with exceptional stability. J. Am. Chem. Soc. 2008, 130, 13850–13851. [Google Scholar] [CrossRef] [PubMed]
  61. Furukawa, H.; Gándara, F.; Zhang, Y.B.; Jiang, J.; Queen, W.L.; Hudson, M.R.; Yaghi, O.M. Water adsorption in porous metal–organic frameworks and related materials. J. Am. Chem. Soc. 2014, 136, 4369–4381. [Google Scholar] [CrossRef] [PubMed]
  62. Gil-San Millan, R.; Lopez-Maya, E.; Ryo, S.G.; Kim, M.K.; Navarro, J.A.R. Improved soman and VX nerve agents degradation by magnesium hydroxide doped metal-organic frameworks. J. Mater. Chem. A. under review.
  63. López-Maya, E.; Montoro, C.; Rodríguez-Albelo, L.M.; Aznar Cervantes, S.D.; Lozano-Pérez, A.A.; Cenís, J.L.; Barea, E.; Navarro, J.A.R. Textile/metal–organic-framework composites as self-detoxifying filters for chemical-warfare agents. Angew. Chem. Int. Ed. 2015, 54, 6790–6794. [Google Scholar] [CrossRef] [PubMed]
  64. Valenzano, L.; Civalleri, B.; Chavan, S.; Bordiga, S.; Nilsen, M.H.; Jakobsen, S.; Lillerud, K.P.; Lamberti, C. Disclosing the complex structure of UiO-66 metal organic framework: A synergic combination of experiment and theory. Chem. Mater. 2011, 23, 1700–1718. [Google Scholar] [CrossRef]
  65. Deer, W.A.; Howie, R.A.; Zussman, J. Rock-Forming Minerals: Single-Chain Silicates; The Geological Society: London, UK, 1997; 668p. [Google Scholar]
  66. Bailey, A.; Reesman, A.L. A survey study of the kinetics of wollastonite dissolution in H2O-CO2 and buffered systems at 25 degrees C. Am. J. Sci. 1971, 271, 464–472. [Google Scholar] [CrossRef]
  67. Rimstidt, J.D.; Dove, P.M. Mineral/solution reaction rates in a mixed flow reactor: Wollastonite hydrolysis. Geochim. Cosmochim. Acta 1986, 50, 2509–2516. [Google Scholar] [CrossRef]
  68. Murphy, W.M.; Helgeson, H.C. Thermodynamic and kinetic constraints on reaction rates among minerals and aqueous solutions. III. Activated complexes and the pH-dependence of the rates of feldspar, pyroxene, wollastonite, and olivine hydrolysis. Geochim. Cosmochim. Acta 1987, 51, 3137–3153. [Google Scholar] [CrossRef]
  69. Casey, W.H.; Westrich, H.R.; Banfield, J.F.; Ferruzzi, G.; Arnold, G.W. Leaching and reconstruction at the surfaces of dissolving chain-silicate minerals. Nature 1993, 366, 253–256. [Google Scholar] [CrossRef]
  70. Xie, Z.; Walther, J.V. Dissolution stoichiometry and adsorption of alkali and alkaline earth elements to the acid-reacted wollastonite surface at 25 °C. Geochim. Cosmochim. Acta 1994, 58, 2587–2598. [Google Scholar] [CrossRef]
  71. Kojima, T.; Nagamine, A.; Ueno, N.; Uemiya, S. Absorption and fixation of carbon dioxide by rock weathering. Energy Convers. Manag. 1997, 38, S461–S466. [Google Scholar] [CrossRef]
  72. Weissbart, E.J.; Rimstidt, J.D. Wollastonite: Incongruent dissolution and leached layer formation. Geochim. Cosmochim. Acta 2000, 64, 4007–4016. [Google Scholar] [CrossRef]
  73. Wu, J.C.S.; Sheen, J.D.; Chen, S.Y.; Fan, Y.C. Feasibility of CO2 fixation via artificial rock weathering. Ind. Eng. Chem. Res. 2001, 40, 3902–3905. [Google Scholar] [CrossRef]
  74. Golubev, S.V.; Pokrovsky, O.S.; Schott, J. Experimental determination of the effect of dissolved CO2 on the dissolution kinetics of Mg and Ca silicates at 25 °C. Chem. Geol. 2005, 217, 227–238. [Google Scholar] [CrossRef]
  75. Green, E.; Luttge, A. Incongruent dissolution of wollastonite measured with vertical scanning interferometry. Am. Miner. 2006, 91, 430–434. [Google Scholar] [CrossRef]
  76. Tai, C.Y.; Chen, W.R.; Shih, S.M. Factors affecting wollastonite carbonation under CO2 supercritical conditions. AIChE J. 2006, 52, 292–299. [Google Scholar] [CrossRef]
  77. Daval, D.; Bernard, S.; Rémusat, L.; Wild, B.; Guyot, F.; Micha, J.S.; Rieutord, F.; Magnin, V.; Fernandez-Martinez, A. Dynamics of altered surface layer formation on dissolving silicates. Geochim. Cosmochim. Acta 2017, 209, 51–69. [Google Scholar] [CrossRef]
  78. Pokrovsky, O.S.; Shirokova, L.S.; Bénézeth, P.; Schott, J.; Golubev, S.V. Effect of organic ligands and heterotrophic bacteria on wollastonite dissolution kinetics. Am. J. Sci. 2009, 309, 731–772. [Google Scholar] [CrossRef]
  79. Schott, J.; Pokrovsky, O.S.; Spalla, O.; Devreux, F.; Gloter, A.; Mielczarski, J.A. Formation, growth and transformation of leached layers during silicate minerals dissolution: The example of wollastonite. Geochim. Cosmochim. Acta 2012, 98, 259–281. [Google Scholar] [CrossRef]
  80. Ding, W.; Fu, L.; Ouyang, J.; Yang, H. CO2 mineral sequestration by wollastonite carbonation. Phys. Chem. Miner. 2014, 41, 489–496. [Google Scholar] [CrossRef]
  81. Parkhurst, D.L.; Appelo, C.A.J. Description of Input and Examples for Phreeqc Version 3. A Computer Program for Speciation, Batch-Reaction, One-Dimensional Transport, and Inverse Geochemical Calculations; U.S. Geological Survey: Denver, VA, USA, 2013. Available online: http://pubs.usgs.gov/tm/06/a43 (accessed on 9 May 2018).
  82. Rodriguez-Navarro, C.; Ruiz-Agudo, E.; Luque, A.; Rodriguez-Navarro, A.B.; Ortega-Huertas, M. Thermal decomposition of calcite: Mechanisms of formation and textural evolution of CaO nanocrystals. Am. Miner. 2009, 94, 578–593. [Google Scholar] [CrossRef]
  83. Teng, H.H.; Dove, P.M.; De Yoreo, J.J. Kinetics of calcite growth: Surface processes and relationships to macroscopic rate laws. Geochim. Cosmochim. Acta 2000, 64, 2255–2266. [Google Scholar] [CrossRef]
  84. Rodriguez-Navarro, C.; Burgos Cara, A.; Elert, K.; Putnis, C.V.; Ruiz-Agudo, E. Direct nanoscale imaging reveals the growth of calcite crystals via amorphous nanoparticles. Cryst. Growth Des. 2016, 16, 1850–1860. [Google Scholar] [CrossRef]
  85. Rodriguez-Navarro, C.; Ruiz-Agudo, E.; Harris, J.; Wolf, S.E. Nonclassical crystallization in vivo et in vitro (II): Nanogranular features in biomimetic minerals disclose a general colloid-mediated crystal growth mechanism. J. Struct. Biol. 2016, 196, 260–287. [Google Scholar] [CrossRef] [PubMed]
  86. Turpault, M.P.; Trotignon, L. The dissolution of biotite single crystals in dilute HNO3 at 24 °C: Evidence of an anisotropic corrosion process of micas in acidic solutions. Geochim. Cosmochim. Acta 1994, 58, 2761–2775. [Google Scholar] [CrossRef]
  87. Awad, A.; Van Groos, A.K.; Guggenheim, S. Forsteritic olivine: Effect of crystallographic direction on dissolution kinetics. Geochim. Cosmochim. Acta 2000, 64, 1765–1772. [Google Scholar] [CrossRef]
  88. Daval, D.; Hellmann, R.; Saldi, G.D.; Wirth, R.; Knauss, K.G. Linking nm-scale measurements of the anisotropy of silicate surface reactivity to macroscopic dissolution rate laws: New insights based on diopside. Geochim. Cosmochim. Acta 2013, 107, 121–134. [Google Scholar] [CrossRef]
  89. Lasaga, A.C.; Luttge, A. Variation of crystal dissolution rate based on a dissolution stepwave model. Science 2001, 291, 2400–2404. [Google Scholar] [CrossRef] [PubMed]
  90. Dove, P.M.; Han, N.; De Yoreo, J.J. Mechanisms of classical crystal growth theory explain quartz and silicate dissolution behavior. Proc. Natl. Acad. Sci. USA 2005, 102, 15357–15362. [Google Scholar] [CrossRef] [PubMed]
  91. Pollet-Villard, M.; Daval, D.; Ackerer, P.; Saldi, G.D.; Wild, B.; Knauss, K.G.; Fritz, B. Does crystallographic anisotropy prevent the conventional treatment of aqueous mineral reactivity? A case study based on K-feldspar dissolution kinetics. Geochim. Cosmochim. Acta 2016, 190, 294–308. [Google Scholar] [CrossRef]
  92. Ruiz-Agudo, E.; Putnis, C.V.; Pel, L.; Rodriguez-Navarro, C. Template-assisted crystallization of sulfates onto calcite: Implications for the prevention of salt damage. Cryst. Growth Des. 2012, 13, 40–51. [Google Scholar] [CrossRef]
Figure 1. Structure of UiO-66, MOF-808, and MOF-808@Mg(OH)2. The aromatic multidentate ligands used to construct the Zr-MOFs are benzene-1,4-dicarboxylate and benzene-1,3,5-tricarboxylate for UiO-66 and MOF-808, respectively [60,61,62].
Minerals 08 00209 g001
Figure 2. Evolution of the solution chemistry during wollastonite carbonation. Aqueous concentration of silicon (a) and calcium (b) in solution determined by ICP-OES. The inset in (b) shows the Ca evolution during the early stages of the carbonation reaction; (c) pH evolution (values measured at 25 °C and recalculated for a T of 40 °C using PHREEQC). The systems with CA (black symbols and curves) and without CA (control; red symbols and curves) are compared. Error bars show standard deviation (±1σ).
Minerals 08 00209 g002
Figure 3. XRD patterns of wollastonite powders reacted for 14 days in the absence (control) and presence of CA. The XRD patterns of unreacted wollastonite and reference calcite (Joint Committee on Powder Diffraction Standards, JCPDS card # 05-0586) are included for comparison. Note the higher intensity of the main peak of calcite (marked by the green vertical line) in the control compared with the CA run, and the significant reduction in intensity ratio of wollastonite 200/002 peaks after 14 days reaction, especially in the run with CA.
Minerals 08 00209 g003
Figure 4. Thermogravimetric (TG) analysis of the reacted solid phases: (a) TG curves for the control and CA runs; (b) time-evolution of the extent of carbonation for the control and CA runs based on TG results (error bars correspond to ±1σ).
Minerals 08 00209 g004
Figure 5. FESEM images of unreacted wollastonite crystals (a) and those reacted for 8 h showing dissolution pits (be) and surface precipitates of amorphous silica nanoparticles (b,c,e,f). Images (bd) correspond to the control, and (e,f) to the CA run. Red arrows point to amorphous silica nanoparticles/surface layers, and yellow arrows point to dissolution pits (elongated parallel to <010>wollastonite).
Minerals 08 00209 g005
Figure 6. FESEM-EDS analysis of reactant and product phases during the early stage of wollastonite carbonation (8 h reaction time). (a) General overview, and (b,c) details of reacted wollastonite (Woll) in the control run showing calcite (Cc), and (d) EDS map of the red rectangular area in (c); (e) general overview and (f) detail of calcite formed on {001} faces of wollastonite in the CA-inclusive run; (g) shows the EDS map of the rectangular area marked in (f).
Minerals 08 00209 g006
Figure 7. FESEM-EDS images of wollastonite carbonated for 1 up to 14 days in the absence of CA. (a) wollastonite (Woll) reacted for 1 day, (b) 2 days, and (c) 14 days; (d) EDS map of (c). Calcite crystals (Cc) tend to form dense coatings on {100} and {010} faces. SALs (amorphous SiO2·nH2O) display a remarkable thickness on the walls of dissolution pits (red circled area in (d)) and on {010} faces.
Minerals 08 00209 g007
Figure 8. FESEM images and EDS map of wollastonite crystals reacted in the presence of CA. Backscattered (a,d,e) and secondary (b,c) electron images of wollastonite (Woll) subjected to carbonation for different time-periods; (f) EDS compositional map of wollastonite reacted for 14 days. Crystals are elongated along [010], showing marked {100} cleavage, and in some sections, less marked {001} cleavage. Note the thick calcite (Cc) coatings developed on {100} and {010} faces in (a,b,d). A high magnification image of the calcite aggregate in the red squared area in (b) is shown in (c). Note the preferential nucleation of calcite on the areas where amorphous silica forms at {100} cleavage planes and at fractures nearly parallel to [100] in (e,f). The inset in (a) shows a high magnification image of SALs developed on wollastonite after one day of carbonation. Yellow arrows in (e,f) point to amorphous silica, SiO2·nH2O (SALs).
Minerals 08 00209 g008
Figure 9. Dissolution of wollastonite in the presence of CA and MOFs: (a) Time-evolution of Ca2+ released by wollastonite dissolution and continuously recorded by the ISE probe; (b) amount (mmol) of H2SiO42− calculated from the amount (mL) of HCl added to maintain a constant pH = 4 during the titration experiments. Shaded color areas show values of standard deviation (±1σ); (c) time evolution of Ca2+ and H2SiO42− concentration following dissolution of wollastonite in the presence of CA, UiO-66 and without catalyst (control); (d) 3D-graph summarizing the dissolution rates of wollastonite crystals measured in the presence of MOFs, carbonic anhydrase (CA), and without catalysts (control).
Minerals 08 00209 g009
Figure 10. Geochemical evolution of the control and CA-inclusive carbonation systems. Variation of Ca (a) and Si (b) concentration vs. pH over the time course of the experiments with respect to the equilibrium solubility curves of wollastonite, calcite, and amorphous silica (continuous lines calculated using PHREEQC); time evolution of the saturation index (SI) for the control (c) and CA-inclusive (d) systems. The blue circles in (a,b) mark the pH of the starting solution (t = 0).
Minerals 08 00209 g010
Figure 11. Crystallographic features and structure of wollastonite. (a) prism of wollastonite showing the main (hkl) faces and cleavage planes (dashed black lines). The (010), (100), and (001) planes are separately outlined with red arrows indicating main <hkl> directions for the progress of dissolution. Their size qualitatively represents the rate of dissolution along these directions; Structure of wollastonite projected along [001] (b), [010] (c), and [100] (d).
Minerals 08 00209 g011
Figure 12. Results of PHREEQC modeling of: (a) Extent of CaSiO3 dissolution vs. pH for an initial 10 mol of wollastonite dosed to 1 L H2O. The moles at equilibrium with this aqueous solution strongly depend on pH and acidic conditions are required to reach significant dissolution; (b) the variation of the total (CaTOT) and free Ca (i.e., [Ca2+]) in solution, as well as their ratio (the constant denoted, c), with pH. Note that for pH < 11, the ratio is constant and equal to 1; (c) the speciation of Si in water as a function of pH, which is useful to realize that the release of H2SiO42− induces a strong pH shift toward more basic values and the fact that at pH 4 the most abundant species is the orthosilicic acid.
Minerals 08 00209 g012
Table 1. Dissolution rates of wollastonite (mol∙m−2∙s−1) in the absence and presence of catalysts.
ControlCAUiO-66MOF-808MOF-808@Mg(OH)2
R Ca 2 + 1.28 ± 0.14 × 10−80.96 ± 0.11 × 10−81.47 ± 0.11 × 10−81.34 ± 0.16 × 10−81.31 ± 0.13 × 10⁻⁸
R H 2 SiO 4 2 1.19 ± 0.11 × 10−80.86 ± 0.09 ×10−81.32 ± 0.12 × 10−81.19 ± 0.15 × 10−81.19 ± 0.12 × 10⁻⁸
Table 2. Time evolution of free energy (ΔG) values (kJ∙mol−1) for the dissolution of wollastonite and the precipitation of calcite and amorphous silica in the absence and presence of CA.
ΔGdissolution wollastoniteΔGprecipitation calciteΔGprecipitation Sio2 nH2O
TimeNo CACANo CACANo CACA
8 h−30.7 ± 1.1−25.1 ±1.10.1 ± 0.73.3 ± 1.3−3.9 ± 0.3−5.0 ± 0.3
24 h−23.9 ± 0.7−22.4 ± 0.12.7 ± 0.92.2 ± 0.1−1.4 ± 0.4−1.9 ± 0.1
48 h−23.1 ± 0.5−21.0 ± 0.31.7 ± 0.52.0 ± 0.5−0.4 ± 0.1−0.9 ± 0.2
336 h−17.8 ± 1.2−16.9 ± 0.32.1 ± 0.52.7 ± 0.71.2 ± 0.11.0 ± 0.1

