Article

Si-Disordering in MgAl2O4-Spinel under High P-T Conditions, with Implications for Si-Mg Disorder in Mg2SiO4-Ringwoodite

1
School of Earth and Space Sciences, Peking University, Beijing 100871, China
2
Key Laboratory of Orogenic Belts and Crustal Evolution, Ministry of Education of China, Beijing 100871, China
3
Institute of Fluid Physics, China Academy of Engineering Physics, Mianyang 659000, China
4
School of Gemmology, China University of Geosciences (Beijing), Beijing 100083, China
5
Geophysical Laboratory, Carnegie Institution of Washington, Washington, DC 20015, USA
6
Beijing Key Lab of Theory and Technology for Advanced Battery Materials, Department of Material Science and Engineering, College of Engineering, Peking University, Beijing 100871, China
*
Author to whom correspondence should be addressed.
Minerals 2018, 8(5), 210; https://doi.org/10.3390/min8050210
Submission received: 20 April 2018 / Revised: 8 May 2018 / Accepted: 8 May 2018 / Published: 12 May 2018
(This article belongs to the Special Issue Spinel Group Minerals)

Abstract

:
A series of Si-bearing MgAl2O4-spinels were synthesized at 1500–1650 °C and 3–6 GPa. These spinels had SiO2 contents of up to ~1.03 wt % and showed a substitution mechanism of Si4+ + Mg2+ = 2Al3+. Unpolarized Raman spectra were collected from polished single grains, and displayed a set of well-defined Raman peaks at ~610, 823, 856 and 968 cm−1 that had not been observed before. Aided by the Raman features of natural Si-free MgAl2O4-spinel, synthetic Si-free MgAl2O4-spinel, natural low quartz, synthetic coesite, synthetic stishovite and synthetic forsterite, we infer that these Raman peaks should belong to the SiO4 groups. The relations between the Raman intensities and SiO2 contents of the Si-bearing MgAl2O4-spinels suggest that under some P-T conditions, some Si must adopt the M-site. Unlike the SiO4 groups with very intense Raman signals, the SiO6 groups are largely Raman-inactive. We further found that the Si cations primarily appear on the T-site at P-T conditions ≤~3–4 GPa and 1500 °C, but attain a random distribution between the T-site and M-site at P-T conditions ≥~5–6 GPa and 1630–1650 °C. This Si-disordering process observed for the Si-bearing MgAl2O4-spinels suggests that similar Si-disordering might happen to the (Mg,Fe)2SiO4-spinels (ringwoodite), the major phase in the lower part of the mantle transition zone of the Earth and the benchmark mineral for the very strong shock stage experienced by extraterrestrial materials. The likely consequences have been explored.

1. Introduction

Spinel (Sp; AB2O4) sensu lato plays a crucial role in Earth sciences. The so-called 2-3 Sp, A = 2 + cations and B = 3 + cations, is ubiquitous in most terrestrial rocks [1,2]. With significant compositional complexity and a wide P-T stability field, it participates in many phase equilibria, which can be calibrated as geothermometers, geobarometers and oxybarometers [3,4,5], and therefore has many geological implications. Taking the chromian Sp as an example, it has been widely used as a “petrological litmus paper” to classify upper mantle peridotites, explore melt compositional characteristics of the upper mantle, probe crystallization processes of basaltic magmas, and estimate P-T conditions of diamond formation [6,7,8,9]. Additionally, the 2-3 Sp is widely observed on some extraterrestrial planets, asteroids and meteorites [10,11,12,13,14]. Furthermore, it is even found as one of the major phases in some lunar rocks or lunar meteorites [15,16], implying some special features of the magma’s evolution history of the Moon.
Less frequently observed, the so-called 4-2 Sp (A = 4 + cations and B = 2 + cations) is also geologically important, with the (Mg,Fe)2SiO4-Sp (or ringwoodite; Rw) being the most distinct example. It has been accepted that Rw with an Mg# of ~89 (Mg# = 100 Mg/(Mg + Fe); molar ratio) is the most abundant phase in the lower part of the mantle transition zone (LP-MTZ; ~520–660 km). The physical-chemical properties of the Rw thus have significant implications in building the mineralogical models of the Earth’s deep interior, constraining the origins of the 520-km and 660-km seismic discontinuities, and exploring the rheological behavior and convection process of the MTZ [17,18,19,20,21]. Recent discovery of a terrestrial Rw crystal included in a diamond confirms the significant role that Rw plays [22]. In comparison, extraterrestrial Rw has commonly been documented in L ordinary chondrites ([23]; and references therein), and has less frequently been recorded in H ordinary chondrites [24,25], LL ordinary chondrites [14,26], CV carbonaceous chondrite [27], and CB carbonaceous chondrite [28]. Furthermore, it has been observed in some lunar meteorites [29,30] and many Martian meteorites (for Rw in the shergottite, see Boonsue & Spray [31], Baziotis et al. [32], Greshake et al. [33], Walton [34], Walton et al. [35], Ma et al. [36,37], and Miyahara et al. [38]; for Rw in the chassignite, see Fritz & Greshake [12]). Rw has been proposed as the benchmark mineral for the very strong shock stage experienced by meteorites (S6; [39]), and its discoveries have set important constraints on the shock P-T conditions, shock durations, and sizes of the impactors, which can be combined with the radiometric ages of the shock events to provide valuable knowledge for the theoretical evolution models of the early solar system [23,40,41].
One distinct feature of the structure of Sp is its order-disorder phenomenon. Sp has the space group Fd 3 ¯ m, and has two symmetrically different cation sites (tetrahedral T-site and octahedral M-site, with 1/8 of the former and 1/2 of the latter occupied by cations), so that its structural formula is usually written as [4]A[6]B2O4. The cations on these two sites readily switch positions, and Sp becomes disordered, leading to a more general formula [4](A1−xBx)[6](AxB2−x)O4, where x is the inversion parameter (x = 0 → normal Sp; x = 1 → inverse Sp; x = 0.667 → completely-disordered Sp). This order-disorder process is complicated, and influences many elastic, thermodynamic and thermochemical properties [19,42,43,44,45,46].
The order-disorder status of the 2-3 MgAl2O4-Sp, the archetype of all spinels, can be significantly affected by T, P, composition, and even grain size. The MgAl2O4-Sp is generally a normal Sp under ambient conditions, but becomes partially or even fully disordered as T and P increase [42,43,45,47,48,49,50,51,52,53,54,55,56,57]. Its inversion parameter x increases as its grain size decreases [58]. Additionally, there have been some preliminary discussions on the effect of composition [42,53]. In contrast, the order-disorder issue of the 4-2 Mg2SiO4-Sp (Rw) is still hotly debated, and convincing evidence of the presence of 6-coordinated Si remains at large. From knowledge of ionic radius systematics and thermodynamic considerations [19,59,60], a small amount of structural disorder has been suggested, with x reaching ~0.02–0.04 for the P-T conditions of the LP-MTZ. However, high-resolution 29Si MAS NMR data indicated no 6-coordinated Si [61], a result potentially affected by fast structural reequilibrating during the sample-quenching process. Nevertheless, the Rw grains in the highly shocked L6-type ordinary chondrites NWA 1662 and NWA 463, with distinct and different colors, showed clues implying structural inversion [62], which had been partially preserved presumably due to much larger cooling rates. Considering the large influence of the x parameter on the elastic constants, elastic anisotropy, and seismic velocities [19,46,63], the Mg-Si order-disorder process deserves more investigation, which is the focus of this study.
In Sp, the size of a cation has a profound influence in determining its site preference, with larger ions preferring the T-site of 2-3 Sp, but the M-site of 4-2 Sp [59]. With a relatively small size difference between the Mg and Al cations in the MgAl2O4-Sp, the cation disorder achieved under high P-T conditions can be partially preserved [42,45,48,50,51,53]. In contrast, the relatively large size difference between the Mg and Si cations in the Rw may strengthen this size-dependent site preference and accelerate the cation-redistribution process during cooling, so that the cation disorder attained under high P-T conditions can be easily lost, leading to null signals for cation disorder, as observed experimentally [61,64]. To circumvent this obstacle, we have taken an indirect approach by doping the MgAl2O4-Sp with some Si, and examined whether Si can be disordered. It was expected that silicon could readily enter the MgAl2O4-Sp, for the SiO2 in natural 2-3 Sp can reach up to ~5.3 wt % (Figure 1). In this study, we first synthetized the Si-bearing MgAl2O4-Sp at high P. We then analyzed the experimental products using Raman spectroscopy, a powerful method for studying cation-disordering [49,57]. To facilitate data interpretation, natural Si-free MgAl2O4-Sp (N-Sp), natural low quartz (N-Qz), and synthetic Si-free MgAl2O4-Sp, coesite (Coe), stishovite (St) and forsterite (Fo) were similarly analyzed. Here we report the first experimental evidence for 6-coordinated Si in the Sp structure.

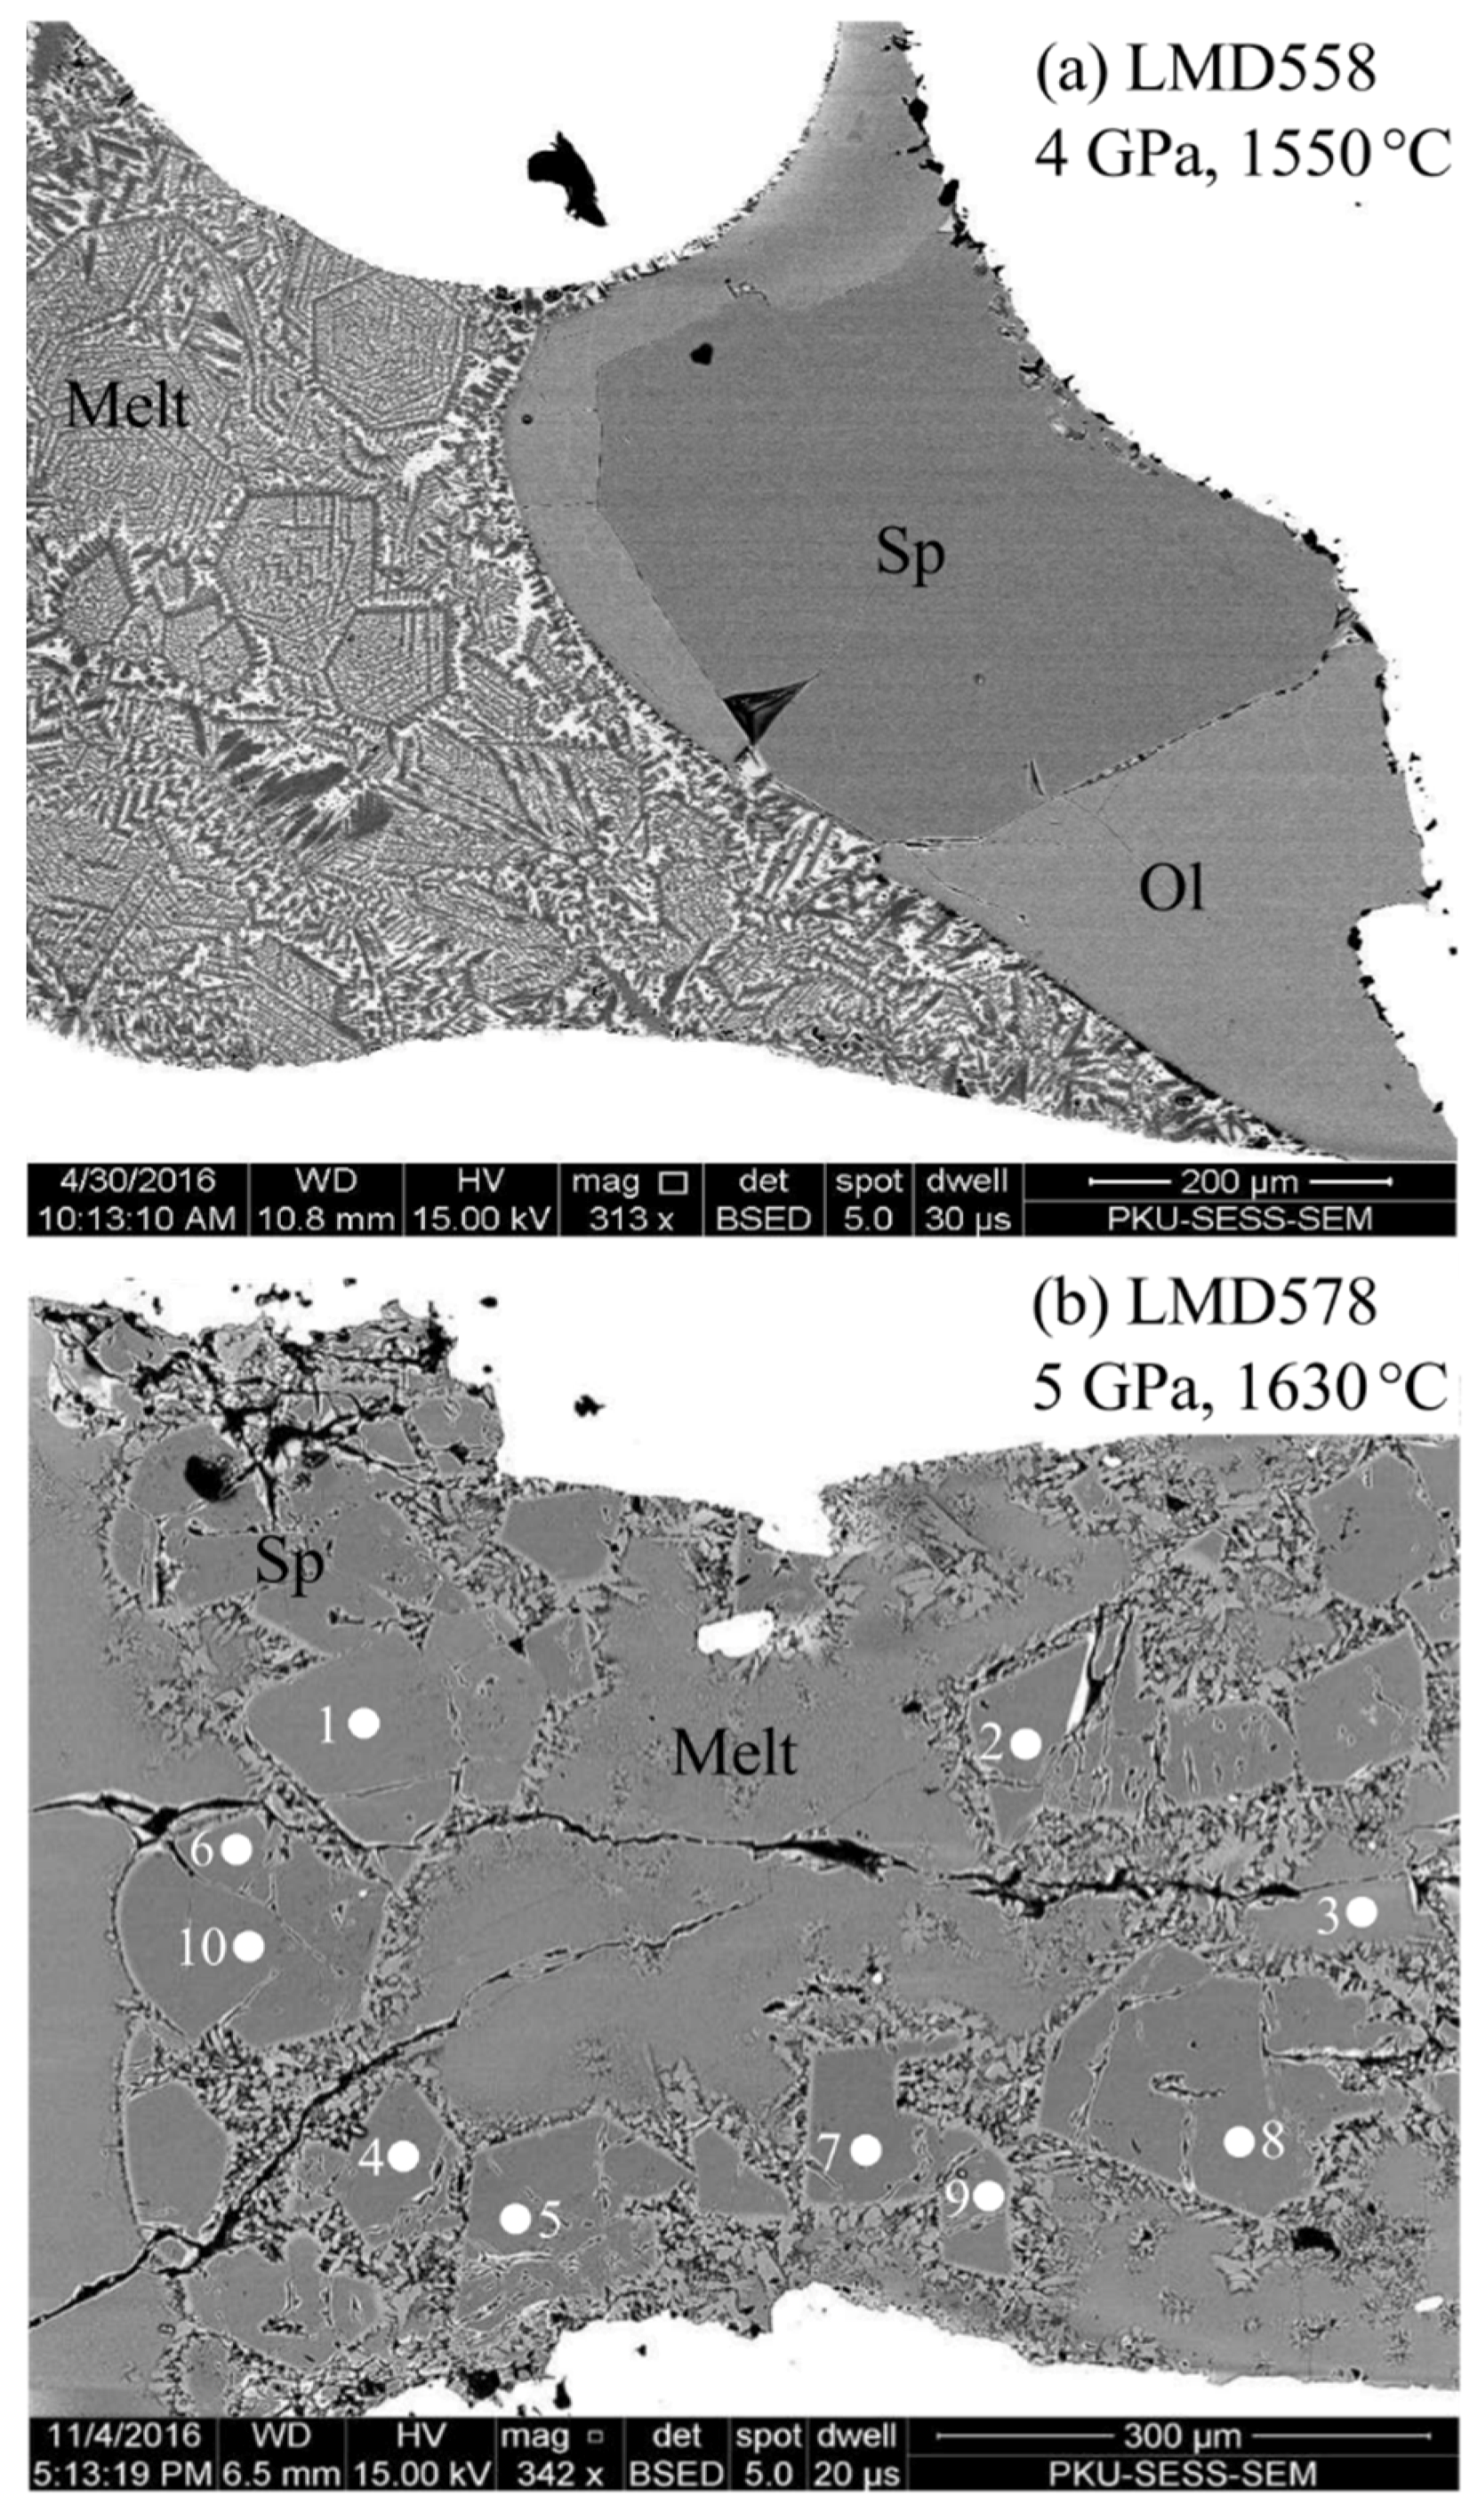
2. Experimental and Analytical Methods

High-P experiments were conducted on a cubic press at the High-Pressure Laboratory of Peking University [70] and a multi-anvil press at the Geophysical Laboratory, Carnegie Institution of Washington [71]. With the experimental charges encapsulated in sealed Pt tubes, a series of Si-bearing MgAl2O4-Sp were synthesized in the system CaO-MgO-Al2O3-SiO2-K2O-CO2 at 3–6 GPa and 1500–1650 °C by employing a conventional electrical resistance heating technique (Table 1). In addition, we used high-P experimental techniques to separately synthesize Si-free MgAl2O4-Sp, Coe and St (Table 1). The P and T uncertainties in our high-P experiments should be better than ~0.5 GPa and 50 °C [70,71,72].
The compositions of the crystalline phases from the high-P experiments were obtained by using a JXA-8100 electron microprobe (EMP) in wavelength dispersive mode (WDS). For all the EMP analyses, the beam current was 10 nA, the accelerating voltage 15 kV, the beam spot size 1 μm, and the counting time 40 s. Calibration was based on optimization to some standards provided by the SPI Corporation (USA), with diopside for Mg and Ca calibrations, jadeite for Si, Al and Na calibrations, chromium oxide for Cr calibration, hematite for Fe, sanidine for K, rutile for Ti, rhodonite for Mn, and nickel silicide for Ni. Data correction was performed with the PRZ method. The results are shown in Table 1 (the CaO and K2O contents below the detection limits).
Two natural gem-quality mineral samples were employed in this study as well; one was a red, Si-free Sp crystal (N-Sp) with an octahedral shape from Mogok (Burma), and the other was a clear low Qz crystal (N-Qz) from Donghai (China). Both were similarly analyzed for compositions with the EMP in the WDS mode. In addition to the components shown in Table 1, extra components in the N-Sp included 0.06(3)% TiO2, 0.95(6)% Cr2O3 and 0.10(1)% FeO, leading to the chemical formula (Mg0.993Fe0.002Ti0.001)(Al1.983Cr0.018)O4 (all iron assumed as Fe2+). Extra components in the N-Qz were below the detection limits.
Unpolarized Raman spectra were collected from 100 to 1350 cm−1 with a Renishaw inVia Reflex system in a back-scattering geometry at ambient P-T conditions. A 532 nm laser with an emission power of ~50 mW and a 50× long-distance objective were used in all analyses. Other analytical conditions were ~1 μm light spot, 1 cm−1 spectral resolution, and 20 successive scans for every analysis (10 s for each scan). For every high-P product, multiple analyses were conducted on well-polished and arbitrarily selected Sp, Coe, St and Fo grains with unknown orientations. For comparison, the Raman spectrum of the N-Sp was collected from the (111) plane, whereas that of the N-Qz was from the (001) plane. The Raman data were processed by using the PeakFit V4.12 software (SPSS Inc.).
In addition, we analyzed one fragment of the N-Sp for its order-disorder state by single-crystal XRD method. Data were collected using an Agilent Technologies Rigaku micro-focused diffractometer (Mo Kα radiation; λ = 0.071073 nm), and processed using the SHELXT software included in the SHELXTL package. From the single-crystal XRD data we directly obtained an x value of 0.129, probably with relatively large uncertainty due to the similar scattering factors of Mg and Al. Following the method of Carbonin et al. [73], with the bond distances from Lavina et al. [74] and with x = 0.129 as one of the input variables; further, we calculated a new x value, which was in turn used as an input in the next round of crystal structural analysis. The final cycles of the least-squares refinement, including atomic coordinates and anisotropic thermal parameters for the atoms [I > 2sigma(I)], converged at R1 = 0.0164, wR2 = 0.0730 and S = 1.065, and yielded x = 0.162 (see Supplementary Materials for the details). Using the empirical equation proposed by Andreozzi & Princivalle [55],
x = 21.396 − 80.714u
where u is the oxygen positional parameter in the Sp structure (u = 0.26329(24) for our N-Sp); alternatively, we constrained the x value as 0.145. x = 0.145 is preferred in this study.

3. Results and Discussion

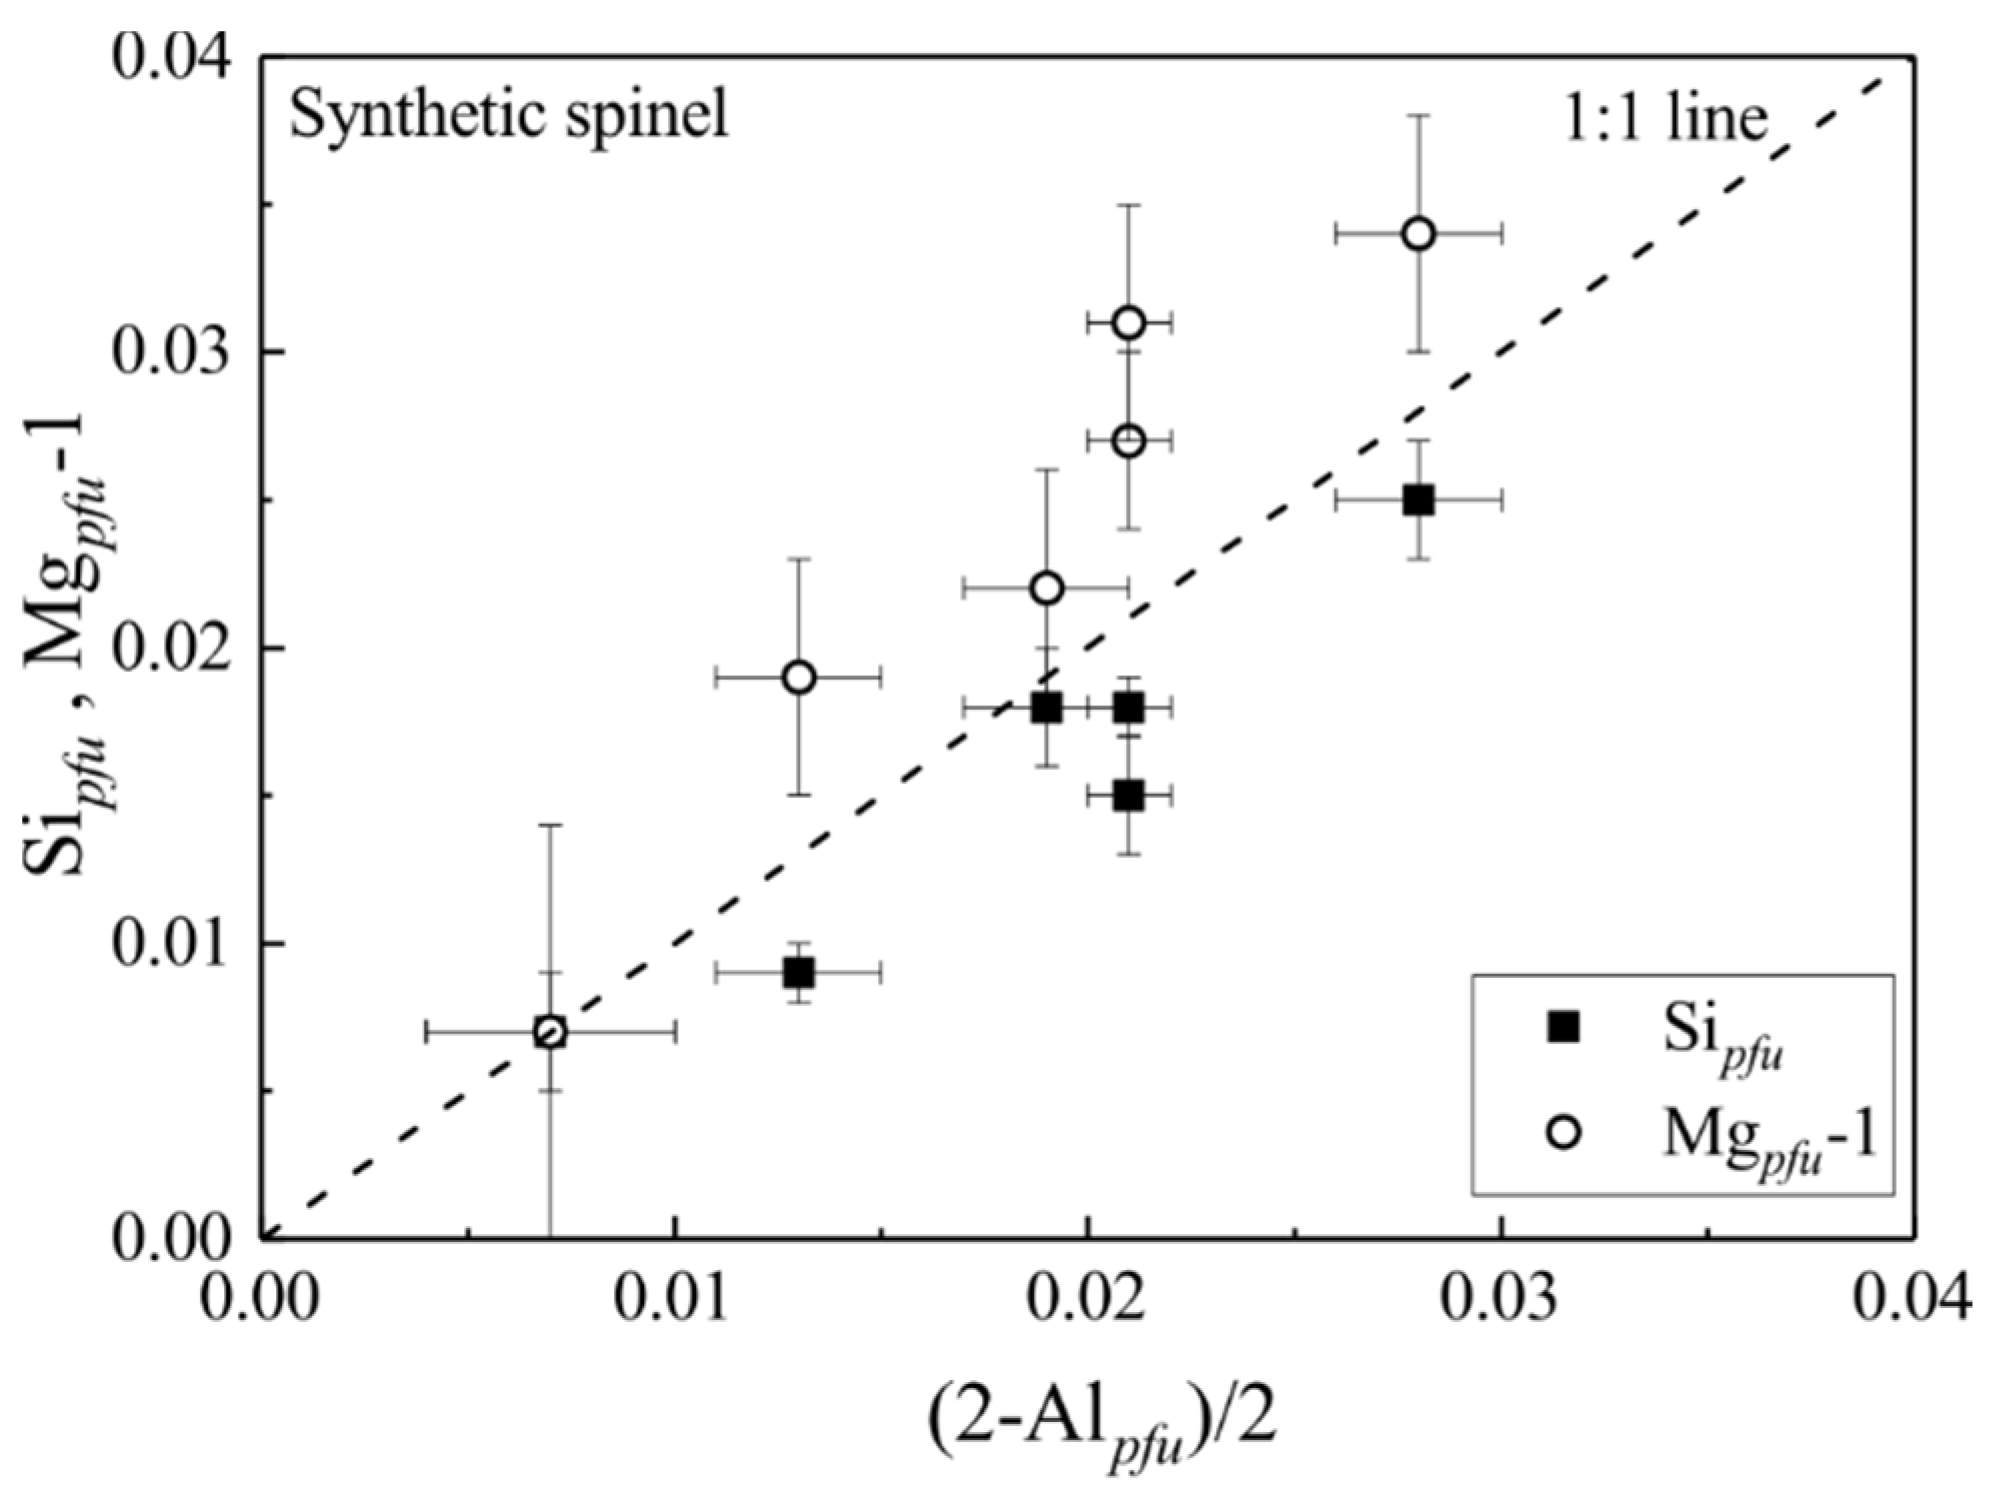
3.1. Synthetic MgAl2O4-Sp and Its SiO2

In total, nine high-P experiments with long durations of 8–36 h were conducted (Table 1): six of them for synthesizing Si-bearing MgAl2O4-Sp, one for Si-free MgAl2O4-Sp, one for Coe, and one for St. In the synthesizing experiments for the Si-bearing MgAl2O4-Sp, a CO2-rich melt phase with intense quench-modification texture was always observed. Some other crystalline phases like Fo and garnet (Grt) were occasionally detected. The crystalline phases in all these experiments had large grain sizes of up to ~600 μm, showed sharp grain boundaries and attained homogeneous chemical compositions. Typical electron back-scatter images from some of these experiments are shown in Figure 2. In the experiments for the Si-free MgAl2O4-Sp, Coe and St, a melt phase was clearly observed in LMD659 only (Table 1). The grain boundaries of the Si-free MgAl2O4-Sp, Coe and St were well defined, their grain sizes were large (up to ~100 μm in diameter), and their compositions were expected to be homogeneous.
With up to ~1 wt % SiO2 (Table 1), the compositions of the Si-bearing MgAl2O4-Sp are shown in Figure 3. A primary observation here is that one Si4+ and one Mg2+ substitute for two Al3+,
Si4+ + Mg2+ = 2Al3+
In detail, the (Sipfu) values seem slightly lower than the (Mgpfu-1) values, which perhaps relates to the compositional characteristics of the coexisting phase(s). Nevertheless, the effects of P, T and the coexisting phases on this cation substitution reaction are not clear, but are presently undergoing thorough experimental investigation.
The cation radii of Mg (rMg), Al (rAl) and Si (rSi) are very different, rMg = 0.585 Å > rAl = 0.39 Å > rSi = 0.275 Å on the T-site and rMg = 0.715 Å > rAl = 0.53 Å > rSi = 0.40 Å on the M-site under ambient conditions [59]. Since larger ions prefer the T-site of the 2-3 Sp, the Si-free MgAl2O4-Sp should generally adopt a normal Sp structure, as verified by some studies on natural Sp with compositions close to the MgAl2O4 formula (x = ~0.02–0.04 in Schmocker & Waldner [47]; x = 0.05 in Maekawa et al. [51]). By the same token, Si in the MgAl2O4-Sp should occupy the M-site. However, existing single-crystal XRD studies on natural 2-3 Sp locate Si on the T-site [73,75,76,77]. The coupled substitution of Si and Mg for 2Al as observed in our high-P synthetic MgAl2O4-Sp and the site-occupation knowledge to be revealed by our Raman spectroscopic data should shed light on the Si distribution.

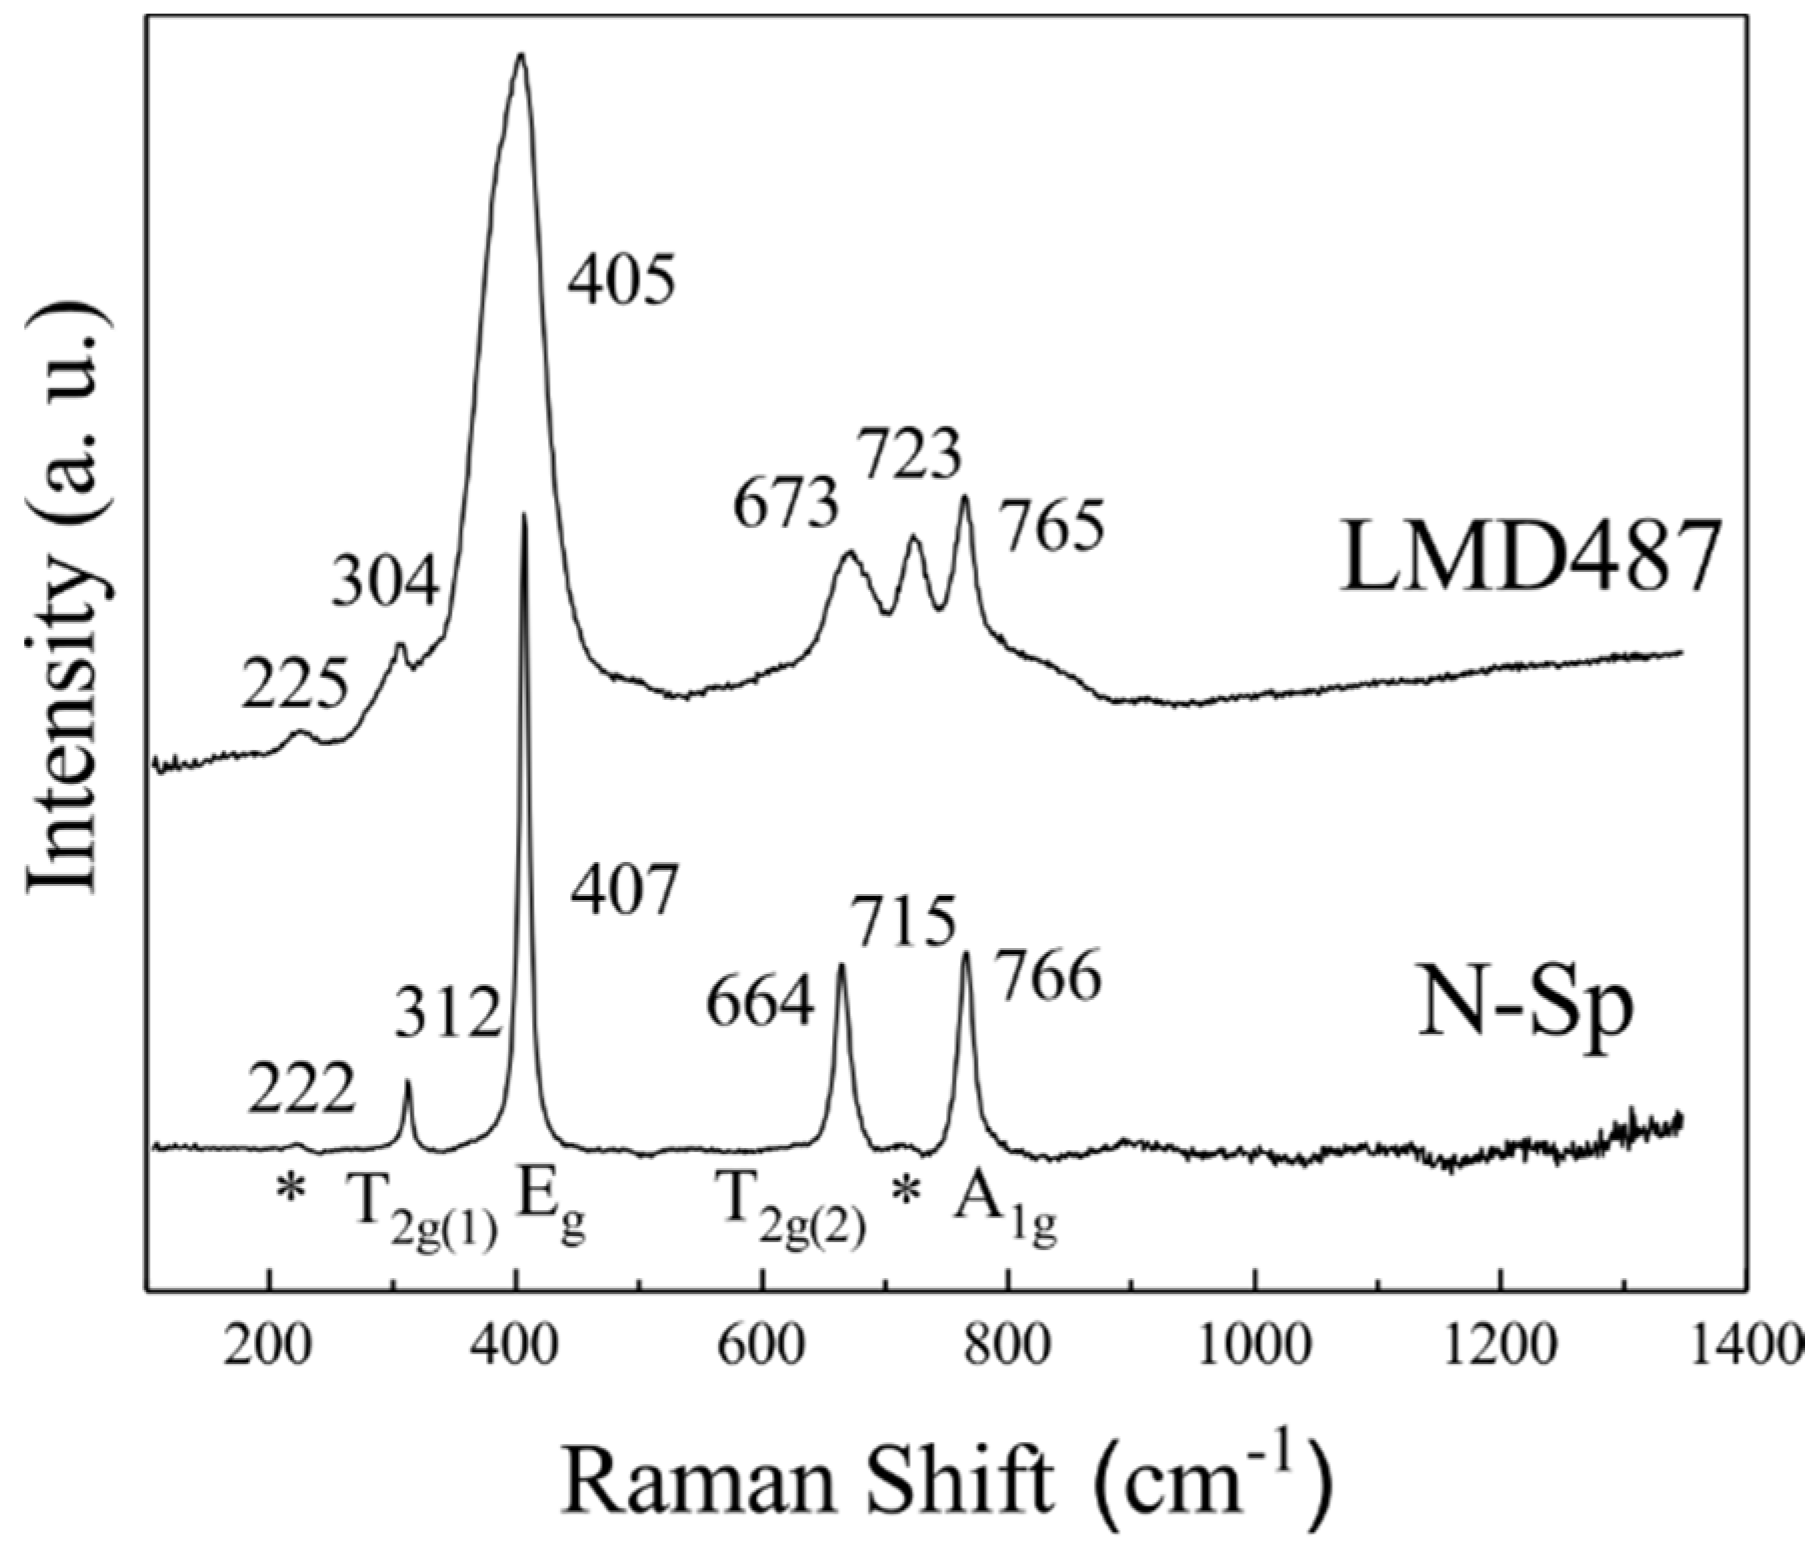
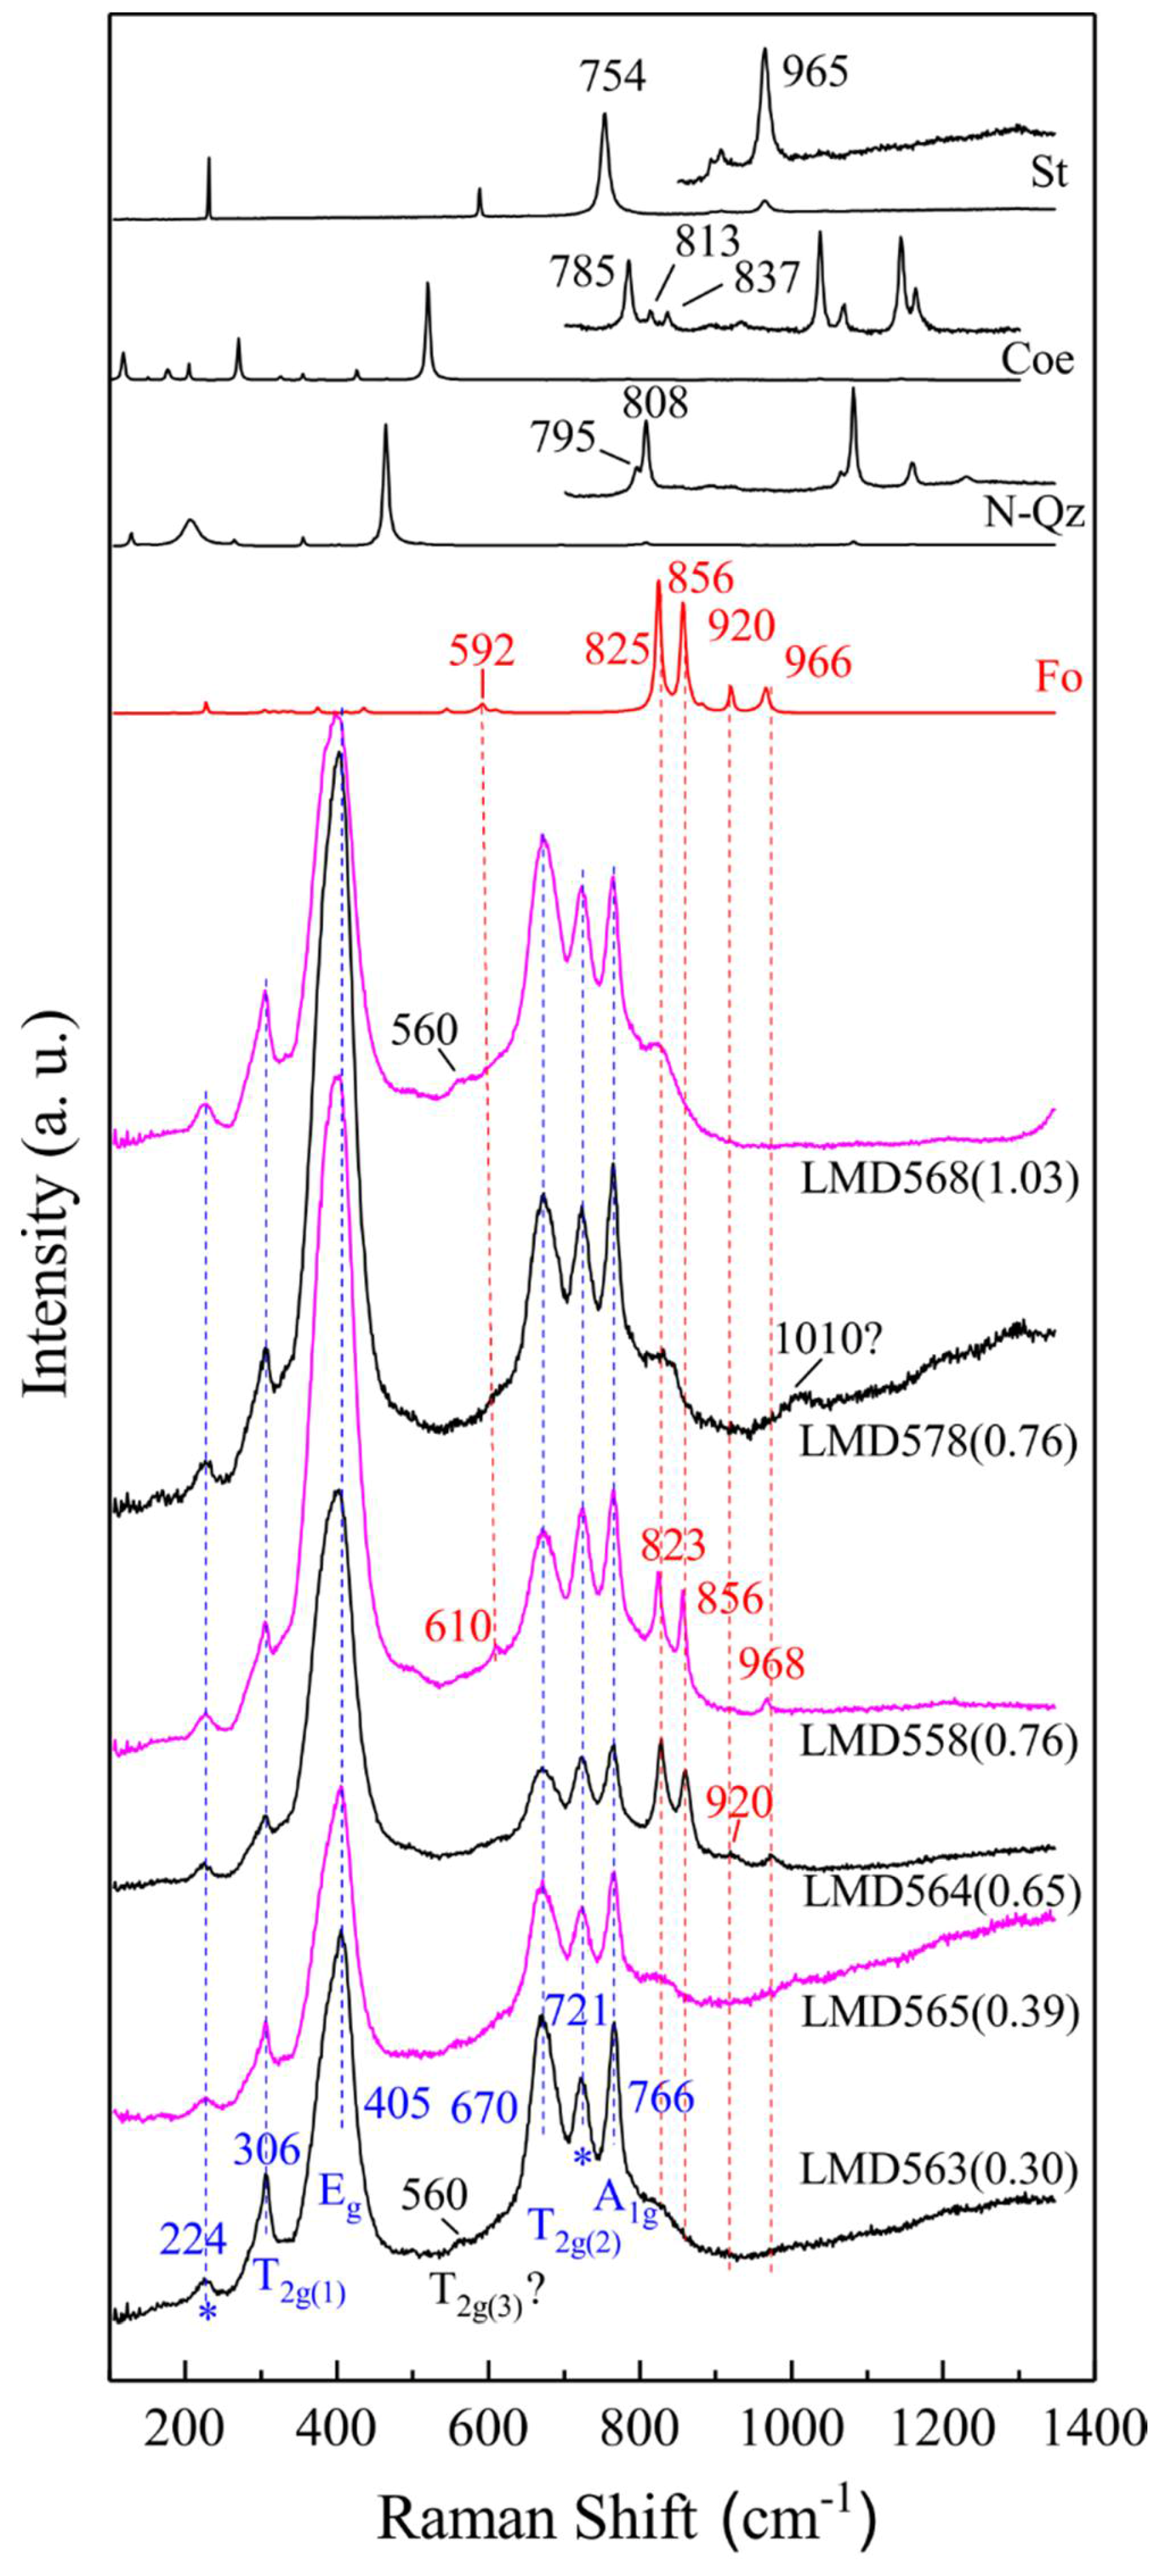
3.2. Raman Features of Nearly Normal MgAl2O4-Sp

There are two chemical formula units per primitive unit cell of normal MgAl2O4-Sp (14 atoms), which leads to three acoustic modes and 39 optic modes according to group theory. Five Raman-active fundamental vibrations, A1g + Eg + 3T2g, are predicted [78]. Theoretical calculations yield the A1g at ~762 cm−1, Eg at ~408 cm−1, and T2g at ~667 cm−1 (T2g(2)), ~557 cm−1 (T2g(3)) and ~317 cm−1 (T2g(1); [79,80,81,82,83,84,85]). The intensity of these Raman modes decreases in the order of Eg > T2g(2) > A1g > T2g(1) > T2g(3) [83]. Other than the weakest T2g(3) peak, all of the other four peaks were routinely observed on natural MgAl2O4-Sp with very low and insignificant amounts of impurities like SiO2, TiO2, Cr2O3, FeO and/or ZnO [49,57,78,86,87].
Our N-Sp displays four sharp peaks at ~312, 407, 664 and 766 cm−1, compatible with the Raman features established for normal MgAl2O4-Sp (Figure 4). Furthermore, two weak and broad peaks are observed at ~222 and 715 cm−1, which are attributable to the slightly disordered structural feature (x = 0.145). The small peak at ~715 cm−1 was also evident in the Raman spectra of the natural MgAl2O4-Sp studied by Chopelas & Hofmeister [78] and by Cynn et al. [86]. Both samples attained some structural disorder: using Equation (1), the x value of the former sample was calculated as ~0.144 (u = 0.2633); the x value of the latter sample was claimed to be ~0.02, which might have been slightly underestimated (more discussion later). On the other hand, it was not observed for the natural MgAl2O4-Sp studied by Cynn et al. [49], Van Minh & Yang [87] or Slotznick & Shim [57], implying x values smaller than at least ~0.145. No Raman spectra previously collected on unannealed natural MgAl2O4-Sp showed the weak peak at ~222 cm−1. The sample studied by Chopelas & Hofmeister [78] had an x value comparable to our N-Sp, so a weak peak at ~222 cm−1 should be expected. Chopelas & Hofmeister [78], however, did not report any Raman data below ~250 cm−1.
In situ high-T Raman spectroscopic investigations on natural MgAl2O4-Sp were conducted by Cynn et al. [49,86], Van Minh & Yang [87], and Slotznick & Shim [57]. The weak peak at ~715 cm−1 evidently emerged or intensified at high T, and persisted to ambient T after cooling, so that it could be confidently attributed to the high-T structural disorder process. Theoretical investigations have confirmed this attribution [81,83]. In comparison, an even weaker Raman peak at ~222 cm−1 was detected at high T by Slotznick & Shim [57] only, and was similarly attributed to the high-T structural disorder process. Additionally, it was observed by Cynn et al. [86] on the natural MgAl2O4-Sp after, rather than before, their high-T Raman spectroscopic experiments.
The two Raman peaks at ~222 and 715 cm−1 directly observed on our N-Sp (x = ~0.145) may provide a convenient and inexpensive method to quantify the disorder extent of natural 2-3 Sp. Recording rich genetic conditions such as chemical environment, geological setting, and cooling history [77,88], natural 2-3 Sp commonly has an x value ranging from 0 to ~0.23 ([89]; and references therein). The x parameters are usually constrained by applying the single-crystal XRD method, powder neutron diffraction or nuclear magnetic resonance spectroscopy, which is often instrumentally unavailable, technically challenging, requires a large quantity of homogeneous sample, and/or costs too much in terms of funds and time. Raman spectroscopy is, however, the exact opposite. The Raman feature at ~715 cm−1 has high intensity, and is well separated from the A1g band at ~766 cm−1, so that it can be readily used to estimate the disorder extent (Figure 4). With fixed analytical conditions in the Raman spectroscopic experiments, the intensity ratio of these two peaks should reflect the inversion extent according to the following equation [86]:
x = 1/[1 + c(I766/I715)]
where c is an unknown coefficient presumably dependent to the analytical setups, and I represents either the peak height or integrated area. With the peak height data (or integrated area data) of our N-Sp, I715 = 1672(437) and I766 = 30,257(548) cps (or I715 = 22,995(5993) and I766 = 664,010(7038) cps cm−1), c is estimated as 0.33(9) (or 0.20(6)). Applying this value to the Raman data of the unannealed natural MgAl2O4-Sp of Cynn et al. [86] leads to an x value of ~0.06 (or 0.09). Cynn et al. [86] obtained x = 0.02 by assuming c = 1. We prefer the larger x value, simply because a disorder extent of 0.02 in the MgAl2O4-Sp structure may not be high enough to bring forth the Raman peak at ~715 cm−1.

3.3. Mg-Al Order-Disorder State of Synthetic MgAl2O4-Sp

The Mg-Al order-disorder states of our synthetic MgAl2O4-Sp can be estimated using the results from the in situ observations under high P-T conditions made by Méducin et al. [45], as shown in Figure 5.
There has been excellent agreement on the T effect on the Mg-Al disorder process of the MgAl2O4-Sp at ambient P: x increases as T increases [42,47,48,50,51,53,54,55,56,57]. As to the P effect at ambient T, discrepancy presumably exists because the order-disorder reaction could not be readily activated and did not adequately approach its equilibrium during the course of a conventional high-P study [52,90,91]. Thanks to Méducin et al. [45] who conducted an investigation under simultaneously high-P and high-T conditions (up to 3.2 GPa and 1318 °C), the P effect at relatively high T has been well established: x increases as P increases. It is thus clear that our synthetic MgAl2O4-Sp, formed under high P-T conditions, should attain large degrees of cation disorder, which should be well preserved due to the quick quench process in the cubic press experiments (T decreased to <600 °C in ~20 s).
Claimed by Méducin et al. [45], the heating-up experiments at T ≥ 500 °C closely reached their cation order-disorder equilibrium, with the P almost linearly correlating with the T (Figure 5a). Since both P and T promote Mg-Al disorder under simultaneously high-P and high-T conditions, the effects of P and T can be lumped together and adequately accounted for by using just one independent variable. Here, we have chosen T (Figure 5b). Coincidently, our synthesizing experiments at 4 GPa and 1500 to 1550 °C (Table 1) plot rather near the P-T locus defined by those heating-up experiments at T ≥ 500 °C (Figure 5a), suggesting that, with a short-distance extrapolation, the x values of the MgAl2O4-Sp from our experiments at 4 GPa could be accurately estimated. Using the equation shown in Figure 5b, the derived x values are from 0.70(15) to 0.73(15); therefore, the true x values should be close to 0.667 (random Mg-Al distribution). In addition, the x values of our synthetic MgAl2O4-Sp at 5 and 6 GPa should also be ~0.667 due to the even higher experimental P and T (Figure 5a). Furthermore, the x values obtained for the P-T conditions of 2.8 GPa and 1163 °C, and 3.2 GPa and 1318 °C by Méducin et al. (2004) [45] were 0.571(49) and 0.633(50), respectively, implying that the x of our MgAl2O4-Sp at a similar P of 3 GPa but a much higher T of 1500 °C (LMD565; Table 1) should be close to 0.667, as well.
Assuming no effect of the additional Si with abundances ≤~0.025 pfu (Figure 3), we conclude that our synthetic MgAl2O4-Sp should achieve a nearly random Mg-Al distribution.

3.4. Raman Features of Fully Disordered MgAl2O4-Sp

The Raman spectrum of our synthetic Si-free MgAl2O4-Sp (LMD487) is compared to that of our N-Sp in Figure 4. It similarly shows six peaks at slightly different wavenumbers, although with all peaks significantly broadened. Compatible with the observations made by Cynn et al. [49,86] and Slotznick & Shim [57], the A1g, Eg and T2g(1) modes shift slightly to lower wavenumbers, whereas the T2g(2) mode shifts slightly to higher wavenumbers, as x increases from ~0.145 to 0.667. In addition, the Eg band becomes not only very broad, but highly asymmetric, as well, indicating a possible hiding Raman peak. According to Caracas & Banigan [84], a very intense Raman feature should occur at the lower wavenumber side of the Eg peak when the MgAl2O4-Sp disorders. Moreover, the two weak, broad, and Mg-Al disorder-related peaks at ~723 and 225 cm−1 become much more distinct in the Raman spectrum of the synthetic Si-free MgAl2O4-Sp. All these are diagnostic features for a high degree of Mg-Al disorder.
With Equation (3), and adopting x = 0.667, the peak height data (or integrated area data) of our synthetic Si-free MgAl2O4-Sp, I723 = 7148(215) and I765 = 10,986(228) cps (or I723 = 181,810(5451) and I765 = 240,020(6329) cps cm−1), lead to a c value of 0.32(2) (or 0.38(2)), which is again much smaller than the assumed value of 1 in Cynn et al. [86]. Combining this result with that determined by the Raman data of our N-Sp, 0.33(9) or 0.20(6), the c coefficient appears generally constant for a large range of x, supporting the constant c assumption made by Cynn et al. [86]. To confirm this, more investigation on the MgAl2O4-Sp with different disorder extents using jointed experimental methods to simultaneously obtain Raman spectroscopic data, chemical compositional data and crystal structural data like what we have done in this study is highly desirable.

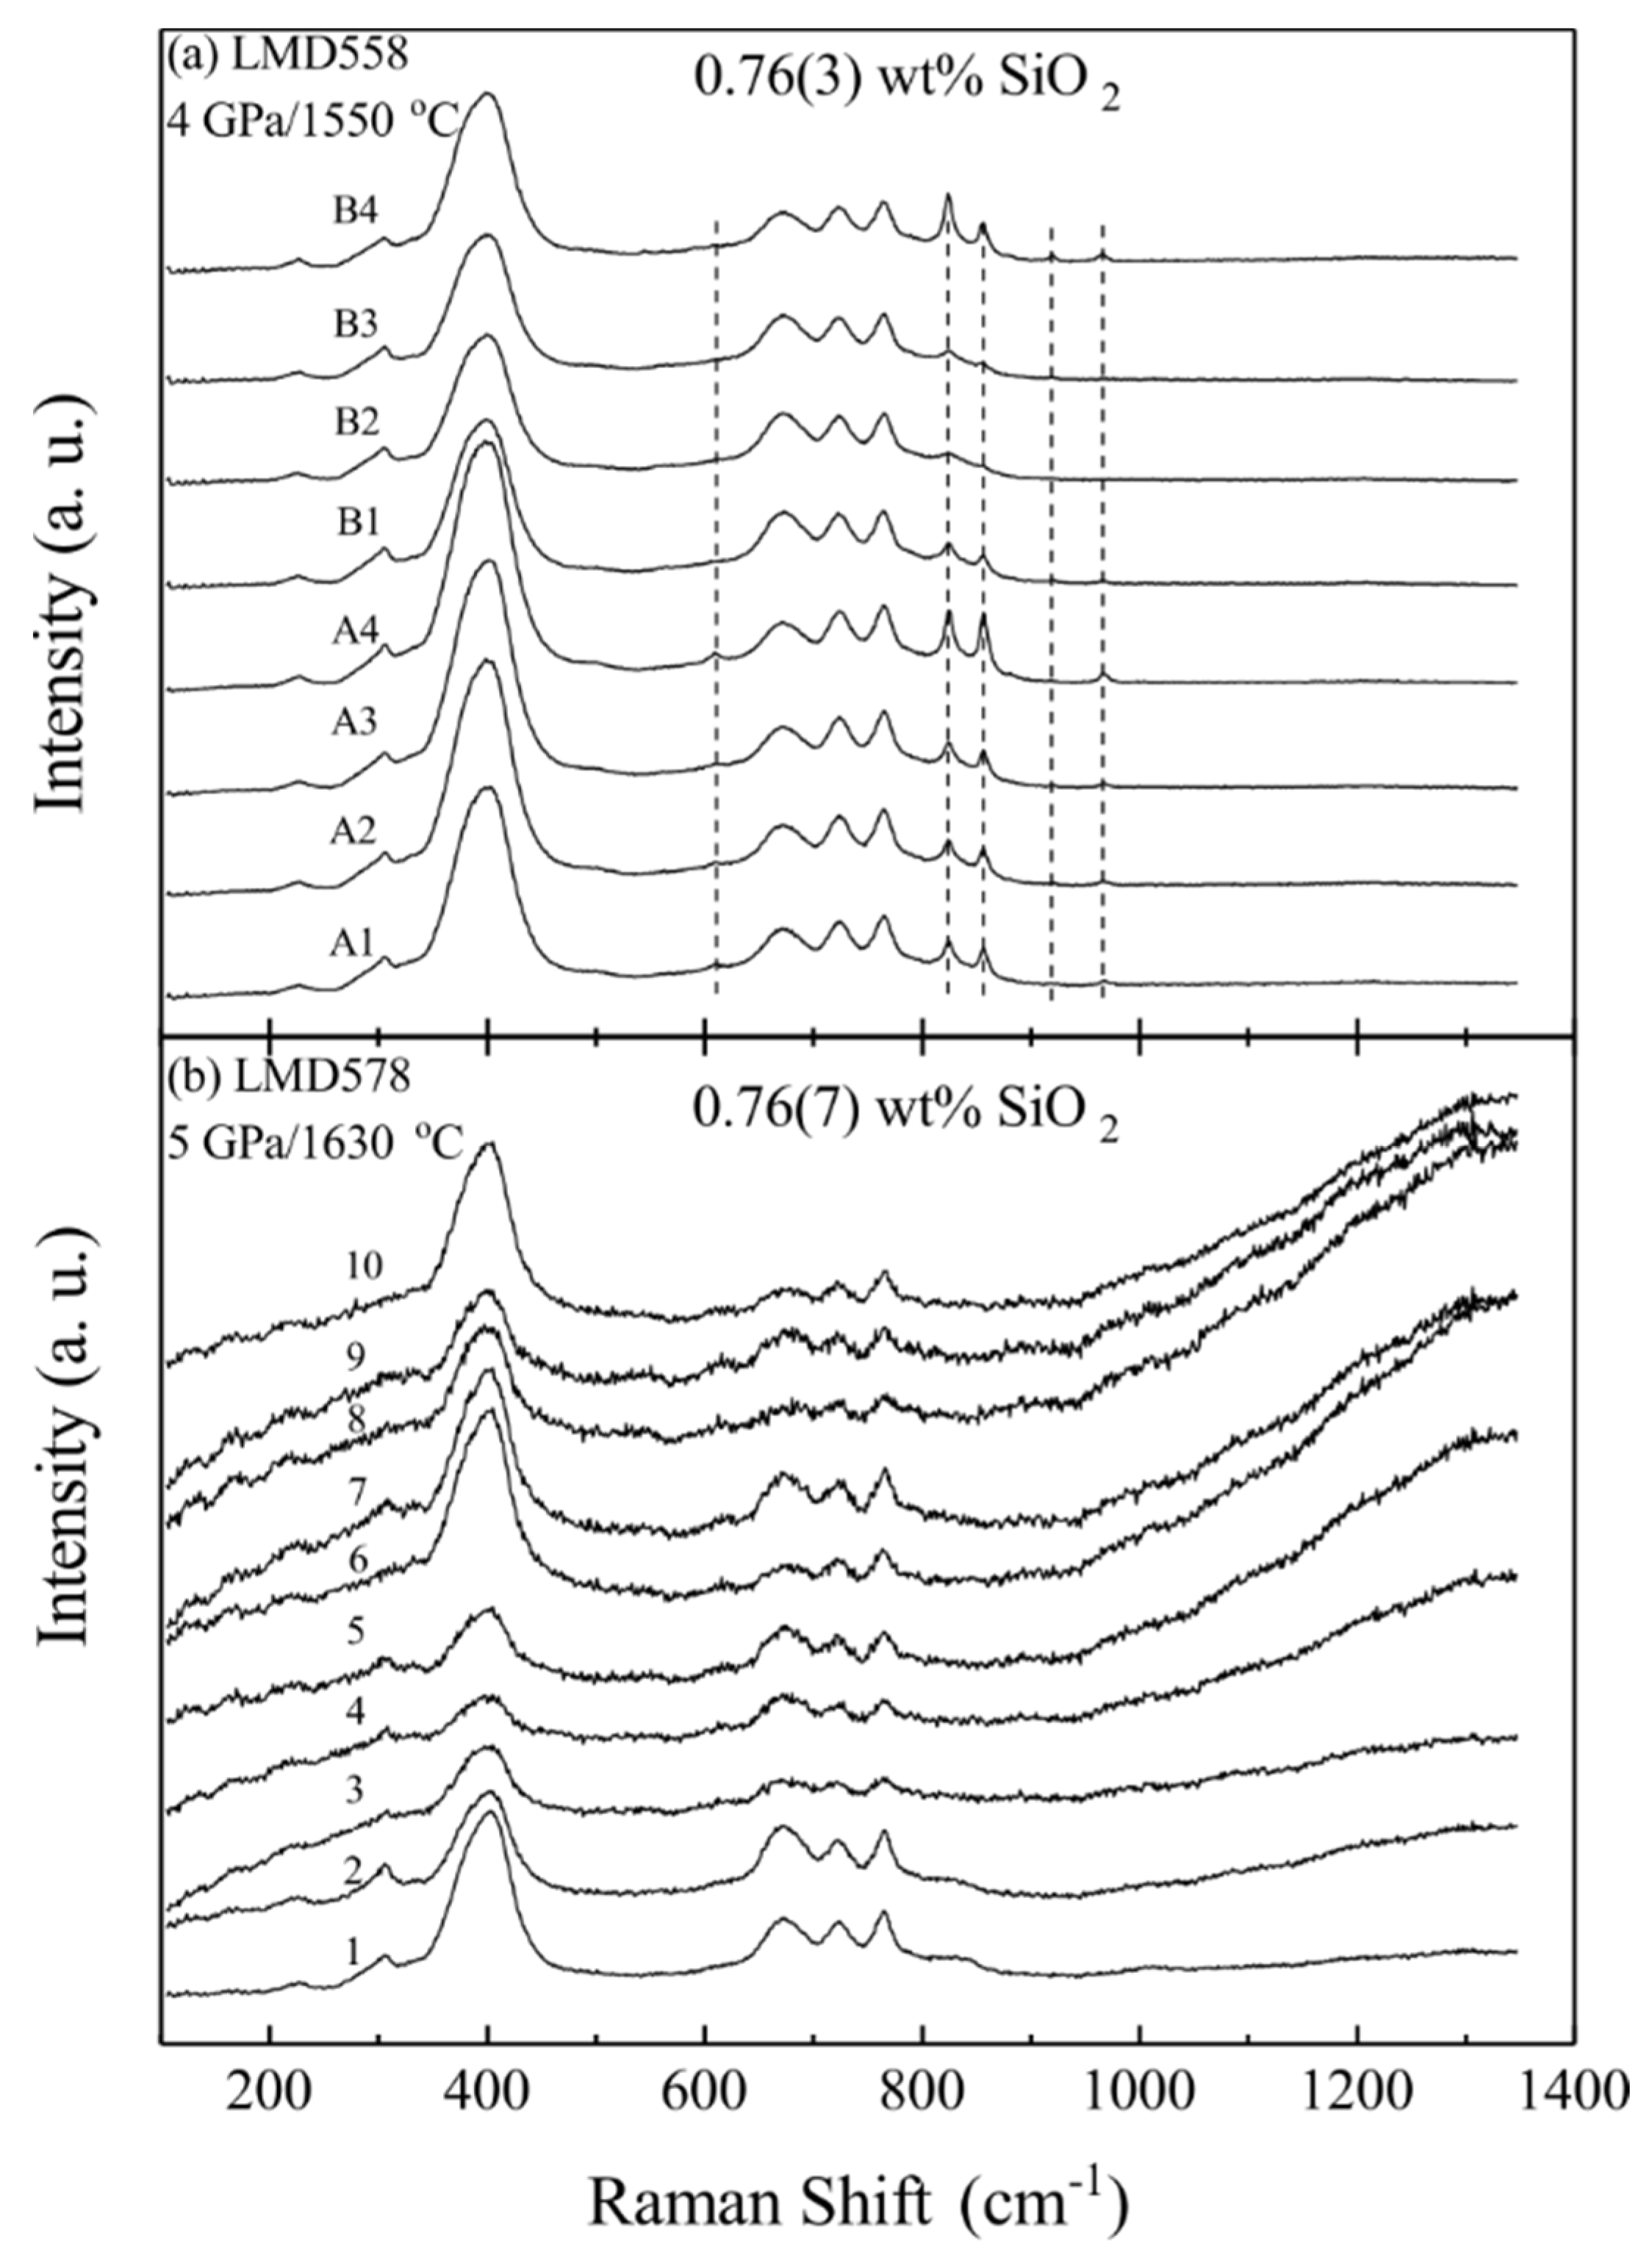
3.5. Raman Features of Si-Bearing Fully Disordered MgAl2O4-Sp

The octahedra in the Sp structure share six edges with six neighboring octahedra, resulting in an extensively edge-linked structure in three dimensions [92]. In comparison, the tetrahedra are fully isolated from each other, with their four oxygen atoms linking to four neighboring octahedra. If Si occupied the M-site of the MgAl2O4-Sp, its Raman signals would be much analogous to those of St, which similarly places Si in edge-shared octahedra [93]. If Si occupied the T-site, alternatively, its Raman signals would resemble those of Fo because Si in Fo also adopts an isolated T-site and forms a separate SiO4 group, with the oxygen atoms being shared between neighboring octahedral [94]. On the other hand, Si atoms in low Qz [95] and Coe [96] are 4-coordinated, but the SiO4 tetrahedra are fully polymerized into a three-dimensional framework, so that the Raman features of low Qz and Coe should be very different to those of potential SiO4 groups in the Sp structure.
Apart from those six bands previously described, the Si-bearing MgAl2O4-Sp shows a new set of well-defined Raman bands at ~610, 823, 856 and 968 cm−1 (Figure 6). These peaks are distinctly different to the Raman features of St, Coe and N-Qz, but highly resemble those of Fo. Furthermore, a less well-defined peak with low intensity occasionally appears at ~920 cm−1, and perfectly matches the relatively weak 920 cm−1 Raman peak of Fo (Figure 6). In analogy with the Raman features of Fo [97], we tend to attribute these five peaks to potential separate SiO4 groups in our Si-bearing, fully Mg-Al disordered MgAl2O4-Sp, and assign the peaks at ~968, 920 and 856 cm−1 to the asymmetric stretching of the SiO4 groups, the peak at ~823 cm−1 to the symmetric stretching, and the peak at ~610 cm−1 to the bending. It follows that at least some Si atoms adopt the T-site.
Furthermore, two weak and diffusive Raman peaks have occasionally been observed at ~560 and 1010 cm−1 for our Si-bearing MgAl2O4-Sp (Figure 6), with the former attributable to the usually undetected fifth fundamental Raman band of the MgAl2O4-Sp (T2g(3)) and the latter likely featured as a combination band/overtone.
The intensities of the Raman peaks attributable to the SiO4 groups show interesting behavior. Considering the very low SiO2 contents in the MgAl2O4-Sp from LMD563 and LMD565 (0.30(7) wt % and 0.39(5) wt %, respectively; Table 1), the low intensities of the new Raman peaks at ~610, 823, 856 and 968 cm−1 can be readily explained by the small amounts of the SiO4 group (Figure 6). As the SiO2 contents increase, one would anticipate these peaks to grow if some of the added Si entered the T-site. Surprisingly, the Raman spectra of our MgAl2O4-Sp with higher SiO2 contents, from 0.65(7) to 1.03(7) wt %, show distinctly divergent behaviors (Figure 6), with the new Raman peaks at ~610, 823, 856 and 968 cm−1 intensifying for the MgAl2O4-Sp synthesized at relatively low P-T conditions (4 GPa and 1500 °C for LMD564, and 4 GPa and 1550 °C for LMD558; Table 1) but increasing little for the MgAl2O4-Sp synthesized at relatively high P-T conditions (5 GPa and 1630 °C for LMD578, and 6 GPa and 1650 °C for LMD568). Evidently, some of the Si atoms added into the MgAl2O4-Sp did take the T-site under relatively low P-T conditions, but most them did not under relatively high P-T conditions. It follows that some Si atoms in the MgAl2O4-Sp from LMD578 and LMD568 must have adopted the M-site and formed SiO6 groups (Figure 6).
The SiO6 groups seem Raman-inactive. With similar amounts of SiO2, the MgAl2O4-Sp from LMD558 shows much stronger Raman peaks for its SiO4 groups than that from LMD578 (Figure 7), suggesting that the former generally contains more SiO4 groups, but the latter contains more SiO6 groups. In both cases, no new Raman peaks can be confidently identified, implying that the SiO6 groups in the MgAl2O4-Sp are by and large Raman-inactive. Different crystallographic orientations are unlikely to affect this conclusion. As shown in Figure 7a, the two sets of unpolarized Raman spectra for the MgAl2O4-Sp in LMD558 (Set A and Set B), taken from the only crystal shown in Figure 2a, but with crystallographic orientations normal to each other, do display some variations in the intensities of the Raman peaks for the SiO4 groups, but overall exhibit very similar patterns. Furthermore, the 10 unpolarized Raman spectra taken from 10 randomly-selected MgAl2O4-Sp grains in LMD578 do not show much variation in their overall appearance as well (Figure 7b).

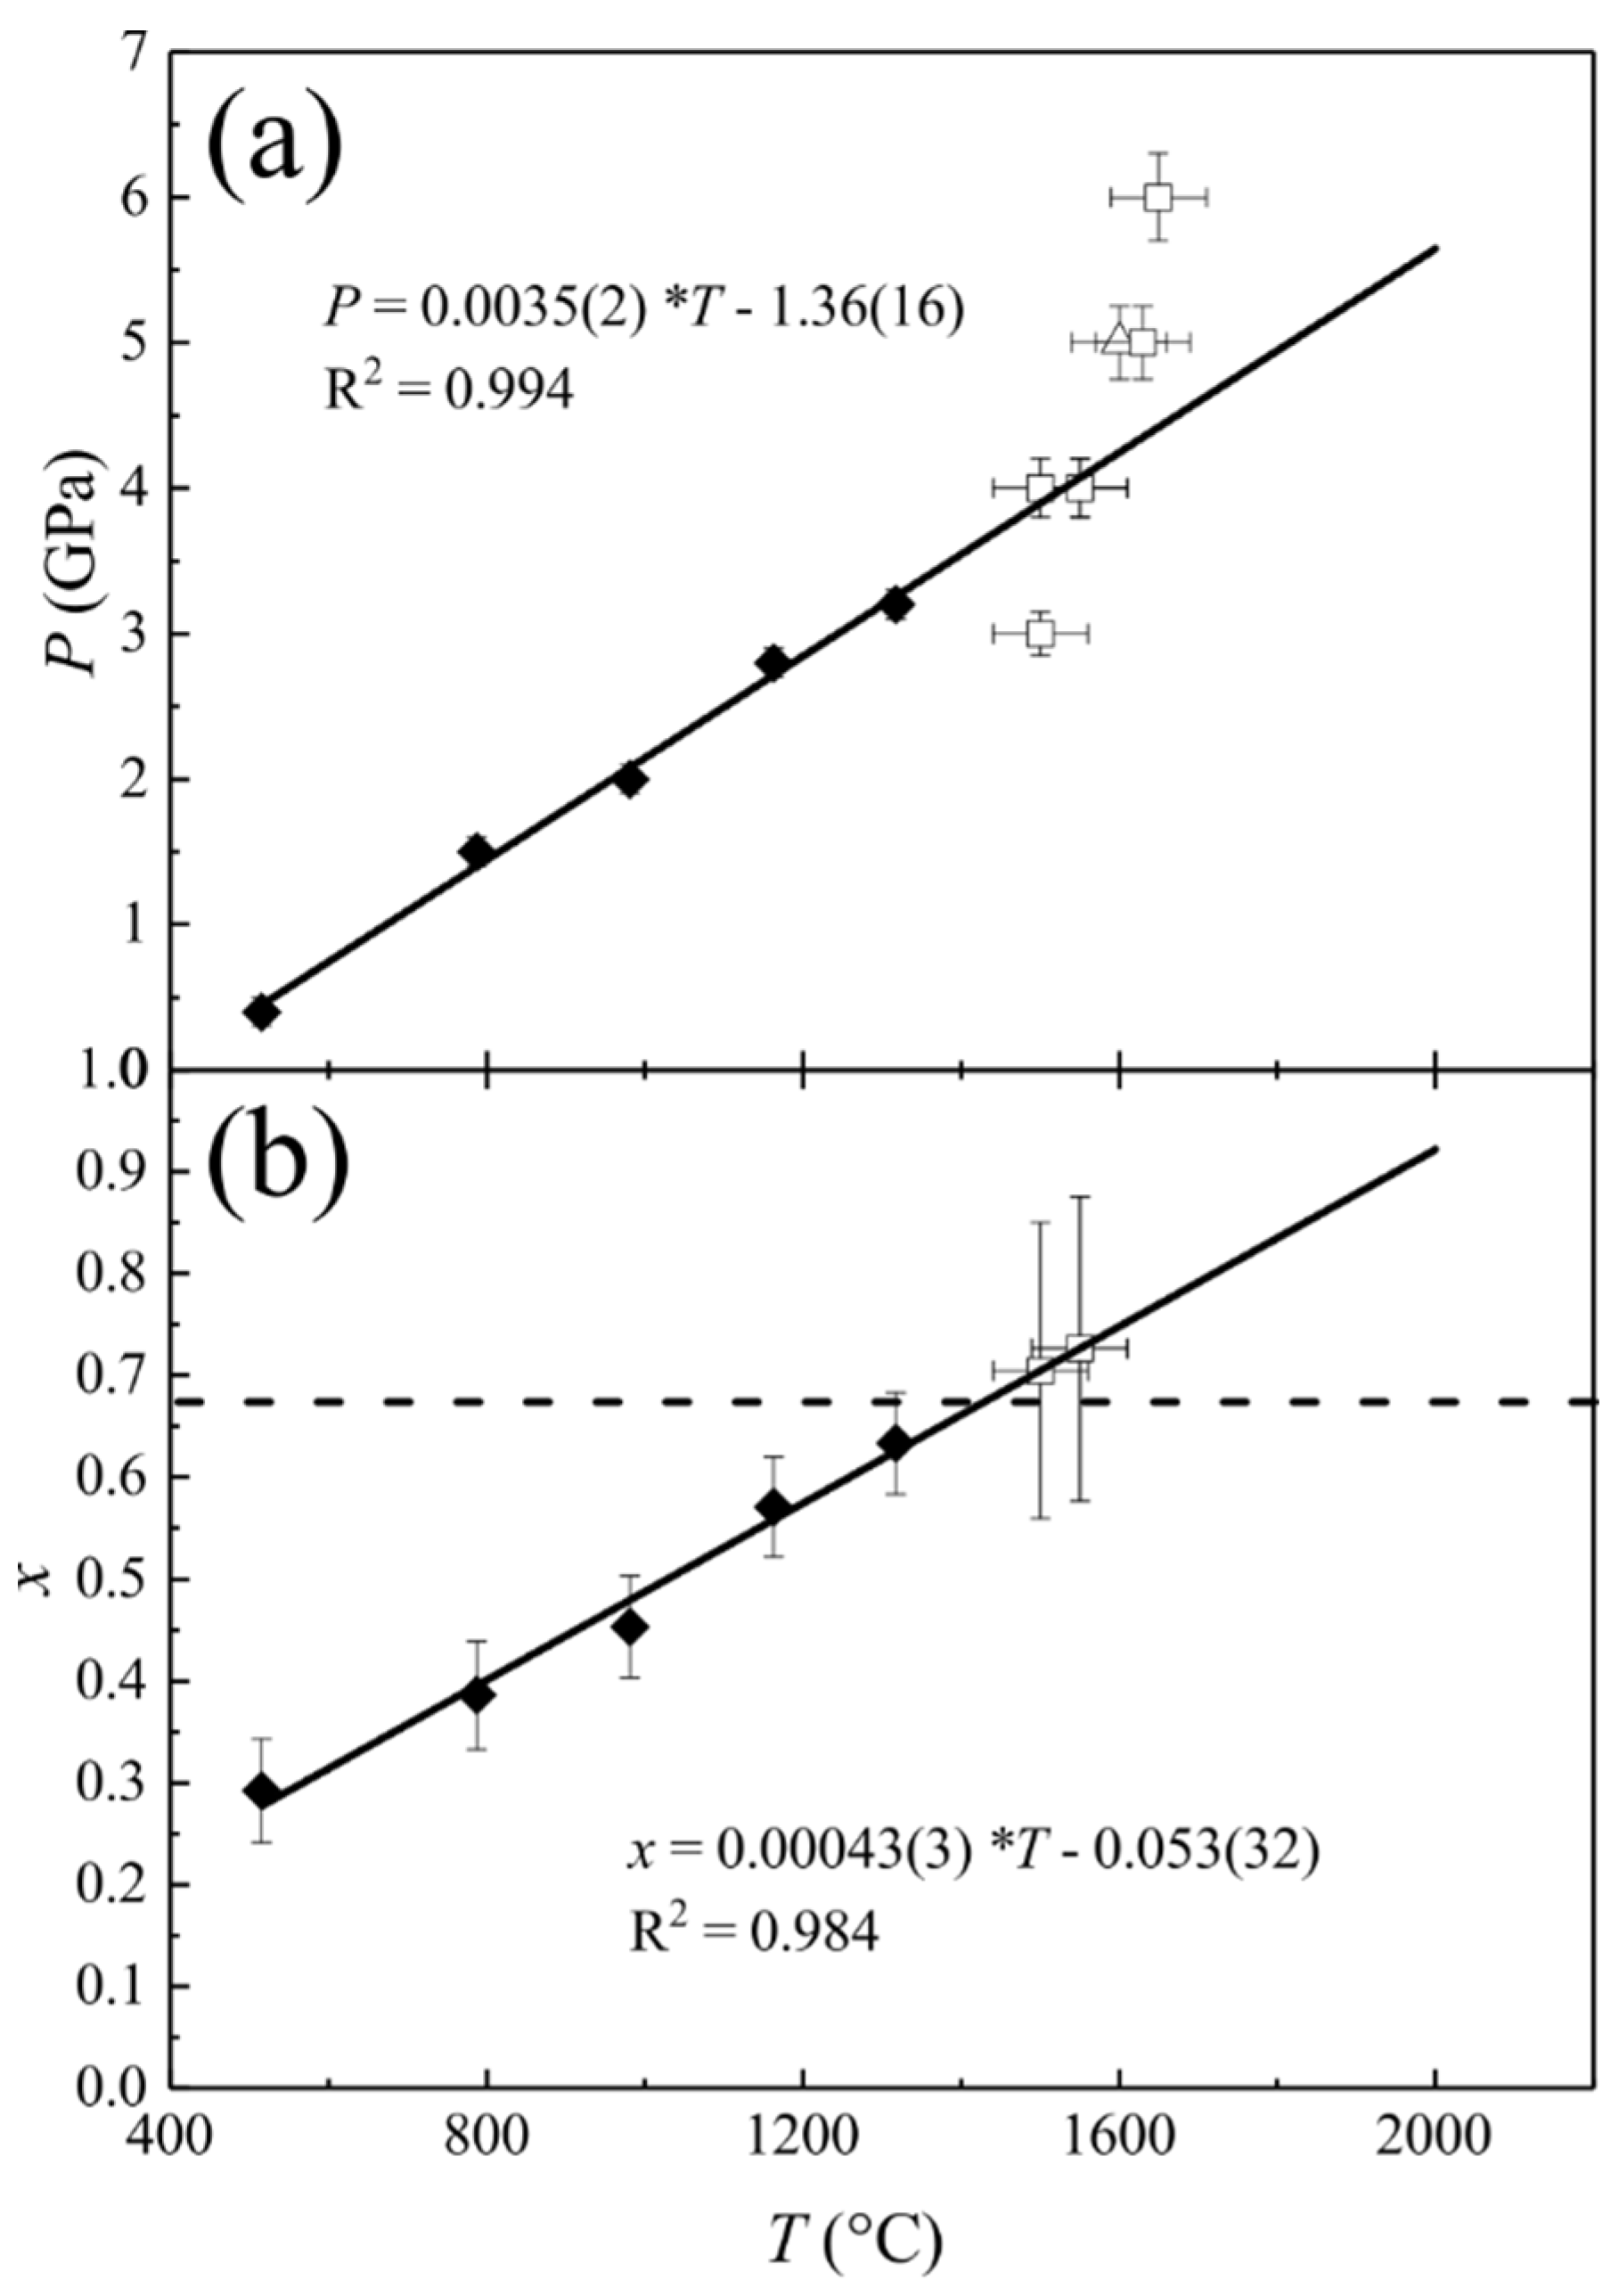
3.6. Si-Disordering in Fully-Disordered MgAl2O4-Sp

In the MgAl2O4-Sp with SiO2 contents as low as ~0.65–0.76 wt %, the Raman peaks for the minor SiO4 groups can be as intense as those for the major (Mg,Al)O4 groups (Figure 6 and Figure 7a), so that the relationships among the Raman intensity, SiO2 content, Si disorder state and P-T condition are worth of further exploration.
We can write the formula [4](Mg0.333Al0.667)[6](Al1.333Mg0.667)O4 for a Si-free Mg-Al fully disordered MgAl2O4-Sp (x = 0.667). Ignoring the effect of small amounts of Si, one obtains [4](Mg0.333Al0.667Siy)[6](Al1.333Mg0.667Siz)O4 for the Si-containing Mg-Al fully-disordered MgAl2O4-Sp. The Si disorder state is then defined as y = [Siy]/([Siy] + [Siz]) = [Siy]/[Sitotal], with y = 1 indicating all Si on the T-site, y = 0 indicating all Si on the M-site, and y = 0.333 indicating a random Si distribution. Under certain analytical conditions in the Raman spectroscopic experiments, the intensity of a Raman peak caused by one type of structural unit i (SiO4 here) is proportional to its abundance ([i]; [Siy] here), Ii = ci × [i] ([86]; ci is a constant), leading to
I S i O 4 = c S i O 4 × [ S i y ] = c S i O 4 × y × ( [ S i y ] + [ S i z ] )
where [Siy] + [Siz] = Sitotal = 0.0237 × SiO2 wt % for cases with small amounts of SiO2 (as implied by Equation (2)). With the SiO4 groups represented by the Raman peaks at ~823 and 856 cm−1 and the (Mg,Al)O4 groups by those at ~725 and 766 cm−1, we obtain
I S i O 4 I ( M g , A l ) O 4 = I 823 + I 856 I 725 + I 766 = c S i O 4 × y × 0.0237 × S i O 2 w t % I 725 + I 766
The term c S i O 4 × 0.0237 I 725 + I 766 is essentially a constant (C), so that Equation (5) can be briefed as
I 823 + I 856 I 725 + I 766 = C × y × S i O 2 w t %
Evidently, the variable I 823 + I 856 I 725 + I 766 of the Mg-Al fully-disordered MgAl2O4-Sp with certain y should be linearly correlated with the SiO2, and the curve should pass through the origin (the case of zero SiO2).
Without knowing the y value, it is impossible to obtain the value of the constant C, which in turn impairs the application of Equation (6). Nevertheless, for the two extreme cases of all Si entering the T-site (y = 1) and Si attaining a fully disordered distribution (y = 0.333), the ratio of the two slopes (C and 0.333C, respectively) should be 3, which in fact represents the maximum ratio of any two slopes.
Our experimental data are summarized in Table 2, and shown in Figure 8. Both LMD563 and LMD558 ran at 4 GPa and 1550 °C, such that they formed a special group (Group 2) that acquired similar Si order-disorder states (identical y values). These two experimental data, plus the zero SiO2 case, then define a curve for this particular y, with its slope of S2 = 0.703(248). The uncertainty of the slope is somehow large, reflecting the limited accuracy of the data.
The curve constrained by the experiments of Group 2 divides the remaining four experiments into two groups, with one group including LMD565 and LMD564 conducted under relatively low P-T conditions (Group 1 with larger y), whereas the other group, including LMD578 and LMD568, was conducted under relatively high P-T conditions (Group 3 with smaller y). Due to the good linear relations (Figure 8), we attempted weighted linear least-squares fit and obtained S1 = 0.935(17) for the experiments of Group 1 and S3 = 0.349(26) for the experiments of Group 3. The assumption behind this practice is that the y values of the MgAl2O4-Sp from the experiments in either Group 1 or Group 3 are constant. Whether this assumption is justified or not is unimportant, since one can always draw a line through the origin and one single experimental data point, and subsequently define a slope for that particular case. The key observation here is that the ratio between S1 and S3 is 2.68(21), a value close to 3. This means that the curve defined by the experiments of Group 1 generally approximates the case of all Si residing on the T-site (y = 1), and the curve defined by the experiments of Group 3 closely approaches the case of a fully random Si distribution (y = 0.333). It thus follows that with small variations of P and T, from 3–4 GPa to 5–6 GPa, and from 1500 to 1630–1650 °C, Si in the Mg-Al fully-disordered MgAl2O4-Sp drastically changes from a fully-ordered distribution on the T-site to a completely random distribution.
With the y values for the Mg-Al fully-disordered MgAl2O4-Sp from LMD565, LMD564, LMD578 and LMD568, we have calculated the constant C, and obtained 0.93(15), 1.19(58), 0.88(59) and 1.08(31), respectively. Indeed, the constant C is constant, averagely 1.02(14), which then allows us to add into Figure 8 a set of curves with fixed y values to show the relationship between the I 823 + I 856 I 725 + I 766 and SiO2.
Some interesting points emerge from Figure 8. Firstly, the Raman peaks of the minor SiO4 group are very prominent, compared to those of the major (Mg,Al)O4 group. For ~1.1 wt % SiO2 fully ordered on the T-site (y = 1), for example, the Raman peaks at ~823 and 856 cm−1 are generally as intense as the Raman peeks at ~725 and 766 cm−1. Secondly, the behavior of the Raman peaks of the SiO4 group strongly correlates with the SiO2 content: relatively weak and with little change for the SiO2-poor MgAl2O4-Sp, but strong and with significant variation for the SiO2-rich MgAl2O4-Sp. Thirdly, the Si-disordering process is independent of the SiO2 content, but is controlled by the formation P and T of the MgAl2O4-Sp. When the P-T conditions change from ~3–4 GPa and 1500 °C to ~5–6 GPa and 1630–1650 °C, the Si cations radically change from fully ordering on the T-site (y = 1) to randomly distributing between the T-site and the M-site (y = 0.333). For the MgAl2O4-Sp with similar SiO2 contents, finally, the ones displaying relatively strong Raman peaks at ~823 and 856 cm−1 should have formed under a relatively low P-T environment, and vice versa.

4. Implications

Electrostatic lattice energy calculations and consideration of the structure of the Sp group of minerals suggest that the larger Mg cations prefer the T-site and the smaller Al cations prefer the M-site, resulting in a generally normal MgAl2O4-Sp at ambient P and T [59]. This principle seems inapplicable to the minor components. The present study indicates that at P-T conditions ≤~3–4 GPa and 1500 °C, covering the P-T range of the top upper mantle of the Earth [98], the even smaller Si cations incorporated by the MgAl2O4-Sp structure appear on the T-site, rather than on the anticipated M-site (y = 1; Figure 8). This result is compatible with existing single-crystal XRD studies on terrestrial Sp, which locate Si on the T-site [73,75,76,77,99]. The current study further shows that presenting as SiO4 groups in the Sp, a small amount of SiO2 like ~1 wt % exhibits very intense Raman peaks at ~823 and 856 cm−1, and can completely alter the stereotypical overall appearance of the Raman spectra established with some SiO2-poor natural 2-3 Sp. Since Si readily enters the 2-3 Sp structure, this result should have important application in identifying the Sp phase, particularly for the circumstances where direct petrographic observation cannot be made. A Raman spectrometer will be launched shortly as part of the ExoMars analytical laboratory and deployed on the Martian surface to investigate the mineralogical and biological aspects of the Mars [100,101]. Considering the wide spreading of the 2-3 Sp on the Earth, the Moon, and the extraterrestrial planets, asteroids and meteorites, it will have high chance to encounter some Sp and collect in-situ Raman spectra. A correct interpretation of these Raman spectra must critically evaluate the effect of Si.
Si starts to enter the M-site of the MgAl2O4-Sp at P-T conditions ≥~3–4 GPa and 1500 °C, and become fully disordered under P-T conditions ≥~5–6 GPa and 1630–1650 °C (Figure 8). However, the 6-coordinated Si may not be easily observable in natural MgAl2O4-Sp. High-P experimental studies have shown that Al-rich 2-3 Sp is not a stable phase for the upper mantle at P > ~3 GPa [102]. On the other hand, adding Cr may stabilize the 2-3 Sp to a much higher P [4], and encapsulating the 2-3 Sp in diamonds may lead to the same result [103]. The Cr-rich 2-3 Sp inclusions in diamonds are thus the best targets in which to look for the 6-coordinated Si.
The almost random Si distribution observed for our Si-bearing MgAl2O4-Sp at P-T conditions ≥~5–6 GPa and 1630–1650 °C strongly hints that at some high P-T conditions the Si cations in the (Mg,Fe)2SiO4-Sp (Rw) might be disordered to large extents. Mg2SiO4-Rw has been conventionally regarded as a normal 4-2 spinel with nearly all Si taking the T-site. The single-crystal XRD data of Sasaki et al. [64] and high-resolution 29Si NMR data of Stebbins et al. [61] did not show any convincing evidence for 6-coordinated Si. In contrast, ~4% Si was inferred to appear on the M-site, based on the systematic deviations of the Si-O bond length determined by new single-crystal XRD data from an average value in silicates [60]. Consideration of the bond length systematics and experimentally measured cation distributions led to a similar conclusion [59]. However, all these conclusions were drawn from the experimental data collected on quenched samples or based on some crystal structural features established for ambient P. In the former cases, the cation disorder information of the Rw at high P might be completely lost. In analogy to the well-known partial preservation of the high-T equilibrium state of the Al-Mg disorder in the MgAl2O4-Sp after quenching [42,53], reordering the Si and Mg cations in the Mg2SiO4-Sp presumably happens fast and proceeds towards its completion as the high-P synthesizing experiment quenches. In the latter cases, the bond length systematics and structural features established for ambient P might not be applicable to the high-P structures. As pointed out by Méducin et al. [45], P has a significant impact on the order-disorder process of the MgAl2O4-Sp, especially in the T range of 477–1227 °C. Some high-P single-crystal XRD investigations have been conducted up to ~28.9 GPa at ambient T, but could not shed light on the Si disorder issue, partially due to the low experimental T potentially unable to trigger the order-disorder reaction, and partially due to the low data resolution caused by the similar X-ray scattering factors of Mg and Si [104,105].
The most likely evidence in the literature of the presence of 6-coordinated Si in the Rw have come from a high-P Raman spectroscopic investigation on synthetic Mg2SiO4-Rw [106] and a spectroscopic study on some meteoritic Rw [62]. At P > ~30 GPa, a weak and diffusive Raman peak appeared and was interpreted as the signature for the presence of Si-O-Si linkages and/or partial increase in the coordination of Si [106]. We propose that this peak might belong to the MgO4 groups in the Mg2SiO4-Rw, which would in turn indicate the presence of the SiO6 groups resulted from the position exchange of the Si and Mg cations. According to Chopelas et al. [107], the MgO6 groups in the normal Mg2SiO4-Rw are Raman-silent, and the SiO4 groups are responsible for all the Raman peaks. Since the order-disorder process in the Sp is non-convergent (i.e., the symmetry of the Sp is maintained at any inversion), no new Raman peaks should be expected from the SiO6 groups in the disordered Mg2SiO4-Rw, exactly like what we have observed for the Si-bearing MgAl2O4-Sp (Figure 6 and Figure 7). On the line of the study about the meteoritic Rw, Taran et al. [62] used a range of analytical methods including optical absorption spectroscopy to investigate some synthetic (Mg,Fe)2SiO4-Rw, and two compositionally homogenous but doubly-colored meteoritic Rw grains (Grain 1, one part being colorless and the other part blue; Grain 2, one part being blue and the other part dark blue) from two L6-type ordinary chondrites NWA 1662 and NWA 463. They proposed that for the meteoritic Rw, the part with no color was inverse Rw, other parts with various colors were Rw with different amounts of cation inversion. In order to confirm their hypothesis, more investigation should be conducted on the meteoritic Rw, which represents the best natural specimen for studying high-P structural features, including the Mg-Si order-disorder state, due to its having much larger quench rates. Rw of various colors has been documented in many meteorites, including L ordinary chondrites [108,109,110,111,112], LL ordinary chondrites [14,26], and Martian meteorites like the shergottites [32,34,37]. If the relationship among the color, composition, inverse magnitude, P and T can be adequately quantified, a fine scale for accurately estimating the shock P-T conditions may be derived, which may serve well the theoretical evolution models of the early solar system.
If the Rw in the LP-MTZ attained substantially higher degrees of inverse than those experimentally observed so far, the mineralogical model of the upper mantle and the nature of the 520-km and 620-km seismic discontinuities would need further careful examination. Some empirical and theoretical studies have demonstrated that the cation disorder process in the Rw leads to significantly larger thermal expansion coefficients, smaller bulk modulus, and smaller shear modulus [19,44,46,63]. As a result, a 12.5% Si-Mg disorder can decrease the seismic velocities by ~3–5% [19,46]. Direct experimental investigations on the cation inversion of the Rw at the P-T conditions of the LP-MTZ are therefore of high priority.

Supplementary Materials

The following are available online at https://www.mdpi.com/2075-163X/8/5/210/s1, Table S1: Details of structure refinement, Table S2: Structural data of N-Sp.

Author Contributions

Xi Liu (designing the project). Liping Liu (writing the initial draft of the work). Xi Liu (writing the final paper). Xi Liu, Liping Liu and Xinjian Bao (interpreting the results). Liping Liu, Qiang He and Renbiao Tao (conducting high-P experiments). Liping Liu, Wei Yan, Yunlu Ma and Mingyue He (collecting Raman spectra). Xinjian Bao, Liping Liu and Ruqian Zou (collecting and interpreting the single-crystal X-ray data). Liping Liu (performing EMP analyses). Mingyue He (helping in checking the draft of the paper). All authors discussed the results and commented on the manuscript.

Acknowledgments

We thank four anonymous reviewers for constructively commenting on our manuscript, and guest editor Davide Lenaz for processing our paper. This study was financially supported by the Strategic Priority Research Program (B) of Chinese Academy of Sciences (Grant No. XDB18000000), by the DREAM project of MOST, China (Grant No. 2016YFC0600408), and by the Program of the Data Integration and Standardization in the Geological Science and Technology from MOST, China (Grant No. 2013FY1109000-3).

Conflicts of Interest

The authors declare no conflict of interests.

References

  1. Evans, B.W.; Frost, B.R. Chrome-spinel in progressive. Geochim. Cosmochim. Acta 1975, 39, 959–972. [Google Scholar] [CrossRef]
  2. Barnes, S.J.; Roeder, P.L. The range of spinel compositions in terrestrial mafic and ultramafic rocks. J. Petrol. 2001, 42, 2279–2302. [Google Scholar] [CrossRef]
  3. Fabries, J. Spinel-olivine geothermometry in peridotites from ultramafic complexes. Contrib. Mineral. Petrol. 1979, 69, 329–336. [Google Scholar] [CrossRef]
  4. O’Neill, H.S.C. The transition between spinel lherzolite and garnet lherzolite, and its use as a geobarometer. Contrib. Mineral. Petrol. 1981, 77, 185–194. [Google Scholar] [CrossRef]
  5. Ballhaus, C.; Berry, R.F.; Green, D.H. High pressure experimental calibration of the olivine-orthopyroxene-spinel oxygen barometer: Implications for the oxidation state of the upper mantle. Contrib. Mineral. Petrol. 1991, 107, 27–40. [Google Scholar] [CrossRef]
  6. Dick, H.J.B.; Bullen, T. Chromian spinel as a petrogenetic indicator in abyssal and alpine-type peridotites and spatially associated lavas. Contrib. Mineral. Petrol. 1984, 86, 54–76. [Google Scholar] [CrossRef]
  7. Liang, Y.; Elthon, D. Evidence from chromium abundances in mantle rocks for extraction of picrite and komatiite melts. Nature 1990, 343, 551–553. [Google Scholar] [CrossRef]
  8. Liu, X.; O’Neill, H.S.C. The effect of Cr2O3 on the partial melting of spinel lherzolite in the system CaO-MgO-Al2O3-SiO2-Cr2O3 at 1.1 GPa. J. Petrol. 2004, 45, 2261–2286. [Google Scholar] [CrossRef]
  9. Zhang, Y.; Liu, X.; Xiong, Z.; Zhang, Z. Compressional behavior of MgCr2O4 spinel from first-principles simulation. Sci. China Earth Sci. 2016, 59, 989–996. [Google Scholar] [CrossRef]
  10. Xie, X.; Chen, M.; Wang, D. Shock-related mineralogical features and P-T history of the Suizhou L6 chondrite. Eur. J. Mineral. 2001, 13, 1177–1190. [Google Scholar] [CrossRef]
  11. Wang, A.; Kuebler, K.E.; Jolliff, B.L.; Haskin, L.A. Raman spectroscopy of Fe-Ti-Cr-oxides, case study: Martian meteorite EETA 79001. Am. Mineral. 2004, 89, 665–680. [Google Scholar] [CrossRef]
  12. Fritz, J.; Greshake, A. High-pressure phases in an ultramafic rock from Mars. Earth Planet. Sci. Lett. 2009, 288, 619–623. [Google Scholar] [CrossRef]
  13. Lenaz, D.; Princivalle, F.; Schmitz, B. First crystal-structure determination of chromites from an acapulcoite and ordinary chondrites. Mineral. Mag. 2015, 79, 755–765. [Google Scholar] [CrossRef] [Green Version]
  14. Hu, J.; Sharp, T.G. High-pressure phases in shock-induced melt of the unique highly shocked LL6 chondrite Northwest Africa 757. Meteorit. Planet. Sci. 2016, 51, 1353–1369. [Google Scholar] [CrossRef]
  15. Pieters, C.M.; Besse, S.; Boardman, J.; Buratti, B.; Cheek, L.; Clark, R.N.; Combe, J.P.; Dhingra, D.; Goswami, J.N.; Green, R.O.; et al. Mg-spinel lithology: A new rock type on the lunar farside. J. Geophys. Res. Planets 2011, 116, 287–296. [Google Scholar] [CrossRef]
  16. Gross, J.; Treiman, A.H. Unique spinel-rich lithology in lunar meteorite ALHA81005: Origin and possible connection to M3 observations of the farside highlands. J. Geophys. Res. 2011, 116, E10009. [Google Scholar] [CrossRef]
  17. Ringwood, A.E. Phase transformations and their bearing on the constitution and dynamics of the mantle. Geochim. Cosmochim. Acta 1991, 55, 2083–2110. [Google Scholar] [CrossRef]
  18. Li, B.; Liebermann, R.C. Indoor seismology by probing the Earth’s interior by using sound velocity measurements at high pressures and temperatures. Proc. Natl. Acad. Sci. USA 2007, 104, 9145–9150. [Google Scholar] [CrossRef] [PubMed]
  19. Panero, W.R. Cation disorder in ringwoodite and its effects on wave speeds in the Earth’s transition zone. J. Geophys. Res. 2008, 113, B10204. [Google Scholar] [CrossRef]
  20. Stixrude, L.; Lithgow-Bertelloni, C. Thermodynamics of mantle minerals-II. Phase equilibria. Geophys. J. Int. 2011, 184, 1180–1213. [Google Scholar] [CrossRef]
  21. Liu, X.; Xiong, Z.; Chang, L.; He, Q.; Wang, F.; Shieh, S.R.; Wu, C.; Li, B.; Zhang, L. Anhydrous ringwoodites in the mantle transition zone: Their bulk modulus, solid solution behavior, compositional variation, and sound velocity feature. Solid Earth Sci. 2016, 1, 28–47. [Google Scholar] [CrossRef]
  22. Pearson, D.G.; Brenker, F.E.; Nestola, F.; McNeill, J.; Nasdala, L.; Hutchison, M.T.; Matveev, S.; Mather, K.; Silversmit, G.; Schmitz, S.; et al. Hydrous mantle transition zone indicated by ringwoodite included within diamond. Nature 2014, 507, 221–224. [Google Scholar] [CrossRef] [PubMed]
  23. Tomioka, N.; Miyahara, M. High-pressure minerals in shocked meteorites. Meteorit. Planet. Sci. 2017, 52, 2017–2039. [Google Scholar] [CrossRef]
  24. Chen, M.; Xie, X. The shock effects of olivine in the Yanzhuang chondrite. Acta Mineral. Sin. 1993, 13, 109–116. [Google Scholar]
  25. Kimura, M.; Chen, M.; Yoshida, T.; El Goresy, A.; Ohtani, E. Back-transformation of high-pressure phases in a shock melt vein of an H-chondrite during atmospheric passage: Implications for the survival of high-pressure phases after decompression. Earth Planet. Sci. Lett. 2003, 217, 141–150. [Google Scholar] [CrossRef]
  26. Bischoff, A. Discovery of purple-blue ringwoodite within shock veins of an LL6 ordinary chondrite from Northwest Africa. In Proceedings of the 33rd Lunar and Planetary Science Conference, Houston, TX, USA, 11–15 March 2002. [Google Scholar]
  27. Hollister, L.S.; Bindi, L.; Yao, N.; Poirier, G.R.; Andronicos, C.L.; MacPherson, G.J.; Lin, C.; Distler, V.V.; Eddy, M.P.; Kostin, A.; et al. Impact-induced shock and the formation of natural quasicrystals in the early solar system. Nat. Commun. 2014, 5, 4040. [Google Scholar] [CrossRef] [PubMed]
  28. Miyahara, M.; Ohtani, E.; Yamaguchi, A. High-pressure polymorphs in Gujba CB type carbonaceous chondrite. In Proceedings of the Japan Geoscience Union Meeting, Chiba, Japan, 24–28 May 2015; pp. 20–22. [Google Scholar]
  29. Barrat, J.A.; Chaussidon, M.; Bohn, M.; Gillet, P.; Göpel, C.; Lesourd, M. Lithium behavior during cooling of a dry basalt: An ion-microprobe study of the lunar meteorite Northwest Africa 479 (NWA 479). Geochim. Cosmochim. Acta 2005, 69, 5597–5609. [Google Scholar] [CrossRef]
  30. Zhang, A.; Hsu, W.; Floss, C.; Li, X.; Li, Q.; Liu, Y.; Taylor, L.A. Petrogenesis of lunar meteorite Northwest Africa 2977: Constraints from in situ microprobe results. Meteorit. Planet. Sci. 2011, 45, 1929–1947. [Google Scholar] [CrossRef]
  31. Boonsue, S.; Spray, J. Shock-induced phase transformations in melt pockets within Martian meteorite NWA 4468. Spectrosc. Lett. 2012, 45, 127–134. [Google Scholar] [CrossRef]
  32. Baziotis, I.P.; Yang, L.; Paul, S.; DeCarli, H.; Melosh, J.; McSween, H.Y.; Bodnar, R.J.; Taylor, L.A. The Tissint Martian meteorite as evidence for the largest impact excavation. Nat. Commun. 2013, 4, 1404. [Google Scholar] [CrossRef] [PubMed]
  33. Greshake, A.; Fritz, J.; Böttger, U.; Goran, D. Shear-induced ringwoodite formation in the Martian shergottite Dar al Gani 670. Earth Planet. Sci. Lett. 2013, 375, 383–394. [Google Scholar] [CrossRef]
  34. Walton, E.L. Shock metamorphism of Elephant Moraine A79001: Implications for olivine-ringwoodite transformation and the complex thermal history of heavily shocked Martian meteorites. Geochim. Cosmochim. Acta 2013, 107, 299–315. [Google Scholar] [CrossRef]
  35. Walton, E.L.; Sharp, T.G.; Hu, J.; Filiberto, J. Heterogeneous mineral assemblages in Martian meteorite Tissint as a result of a recent small impact event on Mars. Geochim. Cosmochim. Acta 2014, 140, 334–348. [Google Scholar] [CrossRef]
  36. Ma, C.; Tschauner, O.; Beckett, J.R.; Liu, Y.; Rossman, G.R.; Zhuravlev, K.; Prakapenka, V.; Dera, P.; Taylor, L.A. Tissintite, (Ca, Na, □)AlSi2O6, a highly-defective, shock-induced, high-pressure clinopyroxene in the Tissint Martian meteorite. Earth Planet. Sci. Lett. 2015, 422, 194–205. [Google Scholar] [CrossRef]
  37. Ma, C.; Tschauner, O.; Beckett, J.R.; Liu, Y.; Rossman, G.R.; Sinogeikin, S.V.; Smith, J.S.; Taylor, L.A. Ahrensite, γ-Fe2SiO4, a new shock-metamorphic mineral from the Tissint meteorite: Implications for the Tissint shock event on Mars. Geochim. Cosmochim. Acta. 2016, 184, 240–256. [Google Scholar] [CrossRef]
  38. Miyahara, M.; Ohtani, E.; El Goresy, A.; Ozawa, S.; Gillet, P. Phase transition processes of olivine in the shocked Martian meteorite Tissint: Clues to origin of ringwoodite-, bridgmanite- and magnesiowüstite-bearing assemblages. Phys. Earth Planet. Inter. 2016, 259, 18–28. [Google Scholar] [CrossRef]
  39. Stöffler, D.; Keil, K.; Scott, E.R.D. Shock metamorphism of ordinary chondrites. Geochim. Cosmochim. Acta 1991, 55, 3845–3867. [Google Scholar] [CrossRef]
  40. Chen, M.; Sharp, T.G.; El Goresy, A.; Wopenka, B.; Xie, X. The majorite-pyrope+ magnesiowüstite assemblage: Constraints on the history of shock veins in chondrites. Science 1996, 271, 1570–1573. [Google Scholar] [CrossRef]
  41. Sharp, T.G.; DeCarli, P.S. Shock effects in meteorites. In Meteorites and the Early Solar System II; Lauretta, D.S., McSween, H.Y., Eds.; The University of Arizona Press: Tuscon, AZ, USA, 2006; pp. 653–677. [Google Scholar]
  42. Wood, B.J.; Kirkpatrick, R.J.; Montez, B. Order-disorder phenomena in MgAl2O4 spinel. Am. Mineral. 1986, 71, 999–1006. [Google Scholar]
  43. Hazen, R.M.; Navrotsky, A. Effects of pressure on order-disorder reactions. Am. Mineral. 1996, 81, 1021–1035. [Google Scholar] [CrossRef]
  44. Hazen, R.M.; Yang, H. Effects of cation substitution and order-disorder on P-V-T equations of state of cubic spinels. Am. Mineral. 1999, 84, 1956–1960. [Google Scholar] [CrossRef]
  45. Méducin, F.; Redfern, S.A.T.; Godec, Y.L.; Stone, H.J.; Tucker, M.G.; Dove, M.T.; Marshall, W.G. Study of cation order-disorder in MgAl2O4 spinel by in situ neutron diffraction up to 1600 K and 3.2 GPa. Am. Mineral. 2004, 89, 981–986. [Google Scholar] [CrossRef]
  46. Li, L.; Carrez, P.; Weidner, D. Effect of cation ordering and pressure on spinel elasticity by ab initio simulation. Am. Mineral. 2007, 92, 174–178. [Google Scholar] [CrossRef]
  47. Schmocker, U.; Waldner, F. The inversion parameter with respect to the space group of MgAl2O4 spinels. J. Phys. C 1976, 9, L235–L237. [Google Scholar] [CrossRef]
  48. Peterson, R.C.; Lager, G.A.; Hitterman, R.L. A time-of-flight neutron powder diffraction study of MgAl2O4 at temperatures up to 1273 K. Am. Mineral. 1991, 76, 172–180. [Google Scholar]
  49. Cynn, H.; Sharma, S.K.; Cooney, T.F.; Nicol, M. High-temperature Raman investigation of order-disorder behavior in the MgAl2O4 spinel. Phys. Rev. B 1992, 45, 500–502. [Google Scholar] [CrossRef]
  50. Millard, R.L.; Peterson, R.C.; Hunter, B.K. Temperature dependence of cation disorder in MgAl2O4 spinel using 27Al and 17O magic-angle spinning NMR. Am. Mineral. 1992, 77, 44–52. [Google Scholar]
  51. Maekawa, H.; Kato, S.; Kawamura, K.; Yokokawa, T. Cation mixing in natural MgAl2O4 spinel: A high-temperature 27Al NMR study. Am. Mineral. 1997, 82, 1125–1132. [Google Scholar] [CrossRef]
  52. Pavese, A.; Artioli, G.; Hull, S. In situ powder neutron diffraction of cation partitioning vs. pressure in Mg0.94Al2.04O4 synthetic spinel. Am. Mineral. 1999, 84, 905–912. [Google Scholar] [CrossRef]
  53. Redfern, S.A.T.; Harrison, R.J.; O’Neill, H.St.C.; Wood, D.R.R. Thermodynamics and kinetics of cation ordering in MgAl2O4 spinel up to 1600 °C from in situ neutron diffraction. Am. Mineral. 1999, 84, 299–310. [Google Scholar] [CrossRef]
  54. Andreozzi, G.B.; Princivalle, F.; Skogby, H.; Della Giusta, A. Cation ordering and structural variations with temperature in MgAl2O4 spinel: An X-ray single-crystal study. Am. Mineral. 2000, 85, 1164–1171. [Google Scholar] [CrossRef]
  55. Andreozzi, G.B.; Princivalle, F. Kinetics of cation ordering in synthetic MgAl2O4 spinel. Am. Mineral. 2002, 87, 838–844. [Google Scholar] [CrossRef]
  56. Carbonin, S.; Martignago, F.; Menegazzo, G.; Nal Negro, A. X-ray single-crystal study of spinels: In situ heating. Phys. Chem. Miner. 2002, 29, 503–514. [Google Scholar] [CrossRef]
  57. Slotznick, S.P.; Shim, S.H. In situ Raman spectroscopy measurements of MgAl2O4 spinel up to 1400 °C. Am. Mineral. 2008, 93, 470–476. [Google Scholar] [CrossRef]
  58. Sreeja, V.; Smitha, T.S.; Nand, D.; Ajithkumar, T.G.; Joy, P.A. Size dependent coordination behavior and cation distribution in MgAl2O4 nanoparticles from 27Al solid state NMR studies. J. Phys. Chem. C 2008, 112, 14737–14744. [Google Scholar] [CrossRef]
  59. O’Neill, H.S.C.; Navrotsky, A. Simple spinels: Crystallographic parameters, cation radii, lattice energies, and cation distribution. Am. Mineral. 1983, 68, 181–194. [Google Scholar]
  60. Hazen, R.M.; Downs, R.T.; Finger, L.W.; Ko, J. Crystal chemistry of ferromagnesian silicate spinels: Evidence for Mg-Si disorder. Am. Mineral. 1993, 78, 1320–1323. [Google Scholar]
  61. Stebbins, J.F.; Panero, W.R.; Smyth, J.R.; Frost, D.J. Forsterite, wadsleyite, and ringwoodite (Mg2SiO4): 29Si NMR constraints on structural disorder and effects of paramagnetic impurity ions. Am. Mineral. 2009, 94, 626–629. [Google Scholar] [CrossRef]
  62. Taran, M.N.; Koch-Müller, M.; Wirth, R.; Abs-Wurmbach, I.; Rhede, D.; Greshake, A. Spectroscopic studies of synthetic and natural ringwoodite, γ-(Mg, Fe)2SiO4. Phys. Chem. Miner. 2009, 36, 217–232. [Google Scholar] [CrossRef]
  63. Kiefer, B.; Stixrude, L.; Wentzcovitch, R. Normal and inverse ringwoodite at high pressures. Am. Mineral. 1999, 84, 288–293. [Google Scholar] [CrossRef]
  64. Sasaki, S.; Prewitt, C.T.; Sato, Y.; Ito, E. Single crystal x-ray study of γ-Mg2SiO4. J. Geophys. Res. 1982, 87, 7829–7832. [Google Scholar] [CrossRef]
  65. Sigurdsson, I.A.; Kamenetsky, V.S.; Crawford, A.J.; Eggins, S.M.; Zlobin, S.K. Primitive island arc and oceanic lavas from the hunter ridge-hunter fracture zone. Evidence from glass, olivine and spinel compositions. Miner. Petrol. 1993, 47, 149–169. [Google Scholar] [CrossRef]
  66. Sobolev, A.V.; Nikogosian, I.K. Petrology of long-lived mantle plume magmatism: Hawaii, Pacific and Reunion Island, Indian Ocean. Petrology 1994, 2, 111–144. [Google Scholar]
  67. Kamenetsky, V.S.; Sobolev, A.V.; Joron, J.L.; Semet, M.P. Petrology and geochemistry of cretaceous ultramafic volcanics from eastern Kamchatka. J. Petrol. 1995, 36, 637–662. [Google Scholar] [CrossRef]
  68. Franz, L.; Wirth, R. Spinel inclusions in olivine of peridotite xenoliths from TUBAF seamount (Bismarck Archipelago/Papua New Guinea): Evidence for the thermal and tectonic evolution of the oceanic lithosphere. Contrib. Mineral. Petrol. 2000, 140, 283–295. [Google Scholar] [CrossRef]
  69. Chistyakova, S.; Latypov, R.; Zaccarini, F. Chromitite dykes in the Monchegorsk layered intrusion, Russia: In situ crystallization from chromite-saturated magma flowing in conduits. J. Petrol. 2016, 56, 2395–2424. [Google Scholar] [CrossRef]
  70. Liu, X.; Chen, J.; Tang, J.; He, Q.; Li, S.; Peng, F.; He, D.; Zhang, L.; Fei, Y. A large volume cubic press with a pressure-generating capability up to about 10 GPa. High Press. Res. 2012, 32, 239–254. [Google Scholar] [CrossRef]
  71. Bertka, C.M.; Fei, Y.W. Mineralogy of the Martian interior up to core-mantle boundary pressure. J. Geophys. Res. 1997, 102, 5251–5264. [Google Scholar] [CrossRef]
  72. He, Q.; Tang, J.; Wang, F.; Liu, X. High temperature stable assembly designed for cubic press. Chin. J. High Press. Phys. 2014, 28, 145–151. [Google Scholar]
  73. Carbonin, S.; Russo, U.; Della Giusta, A. Cation distribution in some natural spinels from X-ray diffraction and Mössbauer spectroscopy. Mineral. Mag. 1996, 60, 355–368. [Google Scholar] [CrossRef]
  74. Lavina, B.; Salviulo, G.; Della Giusta, A. Cation distribution and structural modeling of spinel solid solutions. Phys. Chem. Miner. 2002, 29, 10–18. [Google Scholar] [CrossRef]
  75. Princivalle, F.; Della Giusta, A.; Carbonin, S. Comparative crystal-chemistry of spinels from some suites of ultramafic rocks. Miner. Petrol. 1989, 40, 117–126. [Google Scholar] [CrossRef]
  76. Della Giusta, A.; Carbonin, S.; Ottonello, G. Temperature-dependent disorder in a natural Mg-Al-Fe2+-Fe3+-spinel. Mineral. Mag. 1996, 60, 603–616. [Google Scholar] [CrossRef]
  77. Uchida, H.; Lavina, B.; Downs, R.T.; Chesley, J. Single-crystal X-ray diffraction of spinels from San Carlos volcanic field, Arizona: Spinel as a geothermometer. Am. Mineral. 2005, 90, 1900–1908. [Google Scholar] [CrossRef]
  78. Chopelas, A.; Hofmeister, A.M. Vibrational spectroscopy of aluminate spinels at 1 atm and of MgAl2O4 to over 200 kbar. Phys. Chem. Miner. 1991, 18, 279–293. [Google Scholar] [CrossRef]
  79. Lauwers, H.A.; Herman, M.A. Force field of some AB2C4 spinel compounds. J. Phys. Chem. Solids 1980, 41, 223–230. [Google Scholar] [CrossRef]
  80. Sinha, M.M.; Singh, N.P.; Prasad, K.; Gupta, H.C. Effect of rattling on the interatomic interaction in oxide spinels MgAl2O4 and ZnGa2O4. Phys. Status Solidi B 1995, 190, K27–K29. [Google Scholar] [CrossRef]
  81. De Wijs, G.A.; Fang, C.M.; Kresse, G.; de With, G. First-principles calculation of the phonon spectrum of MgAl2O4 spinel. Phys. Rev. B 2002, 65, 094305. [Google Scholar] [CrossRef]
  82. Thibaudeau, P.; Gervais, F. Ab initio investigation of phonon modes in the MgAl2O4 spinel. J. Phys. Condens. Matter 2002, 14, 3543–3552. [Google Scholar] [CrossRef]
  83. Lazzeri, M.; Thibaudeau, P. Ab initio Raman spectrum of the normal and disordered MgAl2O4 spinel. Phys. Rev. B 2006, 74, 2952–2961. [Google Scholar] [CrossRef]
  84. Caracas, R.; Banigan, E.J. Elasticity and Raman and infrared spectra of MgAl2O4 spinel from density functional perturbation theory. Phys. Earth Planet. Inter. 2009, 174, 113–121. [Google Scholar] [CrossRef]
  85. Kushwaha, A.K. Vibrational and elastic properties of aluminate spinel MgAl2O4. Physica B 2010, 405, 2795–2798. [Google Scholar] [CrossRef]
  86. Cynn, H.; Anderson, O.L.; Nicol, M. Effects of cation disordering in a natural MgAl2O4 spinel observed by rectangular parallelepiped ultrasonic resonance and Raman measurements. Pure Appl. Geophys. 1993, 141, 415–444. [Google Scholar] [CrossRef]
  87. Van Minh, N.; Yang, I.-S. A Raman study of cation-disorder transition temperature of natural MgAl2O4 spinel. Vib. Spectrosc. 2004, 35, 93–96. [Google Scholar] [CrossRef]
  88. Lenaz, D.; Musco, M.E.; Petrelli, M.; Caldeira, R.; Min, A.D.; Marzoli, A.; Mata, J.; Perugini, D.; Princivalle, F.; Boumehdi, M.A.; et al. Restitic or not? Insights from trace element content and crystal-structure of spinels in African mantle xenoliths. Lithos 2017, 278–281, 464–476. [Google Scholar] [CrossRef]
  89. Lucchesi, S.; Della Giusta, A. Crystal chemistry of a highly disordered Mg-Al natural spinel. Miner. Petrol. 1997, 59, 91–99. [Google Scholar] [CrossRef]
  90. Levy, D.; Pavese, A.; Hanfland, M. Synthetic MgAl2O4 (spinel) at high-pressure conditions (0.0001–30 GPa): A synchrotron X-ray powder diffraction study. Am. Mineral. 2003, 88, 93–98. [Google Scholar] [CrossRef]
  91. Nestola, F.; Ballaran, T.B.; Zunic, T.B.; Princivalle, F.; Secco, L.; Negro, A.D. Comparative compressibility and structural behavior of spinel MgAl2O4 at high pressures: The independency on the degree of cation order. Am. Mineral. 2007, 92, 1838–1843. [Google Scholar] [CrossRef]
  92. Bacon, G.E. A neutron-diffraction study of magnesium aluminium oxide. Acta Crystallogr. 1952, 5, 684–686. [Google Scholar] [CrossRef]
  93. Sinclair, W.; Ringwood, A.E. Single crystal analysis of the structure of stishovite. Nature 1978, 272, 714–715. [Google Scholar] [CrossRef]
  94. Smyth, J.R.; Hazen, R.M. The crystal structures of forsterite and hortonolite at several temperatures up to 900 °C. Am. Mineral. 1973, 58, 588–593. [Google Scholar]
  95. Gibbs, R.E. Structure of α quartz. Proc. R. Soc. A 1926, 110, 443–455. [Google Scholar] [CrossRef]
  96. Zoltai, T.; Buerger, M.J. The crystal structure of coesite, the dense, high-pressure form of silica. Z. Kristallogr. 1959, 111, 129–141. [Google Scholar] [CrossRef]
  97. Chopelas, A. Single crystal Raman spectra of forsterite, fayalite, and monticellite. Am. Mineral. 1991, 76, 1101–1109. [Google Scholar]
  98. Katsura, T.; Yamada, H.; Nishikawa, O.; Song, M.; Kubo, A.; Shinmei, T.; Yokoshi, S.; Aizawa, Y.; Yoshino, T.; Walter, M.J.; et al. Olivine-wadsleyite transition in the system (Mg, Fe)2SiO4. J. Geophys. Res. 2004, 109, B02209. [Google Scholar] [CrossRef]
  99. Perinelli, C.; Bosi, F.; Andreozzi, G.B.; Conte, A.M.; Armienti, P. Geothermometric study of Cr-spinels of peridotite mantle xenoliths from northern Victoria Land (Antarctica). Am. Mineral. 2014, 99, 839–846. [Google Scholar] [CrossRef]
  100. Edwards, H.G.M.; Hutchinson, I.; Ingley, R. The ExoMars Raman spectrometer and identification of biogeological spectroscopic signatures using a flight-like prototype. Anal. Bioanal. Chem. 2012, 404, 1723–1731. [Google Scholar] [CrossRef] [PubMed]
  101. Hutchinson, I.B.; Ingley, R.; Edwards, H.G.M.; Harris, L.; McHugh, M.; Malherbe, C.; Parnell, J. Raman spectroscopy on Mars: Identification of geological and bio-geological signatures in Martian analogues using miniaturized Raman spectrometers. Philos. Trans. R. Soc. 2014, 372, 20140204. [Google Scholar] [CrossRef] [PubMed]
  102. Robinson, J.A.C.; Wood, B.J. The depth of the spinel to garnet transition at the peridotite solidus. Earth Planet. Sci. Lett. 1998, 164, 277–284. [Google Scholar] [CrossRef]
  103. Stachel, T.; Harris, J.W. The origin of cratonic diamond-constraints from mineral inclusions. Ore Geol. Rev. 2008, 34, 5–32. [Google Scholar] [CrossRef]
  104. Kudoh, Y.; Kuribayashi, T.; Mizobata, H.; Ohtani, E.; Sasaki, S.; Tanaka, M. Pressure dependence of u parameter in ringwoodite up to 7.9 GPa. J. Miner. Petrol. Sci. 2007, 102, 8–11. [Google Scholar] [CrossRef]
  105. Ye, Y.; Brown, D.A.; Smyth, J.R.; Panero, W.R.; Jacobsen, S.D.; Chang, Y.Y.; Townsend, J.P.; Thomas, S.M.; Hauri, E.H.; Dera, P.; et al. Compressibility and thermal expansion of hydrous ringwoodite with 2.5(3) wt % H2O. Am. Mineral. 2012, 97, 573–582. [Google Scholar] [CrossRef]
  106. Kleppe, A.K.; Jephcoat, A.P.; Smyth, J.R. Raman spectroscopic study of hydrous γ-Mg2SiO4 to 56.5 GPa. Phys. Chem. Miner. 2002, 29, 473–476. [Google Scholar] [CrossRef]
  107. Chopelas, A.; Boehler, R.; Ko, T. Thermodynamics and behavior of γ-Mg2SiO4 at high pressure: Implications for Mg2SiO4 phase equilibrium. Phys. Chem. Miner. 1994, 21, 351–359. [Google Scholar] [CrossRef]
  108. Xie, Z.; Sharp, T.G. High-pressure phases in shock-induced melt veins of the Umbarger L6 chondrite: Constraints of shock pressure. Meteorit. Planet. Sci. 2004, 39, 2043–2054. [Google Scholar] [CrossRef]
  109. Xie, Z.; Sharp, T.G. Host rock solid-state transformation in a shock-induced melt vein of Tenham L6 chondrite. Earth Planet. Sci. Lett. 2007, 254, 433–445. [Google Scholar] [CrossRef]
  110. Nagy, S.; Józsa, S.; Gyollai, I.; Bérczi, S.; Bendõ, Z.; Stehlik, H. Ringwoodite microstructures in L-chondrite NWA 5011: Implications for transformation mechanism and source region in L parent body. Cent. Eur. Geol. 2011, 54, 233–248. [Google Scholar] [CrossRef]
  111. Sharp, T.G.; Xie, Z.; DeCarli, P.S.; Hu, J. A large shock vein in L chondrite Roosevelt County 106: Evidence for a long-duration shock pulse on the L chondrite parent body. Meteorit. Planet. Sci. 2015, 50, 1941–1953. [Google Scholar] [CrossRef]
  112. Tomioka, N.; Okuchi, T. A new high-pressure form of Mg2SiO4 highlighting diffusionless phase transition of olivine. Sci. Rep. 2017, 7, 17351. [Google Scholar] [CrossRef] [PubMed]
Figure 1. SiO2 (wt %) vs. Mg# of some natural 2-3 spinels. Mg#, 100 Mg/(Mg + Fe) in molar ratio. Data sources are Sigurdsson et al. [65], Sobolev & Nikogosian [66], Kamenetsky et al. [67], Franz & Wirth [68], and Chistyakova et al. [69].
Minerals 08 00210 g001
Figure 2. Typical electron back-scatter images: (a) LMD558 at 4 GPa and 1550 °C; (b) LMD578 at 5 GPa and 1630 °C. On the exposed sample surface of LMD558, we observed just one large Sp grain, surrounded by olivine compositionally approximating Fo (Mg2.034(30)Ca0.004(0)Si0.973(15)Al0.011(1)O4; five EMP analyses). In contrast, many Sp grains were found on the exposed sample surface of LMD578, coexisting with Grt grains (not shown in (b); Mg2.765(66)Ca0.294(67)Al1.968(18)Si2.995(11)O12, based on 10 EMP analyses). The white spots numbered from 1 to 10 in (b) represent the positions at which the Raman spectra shown in Figure 7b were taken.
Minerals 08 00210 g002
Figure 3. Sipfu and Mgpfu-1 vs. (2-Alpfu)/2 of synthetic spinels from our high-P experiments. pfu stands for per formula unit.
Minerals 08 00210 g003
Figure 4. Raman features of Si-free N-Sp and synthetic Si-free MgAl2O4-Sp from LMD487.
Minerals 08 00210 g004
Figure 5. (a) Comparison of P-T conditions of our high-P Sp-synthesizing experiments and those of the heating-up experiments closely approaching Mg-Al redistribution equilibrium at T ≥ 500 °C from Méducin et al. [45]. The P and T values of the five experiments from Méducin et al. [45] were highly correlated, as shown by the solid line P = 0.0035(2)*T − 1.36(16). (b) x-T relation of those five experiments from Méducin et al. [45], as shown by the solid line x = 0.00043(3)*T − 0.053(32). Filled diamonds are for the five experiments from Méducin et al. [45], whereas the empty triangle is for our experiment synthesizing Si-free MgAl2O4-Sp and the empty squares are for our experiments synthesizing Si-bearing MgAl2O4-Sp. The broken line in (b) is shown for a hypothetical fully disordered MgAl2O4-Sp with x = 0.667.
Minerals 08 00210 g005
Figure 6. Raman features of synthetic Si-bearing MgAl2O4-Sp from our high-P experiments. As comparisons, Raman spectra of N-Qz, synthetic Coe, St and Fo (LMD558; Table 1) are shown as well. For the purpose of illustration, some portions of the Raman spectra of St, Coe and N-Qz have been expanded and shown as insets, whereas the entire Raman spectrum of Fo has been compressed by a factor of 60. LMD563(0.30), Exp. # followed by the SiO2 content of the Sp. To illustrate clearly, only one Raman spectrum is shown for each synthetic phase, although multiple Raman spectra have been collected.
Minerals 08 00210 g006
Figure 7. Raman spectra of MgAl2O4-Sp with almost identical amounts of SiO2 from LMD558 (a) and LMD578 (b). The two sets of Raman spectra (A1, A2, A3 and A4 as Set A, and B1, B2, B3 and B4 as Set B) shown in (a) were collected from the only Sp grain shown in Figure 2a, but with their orientations normal to each other. After obtaining the Raman spectra of Set A, we reprocessed the sample to make a new exposure normal to the previous one and then collected the Raman spectra of Set B. Ten Raman spectra shown in (b) were acquired from ten different Sp grains (see Figure 2b for the positions). Due to data compression, the weak Raman peaks for the SiO4 groups of the MgAl2O4-Sp from LMD578, visible in Figure 6, are now barely discernable in (b).
Minerals 08 00210 g007
Figure 8. I 823 + I 856 I 725 + I 766 vs. SiO2 content of our synthetic Si-bearing MgAl2O4-Sp. Note that the analytical conditions in the Raman spectroscopic experiments were identical, and all the MgAl2O4-Sp generally had the maximum amount of Mg-Al disorder (x = 0.667). The experimental P-T conditions are indicated along the symbols; 4/1500, for example, should be read as 4 GPa and 1500 °C. The experiments have been divided into three groups, with Group 1 containing LMD565 and LMD564 (red squares), Group 2 containing LMD563 and LMD558 (black squares), and Group 3 containing LMD578 and LMD568 (blue squares). With the aid of the origin (the zero SiO2 case), the experiments in each group were used to determine the relationship between the I 823 + I 856 I 725 + I 766 and SiO2 content. Using C = 1.02(14), Equation (6) is shown as the pencil of broken lines radiating from the origin, with different y values ranging from 0.33 to 1. For every sample, the error bar of its I 823 + I 856 I 725 + I 766 was directly calculated from the integrated areas of the used peaks of all Raman analyses.
Minerals 08 00210 g008
Table 1. Experimental conditions, phase assemblages, and compositions of spinels and quartz (wt %).
Exp. #P aT at aPhase AssemblageMgOAl2O3SiO2Total
LMD5653150036Sp(8) b + Melt28.66(25) c70.23(53)0.39(5)99.29(72)
LMD5644150036Sp(8) + Melt29.26(15)70.29(18)0.65(7)100.22(33)
LMD5634155024Sp(7) + Melt28.44(22)70.92(33)0.30(7)99.68(35)
LMD5584155036Sp(5) + Fo + Melt29.01(30)69.98(60)0.76(3)99.75(86)
LMD5785163012Sp(13) + Grt + Melt28.94(18)70.22(25)0.76(7)99.92(36)
LMD5686165012Sp(13) + Grt + Melt29.13(26)69.27(59)1.03(7)99.45(78)
LMD487 d5160012Sp----
LMD659 e5150012Coe + Melt----
PL1316 e1414008St----
Natural spinel N-Sp(10)28.05(18)70.81(22)0.01(1)100.03(39)
Natural quartz N-Qz(10)0.00(1)0.13(9)100.95(51)101.17(57)
a P, pressure in GPa; T, temperature in °C; t, time in h. b Number in the parenthesis after the name of the phase is the number of successful EMP analyses performed on that phase. Sp, spinel; Melt, silicate melt; Fo, forsterite; Grt, garnet; Coe, coesite; St, stishovite; Qz, quartz. c Number in the parenthesis is the analytical uncertainty reported as one standard deviation. 28.66(25) read as 28.66 ± 0.25. d Starting material is a mixture of dried high-purity MgO and Al2O3 powders, weighted out according to the stoichiometry of the MgAl2O4 spinel. e Starting material is a dried high-purity SiO2 powder, with some deionized water added later.
Table 2. Ratio of integrated area of the Raman peaks at ~823 and 856 cm−1 for the SiO4 group to those at ~725 and 766 cm−1 for the (Mg,Al)O4 group.
Exp. #P/T/SiO2 a# b(I823 + I856)/(I725 + I766)
LMD5653/1500/0.39(5) c30.36(1)
LMD5644/1500/0.65(7)30.77(29)
LMD5634/1550/0.30(7)30.32(5)
LMD5584/1550/0.76(3)80.40(10)
LMD578 d5/1630/0.76(7)40.22(13)
LMD5686/1650/1.03(7)30.37(8)
a P, GPa; T, oC; SiO2, SiO2 content (wt %) in our synthetic Sp. b Number of Raman spectra collected. c Number in the parenthesis represents one standard deviation; 0.39(5) read as 0.39 ± 0.05. d Ten Raman spectra were collected (Figure 7a), but only four of them were used here. Since the Raman spectra were numerically dominated by those without visible peaks for the SiO4 groups, we selected four Raman spectra, with the SiO4 Raman peaks ranging from the lowest to the highest, to derive our result in order to avoid possible data bias. Of course, this procedure might have led to new data bias.

