Article

Three-D Mineralogical Mapping of the Kovdor Phoscorite–Carbonatite Complex, NW Russia: I. Forsterite

by
Julia A. Mikhailova
1,2,
Gregory Yu. Ivanyuk
1,2,*,
Andrey O. Kalashnikov
2,
Yakov A. Pakhomovsky
1,2,
Ayya V. Bazai
1,2,
Taras L. Panikorovskii
1,
Victor N. Yakovenchuk
1,2,
Nataly G. Konopleva
1 and
Pavel M. Goryainov
2
1
Nanomaterials Research Centre of Kola Science Centre, Russian Academy of Sciences, 14 Fersman Street, Apatity 184209, Russia
2
Geological Institute of Kola Science Centre, Russian Academy of Sciences, 14 Fersman Street, Apatity 184209, Russia
*
Author to whom correspondence should be addressed.
Minerals 2018, 8(6), 260; https://doi.org/10.3390/min8060260
Submission received: 30 May 2018 / Revised: 14 June 2018 / Accepted: 16 June 2018 / Published: 20 June 2018
(This article belongs to the Special Issue Arctic Mineral Resources: Science and Technology)

Abstract

:
The Kovdor alkaline-ultrabasic massif (NW Russia) is formed by three consequent intrusions: peridotite, foidolite–melilitolite and phoscorite–carbonatite. Forsterite is the earliest mineral of both peridotite and phoscorite–carbonatite, and its crystallization governed evolution of magmatic systems. Crystallization of forsterite from Ca-Fe-rich peridotite melt produced Si-Al-Na-K-rich residual melt-I corresponding to foidolite–melilitolite. In turn, consolidation of foidolite and melilitolite resulted in Fe-Ca-C-P-F-rich residual melt-II that emplaced in silicate rocks as a phoscorite–carbonatite pipe. Crystallization of phoscorite began from forsterite, which launched destruction of silicate-carbonate-ferri-phosphate subnetworks of melt-II, and further precipitation of apatite and magnetite from the pipe wall to its axis with formation of carbonatite melt-III in the pipe axial zone. This petrogenetic model is based on petrography, mineral chemistry, crystal size distribution and crystallochemistry of forsterite. Marginal forsterite-rich phoscorite consists of Fe2+-Mn-Ni-Ti-rich forsterite similar to olivine from peridotite, intermediate low-carbonate magnetite-rich phoscorite includes Mg-Fe3+-rich forsterite, and axial carbonate-rich phoscorite and carbonatites contain Fe2+-Mn-rich forsterite. Incorporation of trivalent iron in the octahedral M1 and M2 sites reduced volume of these polyhedra; while volume of tetrahedral set has not changed. Thus, trivalent iron incorporates into forsterite by schema (3Fe2+)oct → (2Fe3+ + □)oct that reflects redox conditions of the rock formation resulting in good agreement between compositions of apatite, magnetite, calcite and forsterite.

Graphical Abstract

1. Introduction

Phoscorite and carbonatite are igneous rocks genetically affined with alkaline massifs [1]. Many (phoscorite)-carbonatite complexes contain economic concentrations of REE (Bayan Obo, Cummins Range, Kovdor, Maoniuping, Mt. Pass, Mt. Weld, Mushgai Khudag, Tomtor, etc.), P (Catalão, Jacupiranga, Palabora, Kovdor, Seligdar, Sokli, Tapira, etc.), Nb (Araxá, Catalăo, Fen, Lueshe, Mt. Weld, Oka, Panda Hill, St. Honoré, Tomtor, etc.), Cu (Palabora), Fe (Kovdor, Palabora, etc.), Zr (Kovdor, Palabora, etc.), U (Araxá, Palabora, etc.), Au, PGE (Catalăo, Ipanema, Palabora, etc.), F (Amba Dongar, Maoniuping, etc.) with considerable amounts of phlogopite, vermiculite, calcite and dolomite [2,3,4,5,6,7,8]. The Kovdor phoscorite–carbonatite complex in the Murmansk Region (Russia) has large resources of Fe (as magnetite), P (as hydroxylapatite), Zr and Sc (as baddeleyite), and also contains forsterite, calcite, dolomite, pyrochlore and copper sulfides with potential economic significance. Early, we have described in detail the geology and petrography of the Kovdor phoscorite–carbonatite complex [9,10] and the main economic minerals: magnetite, apatite and baddeleyite [11,12,13]. In this series of articles, we would like to show results of our study of potential economic minerals, namely forsterite, sulfides and pyrochlore.
Phoscorite is a rock composed of magnetite, olivine and apatite and is usually associated with carbonatites [1]. Between the phoscorite and carbonatite, there are both gradual transitions (when carbonate content in phoscorite exceeds 50 modal % the rock formally obtains name carbonatite [1]) and sharp contact (carbonatite veins in phoscorite). However, temporal relations between rocks of marginal and internal parts of phoscorite–carbonatite complexes as well as the processes that caused formation of such zonation are still unclear. The mechanism of formation of phoscorite–carbonatite rock series is widely discussed (see reviews e.g., in [8,14,15,16,17,18,19]). Most of researchers believe that phoscorite as a typical rock occurring «… around a core of carbonatite» is a result of a separate magmatic event preceding carbonatite magmatism (e.g., [20,21,22]). Some researchers suggest that carbonate-free phoscorite enriched by apatite and silicates (mainly forsterite) is the earlier rock in this sequence, while later carbonate-rich phoscorite and phoscorite-related carbonatite (i.e., the same phoscorite with carbonate content above 50 vol %) are formed due to the reaction between phosphate-silicate-rich phoscorite and carbonate-rich fluid or melt [21,23,24,25,26,27,28]. Some researchers divide phoscorite–carbonatite process into numerous separate intrusive events. They mainly substantiate their approach with the presence of sharp contacts between the rock varieties [29,30].
We believe that 3D mineralogical mapping is the best way to reconstruct genesis of any geological complex including phoscorite–carbonatite. This approach enabled us to establish a clear concentric zonation of the Kovdor phoscorite–carbonatite complex in terms of content, composition and properties of all economic minerals [11,13,24]. In general, the pipe marginal zone consists of (apatite)-forsterite phoscorite carrying fine grains of Ti-rich magnetite (with exsolution lamellae of ilmenite), FeMg-bearing hydroxylapatite and FeSi-bearing baddeleyite; the intermediate zone contains carbonate-free magnetite-rich phoscorite with medium to coarse grains of MgAl-bearing magnetite (with exsolution inclusions of spinel), pure hydroxylapatite and baddeleyite; and the axial zone of carbonate-rich phoscorite and phoscorite-related carbonatite includes medium- to fine-grained Ti-rich magnetite (with exsolution inclusions of geikielite–ilmenite), Sr-Ba-REE-bearing hydroxylapatite and Sc-Nb-bearing baddeleyite [11].
Consequently, phoscorite and phoscorite-related carbonatite of the Kovdor alkaline-ultrabasic massif consist of four main minerals belonging to separate classes of compounds: silicate–forsterite, phosphate–apatite, oxide–magnetite and carbonate–calcite, which compositions do not intercross (besides Ca in calcite and apatite and Fe in olivine and magnetite). Therefore, we can use content, composition and grain-size distribution, etc. of apatite for phosphorus behavior analysis, magnetite characteristics for iron and oxygen activity estimation, and forsterite and calcite characteristics for silicon and carbon evolution studies.
Forsterite can be the main key to understanding genesis and geology of the whole Kovdor alkaline-ultrabasic massif as its formation started from peridotite intrusion and finished with late carbonatites. In addition, forsterite is another economic mineral concentrated within two separate deposits [9]: the Baddeleyite-Apatite-Magnetite deposit within the phoscorite–carbonatite pipe and the Olivinite deposit within the peridotite core of the massif. For this reason, studied in details forsterite from the Kovdor phoscorite–carbonatite complex will be also compared with forsterite of the peridotite stock.

2. Geological Setting

The Kovdor massif of alkaline and ultrabasic rocks, phoscorite and carbonatites is situated in the SW of Murmansk Region, Russia (Figure 1a). It is a central-type intrusive complex with an area of 40.5 km2 at the day surface emplaced in Archean granite-gneiss [31,32,33]. The geological setting of the Kovdor massif has been described by [9,21,28,30,34]. The massif consists of a central stock of earlier peridotite rimmed by later foidolite (predominantly) and melilitolite (Figure 1). In cross-section, the massif is an almost vertical stock, slightly narrowing with depth at the expense of foidolite and melilitolite [35]. There is a complex of metasomatic rocks between peridotite core and foidolite–melilitolite rim: diopsidite; phlogopitite; melilite-, monticellite-, vesuvianite-, and andradite-rich skarn-like rocks. Host gneiss transforms into fenite at the distance of 0.2–2 km from the alkaline ring intrusion. Numerous dikes and veins (up to 5 m thick) of nepheline and cancrinite syenite, (micro)ijolite, phonolite, alnoite, shonkinite, calcite, calcite and dolomite carbonatites cut into all the above mentioned intrusive and metasomatic rocks [9].
At the western contact of peridotite and foidolite, there is a concentrically zoned pipe of phoscorite and carbonatites (Figure 1b,c) highly enriched in magnetite, hydroxylapatite and baddeleyite. The marginal zone of this pipe is composed of (apatite)-forsterite phoscorite (Figure 2a,b), the intermediate zone consists of low-carbonate magnetite-rich phoscorite (Figure 2c) and the axial zone contains calcite-rich phoscorite (Figure 2d) and phoscorite-related calcite carbonatite (non-vein bodies characterized by transient contact with phoscorite). Numerous carbonatite veins cut the phoscorite body, with the highest concentration of veins encountered in its axial, calcite-rich zone (Figure 1b,c and Figure 2e,g). Main varieties of phoscorite and phoscorite-related carbonatite are shown in Table 1. However, there are no distinct boundaries between these rocks, and artificial boundaries between them are quite conventional [10]. Zone of linear veins of dolomite carbonatite (Figure 1b,c) extends from the central part of the phoscorite–carbonatite pipe to the north-east and associates with metasomatic magnetite-dolomite-serpentine rock, which replaced peridotite or forsterite-rich phoscorite [9,11,24].

3. Materials and Methods

For this study, we used 540 thin polished sections of phoscorite (mainly), carbonatites and host rocks from 108 exploration holes drilled within the Kovdor phoscorite–carbonatite complex. The thin polished sections were analyzed using the LEO-1450 scanning electron microscope (Carl Zeiss Microscopy, Oberkochen, Germany) with energy-dispersive analyzer Röntek to obtain BSE-images of representative regions and pre-analyze all minerals found in the samples. The ImageJ open source image processing program [36] was used to create digital images from the BSE-images, and determine forsterite grain size (equivalent circular diameter) and orientation of the grain long axis.
Chemical composition of forsterite was analyzed in the Geological Institute of the Kola Science Center, Russian Academy of Sciences, with the Cameca MS-46 electron microprobe (Cameca, Gennevilliers, France) operating in WDS-mode at 22 kV with beam diameter 10 mm, beam current 30 nA and counting times 20 s (for a peak) and 2 × 10 s (for background before and after the peak), with 5–10 counts for every element in each point. The analytical precision (reproducibility) of forsterite analyses is 0.2–0.05 wt % (2 standard deviations) for the major element and about 0.01 wt % for impurities. Used standards and detection limits are given in Table 2. The systematic errors are within the random errors.
At the X-ray Diffraction Centre of Saint-Petersburg State University, single-crystal X-ray diffraction experiments were performed on forsterite crystals 919/18.5 (1), 924/26.7 (2), 924/169.1 (3), 966/62.9 (4), 987/67.2 (5) with the Agilent Technologies Xcalibur Eos diffractometer operated at 50 kV and 40 mA. A hemisphere of three-dimensional data was collected at room temperature, using monochromatic Mo X-radiation with frame widths of 1° and 10 s count for each frame. Crystal structures were refined in the standard setting (space group Pnma) by means of the SHELX program [37] incorporated in the OLEX2 program package [38]. Empirical absorption correction was applied in the CrysAlis PRO [39] program using spherical harmonics, implemented in the SCALE3 ABSPACK scaling algorithm. Volumes of coordination polyhedra are calculated with the VESTA 3 program [40]. Crystal structures were visualized with the Diamond 3.2f program [41].
Cation contents were calculated in the MINAL program by D. V. Dolivo-Dobrovolsky [42]. Statistical analyses were implemented with the STATISTICA 8.0 [43] and TableCurve 2D [44] programs. Geostatisical studies and 3D modeling were conducted with the MICROMINE 16.1 [45] program. Interpolation was performed by ordinary kriging.
Abbreviations used include Ap (hydroxylapatite), Bdy (baddeleyite), Cal (calcite), Cb (carbonate), Chu (clinohumite), Clc (clinochlore), Di (diopside), Dol (dolomite), Fo (forsterite), Mag (magnetite), Nph (nepheline), Phl (phlogopite), Po (pyrrhotite), Spl (spinel), Srp (serpentine) and Val (valleriite).

4. Results

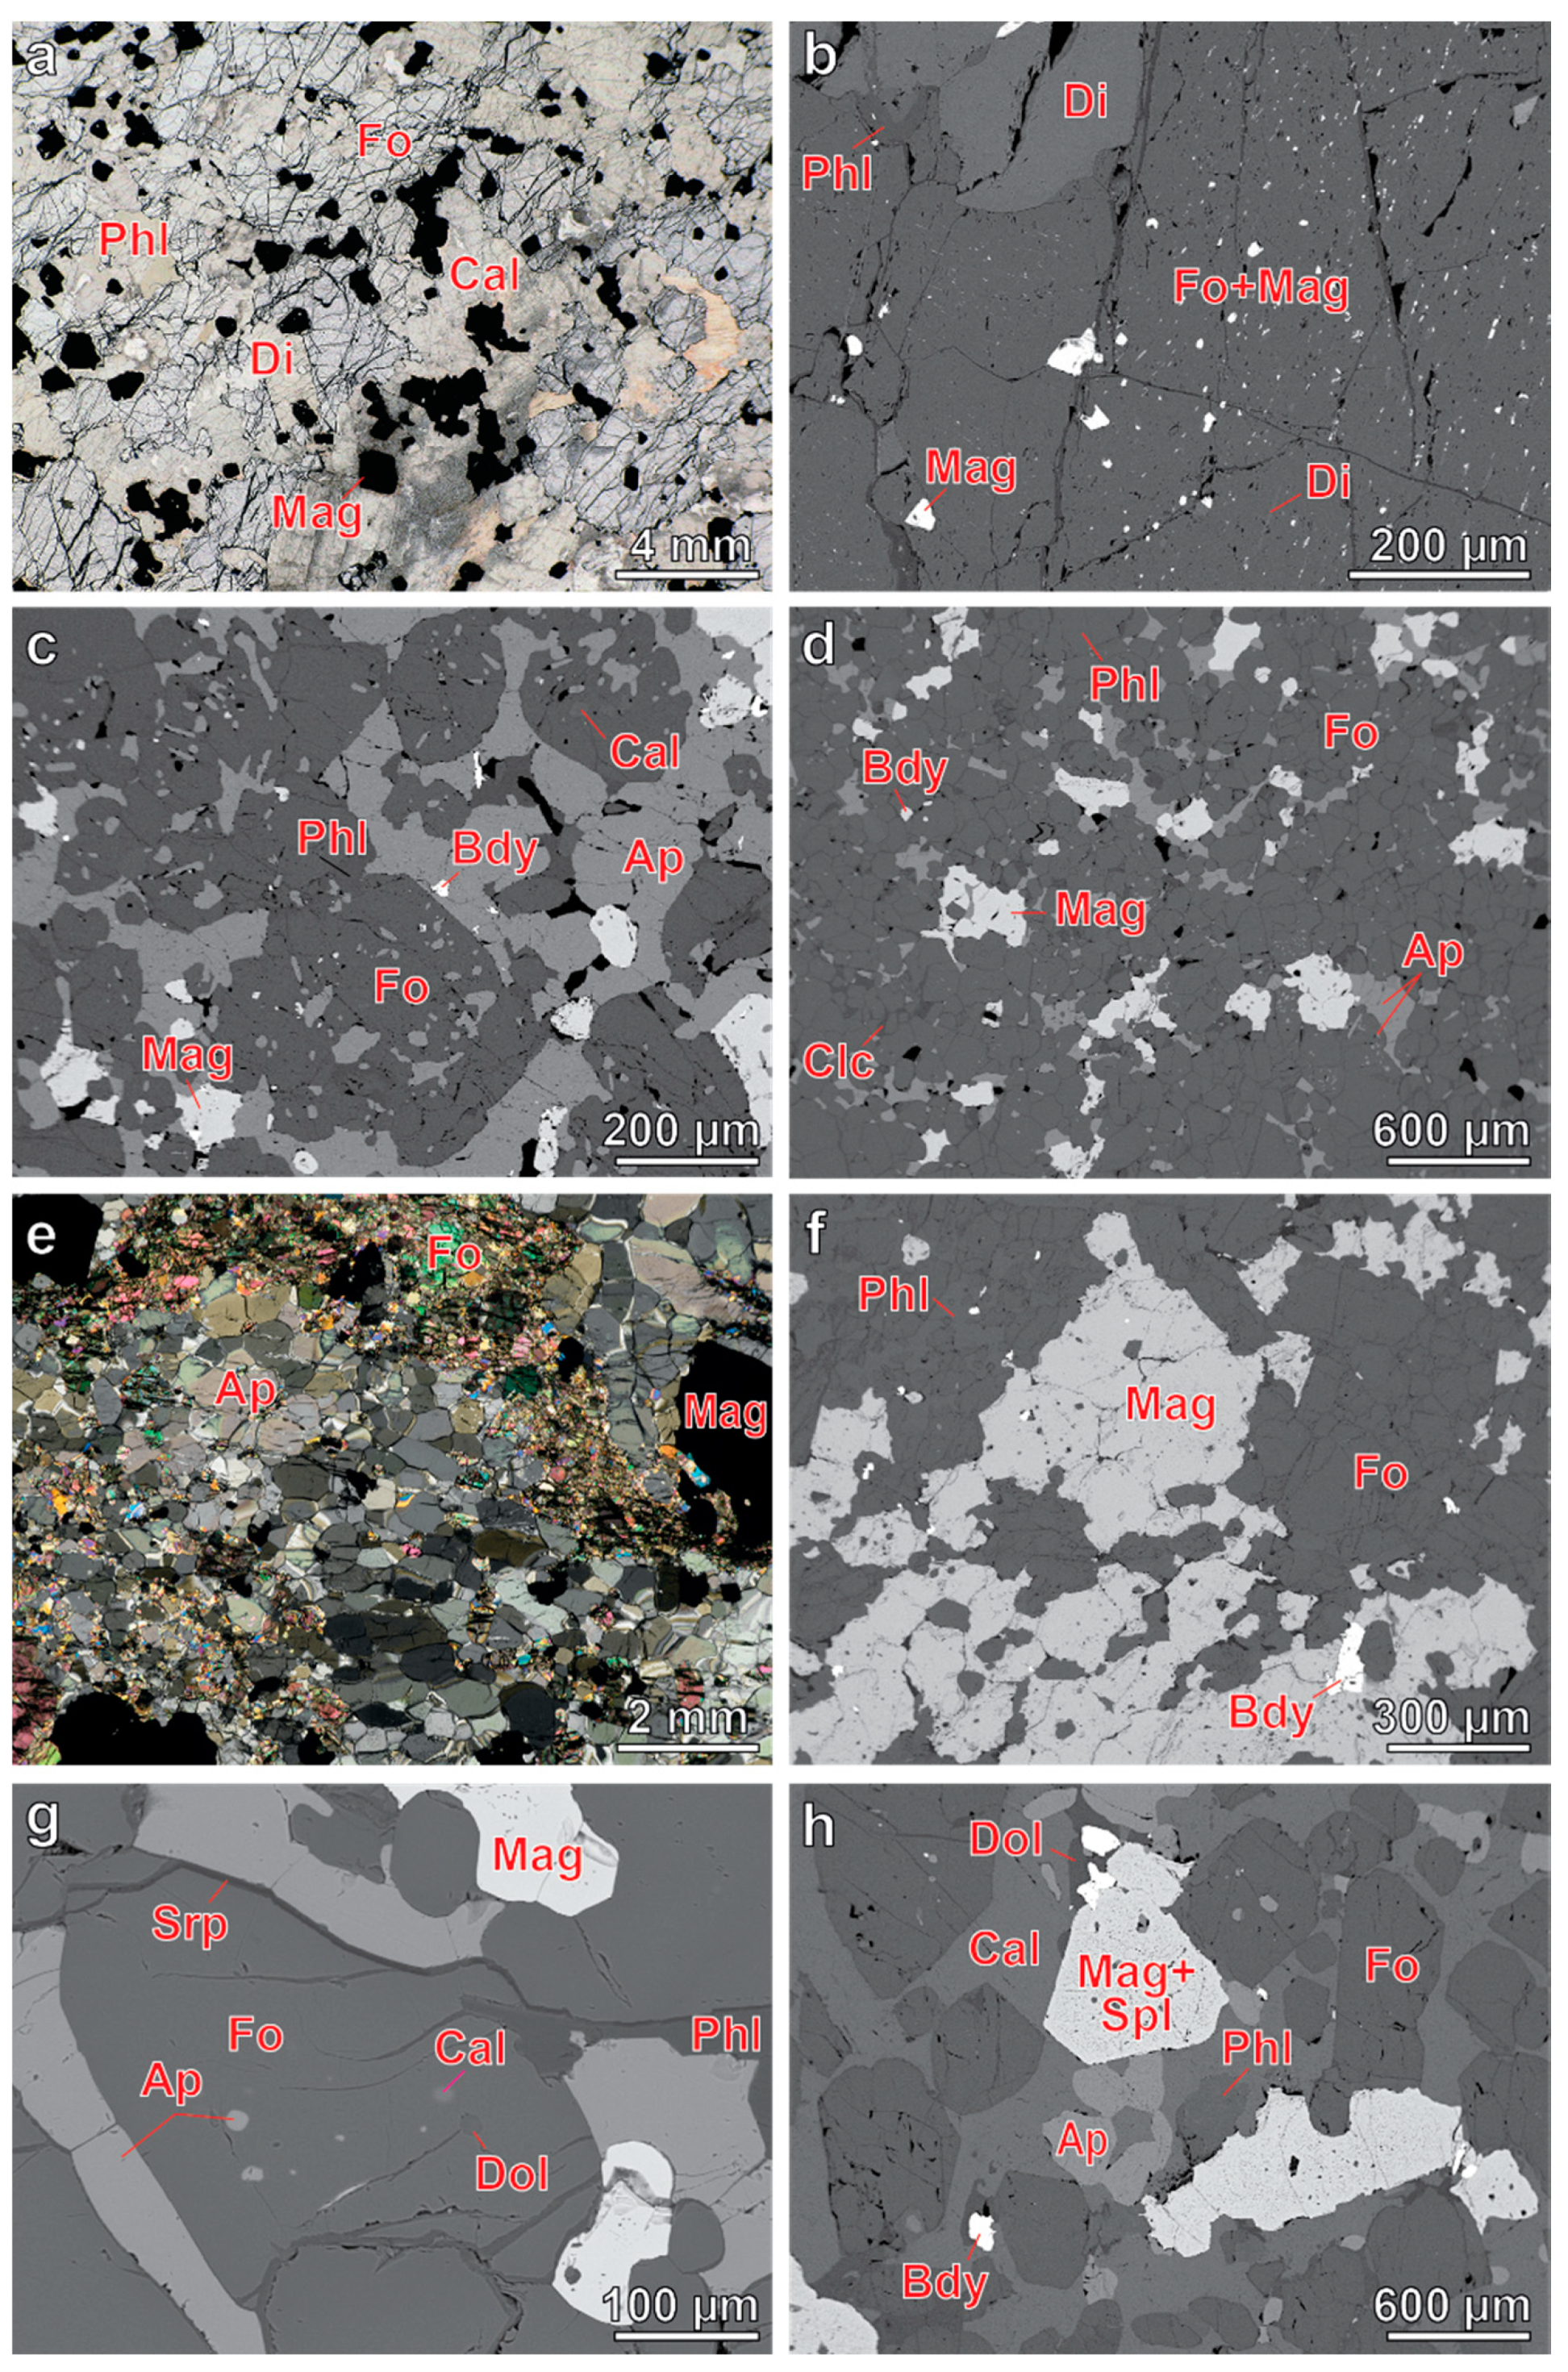
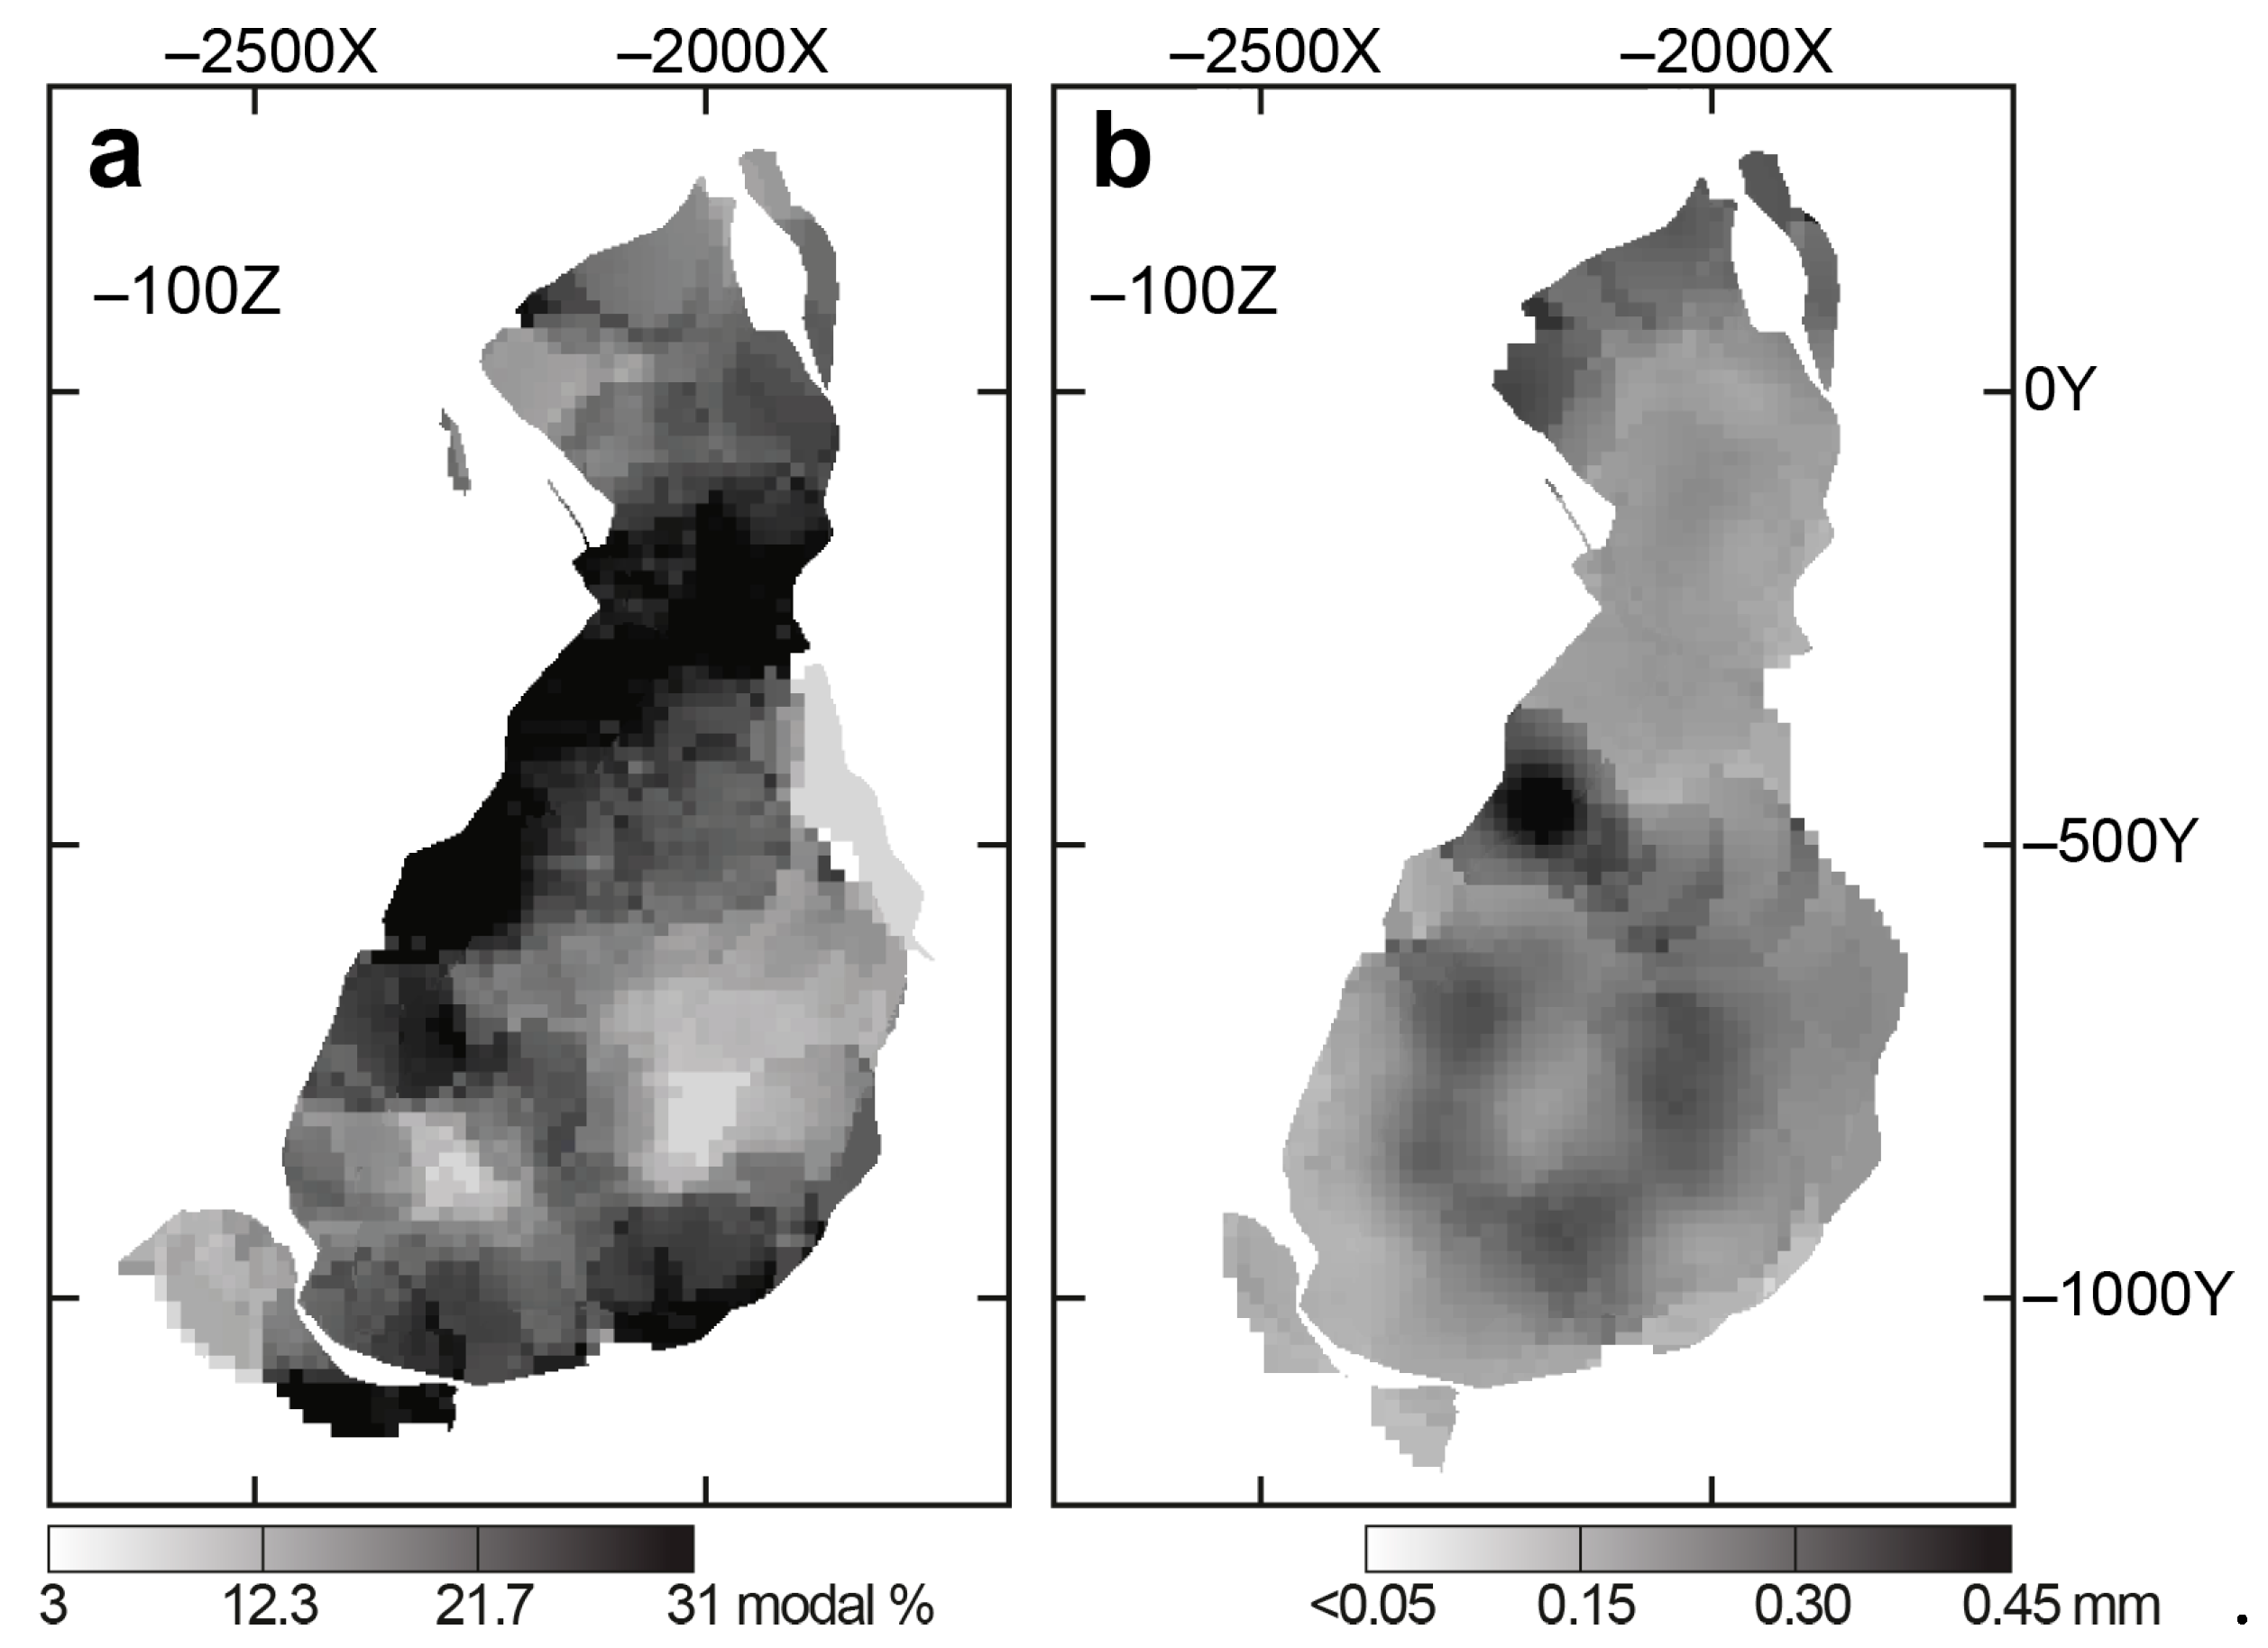
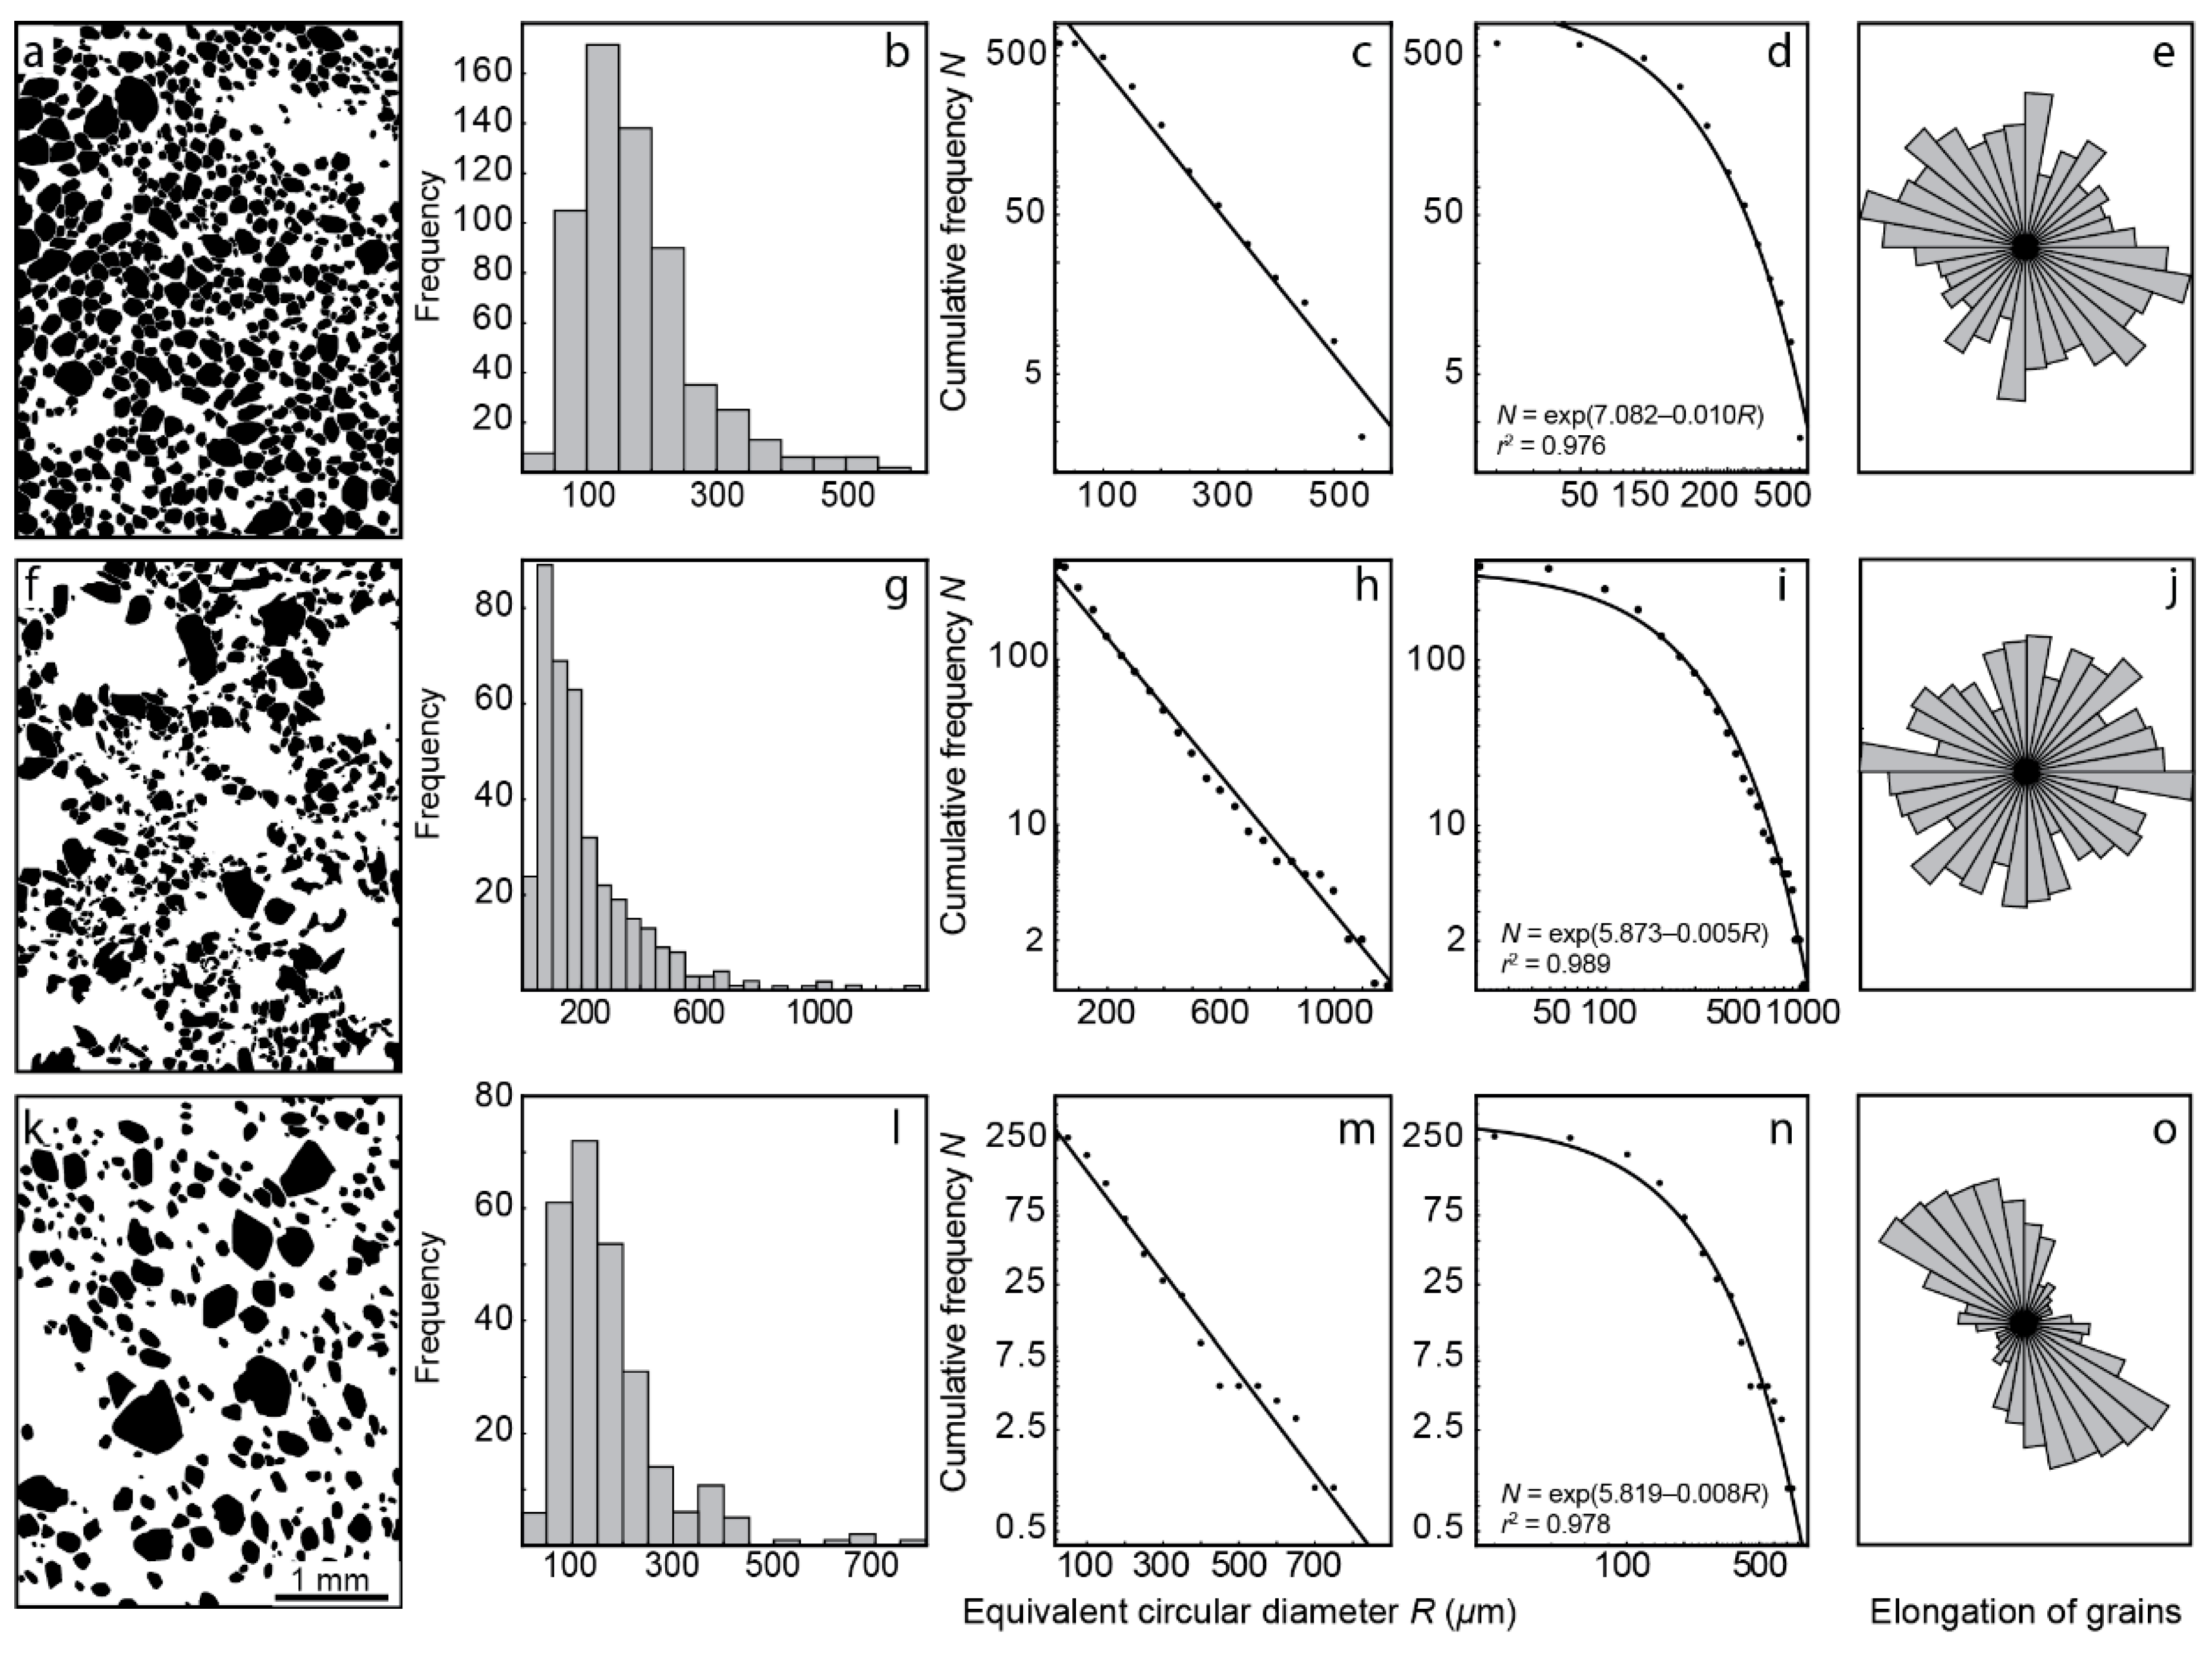
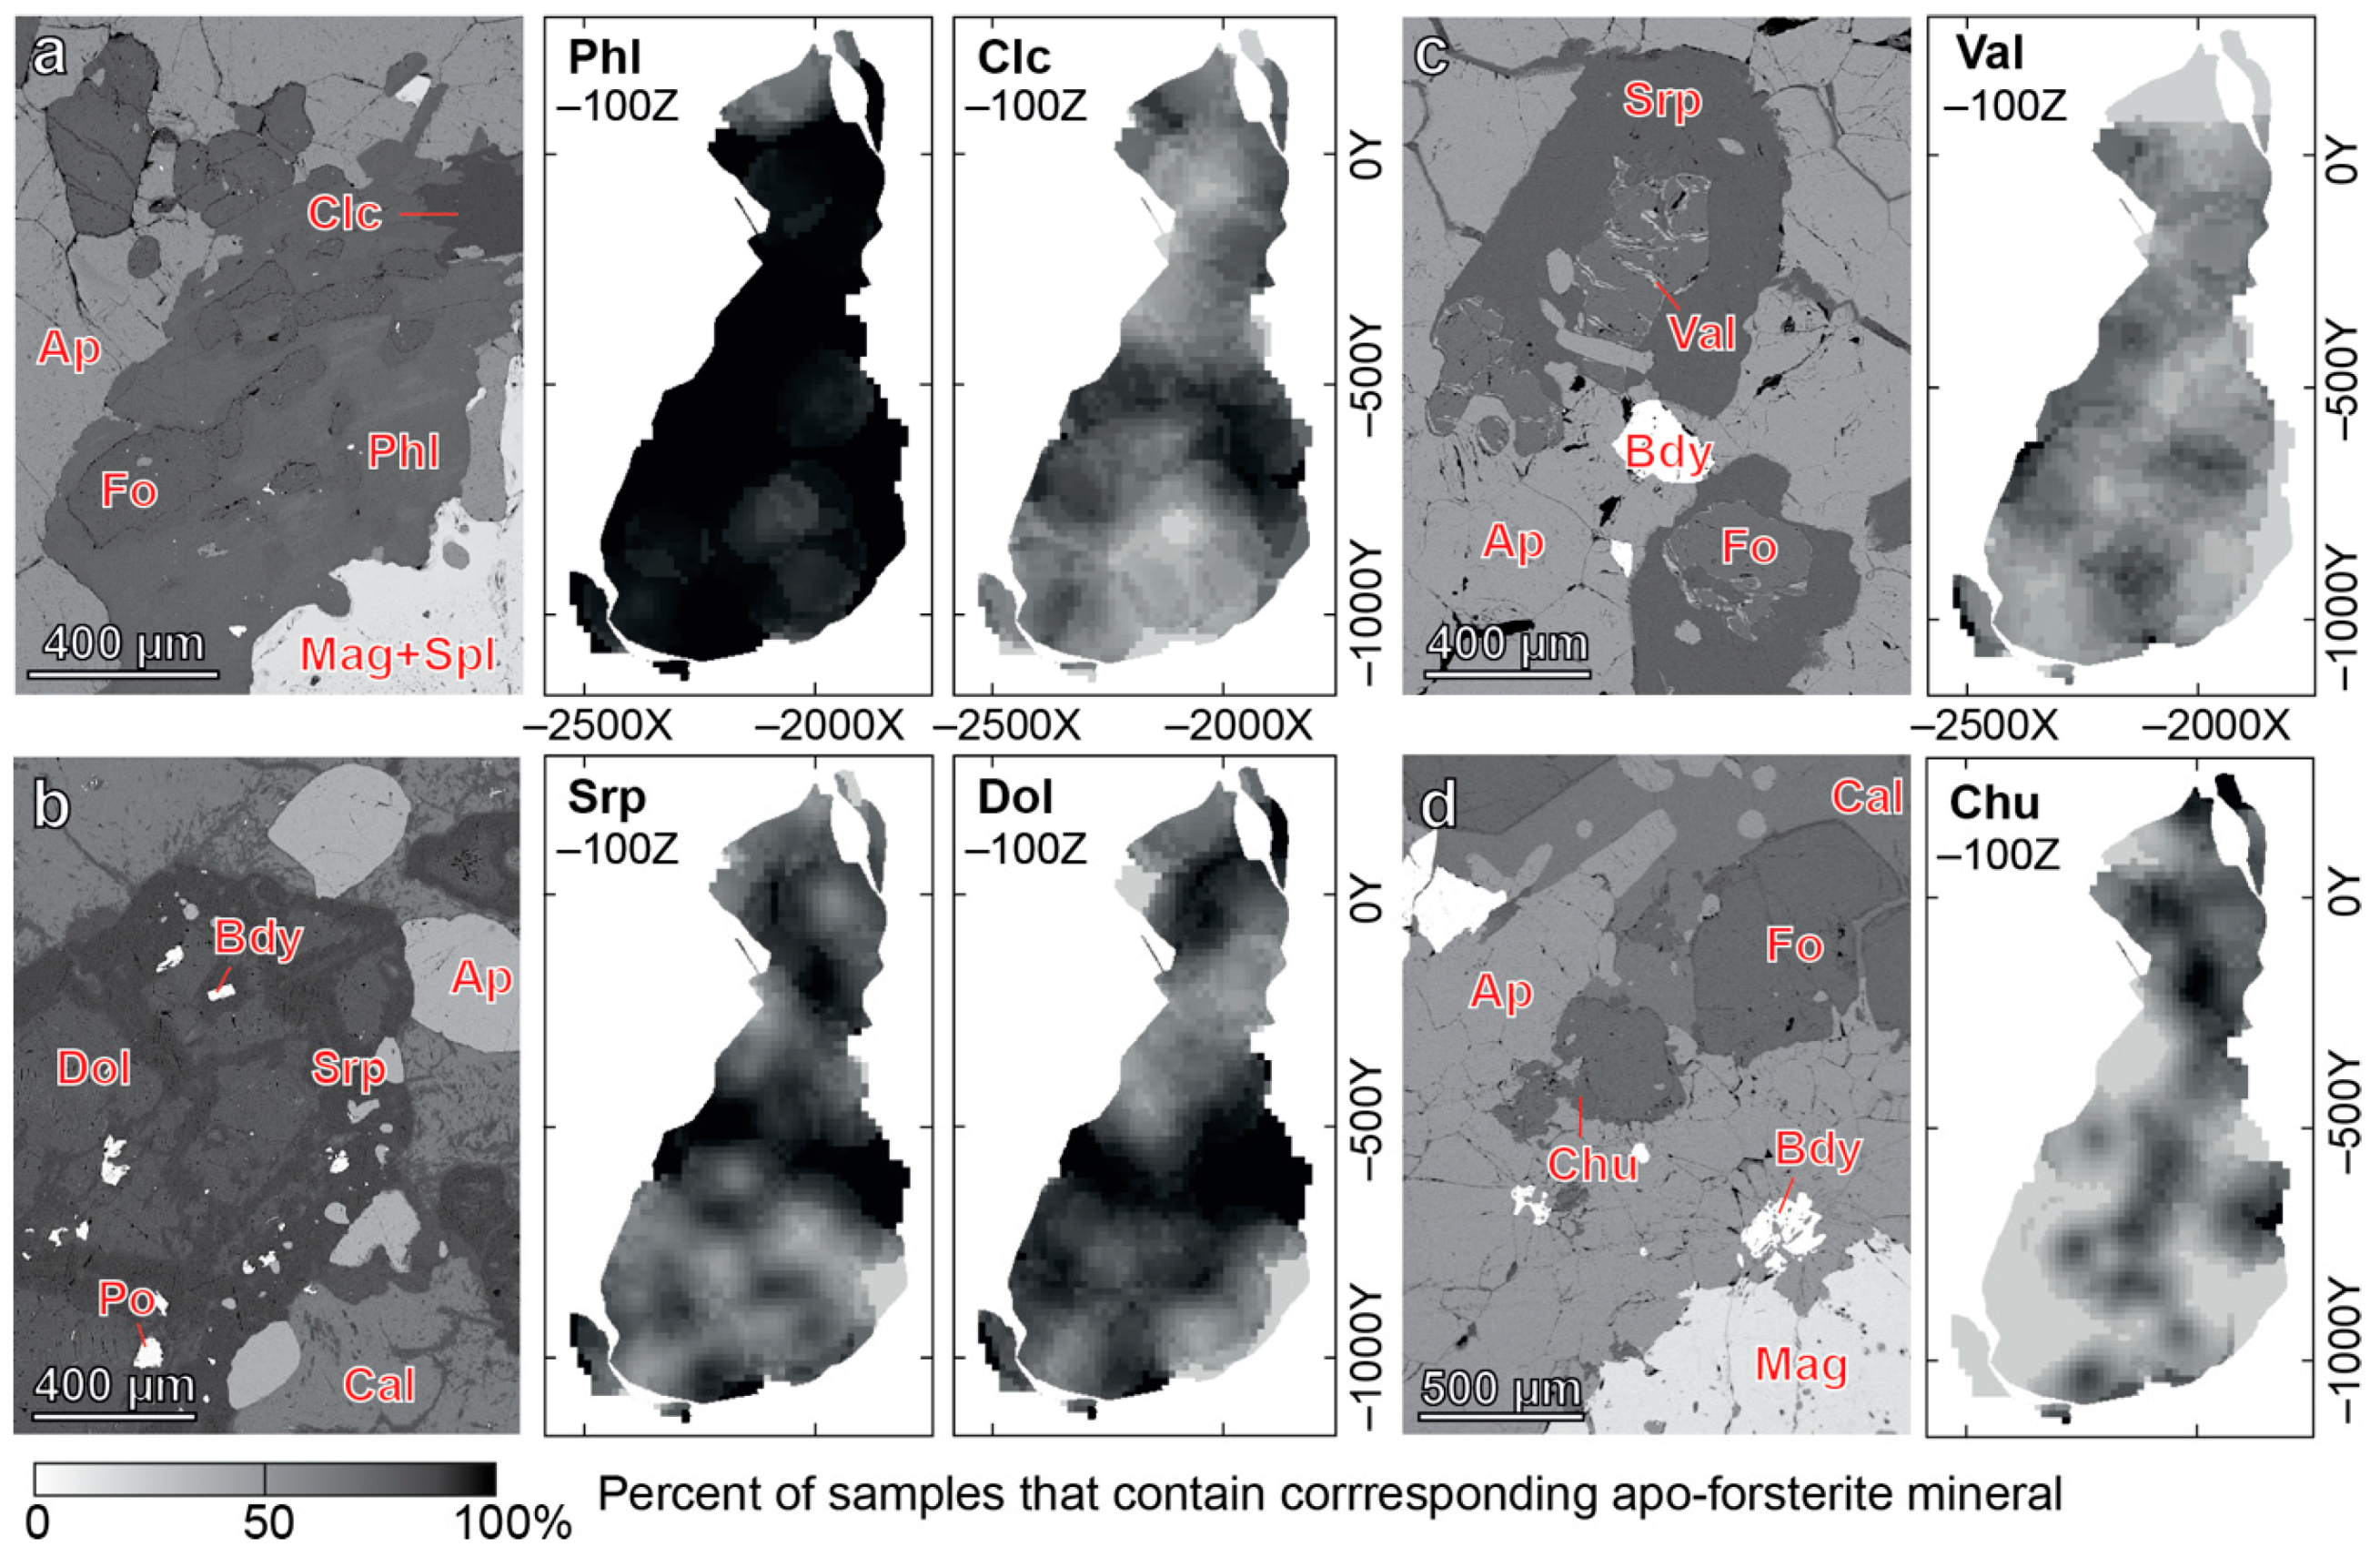
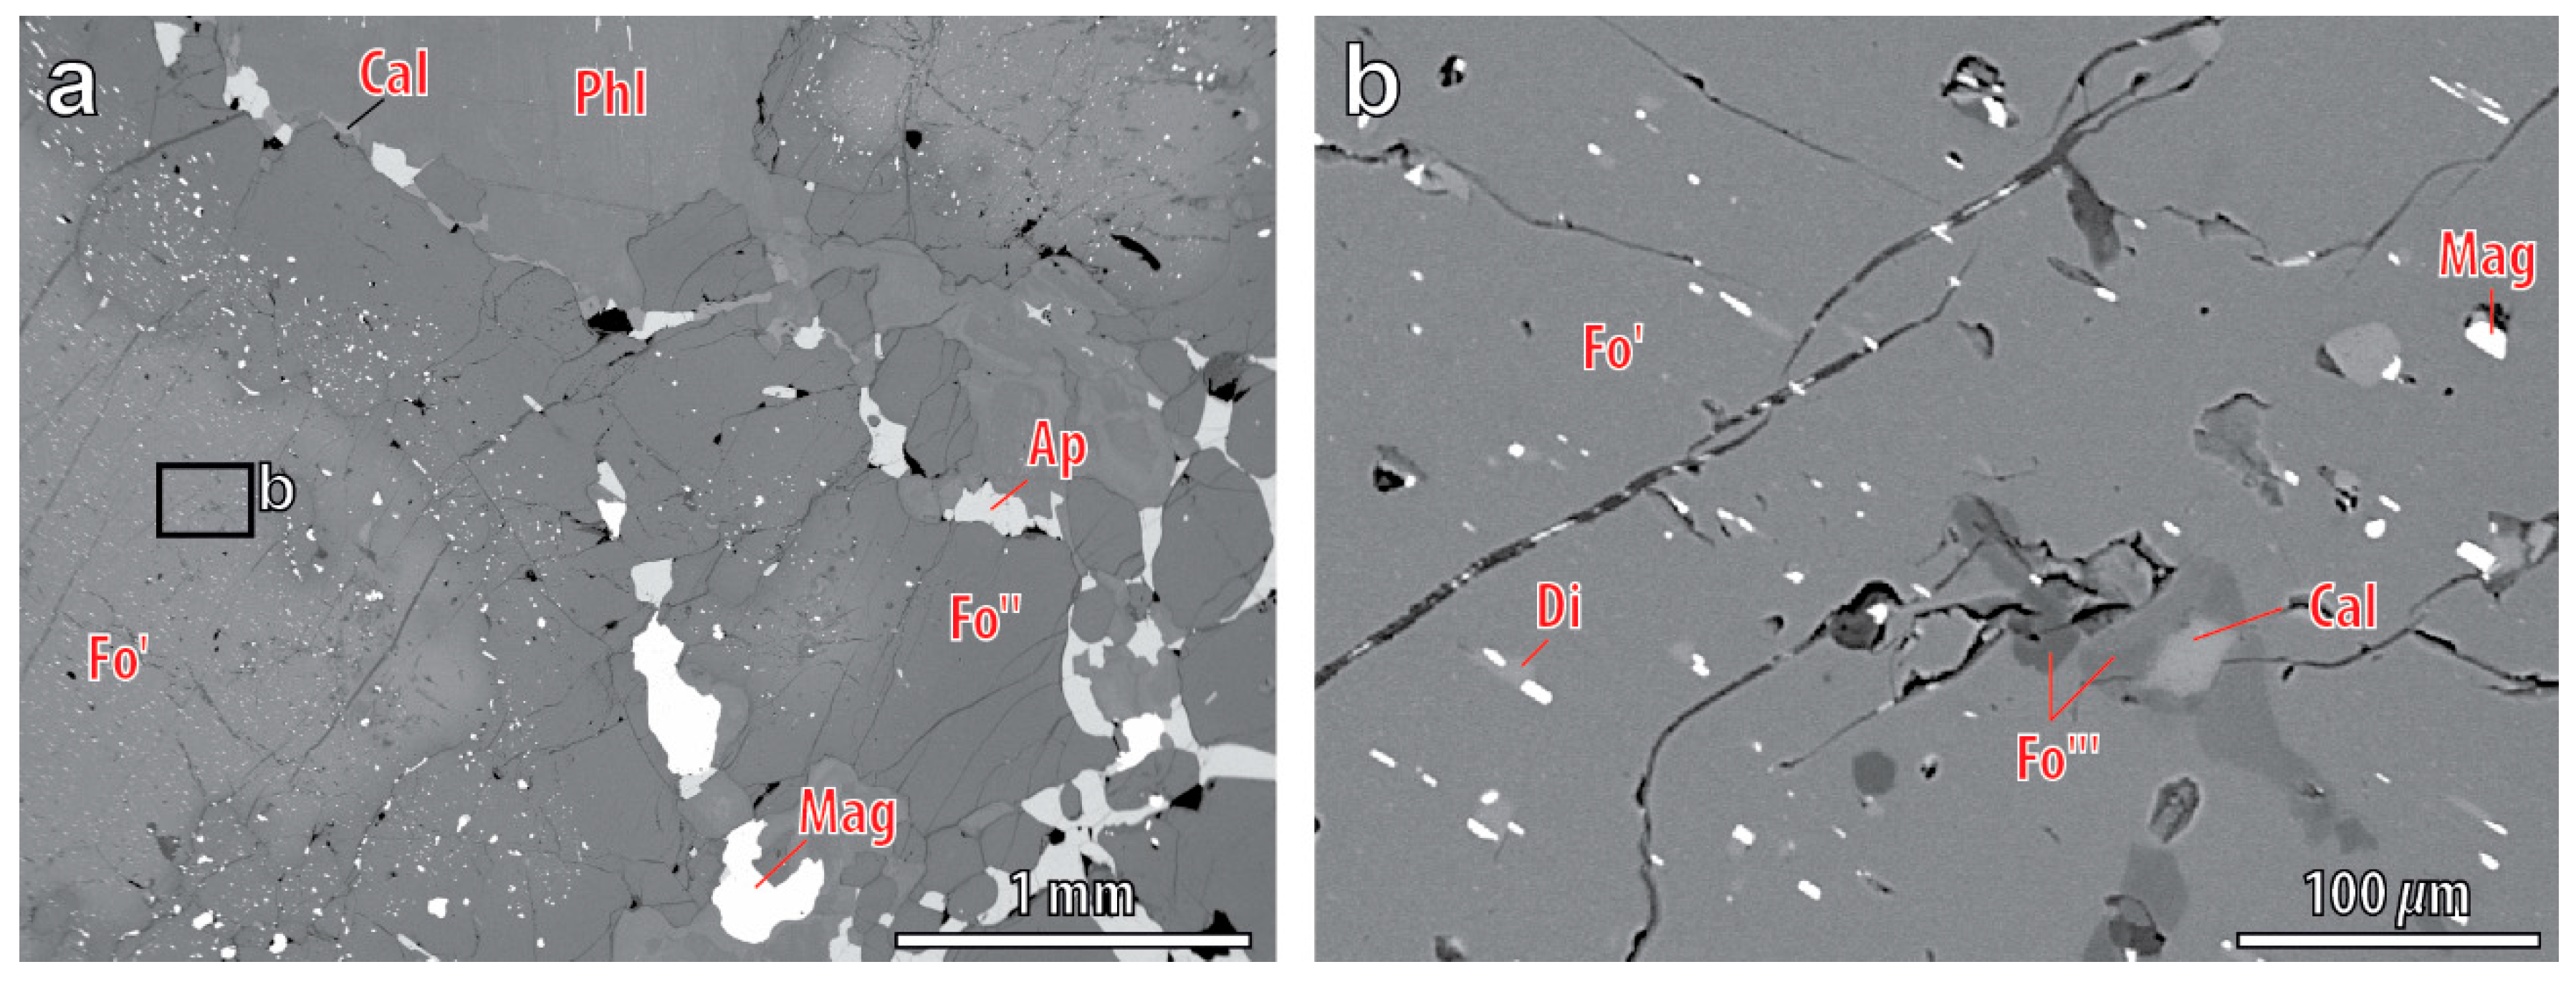
4.1. Content, Morphology and Grain Size of Forsterite

Peridotite contains 40–90 modal % of forsterite that has rounded isometric grains (Figure 3a) up to 12 cm in diameter. Interstices within forsterite aggregate are filled with short prismatic grains of diopside (up to 50 modal %), phlogopite plates (up to 15 modal %), anhedral grains of (titano)magnetite (up to 10 modal %), and fine-granular nests of hydroxylapatite (up to 5 modal %). Within the forsterite grains, there are lens-like inclusions of diopside with skeletal or tabular crystals of relatively pure magnetite inside (Figure 3b), as well as rounded inclusions of calcite. Typical products of forsterite alteration include serpentine (lizardite and clinochrysotile), clinochlore and, rarely, clinohumite. Near the contact with foidiolite intrusion, forsterite is intensively replaced with newly formed diopside, phlogopite (Figure 3a) and richterite, up to transformation of peridotite into diopsidite and/or phlogopite glimmerite.
Phoscorite contains 0–90 modal % of forsterite (Figure 4a). The highest content usually occurs in marginal forsteritite and apatite-forsterite phoscorite (89 and 53 modal % correspondingly, Figure 2a,b and Figure 3c,d). In intermediate low-carbonate magnetite-rich phoscorite, average content of forsterite decreases from 42 modal % in magnetite-forsterite (MF) phoscorite (Figure 3f) to 28 modal % in predominant magnetite-apatite-forsterite (MAF) phoscorite (Figure 2c and Figure 3e), and then to 4 modal % in apatite-magnetite (AM) phoscorite and 2 modal % in magnetitite (M). Average content of forsterite in axial calcite-rich phoscorite varies from 28–21 modal % in calcite-magnetite-forsterite (CMF) and calcite-magnetite-apatite-forsterite (CMAF) phoscorite (Figure 2d) to 3 modal % in calcite-magnetite-apatite (CMA) and calcite-magnetite (CM) phoscorite. Lastly, phoscorite-related carbonatite contains 5 modal % of forsterite [24].
Gradual decrease of forsterite content from earlier forsteritite of the marginal zone to later carbonatites is accompanied by regular changes in morphology and grain size of forsterite as well as in its relations with other rock-forming minerals. In the marginal forsterite-rich phoscorite, forsterite forms spherical (small) to ellipsoidal (large) grains (Figure 2a,b) or, more rarely, well-shaped short prismatic crystals with a:c = 1:1.3. Average equivalent circular diameter of forsterite grains is 0.18 mm (Figure 4b), and grain size distribution is negative-exponential (Figure 5), when cumulative frequencies are concave down in log-log space (Figure 5d), and linear in semilog space (Figure 5c). There is insufficient anisotropy in grain orientation (Figure 5e). When forsterite content sufficiently exceeds apatite content, then hydroxylapatite fills interstices between forsterite grains. In this case, forsterite grains contain numerous inclusions of hydroxylapatite. Its content increases in the vicinity of large segregation of hydroxylapatite (Figure 3d). If the amount of hydroxylapatite increases, then spatial separation of forsterite and hydroxylapatite is observed (Figure 3e). Such monomineral segregations randomly alternate with areas evenly filled with apatite and forsterite (Figure 2b). Moreover, there are indications of co-crystallization of forsterite and hydroxylapatite. In this case, forsterite grains contain numerous inclusions of apatite and have sinuous boundaries (Figure 3c). In addition, forsterite grains sometimes contain prismatic inclusions of baddeleyite (up to 20 μm long, Figure 2f) as well as spherical inclusions (“drops”) of calcite (up to 60 μm in diameter, Figure 3c) and, rarely, dolomite (up to 20 μm in diameter). Magnetite occurs mainly within apatite segregations or fills interstices between forsterite grains together with hydroxylapatite.
In the intermediate low-carbonate magnetite-rich phoscorite, average size of forsterite grains is 0.19 mm (Figure 4b), grain size distribution is the same as in the marginal forsterite-rich phoscorite (Figure 5h,i), but without anisotropy in grain orientation (Figure 5j). Magnetite content growth leads to concentration of magnetite and forsterite in separate monomineralic nests (Figure 3f); however, hydroxylapatite still closely associates with magnetite. Forsterite grains obtain mirror-like faces at the boundary with calcite nests and veinlets. Similar to marginal (apatite)-forsterite phoscorite, forsterite grains usually contain ellipsoidal inclusions of hydroxylapatite, prismatic inclusions of baddeleyite and spherical “drops” of calcite and dolomite (Figure 3g) in the pipe intermediate zone.
In the axial calcite-rich phoscorite and phoscorite-related carbonatite, minor forsterite occurs as xenomorph rounded grains within its monomineralic nests, and well-shaped short prismatic crystals (up to 15 cm long) at the contact with calcite segregations (Figure 3h). Average size of forsterite grains is 0.2 mm (Figure 4b), grain size distribution is exponential (Figure 5m,n), and anisotropy of grain orientation is strong (Figure 5o). Inclusions in forsterite grains become rarer and smaller, and mainly consist of rounded hydroxylapatite and prismatic baddeleyite.
Vein calcite and dolomite carbonatites include only 1 modal % of small idiomorphic grains of forsterite (Figure 2g). The mineral concentrates in marginal parts of the veins intersecting forsterite-rich host phoscorite. Usually, such crystals are free of inclusions.
In all rocks of the Kovdor phoscorite–carbonatite complex, forsterite is usually partially replaced by secondary phlogopite, clinochlore, clinohumite, valleriite, serpentine, and dolomite, with clear correspondence to the pipe zonation. Apo-forsterite phlogopite occurs throughout the pipe volume; but in phoscorite-related carbonatite, it is more sparsely spread (Figure 6a). At first, mica forms polycrystalline rims around forsterite grains, and later, it forms large flexural plates with forsterite relics inside. Secondary clinochlore closely associates with phlogopite, forming rims around resorbed forsterite grains (Figure 3d), and its distribution within the phoscorite–carbonatite pipe is similar to mica (Figure 6a). Dolomite and serpentine replace forsterite predominantly within linear zone of dolomite carbonatite (Figure 2a and Figure 6b), finally forming magnetite-dolomite-serpentine rocks after peridotite and forsterite-rich phoscorite [11,24]. Besides, serpentine associates closely with valleriite (Figure 6c), which content predictably increases in sulphide-bearing phoscorite. Apo-forsterite clinohumite occurs mainly in axial carbonate-rich phoscorite and carbonatites (Figure 6d): at first, as thin rims around forsterite grains, then, as comparatively large grains (up to 2 cm in diameter) with rare relics of forsterite.

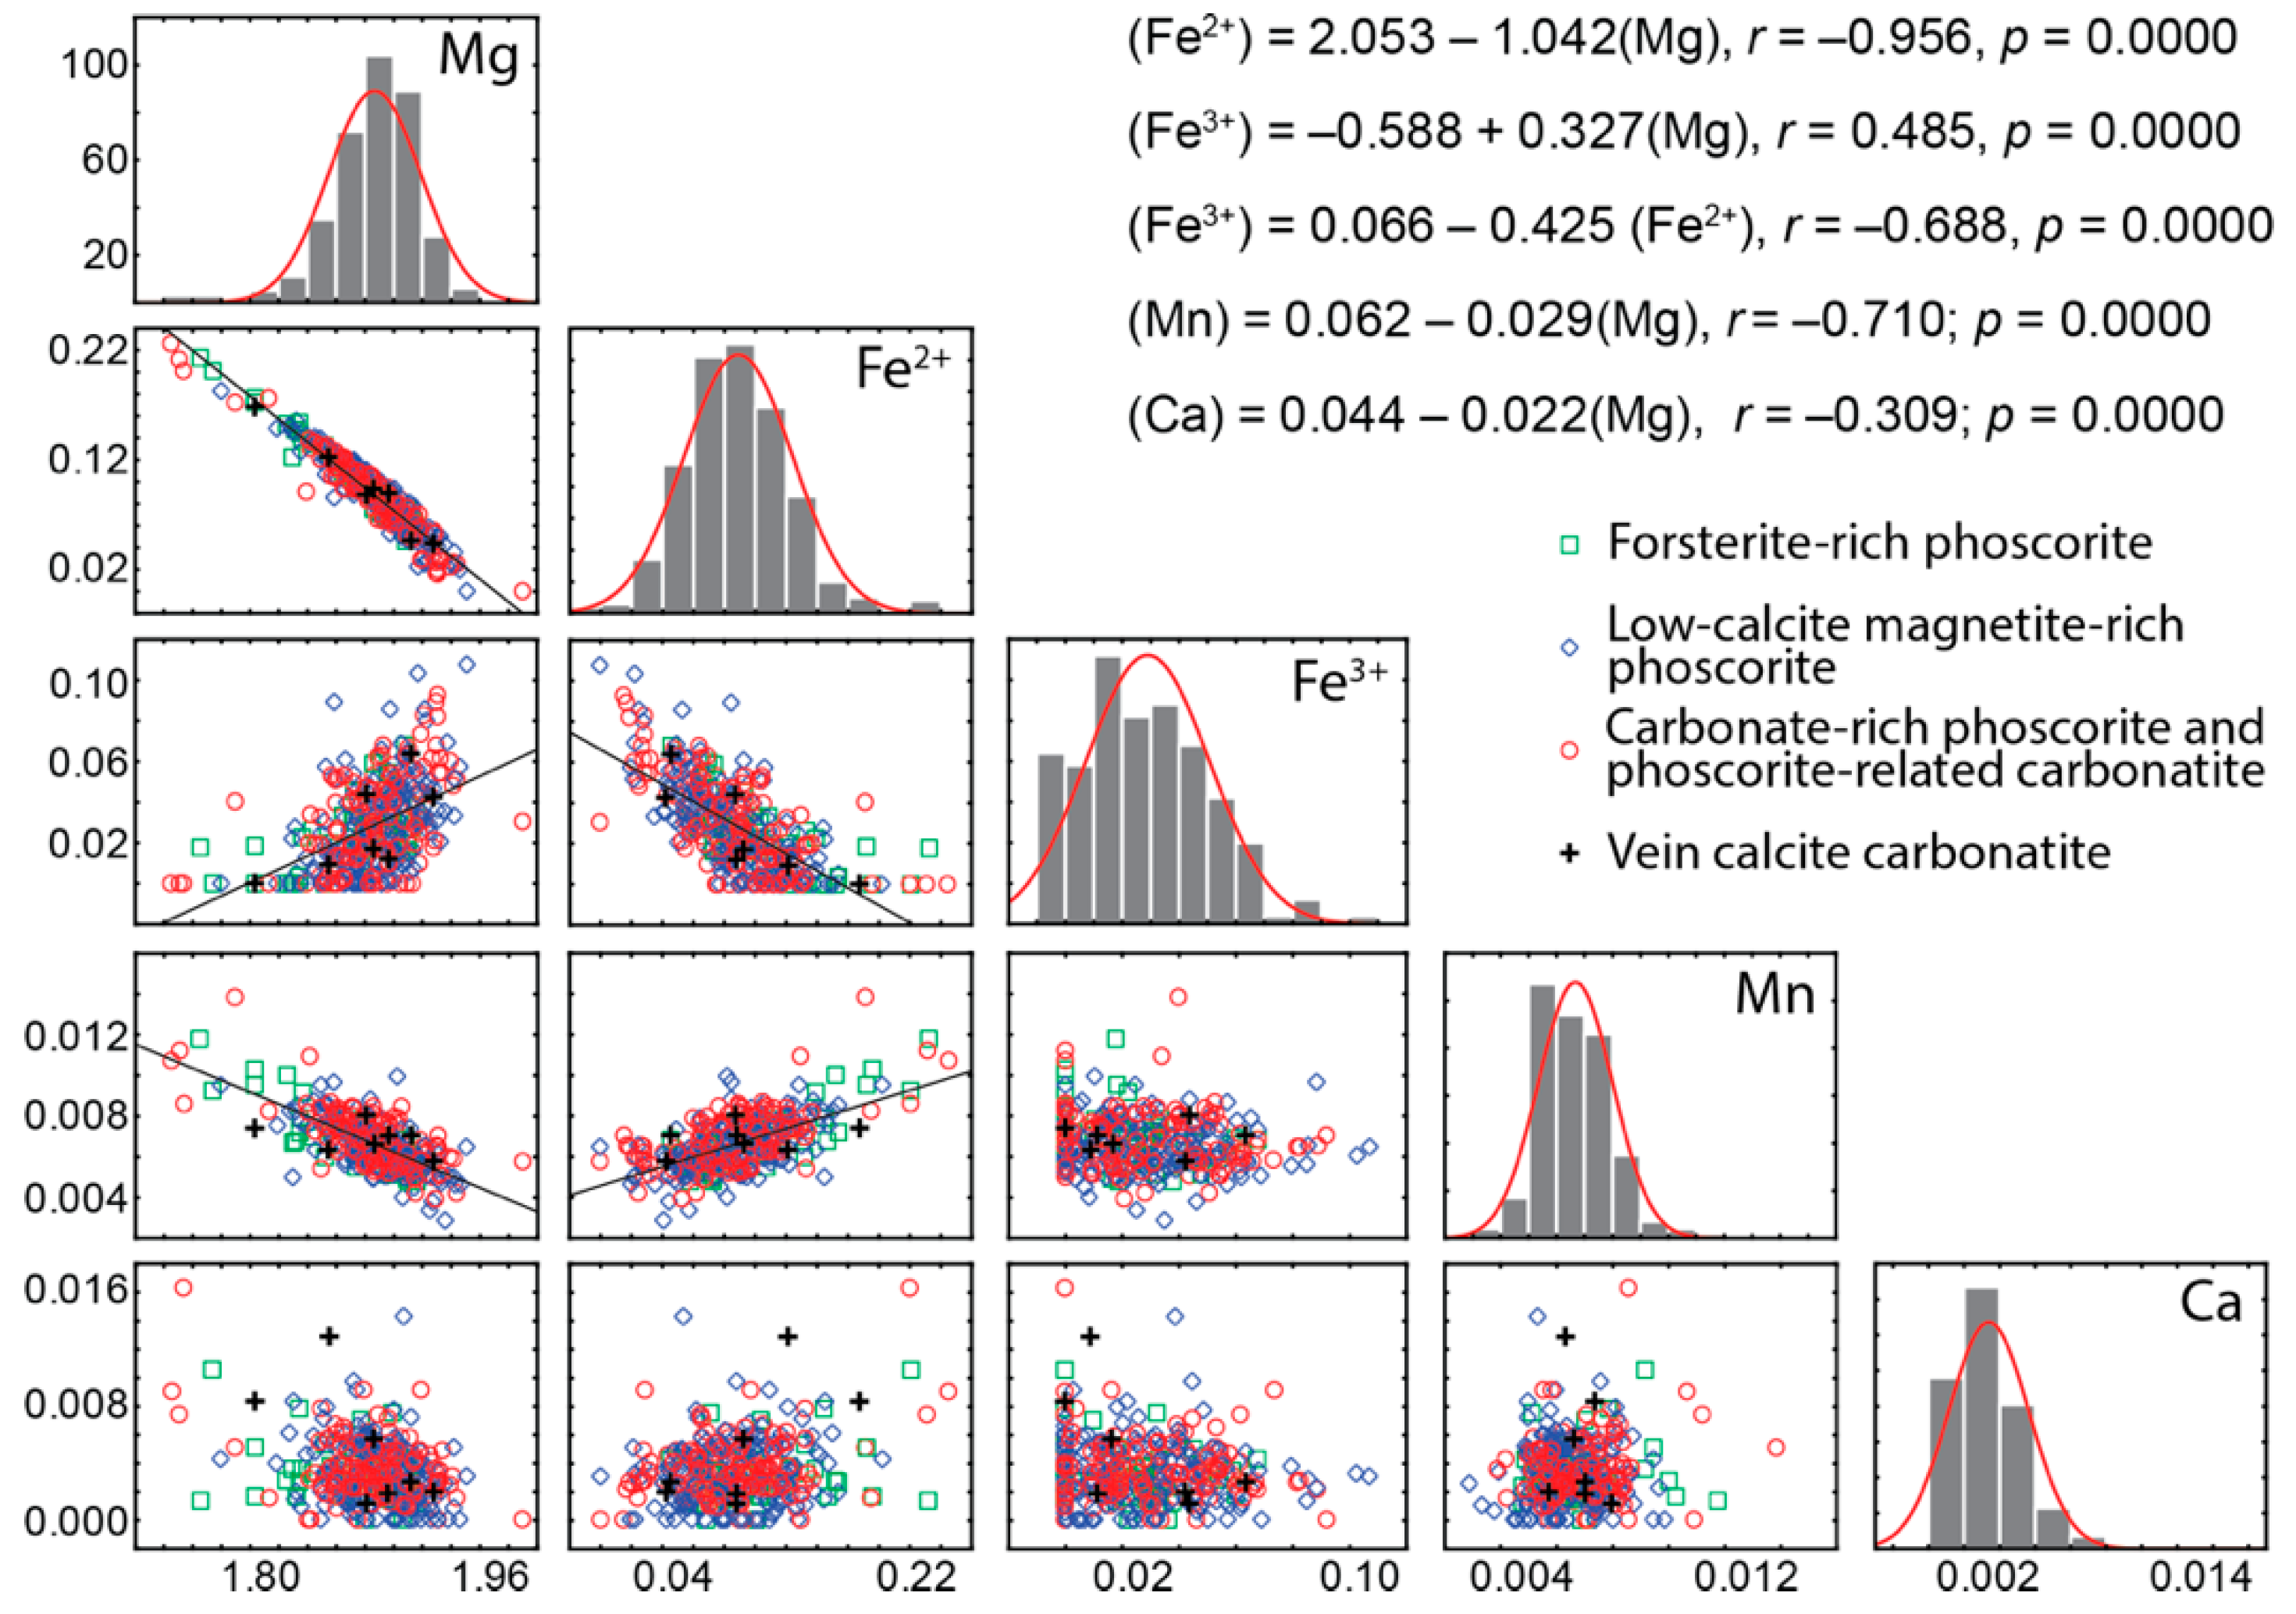
4.2. Chemical Composition

Despite the long history of the Kovdor study, only 16 chemical analyzes of forsterite from this massif can be found in the literature [9,21,30,46,47]. Average data on chemical composition of forsterite are listed in Table 3. As compared with forsterite from phoscorite and carbonatites, forsterite in peridotite is relatively enriched in CaO and NiO. In the phoscorite–carbonatite complex, forsterite contains minor amounts of the substitutions; however, this is enough to define zonation of the phoscorite–carbonatite pipe. In particular, the highest content of FeO (the average content 10 wt %) characterizes forsterite from marginal (apatite)-forsterite phoscorite, the highest content of CaO (about 0.2 wt %) is predictably found in forsterite from carbonatites. The highest content of minor substitutions of TiO2 and NiO (up to 0.07 and 0.06 wt %, correspondingly) occur in forsterite from marginal forsterite-rich phoscorite, and comparatively high content of Cr2O3 and Sc2O3 (up to 0.04 and 0.11 wt %, correspondingly) is typical for forsterite from axial calcite-rich phoscorite and phoscorite-related carbonatite. Usually, forsterite grains do not have any chemical zonation; however, some crystals of this mineral from forsterite-rich phoscorite contain iron-rich core and iron-poor marginal zone that differ by approx. 3 wt % in terms of MgO content.
Forsterite composition was recalculated at three cations per formula unit and O = 4 apfu, which permitted to obtain more realistic results than calculations based on 3 cations per formula unit or O = 4 apfu (no Fe3+-Fe2+ re-distribution), Si = 1 and O = 4 apfu (excess of cations in the octahedral M position), M = 2 and O = 4 apfu (deficit of Si). The result showed that in the average 30% of iron is in the three-valent form. There are significant correlations between Mg, Fe2+, Fe3+ and Mn (r = ±0.49–0.96, p = 0.0000) and weak correlations of these elements with Ca (Figure 7). Factor analysis of the cation contents (in apfu) was performed according to the principal components analysis with normalization and varimax rotation (Table 4). The analysis enabled us to reveal the following isomorphic substitutions:
Mg2+ + 2Fe3+ ⟷ 4(Fe, Mn)2+
Mg2+ + 2Fe3+ ⟷ 2(Fe, Mn, Ni)2+ + Ti4+
These substitutions result in clear concentric zonation of the Kovdor phoscorite–carbonatite complex in terms of forsterite composition (Figure 8). The features of forsterite composition (see above) and these figures show that the pipe marginal zone consists of Fe2+-Mn-Ni-Ti-rich forsterite similar to olivine from peridotite, the intermediate zone includes Mg-Fe3+-rich forsterite, and the axial zone contains Fe2+-Mn-rich forsterite. In addition, the content of Fe3+ in forsterite increases with depth. The tendency is accompanied by growth of Mg and Mn cumulative concentration with depth; however, these elements themselves vary in inverse proportion to each other. Ca content in forsterite increases sufficiently in carbonate-rich rocks located deeper than −500 m.
As noted earlier [9,11,13,24], chemical compositions of other minerals also change in accordance with a concentric zonation of the Kovdor phoscorite–carbonatite complex. Therefore, compositions of forsterite and other rock-forming and accessory minerals must be interdependent. Figure 9 shows correlation coefficients between main components of forsterite and co-existing rock-forming minerals. Forsterite composition closely correlates with composition of apatite, magnetite and calcite, with fundamental role of the main scheme of isomorphism, Mg2+ + 2Fe3 + □ ⟷ 4Fe2+ that reflects redox conditions of the rock formation. In fact, oxidized condition results in presence of Fe3+ instead of Fe2+ in melt/fluid/solution, and thus in crystallization of Mg-Fe3+-rich members of the corresponding mineral series, while reduced conditions cause domination of Fe2+ and formation of ferrous members of these series.
As a result, in marginal forsterite-rich phoscorite, predominant «ferrous forsterite» associates with Fe2+-Si-rich hydroxylapatite, Mn-Si-Ti-Zn-Cr-rich magnetite, and Fe2+-rich calcite. In the intermediate low-carbonate magnetite-rich phoscorite, predominant Fe3+-bearing forsterite occurs together with pure hydroxylapatite, Mg-rich magnetite and pure calcite. In the axial calcite-rich phoscorite and phoscorite-related carbonatite, «ferrous forsterite» again predominates in the associations with Fe2+-Mn-rich hydroxylapatite, Ca-V-rich magnetite and Fe2+-rich calcite. Comparison of the maps shown in Figure 8 with the corresponding schemas for associated rock-forming minerals [11] also confirms the above conclusion.
Electron spin resonance spectroscopy performed by Zeira et al. [48] demonstrated incorporation of Fe3+ in forsterite structure into M1 and M2 octahedral sites. According to Janney and Banfield [49], during oxidation under acidic conditions, incorporation of Fe3+ into octahedral sets of olivine is compensated by vacancies in octahedral sets: (3Fe2+)oct → (□ + 2Fe3+)oct (laihunite schema). Under alkaline conditions, olivine oxidation is accompanied by leaching of SiO4-tetrahedra: (4Fe2+)oct + (4Si4+)tet → (4Fe3+)oct + (□ + 3Si4+)tet. Due to permanent deficit of tetrahedral cations in forsterite (see Table 3) and alkaline nature of the Kovdor phoscorite–carbonatite complex, we assume that forsterite oxidation follows the latter schema. However, this assumption should be confirmed with X-ray crystal study.

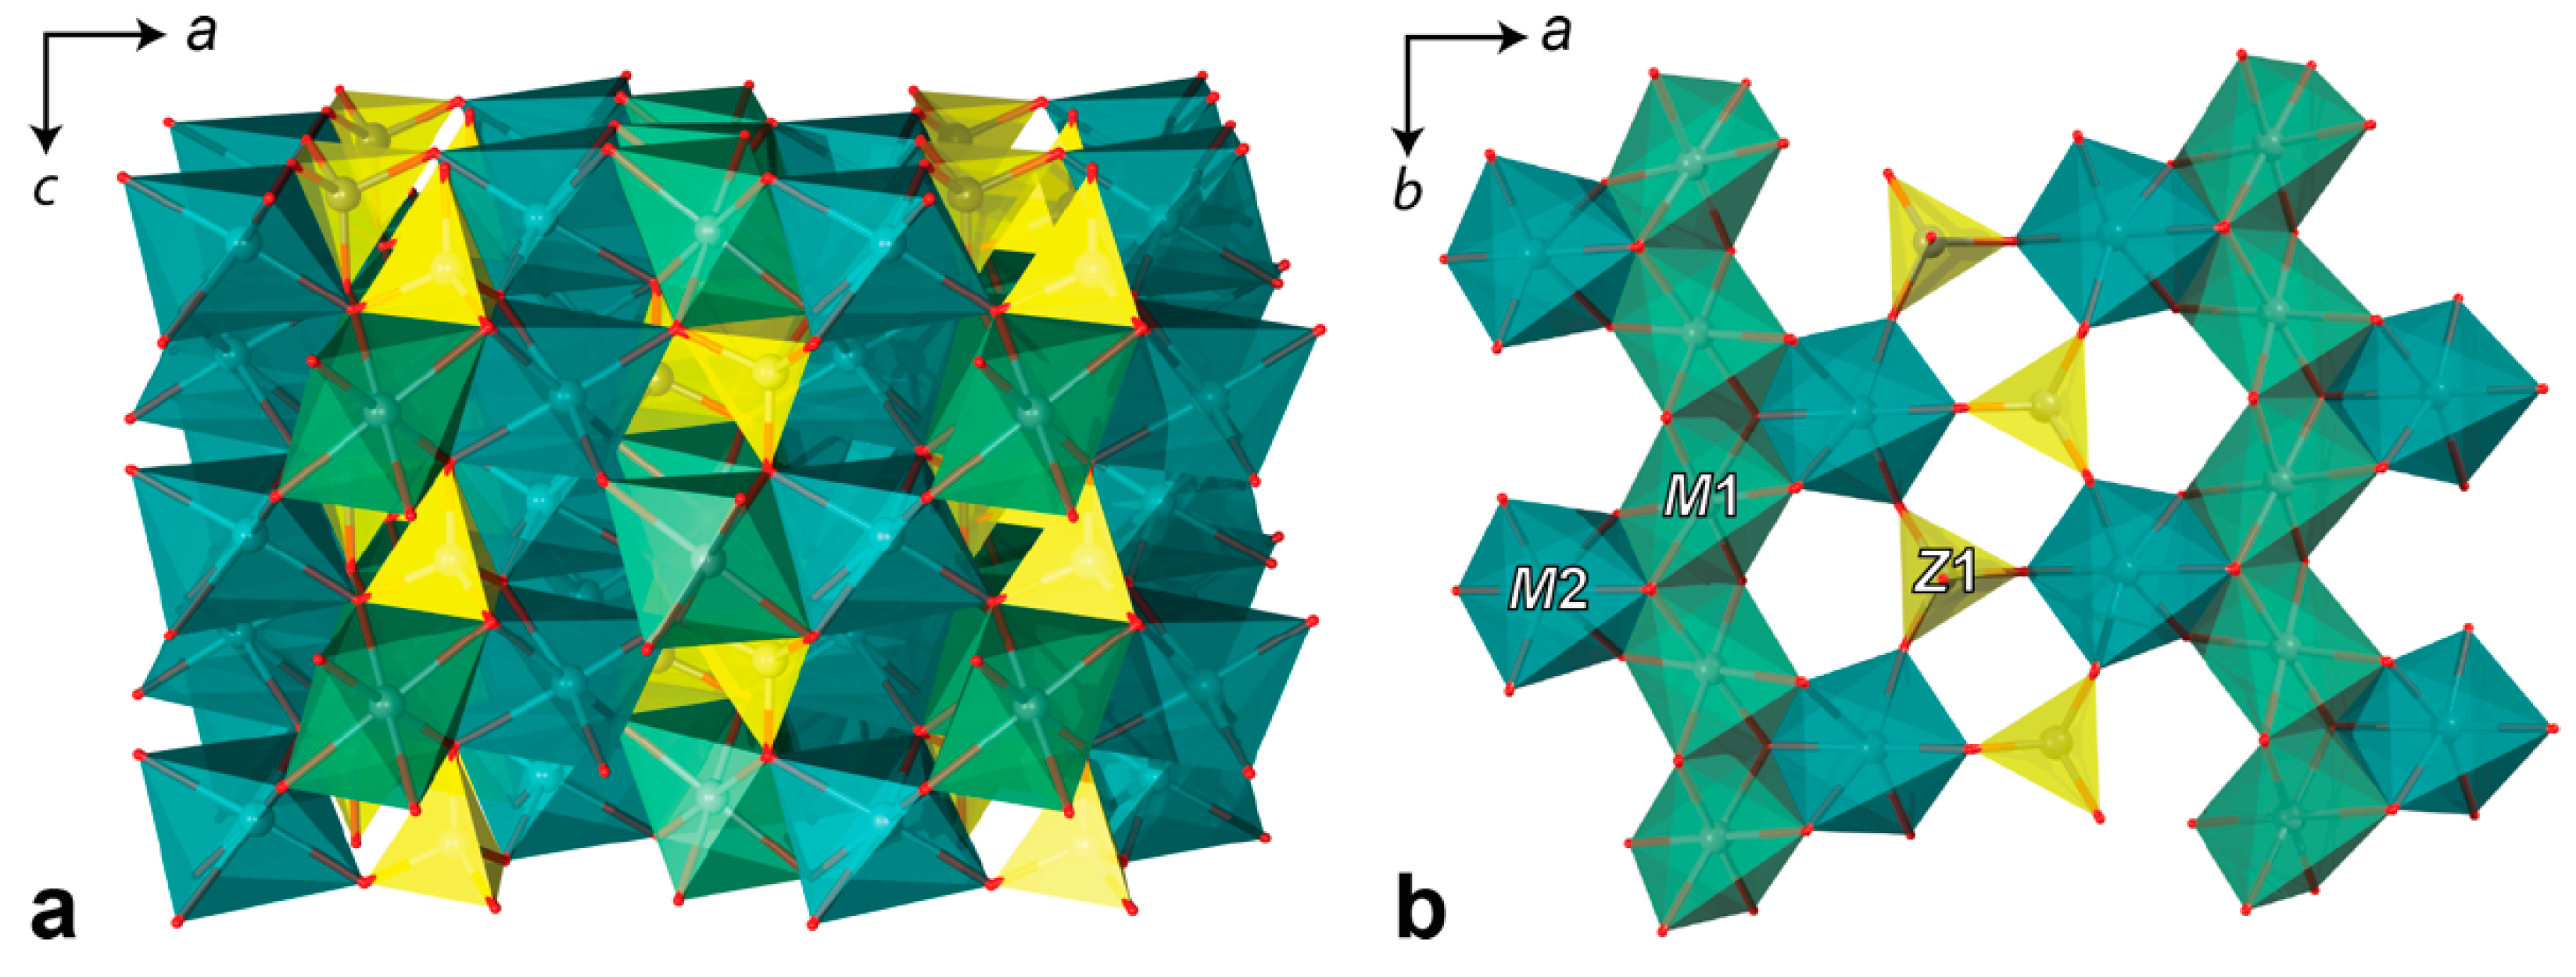
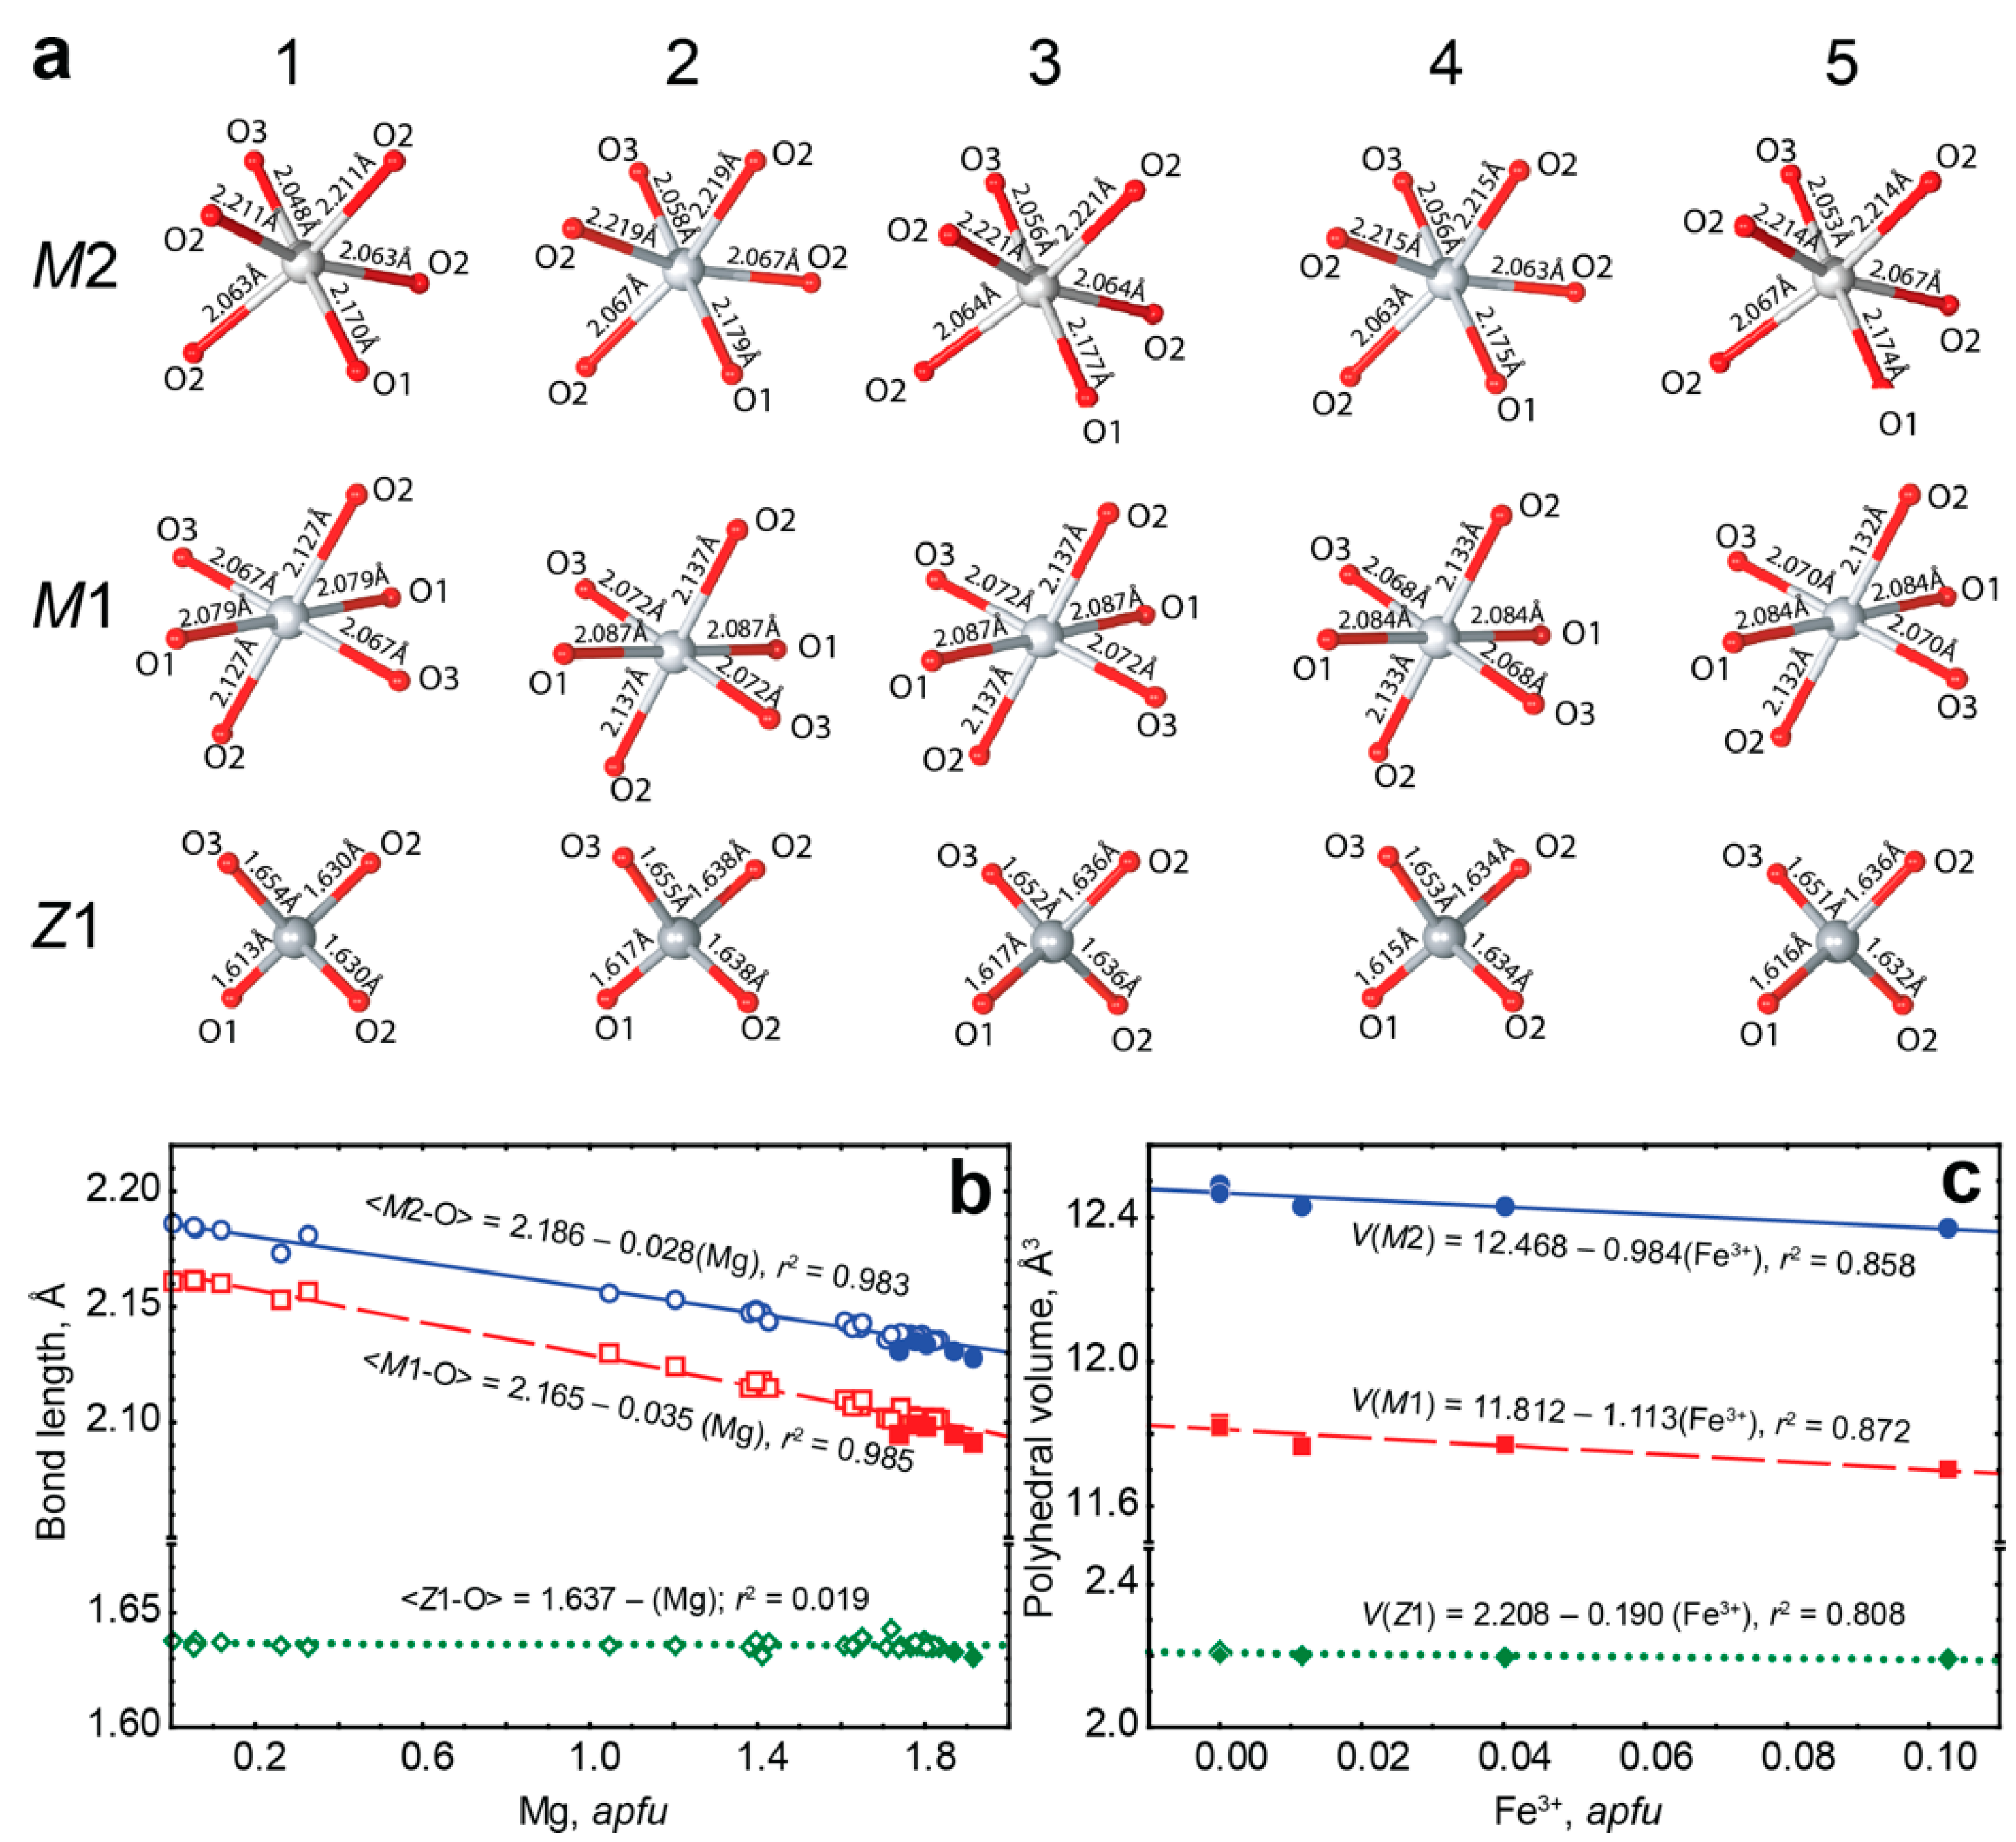
4.3. Single Crystal X-ray Diffraction

For the X-ray crystal study, we selected 5 forsterite crystals with various content of Mg, Fe2+ and Fe3+ from different zones of the phoscorite–carbonatite pipe (Table 5). The study details and crystallographic parameters obtained are shown in Table 6. Final atomic coordinates and isotropic displacement parameters selected interatomic distances and anisotropic displacement parameters are specified in the supplementary electronic materials (Tables S1–S20 in Supplementary Materials, CIF data available).
Forsterite crystal structure (Figure 10a) was firstly described by Bragg and Brown [50]. Ideally, it consists of a hexagonal close packing of oxygen atoms, where one-half of octahedral interstices is occupied by M1 and M2 sites and one-eighth of tetrahedral interstices is occupied by Z1 sites. This structure can be described as heteropolyhedral framework consisting of stacking of identical sheets parallel to the (001) plane. The sheets, in turn, are based upon chains of edge-sharing M1 octahedra with adjacent M2 octahedra connected by vertex-shared Z1 tetrahedra (Figure 10b).
There are few reports on non-equivalent distribution of magnesium and iron at octahedral M1 and M2 positions of the olivine-type structure [51,52,53,54]. This type of cation ordering does not reveal a correlation between cation distribution and genesis of the crystals, which is typical for amphiboles and pyroxenes [53,55,56]. In all forsterite analyzed, refined occupations of M1 and M2 sites provide domination of iron at the “large” M2 site (Table 7, Figure 11a). From the crystal-chemical point of view, the substitution M2Mg2+M2Fe2+ is more reasonable than M1Mg2+M1Fe2+ because the observed <M2-O> bond lengths of 2.128–2.135 Å are closer to ideal <Fe2+-O> distance of 2.180 Å [57] than to <M1-O> distances (2.091–2.099 Å). For the same reason, M1 site is theoretically more suitable for incorporation of Fe3+ (ideal <Fe3+-O> bond length is 2.045 Å).
The average <M-O> distances increase statistically irregularly with increasing content of Fe2+ (Figure 11b), which results in alignment of “small” M1 and “large” M2 octahedra in the Fo–Fa series (the average <M1-O> and <M2-O> distances are 2.094 and 2.130 Å correspondingly in forsterite, and 2.161 and 2.179 Å correspondingly in fayalite [58]). In case of sufficient difference between ionic radii of Mg2+ and incorporated elements [e.g., Fe3+ (−10.4%) or Mn2+(+15.3%)], trivalent iron occupies firstly “large” M2 site, and Mn2+ incorporates into “small” M1 site [59,60]. Since the most significant difference in sizes of M1 and M2 polyhedra is observed in forsterite Fo1.00–Fo0.8Fa0.2, incorporation of Fe3+ at the octahedral sites will have maximum impact on the M1 and M2 polyhedra volume in such forsterites.
In crystal structure of Kovdor’s forsterite, the average <Z1-O> distances range between 1.631–1.637 Å, and scattering factors of Z1 sites vary in the range of 13.30–14.00 electrons per formula unit, which is in good agreement with full occupation of Z1 site by Si atoms only (Figure 11a). Polyhedral volumes of Z1 tetrahedra are actually unchanged, and this fact does not confirm incorporation of Fe3+ into tetrahedral sites (Figure 11c). The polyhedral volume decreasing with growth of Fe3+ content in our samples confirms incorporation of trivalent iron into octahedral M1 and M2 sites via laihulite-like substitution (3Fe2+)oct ⟷ (2Fe3+ + □)oct. Unconstrained refinement of forsterites with significant amounts of Fe3+ (samples 1 and 5) with full occupancies of octahedral (M11.00, M21.00) sites results in significant underestimation of Fe content. This fact also proves presence of vacancies at octahedral sites only. Consequently, data of crystal structure refinement is in good agreement with factor analysis and chemical data. Presence of vacations at octahedral sites of partially “oxidized” olivine questions applicability of distribution coefficients KD and associated variables [53,65,66].

5. Discussion

We would like to express that forsterite from peridotite has an important feature—bimineral exsolution lamellae of magnetite and diopside (Figure 3b and Figure 12b). Such lamellae are not found in forsterite from phoscorite and carbonatites of the Kovdor alkaline-ultrabasic massif; but they are common in other (ultra)basic complexes where forsterite is enriched in Fe2+ and Ca [67,68]. In turn, Ca-rich forsterite crystallizes from melt with relatively low mg# value MgO/(MgO + FeO) and high contents of Ca and Na [69]. The fact that ultrabasic melt of the Kovdor massif was enriched in Ca is confirmed by co-crystallization of forsterite and diopside as well as by presence of numerous calcite inclusions (“drops”) within forsterite grains (Figure 12b). In addition, Сa-rich foidolite (Figure 2d) and melilitholite formed later than peridotites contain calcite “drops” inside grains of all the main minerals including nepheline [24]. Low value of mg# in this melt causes crystallization of titanomagnetite in interstices of olivine grains (Figure 3a) up to formation of magnetite-rich peridotite (see Figure 1) that have economic importance [9].
Alkaline melts have relatively higher Fe3+/(Fe3+ + Fe2+) ratio, then non-alkaline melts [70,71], and Fe3+ is partly included in forsterite. The rock cooling causes exsolution of Fe3+-rich forsterite into diopside and magnetite [72]:
3Fe3+4/3SiO4 + Fe2+2SiO4 + 4X2SiO4 → 2Fe3O4 + 4X2Si2O6, X = Ca, Mg, Fe.
The pyroxene phase acts as a sink for elements not compatible with the olivine structure, such as Ca. Pyroxene is formed as long as there is sufficient Ca present and the temperature is high enough for it to diffuse to the reaction front.
After crystallization of forsterite and diopside in peridotite, residual melt (melt-I) became comparatively rich in Si, Al, Na and K [21,73]. The melt-I emplaced into contact zone between peridotite stock and host gneisses and formed ring of foidolite and melilitolite. The next residual melt-II contained insignificant amount of Si (and Mg), but it was strongly enriched in Fe, Ca, C, P, F and also Nb, Zr, REE, Th and U. So, it was a real residual melt that was not caused by liquid immiscibility, because «ore-bearing rare metal carbonatites that are found in association with ultramafic and alkaline silicate rocks are likely to have formed from a residual liquid after extensive fractional crystallization of carbonated silicate magma rather than by silicate–carbonate liquid immiscibility» [74]. The possible existence of carbonatite magmas was experimentally confirmed in the system CaO-CO2-H2O by Wyllie and Tuttle [75]. There were discovered the liquid immiscibility between albite-rich silicate and sodium carbonate-rich liquids [76,77], between ijolitic and alkali carbonatitic liquids in experiments on whole-rock compositions [78], and between alkali-poor silicate and carbonate liquids in the system albite/anorthite-calcite [79,80]. Studies in NaA1Si3O8-NaA1SiO4-CaCO3-H2O system by [81] and in Mg2SiO4-CaCO3-Ca(OH)2 system by [82,83] indicated that carbonatite magmas could be produced by crystal fractionation of silicate magmas of appropriate compositions (for example, SiO2-undersaturated alkalic liquids with H2O and CO2). For other compositions, this is precluded by the presence of thermal barriers between high-temperature liquids precipitating silicates, and low-temperature liquids precipitating carbonates and hydrous minerals [82,83]. Reasons of phosphorus concentration in the residual melt-II include enrichment of the melt in Fe3+ with further formation of stable complex Fe3+(PO4)3− [84,85] as well as high content of Ca and Mg forming stable complexes (Ca, Mg)–PO4 [86]. We believe that residual melt-II intruded into the foidolite–peridotite contact, and rapidly crystallized from the pipe walls towards its axial zone due to both cooling and blast-like degassing [24]. On this reason, hydroxylapatite co-crystallized with forsterite contains numerous liquid-vapor inclusions [87].
The crystallization of phoscorite–carbonatite rock series can be considered in systems that are extensions of well-studied CaO-CO2-H2O [75]. The crystallization of apatite from low-temperature melts in CaO-CaF2-P2O5-H2O and CaO-P2O5-CO2-H2O systems was investigated by Biggar [88]. There is a large field for the primary crystallization of apatite in the ternary systems Ca3(PO4)2-CaF2-Ca(OH)2 and Ca3(PO4)-CaCO3-Ca(OH)2, and the liquid precipitating the apatite persists down to 675 °C and 654 °C at the respective ternary eutectics [89]. Addition of other components to the system CaO-CO2-H2O produces suitable conditions for the crystallization of other calcium-bearing minerals from low-temperature liquids in the presence of an aqueous vapor phase. Fields for the crystallization of hydrated and carbonated calcium silicates are found in the system CaO-SiO2-CO2-H2O [90].
According to Moussallam et al. [91], silica and carbonate form two separate subnetworks. Phosphorus in silicate melts also forms separate clusters that confine iron within stable complexes Fe3+(PO4) [86]. It seems likely that structure of the phoscorite melt was constituted by interconnected subnetworks of SiO4-tetrahedra and CO3-triangles with local domains of PO4-tetrahedra and Fe3+(PO4)-clusters, without a liquid immiscibility [92]. Interaction of this melt with silicate rock launched forsterite crystallization, sometimes with grains of primary “peridotitic” forsterite as seed crystals (Figure 12a). Exponential distribution of forsterite grain size (see Figure 5) shows slower diffusion rates of magnesium and silica, which seems to be the main factor of size-independent (constant) crystal growth [93]. At the contact with the carbonates (predominantly calcite), forsterite grains of phoscorite and phoscorite-related carbonatite became larger (see Figure 4b) and well-shaped (see Figure 3h) due to collective recrystallization. Similar processes are typical for magnetite [12].
Crystallization of forsterite from residual melt-II near the pipe wall and top resulted in depletion of the melt in Mg, which launched apatite precipitation with the melt cooling. In turn, formation of apatite destroyed Fe3+(PO4)-complexes and launched magnetite crystallization. Consequently, crystallization front moved rapidly from the pipe wall towards its axis accompanied by separation of volatiles. This process resulted in concentration of residual carbonate melt-III in the pipe axial zone.
Carbonate melts are low-viscous and remain interconnected up to 0.05 wt % melt [94]. In addition, silicate melt selectively wets the grain-edge channels between solid phases, excluding the carbonate melt to the center of melt pockets, away from grain edges [95]. These features of carbonate melts enable us to understand why forsterite grains can crystallize from carbonate-rich melt according to low-rate diffusion mechanism, and why they obtain predominant orientation in carbonate melt flow (see Figure 5).
Water solubility in carbonate melts is significantly higher than in alkaline silicate melts, reaching values of nearly 15 wt % at 100 MPa and 900 °C [96]. The depth of −200 to −400 m is probably the interval of separation of water, CO2, F and other volatiles from phoscorite–carbonatite melt. These volatiles reacted with early crystallized phoscorites and phoscorite-related carbonatites in the pipe axial zone, with formation of later water/fluor-containing apo-forsterite minerals (phlogopite, clinochlore, clinohumite, etc.—see Figure 6). The final products of this process were staffelite breccias (fragments of altered phoscorite and carbonatites cemented by colloform carbonate-rich fluorapatite) filling several funnels in apical part of the phoscorite–carbonatite pipe axial zone [24,97].

6. Conclusions

Three-D mineralogical mapping was used to establish spatial distribution of forsterite content, morphology, grain size, composition and alteration products within the Kovdor phoscorite–carbonatite pipe. This work pursues our study of “through minerals” of the Kovdor complex and enables us to make some interesting conclusions:
(1)
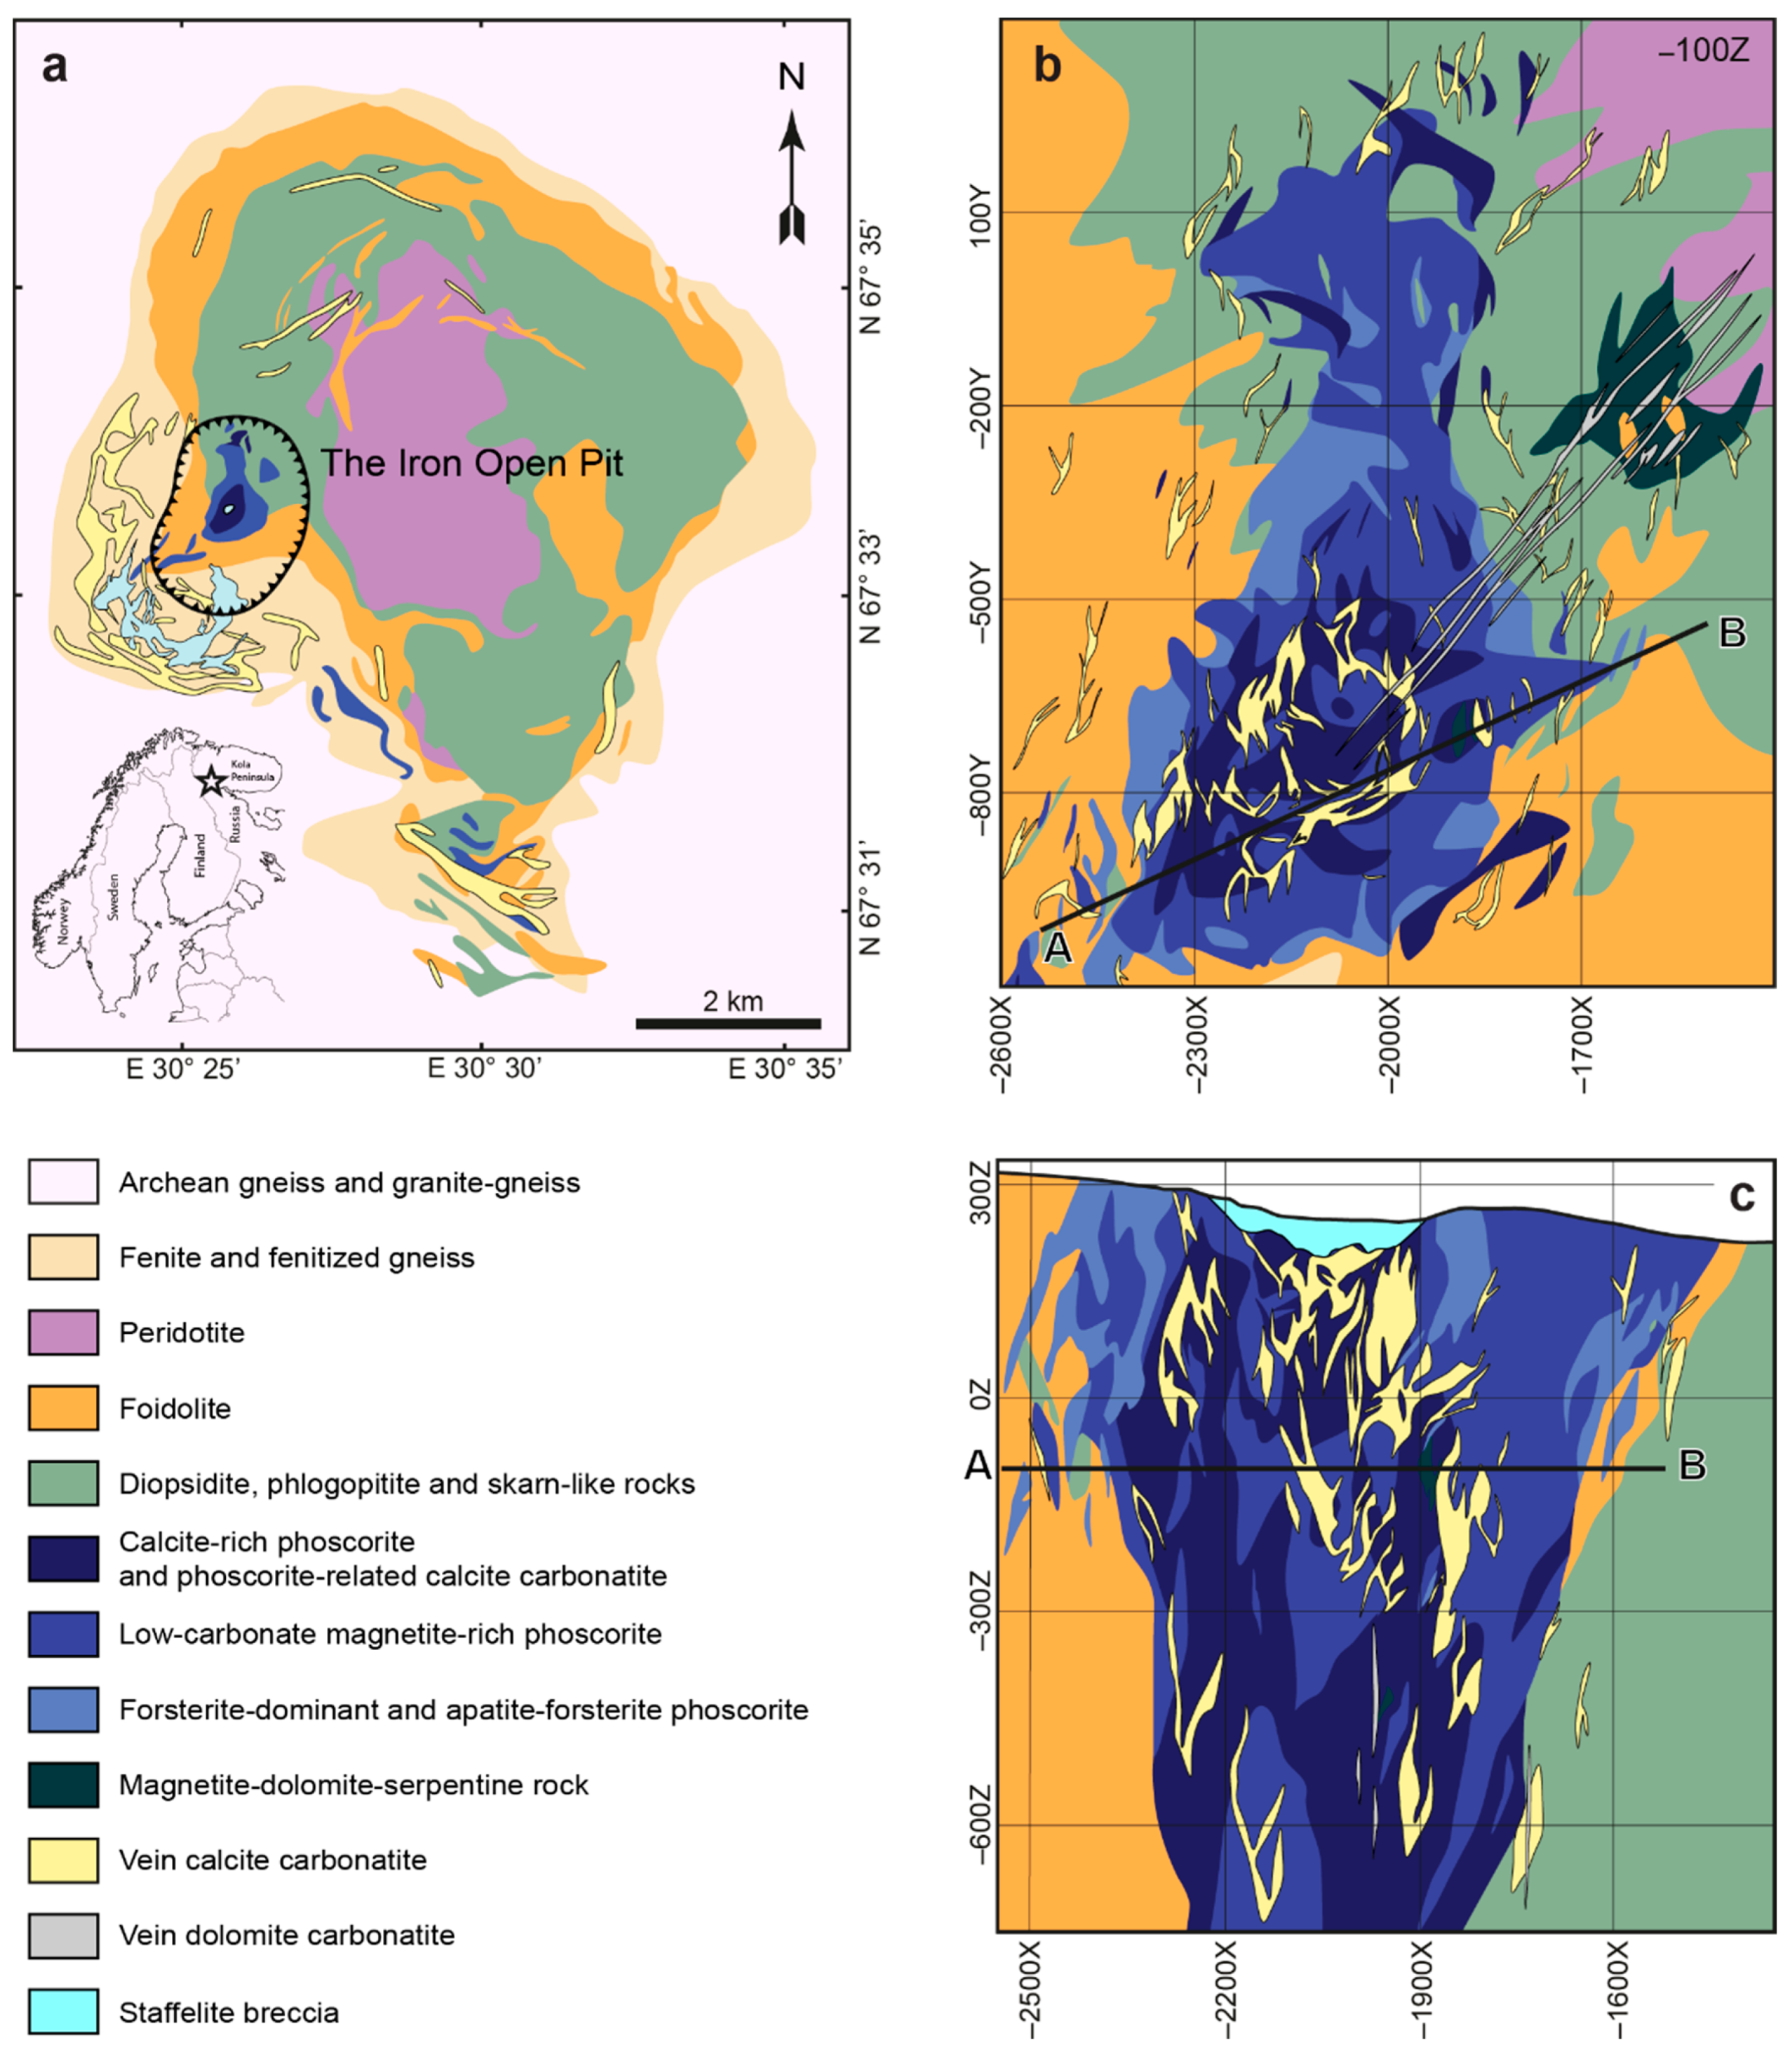
Forsterite is the earliest mineral of both peridotite and phoscorite–carbonatite complexes, and its crystallization governed the further evolution of corresponding magmatic systems. Thus, crystallization of forsterite from the Ca-Fe-rich peridotite melt produces Si-Al-Na-K-rich residual melt-I corresponding to foidolite–melilitolite. In turn, consolidation of foidolite and melilitolite produced Fe-Ca-C-P-F-rich residual melt-II that emplaced in silicate rocks as the phoscorite–carbonatite pipe. Phoscorite crystallization started from forsterite, which launched destruction of silicate-carbonate-ferriphosphate subnetworks of the melt followed by precipitation of apatite and magnetite from the pipe wall to its axis with formation of carbonatite melt-III in the pipe axial zone;
(2)
Growth of forsterite grains from phoscorite–carbonatite melt was diffusion-limited, which causes constant growth rate of each grain and exponential distribution of grain size;
(3)
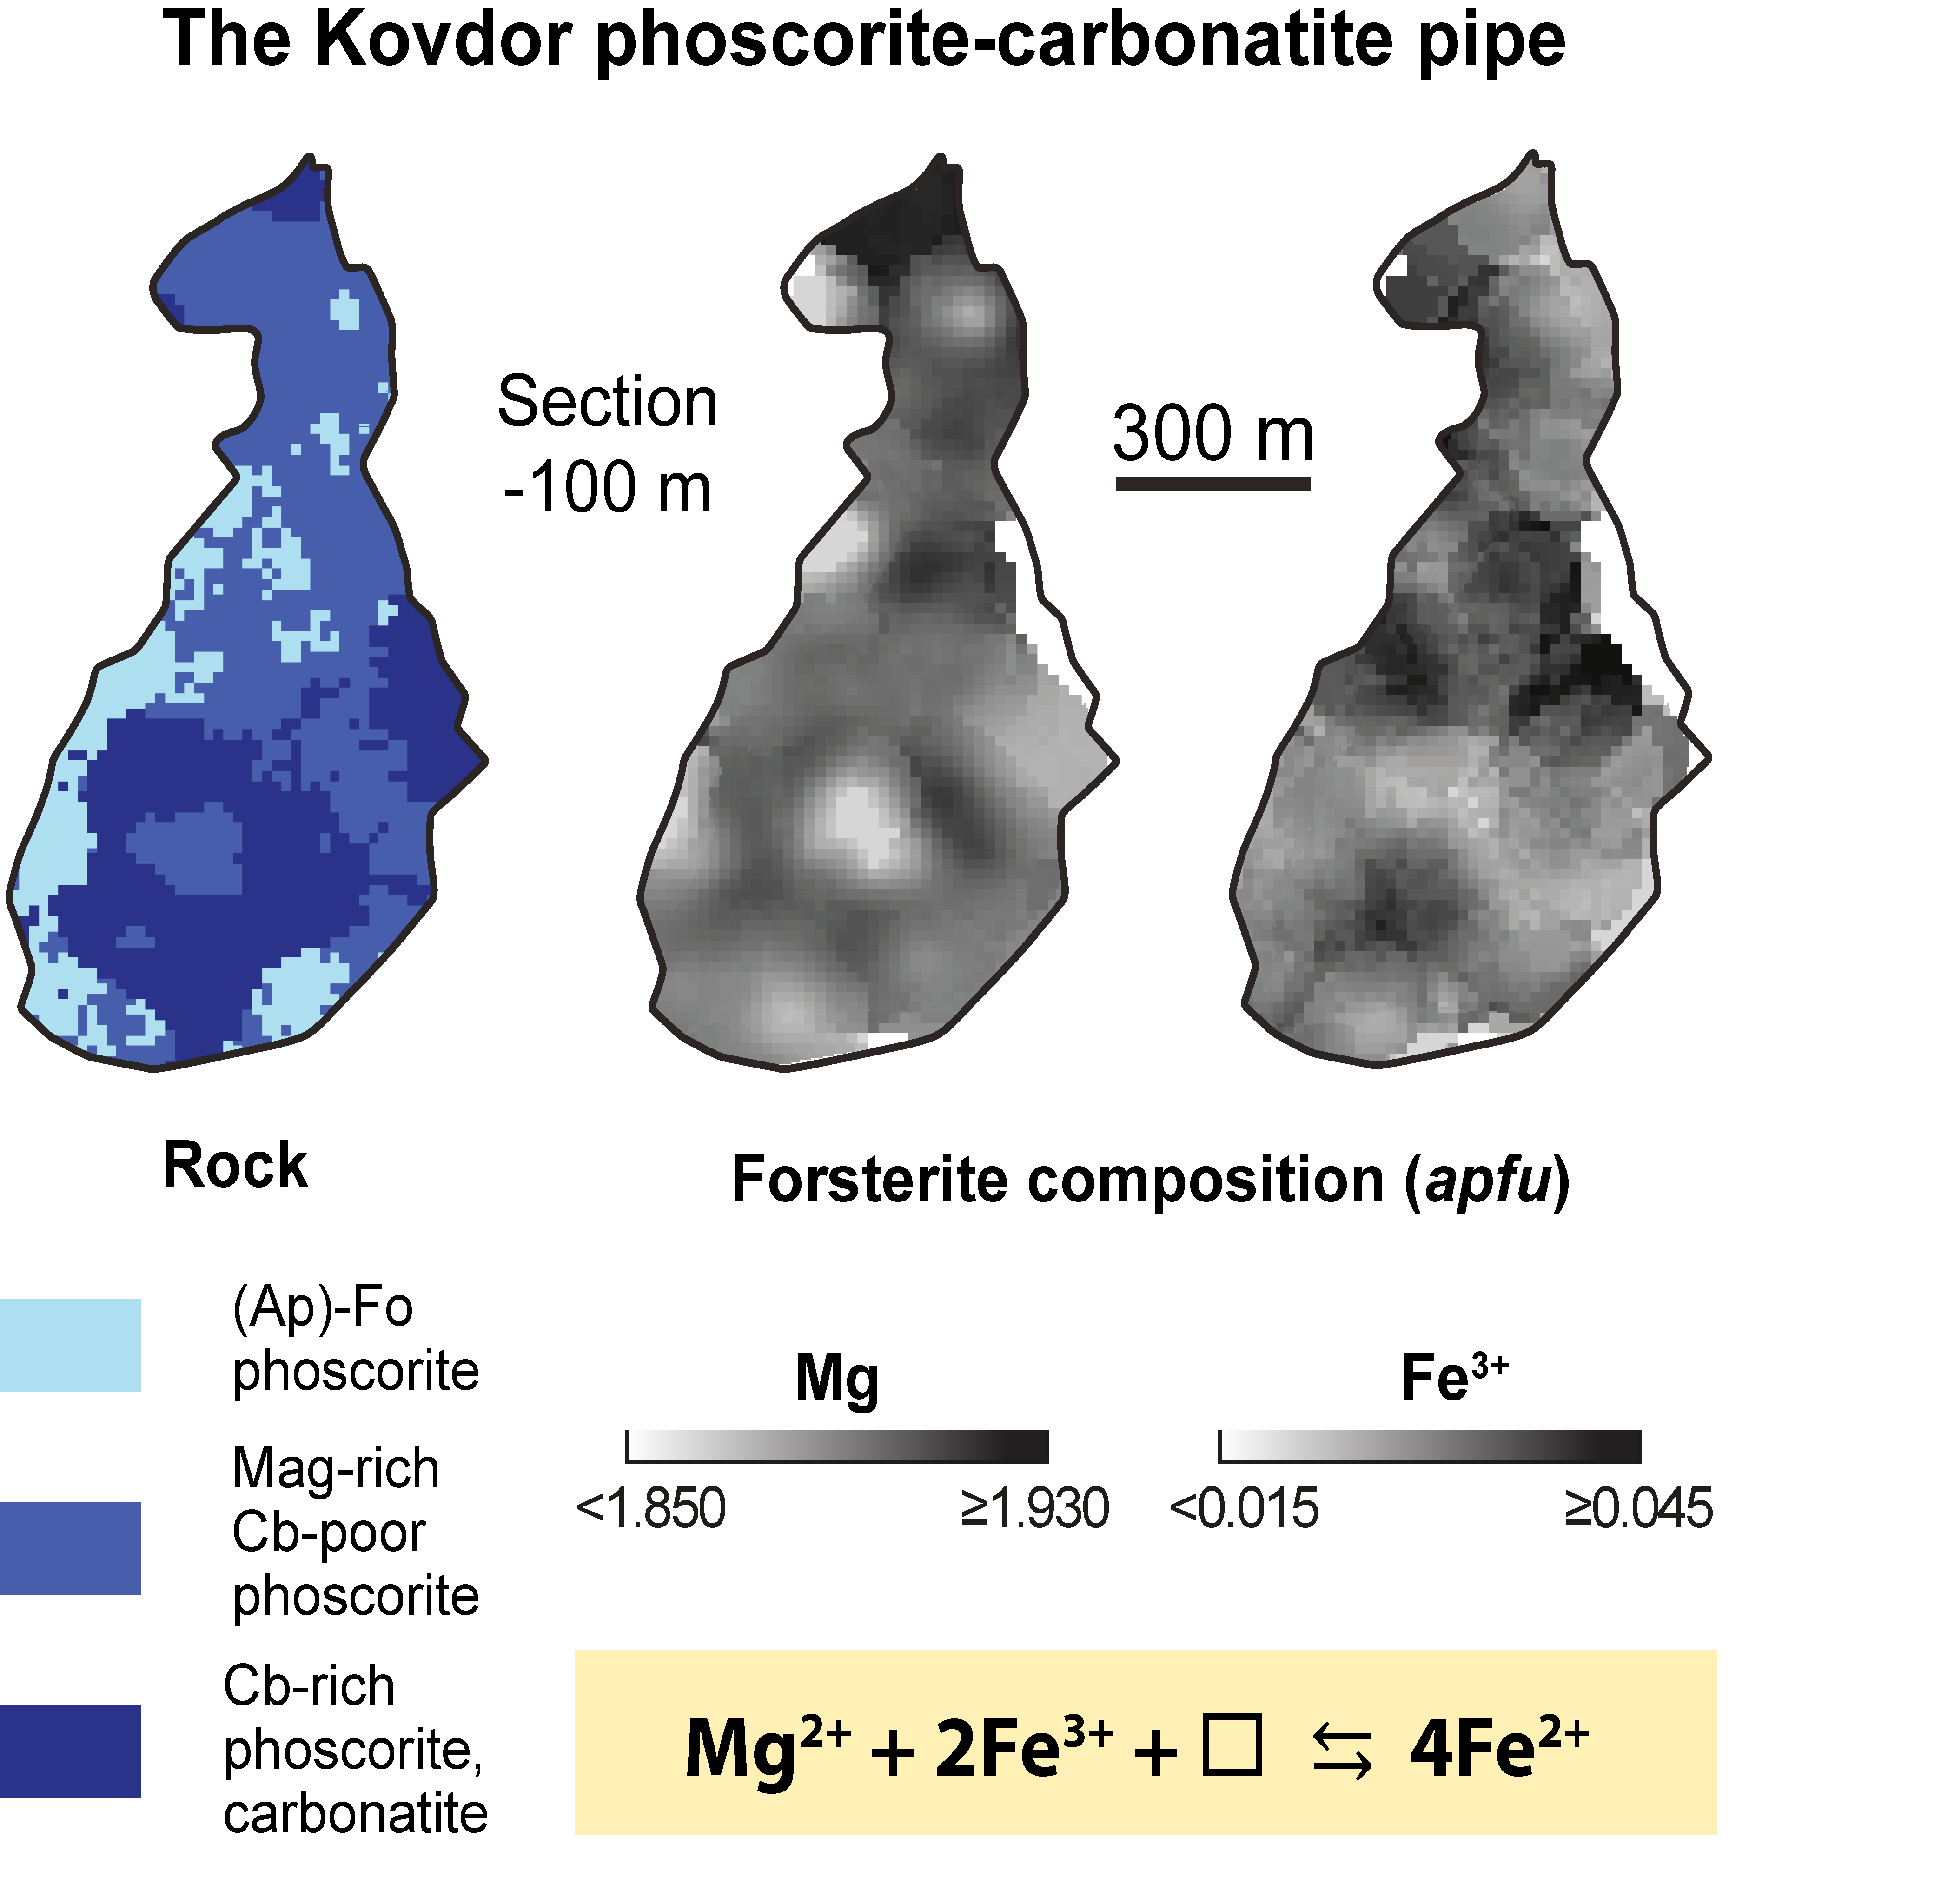
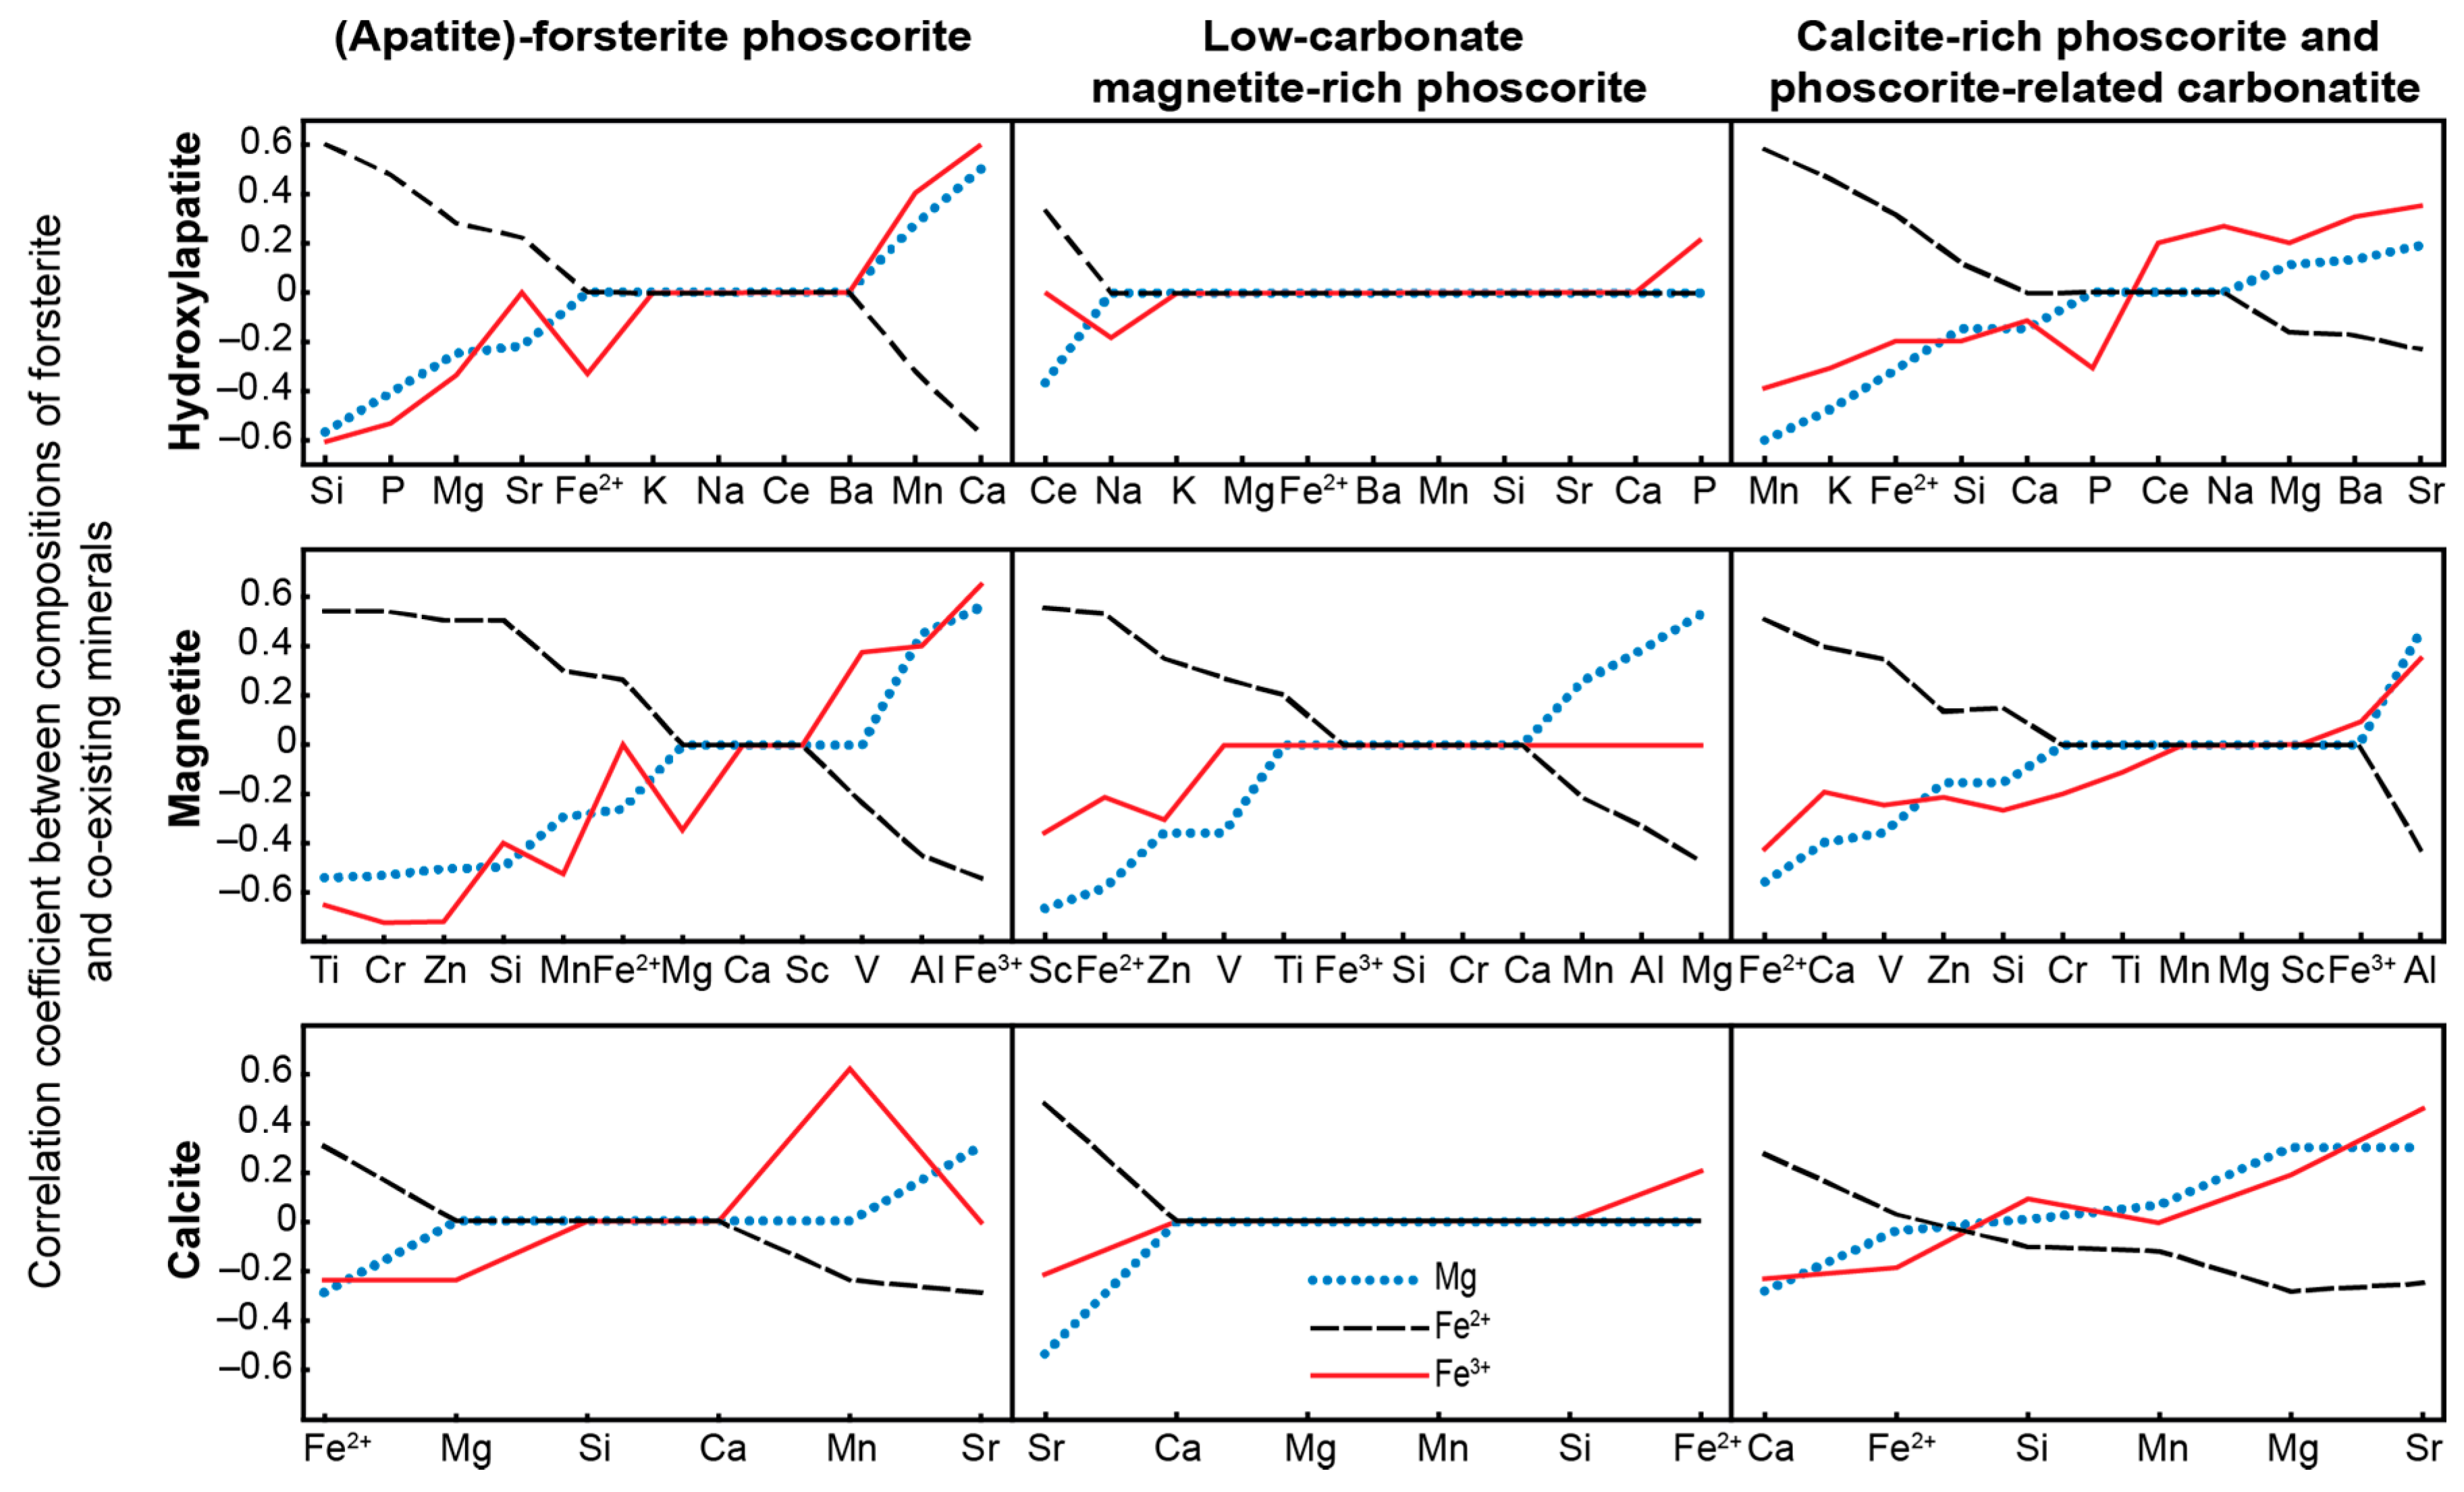
Chemical composition of forsterite in phoscorite–carbonatite pipe is determined by two schemas of isomorphism: Mg2+ + 2Fe3+ ⟷ 4(Fe, Mn)2+ and Mg2+ + 2Fe3+ ⟷ 2(Fe, Mn, Ni)2+ + Ti4+. Marginal forsterite-rich phoscorite consists of Fe2+-Mn-Ni-Ti-rich forsterite similar to olivine from peridotite, intermediate low-carbonate magnetie-rich phoscorite includes Mg-Fe3+-rich forsterite, and axial carbonate-rich phoscorite and carbonatites contain Fe2+-Mn-rich forsterite;
(4)
Trivalent iron incorporates into forsterite by scheme (3Fe2+)oct → 2Fe3+ + (□)oct that reflects redox conditions of the rock formation causing significant agreement between compositions of apatite, magnetite, calcite and forsterite;
(5)
Incorporation of trivalent iron at the octahedral M1 and M2 sites decreases the volume of these polyhedra, while volume of tetrahedral set does not change. Thus, the assumed substitution (4Fe2+)oct + (4Si4+)tet → (4Fe3+)oct + (3Si4+ + □)tet proposed by D. E. Janney and J. F. Banfield [49] was not confirmed. Our data show that laihunite-like isomorphism is more common in forsterite than it was considered to be.

Supplementary Materials

The following are available online at https://www.mdpi.com/2075-163X/8/6/260/s1, Table S1: Fractional atomic coordinates (×104) and equivalent isotropic displacement parameters (Å2 × 10³) for Forsterite_1. Table S2: Anisotropic displacement parameters (Å2 × 10³) for Forsterite_1. Table S3: Bond lengths for Forsterite_1, Table S4: Atomic occupancy for Forsterite_1. Table S5: Fractional atomic coordinates (×104) and equivalent isotropic displacement parameters (Å2 × 10³) for Forsterite_2. Table S6: Anisotropic displacement parameters (Å2 × 10³) for Forsterite_2. Table S7: Bond lengths for Forsterite_2, Table S8: Atomic occupancy for Forsterite_2, Table S9: Fractional atomic coordinates (×104) and equivalent isotropic displacement parameters (Å2 × 10³) for Forsterite_3. Table S10: Anisotropic displacement parameters (Å2 × 10³) for Forsterite_3. Table S11: Bond lengths for Forsterite_3, Table S12: Atomic occupancy for Forsterite_3, Table S13: Fractional atomic coordinates (×104) and equivalent isotropic displacement parameters (Å2 × 10³) for Forsterite_4. Table S14: Anisotropic displacement parameters (Å2 × 10³) for Forsterite_4. Table S15: Bond lengths for Forsterite_4, Table S16: Atomic occupancy for Forsterite_4, Table S17: Fractional atomic coordinates (×104) and equivalent isotropic displacement parameters (Å2 × 10³) for Forsterite_5. Table S18: Anisotropic displacement parameters (Å2 × 10³) for Forsterite_5. Table S19: Bond lengths for Forsterite_5, Table S20: Atomic occupancy for Forsterite_5.

Author Contributions

J.A.M. designed the experiments, carried out petrographical investigations and crystal size distribution analyses, and wrote the manuscript. G.Y.I. designed the experiments, performed statistical investigations, and reviewed the manuscript. A.O.K. performed geostatistical investigation, drew maps and took samples. Y.A.P. and A.V.B. took BSE images and performed electron microscope investigations. T.L.P. performed crystallographic investigations and formulated crystal-chemical conclusions. V.N.Y. and N.G.K. conceived of the work, took and prepared samples. P.M.G. drew maps. All authors discussed the manuscript.

Funding

The research is supported by the Russian Science Foundation, grant 16-17-10173.

Acknowledgments

Samples were taken during exploration of deep levels of the Kovdor deposit implemented by JSC Kovdorskiy GOK in 2007–11. X-ray crystal studies were carried out with the equipment provided by the X-ray Diffraction Centre of Saint-Petersburg State University. The comments by anonymous reviewers helped us to significantly improve this paper.

Conflicts of Interest

The authors declare no conflict of interest. The founding sponsors had no role in the design of the study; in the collection, analyses, or interpretation of data; in the writing of the manuscript, and in the decision to publish the results.

References

  1. Igneous Rocks. A Classification and Glossary of Terms. Recommendations of the International Union of Geological Sciences Subcommission on the Systematics of Igneous Rocks; Le Maitre, R.W., Ed.; Cambridge University Press: New York, NY, USA, 2002; ISBN 9780521662154. [Google Scholar]
  2. Jaireth, S.; Hoatson, D.M.; Miezitis, Y. Geological setting and resources of the major rare-earth-element deposits in Australia. Ore Geol. Rev. 2014, 62, 72–128. [Google Scholar] [CrossRef]
  3. Lazareva, E.V.; Zhmodik, S.M.; Dobretsov, N.L.; Tolstov, A.V.; Shcherbov, B.L.; Karmanov, N.S.; Gerasimov, E.Y.; Bryanskaya, A.V. Main minerals of abnormally high-grade ores of the Tomtor deposit (Arctic Siberia). Russ. Geol. Geophys. 2015, 56, 844–873. [Google Scholar] [CrossRef]
  4. Liu, Y.-L.; Ling, M.-X.; Williams, I.S.; Yang, X.-Y.; Wang, C.Y.; Sun, W. The formation of the giant Bayan Obo REE-Nb-Fe deposit, North China, Mesoproterozoic carbonatite and overprinted Paleozoic dolomitization. Ore Geol. Rev. 2018, 92, 73–83. [Google Scholar] [CrossRef]
  5. Mackay, D.A.R.; Simandl, G.J. Geology, market and supply chain of niobium and tantalum—A review. Miner. Depos. 2014, 49, 1025–1047. [Google Scholar] [CrossRef]
  6. Mitchell, R.H. Primary and secondary niobium mineral deposits associated with carbonatites. Ore Geol. Rev. 2015, 64, 626–641. [Google Scholar] [CrossRef]
  7. Smith, M.P.; Moore, K.; Kavecsánszki, D.; Finch, A.A.; Kynicky, J.; Wall, F. From mantle to critical zone: A review of large and giant sized deposits of the rare earth elements. Geosci. Front. 2016. [Google Scholar] [CrossRef] [Green Version]
  8. Wall, F.; Zaitsev, A.N. (Eds.) Phoscorites and Carbonatites from Mantle to Mine: The Key Example of the Kola Alkaline Province; Mineralogical Society: London, UK, 2004. [Google Scholar]
  9. Ivanyuk, G.Y.; Yakovenchuk, V.N.; Pakhomovsky, Y.A. Kovdor; Laplandia Minerals: Apatity, Russia, 2002; ISBN 5900395413. [Google Scholar]
  10. Mikhailova, J.A.; Kalashnikov, A.O.; Sokharev, V.A.; Pakhomovsky, Y.A.; Konopleva, N.G.; Yakovenchuk, V.N.; Bazai, A.V.; Goryainov, P.M.; Ivanyuk, G.Y. 3D mineralogical mapping of the Kovdor phoscorite–carbonatite complex (Russia). Miner. Depos. 2016, 51, 131–149. [Google Scholar] [CrossRef]
  11. Ivanyuk, G.Y.; Kalashnikov, A.O.; Pakhomovsky, Y.A.; Mikhailova, J.A.; Yakovenchuk, V.N.; Konopleva, N.G.; Sokharev, V.A.; Bazai, A.V.; Goryainov, P.M. Economic minerals of the Kovdor baddeleyite-apatite-magnetite deposit, Russia: Mineralogy, spatial distribution and ore processing optimization. Ore Geol. Rev. 2016, 77, 279–311. [Google Scholar] [CrossRef]
  12. Ivanyuk, G.Y.; Kalashnikov, A.O.; Pakhomovsky, Y.A.; Bazai, A.V.; Goryainov, P.M.; Mikhailova, J.A.; Yakovenchuk, V.N.; Konopleva, N.G. Subsolidus Evolution of the Magnetite-Spinel-Ulvöspinel Solid Solutions in the Kovdor phoscorite–carbonatite Complex, NW Russia. Minerals 2017, 7, 215. [Google Scholar] [CrossRef]
  13. Kalashnikov, A.O.; Yakovenchuk, V.N.; Pakhomovsky, Y.A.; Bazai, A.V.; Sokharev, V.A.; Konopleva, N.G.; Mikhailova, J.A.; Goryainov, P.M.; Ivanyuk, G.Y. Scandium of the Kovdor baddeleyite–apatite–magnetite deposit (Murmansk Region, Russia): Mineralogy, spatial distribution, and potential resource. Ore Geol. Rev. 2016, 72, 532–537. [Google Scholar] [CrossRef]
  14. Bell, K.; Kjarsgaard, B.A.; Simonetti, A. Carbonatites—Into the Twenty-First Century. J. Petrol. 1998, 39, 1839–1845. [Google Scholar] [CrossRef]
  15. Gittins, J.; Harmer, R.E.; Barker, D.S. The bimodal composition of carbonatites: Reality or misconception? Lithos 2005, 85, 129–139. [Google Scholar] [CrossRef]
  16. Mitchell, R.H. Carbonatites and carbonatites and carbonatites. Can. Mineral. 2005, 43, 2049–2068. [Google Scholar] [CrossRef]
  17. Woolley, A.R.; Kjarsgaard, B.A. Paragenetic types of carbonatite as indicated by the diversity and relative abundances of associated silicate rocks: Evidence from a global database. Can. Mineral. 2008, 46, 741–752. [Google Scholar] [CrossRef]
  18. Woolley, A.R.; Bailey, D.K. The crucial role of lithospheric structure in the generation and release of carbonatites: Geological evidence. Mineral. Mag. 2012, 76, 259–270. [Google Scholar] [CrossRef]
  19. Jones, A.P.; Genge, M.; Carmody, L. Carbonate Melts and Carbonatites. Rev. Mineral. Geochem. 2013, 75, 289–322. [Google Scholar] [CrossRef] [Green Version]
  20. Russell, H.D.; Hiemstra, S.A.; Groeneveld, D. The mineralogy and petrology of the Carbonatite at Loolekop, Eastern Transvaal. S. Afr. J. Geol. 1954, 57, 197–208. [Google Scholar]
  21. Kukharenko, A.A.; Orlova, M.P.; Bulakh, A.G.; Bagdasarov, E.A.; Rimskaya-Korsakova, O.M.; Nefedov, E.I.; Ilyinsky, G.A.; Sergeev, A.S.; Abakumova, N.B. Caledonian Complex of Ultrabasic, Alkaline Rocks and Carbonatites of Kola Peninsula and Northern Karelia (Geology, Petrology, Mineralogy and Geochemistry) (in Russian); Nedra: Moscow, Russia, 1965. [Google Scholar]
  22. Yegorov, L.S. Phoscorites of the Maymecha-Kotuy ijolite-carbonatite association. Int. Geol. Rev. 1993, 35, 346–358. [Google Scholar] [CrossRef]
  23. Rimskaya-Korsakova, O.M. On Question about Genesis of the Kovdor Iron-Ore Deposit. In Problems of Magmatism and Metamorphism (in Russian); Leningrad State University Publishing: Leningrad, Russia, 1963; pp. 125–142. [Google Scholar]
  24. Kalashnikov, A.O.; Ivanyuk, G.Y.; Mikhailova, J.A.; Sokharev, V.A. Approach of automatic 3D geological mapping: The case of the Kovdor phoscorite–carbonatite complex, NW Russia. Sci. Rep. 2017, 7, 1–13. [Google Scholar] [CrossRef] [PubMed]
  25. Ternovoy, V.I. Carbonatite Massifs and Their Mineral Resources (in Russian); Leningrad State University: Leningrad, Russia, 1977. [Google Scholar]
  26. Afanasyev, B. Mineral Resources of Alkaline-Ultrabasic Massifs of the Kola Peninsula (in Russian); Roza Vetrov Publishing: Saint-Petersburg, Russia, 2011. [Google Scholar]
  27. Dunaev, V.A. Structure of the Kovdor deposit (in Russian). Geol. Ore Depos. 1982, 3, 28–36. [Google Scholar]
  28. Kapustin, Y.L. Mineralogy of Carbonatites; Amerind Publishing: New Delhi, India, 1980. [Google Scholar]
  29. Krasnova, N.I.; Kopylova, L.N. The Geologic Basis for Mineral-Technological Mapping at the Kovdor Ore Deposit. Int. Geol. Rev. 1988, 30, 307–319. [Google Scholar] [CrossRef]
  30. Krasnova, N.I.; Petrov, T.G.; Balaganskaya, E.G.; García, D.; Moutte, J.; Zaitsev, A.N.; Wall, F. Introduction to phoscorites: Occurrence, composition, nomenclature and petrogenesis. In Phoscorites and Carbonatites from Mantle to Mine: The Key Example of the Kola Alkaline Province; Zaitsev, A.N., Wall, F., Eds.; Mineralogical Society: London, UK, 2004; pp. 43–72. ISBN 0-903056-22-4. [Google Scholar]
  31. Bayanova, T.B.; Kirnarsky, Y.M.; Levkovich, N.V. U-Pb dating of baddeleyite from Kovdor massif (in Russian). Dokl. Earth Sci. 1997, 356, 509–511. [Google Scholar]
  32. Amelin, Y.; Zaitsev, A.N. Precise geochronology of phoscorites and carbonatites: The critical role of U-series disequilibrium in age interpretations. Geochim. Cosmochim. Acta 2002, 66, 2399–2419. [Google Scholar] [CrossRef]
  33. Rodionov, N.V.; Belyatsky, B.V.; Antonov, A.V.; Kapitonov, I.N.; Sergeev, S.A. Comparative in-situ U–Th–Pb geochronology and trace element composition of baddeleyite and low-U zircon from carbonatites of the Palaeozoic Kovdor alkaline–ultramafic complex, Kola Peninsula, Russia. Gondwana Res. 2012, 21, 728–744. [Google Scholar] [CrossRef]
  34. Rimskaya-Korsakova, O.M.; Krasnova, N.I. Geology of Deposits of the Kovdor Massif (in Russian); St. Petersburg University Press: Saint Petersburg, Russia, 2002. [Google Scholar]
  35. Shats, L.; Sorokina, I.; Kalinkin, M.; Kornyushin, A. Report on Geophysical Works Made by the Kovdor Geological Party in the Area of Kovdor in 1966 (in Russian); Archives of the Natural Reserves Department of the Murmansk region: Apatity, Russia, 1967. [Google Scholar]
  36. ImageJ, Open Source Image Processing Software. Available online: http://imagej.net/ (accessed on 19 June 2018).
  37. Sheldrick, G.M. A short history of SHELX. Acta Crystallogr. Sect. A Found. Crystallogr. 2008, 64, 112–122. [Google Scholar] [CrossRef] [PubMed]
  38. Dolomanov, O.V.; Bourhis, L.J.; Gildea, R.J.; Howard, J.A.K.; Puschmann, H. OLEX2: A complete structure solution, refinement and analysis program. J. Appl. Crystallogr. 2009, 42, 339–341. [Google Scholar] [CrossRef]
  39. Agilent CrysAlis PRO. 2014. Available online: https://www.rigaku.com/en/products/smc/crysalis (accessed on 19 June 2018).
  40. Momma, K.; Izumi, F. VESTA 3 for three-dimensional visualization of crystal, volumetric and morphology data. J. Appl. Crystallogr. 2011, 44, 1272–1276. [Google Scholar] [CrossRef]
  41. Putz, H.; Brandenburg, K. Diamond–Crystal and Molecular Structure Visualization; Crystal Impact GbR: Bonn, Germany, 2012. [Google Scholar]
  42. Dolivo-Dobrovolsky, D.D. MINAL, Free Software. Available online: http://www.dimadd.ru (accessed on 8 July 2013).
  43. StatSoft Inc, Statistica 8. Available online: www.statsoft.ru (accessed on 19 June 2018).
  44. TableCurve 2D. Available online: www.sigmaplot.co.uk/products/tablecurve2d/tablecurve2d.php (accessed on 19 June 2018).
  45. Micromine Pty Ltd. Micromine 16.1. Available online: https://www.micromine.com/ (accessed on 19 June 2018).
  46. Veksler, I.V.; Nielsen, T.F.D.; Sokolov, S.V. Mineralogy of Crystallized Melt Inclusions from Gardiner and Kovdor Ultramafic Alkaline Complexes: Implications for Carbonatite Genesis. J. Petrol. 1998, 39, 2015–2031. [Google Scholar] [CrossRef] [Green Version]
  47. Tarasenko, Y.; Litsarev, M.A.; Tretyakova, L.I.; Vokhmentsev, A.Y. Chrysolite of the Kovdor phlogopite deposit (in Russian). Izv. AN SSSR Seriya Geol. 1986, 9, 67–80. [Google Scholar]
  48. Zeira, S.; Hafner, S.S. The location of Fe3+ ions in forsterite (Mg2SiO4). Earth Planet. Sci. Lett. 1974, 21, 201–208. [Google Scholar] [CrossRef]
  49. Janney, D.E.; Banfield, J.F. Distribution of cations and vacancies and the structure of defects in oxidized intermediate olivine by atomic-resolution TEM and image simulation. Am. Mineral. 1998, 83, 799–810. [Google Scholar] [CrossRef]
  50. Bragg, W.L.; Brown, G.B. XXX. Die Struktur des Olivins. Z. Krist. Cryst. Mater. 1926, 63, 538–556. [Google Scholar] [CrossRef]
  51. Brown, G.E. Crystal Chemistry of the Olivines; Virginia Polytechnic Institute and State University: Blacksburg, VA, USA, 1970. [Google Scholar]
  52. Huggins, F.E. Cation order in olivines: Evidence from vibrational spectra. Chem. Geol. 1973, 11, 99–108. [Google Scholar] [CrossRef]
  53. Nover, G.; Will, G. Structure refinements of seven natural olivine crystals and the influence of the oxygen partial pressure on the cation distribution. Z. Krist. Cryst. Mater. 1981, 155. [Google Scholar] [CrossRef]
  54. Francis, C.A. New data on the forsterite-tephroite series. Am. Mineral. 1985, 70, 568–575. [Google Scholar]
  55. Seifert, F.A.; Virgo, D. Kinetics of the Fe2+-Mg, Order-Disorder Reaction in Anthophyllites: Quantitative Cooling Rates. Science 1975, 188, 1107–1109. [Google Scholar] [CrossRef] [PubMed]
  56. Seifert, F.; Virgo, D. Temperature dependence of intracrystalline Fe2+-Mg distribution in a natural anthophyllite. In Carnegie Institute of Washington Year Book; Carnegie Institute of Washington: Washington, DC, USA, 1974; pp. 405–411. [Google Scholar]
  57. Shannon, R.D. Revised effective ionic radii and systematic studies of interatomic distances in halides and chalcogenides. Acta Crystallogr. Sect. A 1976, 32, 751–767. [Google Scholar] [CrossRef] [Green Version]
  58. Riekel, C.; Weiss, A. Cation-Ordering in Synthetic Mg2−xFexSiO4-Olivines. Z. Naturforsch. B 1978, 33. [Google Scholar] [CrossRef]
  59. Redfern, S.A.T.; Henderson, C.M.B.; Knight, K.S.; Wood, B.J. High-temperature order-disorder in (Fe0.5Mn0.5)2SiO4 and (Mg0.5Mn0.5)2SiO4 olivines: An in situ neutron diffraction study. Eur. J. Mineral. 1997, 9, 287–300. [Google Scholar] [CrossRef]
  60. Shen, B.; Tamada, O.; Kitamura, M.; Morimoto, N. Superstructure of laihunite-3M (□0.40Fe2+0.80Fe3+0.80SiO4). Am. Mineral. 1986, 71, 1455–1460. [Google Scholar]
  61. Brown, G.E.; Prewitt, C.T. High-temperature crystal chemistry of hortonolite. Am. Mineral. 1973, 58, 577–587. [Google Scholar]
  62. Princivalle, F.; Secco, L. Crystal structure refinement of 13 olivines in the forsterite-fayalite series from volcanic rocks and ultramafic nodules. TMPM 1985, 34, 105–115. [Google Scholar] [CrossRef]
  63. Motoyama, T.; Matsumoto, T. The crystal structures and the cation distributions of Mg and Fe of natural olivines. Miner. J. 1989, 14, 338–350. [Google Scholar] [CrossRef]
  64. Princivalle, F. Influence of temperature and composition on Mg-Fe2+ intracrystalline distribution in olivines. Mineral. Petrol. 1990, 43, 121–129. [Google Scholar] [CrossRef]
  65. Heinemann, R.; Kroll, H.; Kirfel, A.; Barbier, B. Order and anti-order in olivine III: Variation of the cation distribution in the Fe,Mg olivine solid solution series with temperature and composition. Eur. J. Mineral. 2007, 19, 15–27. [Google Scholar] [CrossRef]
  66. Kroll, H.; Kirfel, A.; Heinemann, R.; Barbier, B. Volume thermal expansion and related thermophysical parameters in the Mg, Fe olivine solid-solution series. Eur. J. Mineral. 2012, 24, 935–956. [Google Scholar] [CrossRef]
  67. Ren, Y.; Chen, F.; Yang, J.; Gao, Y. Exsolutions of Diopside and Magnetite in Olivine from Mantle Dunite, Luobusa Ophiolite, Tibet, China. Acta Geol. Sin. Engl. Ed. 2010, 82, 377–384. [Google Scholar] [CrossRef]
  68. Markl, G.; Marks, M.A.W.; Wirth, R. The influence of T, aSiO2, and fO2 on exsolution textures in Fe-Mg olivine: An example from augite syenites of the Ilimaussaq Intrusion, South Greenland. Am. Mineral. 2001, 86, 36–46. [Google Scholar] [CrossRef]
  69. Libourel, G. Systematics of calcium partitioning between olivine and silicate melt: Implications for melt structure and calcium content of magmatic olivines. Contrib. Mineral. Petrol. 1999, 136, 63–80. [Google Scholar] [CrossRef]
  70. Carmichael, I.S.E.; Nicholls, J. Iron-titanium oxides and oxygen fugacities in volcanic rocks. J. Geophys. Res. 1967, 72, 4665–4687. [Google Scholar] [CrossRef]
  71. Mysen, B.O.; Richet, P. Silicate Glasses and Melts. Properties and Structure; Elsevier: New York, NY, USA, 2005; ISBN 0-444-52011-2. [Google Scholar]
  72. Moseley, D. Symplectic exsolution in olivine. Am. Mineral. 1984, 69, 139–153. [Google Scholar]
  73. Wyllie, P.J.; Baker, M.B.; White, B.S. Experimental boundaries for the origin and evolution of carbonatites. Lithos 1990, 26, 3–19. [Google Scholar] [CrossRef]
  74. Veksler, I.V.; Petibon, C.; Jenner, G.A.; Dorfman, A.M.; Dingwell, D.B. Trace Element Partitioning in Immiscible Silicate-Carbonate Liquid Systems: An Initial Experimental Study Using a Centrifuge Autoclave. J. Petrol. 1998, 39, 2095–2104. [Google Scholar] [CrossRef]
  75. Wyllie, P.J.; Tuttle, O.F. The System CaO-CO2-H2O and the Origin of Carbonatites. J. Petrol. 1960, 1, 1–46. [Google Scholar] [CrossRef]
  76. Koster van Groos, A.F.; Wyllie, P.J. Liquid immiscibility in the system Na2O-Al2O3-SiO2-CO2 at pressures to 1 kilobar. Am. J. Sci. 1966, 264, 234–255. [Google Scholar] [CrossRef]
  77. Koster van Groos, A.F.; Wyllie, P.J. Liquid immiscibility in the join NaAlSi3O8-Na2CO3-H2O and its bearing on the genesis of carbonatites. Am. J. Sci. 1968, 266, 932–967. [Google Scholar] [CrossRef]
  78. Freestone, I.C.; Hamilton, D.L. The role of liquid immiscibility in the genesis of carbonatites? An experimental study. Contrib. Mineral. Petrol. 1980, 73, 105–117. [Google Scholar] [CrossRef]
  79. Kjarsgaard, B.A.; Hamilton, D.L. Liquid immiscibility and the origin of alkali-poor carbonatites. Mineral. Mag. 1988, 52, 43–55. [Google Scholar] [CrossRef] [Green Version]
  80. Kjarsgaard, B.A.; Hamilton, D.L. The genesis of carbonatites by liquid immiscibility. In Carbonatites: Genesis and Evolution; Bell, K.E., Ed.; Unwin Hyman: London, UK, 1989; pp. 388–404. [Google Scholar]
  81. Watkinson, D.H.; Wyllie, P.J. Experimental Study of the Composition Join NaAlSiO4-CaCO3-H2O and the Genesis of Alkalic Rock—Carbonatite Complexes. J. Petrol. 1971, 12, 357–378. [Google Scholar] [CrossRef]
  82. Franz, G.W. Melting Relationships in the System CaO-MgO-SiO2-CO2-H2O: A Study of Synthetic Kimberlites; The Pennsylvania State University: State College, PA, USA, 1965. [Google Scholar]
  83. Franz, G.W.; Wyllie, P.J. Experimental Studies in the system CaO-MgO-SiO2-CO2-H2O. In Ultramafic and Related Rocks; Wyllie, P.J., Ed.; John Wiley and Sons: New York, NY, USA, 1967; pp. 323–326. [Google Scholar]
  84. Toplis, M.J.; Libourel, G.; Carroll, M.R. The role of phosphorus in crystallisation processes of basalt: An experimental study. Geochim. Cosmochim. Acta 1994, 58, 797–810. [Google Scholar] [CrossRef]
  85. Mysen, B.O. Iron and phosphorus in calcium silicate quenched melts. Chem. Geol. 1992, 98, 175–202. [Google Scholar] [CrossRef]
  86. Mysen, B.O.; Ryerson, F.J.; Virgo, D. The structural role of phosphorus in silicate melts. Am. Mineral. 1981, 66, 106–117. [Google Scholar]
  87. Mikhailova, J.A.; Krasnova, N.I.; Krezer, Y.L.; Wall, F. Inclusions in minerals of the Kovdor intrusion of ultrabasic, alkaline rocks and carbonatites as indicators of the endogenic evolution processes. In Deep-Seated Magmatism, Magmatic Sources and the Problem of Plumes (in Russian); Vladykin, N.V., Ed.; Siberian Branch of the Russian Academy of Sciences: Irkutsk/Valdivostok, Russia, 2002; pp. 296–320. [Google Scholar]
  88. Biggar, G.M. High Pressure High Temperature Phase Equilibrium Studies in the System CaO-CaF2-P2O5-H2O-CO2 with Special Reference to the Apatites; University of Leeds: Leeds, UK, 1962. [Google Scholar]
  89. Wyllie, P.J.; Biggar, G.M. Fractional Crystallization in the “Carbonatite Systems” CaO-MgO-CO2-H2O and CaO-CaF2-P2O5-CO2-H2O. In Papers and Proceedings of the Fourth General Meeting. International Mineralogical; International Mineralogical Association: Gauteng, South Africa, 1966; pp. 92–105. [Google Scholar]
  90. Wyllie, P.; Haas, J. The system CaO-SiO2-CO2-H2O: 1. Melting relationships with excess vapor at 1 kilobar pressure. Geochim. Cosmochim. Acta 1965, 29, 871–892. [Google Scholar] [CrossRef]
  91. Moussallam, Y.; Florian, P.; Corradini, D.; Morizet, Y.; Sator, N.; Vuilleumier, R.; Guillot, B.; Iacono-Marziano, G.; Schmidt, B.C.; Gaillard, F. The molecular structure of melts along the carbonatite-kimberlite-basalt compositional joint: CO2 and polymerisation. Earth Planet. Sci. Lett. 2016, 434, 129–140. [Google Scholar] [CrossRef] [Green Version]
  92. Klemme, S. Experimental constraints on the evolution of iron and phosphorus-rich melts: Experiments in the system CaO-MgO-Fe2O3-P2O5-SiO2-H2O-CO2. J. Mineral. Petrol. Sci. 2010, 105, 1–8. [Google Scholar] [CrossRef]
  93. Eberl, D.D.; Kile, D.E.; Drits, V.A. On geological interpretations of crystal size distributions: Constant vs. proportionate growth. Am. Mineral. 2002, 87, 1235–1241. [Google Scholar] [CrossRef]
  94. Minarik, W.G.; Watson, E.B. Interconnectivity of carbonate melt at low melt fraction. Earth Planet. Sci. Lett. 1995, 133, 423–437. [Google Scholar] [CrossRef]
  95. Minarik, W.G. Complications to Carbonate Melt Mobility due to the Presence of an Immiscible Silicate Melt. J. Petrol. 1998, 39, 1965–1973. [Google Scholar] [CrossRef] [Green Version]
  96. Keppler, H. Water solubility in carbonatite melts. Am. Mineral. 2003, 88, 1822–1824. [Google Scholar] [CrossRef]
  97. Krasnova, N.I. Geology, mineralogy and problems of genesis of apatite-francolite rocks of the Kovdor massif (in Russian). In Composition of Phosphorites; Nauka: Novosibirsk, Russia, 1979; pp. 164–172. [Google Scholar]
Figure 1. (a) Geological map of the Kovdor alkaline-ultrabasic massif, after Afanasyev and Pan’shin, modified after [9]; cross-sections of the Kovdor phoscorite–carbonatite complex: (b) horizontal (−100 m, Y axis shows the North) and (c) vertical along A-B line, after [11].
Minerals 08 00260 g001
Figure 2. Relations of major rocks within the Kovdor phoscorite–carbonatite pipe. BSE-images (ad,g) of main rock types, photo of outcrop (e) and image of thin section in transmitted light (f). (а) 914/185.2; (b) 993/132.3; (c) 981/217.1; (d) 1006/436.1; (f,g) 927/21.7.
Minerals 08 00260 g002
Figure 3. Morphology of forsterite and its relations with other minerals in rocks of the Kovdor alkaline-ultrabasic massif: (a) replacement of forsterite with diopside and phlogopite in peridotite 10p/76.01; (b) grain of forsterite with inclusions of diopside and magnetite in peridotite 912/231.6; (c) co-crystallization of forsterite (with inclusions of calcite) and hydroxylapatite in AF phoscorite 934/112.1; (d) interstitial segregations of magnetite and hydroxylapatite in AF phoscorite 976/33.1; (e) network of forsterite grains in MAF phoscorite 932/205.9; (f) typical MF phoscorite 983/64.6; (g) inclusions of hydroxylapatite, calcite and dolomite in forsterite grains of MAF phoscorite 938/30.6; (h) well shaped crystals of forsterite with inclusions of hydroxylapatite and calcite in CMF phoscorite 953/6.0. (a,e) images of polished thin section in transmitted light; (bd,fh) BSE images. Mineral abbreviations see in the Section 3.
Minerals 08 00260 g003
Figure 4. Distribution of forsterite content (a) and average grain size (b) within the baddeleyite-apatite-magnetite deposit.
Minerals 08 00260 g004
Figure 5. Grains of forsterite in thin sections of AF phoscorite 937/177.0 (a), MAF phoscorite 899/82.9 (f) and CMAF phoscorite 996/241.2 (k), corresponding histograms of equivalent circular diameter (b,g,l), cumulative frequency diagrams in semilog (c,h,m) and double logarithmic (d,i,n) coordinates, and orientation of elongated forsterite grains in the sections (e,j,o).
Minerals 08 00260 g005
Figure 6. Relation of apo-forsterite phlogopite, clinochlore, serpentine, dolomite, valleriite and clinohumite with forsterite and distribution of these minerals within the Kovdor baddeleyite-apatite-magnetite deposit at horizon −100 m. BSE-images: (a) MAF phoscorite 992/0.9; (b) AF phoscorite 970/93.1; (c) AF phoscorite 966/165.1; (d) MAF phoscorite 986/82.2. Mineral abbreviations see in the Section 3.
Minerals 08 00260 g006
Figure 7. Matrix diagram for major octahedral cations of forsterite (apfu).
Minerals 08 00260 g007
Figure 8. Variations in forsterite composition (apfu) within the Kovdor baddeleyite-apatite-magnetite deposit.
Minerals 08 00260 g008
Figure 9. Correlation coefficients of forsterite composition with hydroxylapatite, magnetite and calcite compositions.
Minerals 08 00260 g009
Figure 10. Crystal structure of forsterite (1): a general view (a) and heteropolyhedral sheet based on M1, M2 octahedra (green) and Z1 tetrahedra (yellow) projected along c axis (b).
Minerals 08 00260 g010
Figure 11. Geometry of coordination polyhedra in crystal structure of forsterites 1–5 (a), scatterplot of average <M1-O>, <M2-O> and <Z1-O> bond lengths against magnesium content in olivine according to [61,62,63,64], and present data (filled squares and circles) (b), scatterplot of polyhedral volumes (M1, M2 and Z1) against ferric iron content (c).
Minerals 08 00260 g011
Figure 12. BSE-images of a rim of newly formed “phoscoritic” forsterite-II (Fo’’ = Fo92Fa8) around relict grain of “peridotitic” forsterite-I (Fo’ = Fo93Fa7) in AF-phoscorite 937/114.6 (a) and the enlarged region demonstrating diopside lamellae and calcite “drops” in forsterite (b). Fo’’’ = Fo95Fa5. Other mineral abbreviations see in the Section 3.
Minerals 08 00260 g012
Table 1. Main varieties of phoscorite and phoscorite-related carbonatite [10].
Group of RockRockMineral Content, Modal %
FoApMagCal
Forsterite-rich phoscorite
(Cal < 10 modal %, Mag < 10 modal %)
Forsteritite (F)85–900–51–8
Apatite-forsterite phoscorite (AF)10–8510–800–80–5
Low-carbonate magnetite-rich phoscorite
(Cal < 10 modal %, Mag > 10 modal %)
Magnetite-forsterite phoscorite (MF)10–700–515–850–5
Magnetite-apatite-forsterite phoscorite (MAF)10–7010–7010–700–8
Magnetite-apatite phoscorite (MA)0–55–5040–850–5
Magnetitite (M)0–80–580–950–5
Calcite-rich phoscorite
(10 modal % < Cal < 50 modal %)
Calcite-magnetite-apatite-forsterite phoscorite (CMAF)10–6010–6010–5510–40
Calcite-magnetite-forsterite phoscorite (CMF)10–700–515–6010–45
Calcite-apatite-forsterite phoscorite (CAF)10–4520–552–820–40
Calcite-magnetite-apatite phoscorite (CMA)0–610–6311–7910–45
Calcite-apatite phoscorite (CA)2–650–651–627–41
Calcite-magnetite phoscorite (CM)0–50–570–8416–20
Phoscorite-related carbonatite
(Cal > 50 modal %)
Calcite carbonatite (C)0–352–401–3550–82
Table 2. Parameters of EPMA.
ElementType of CrystalStandardsDL, wt %
MgKAPForsterite0.1
AlKAPPyrope0.05
SiKAPForsterite0.05
CaPETDiopside0.03
ScPETThortveitite0.02
TiPETLorenzenite0.02
CrQuartzChromite0.02
MnQuartzSynthetic MnCO30.01
FeQuartzHematite0.01
NiLiFMetal nickel0.01
n = 5–10 counts for each point (depending on dispersion).
Table 3. Chemical composition of forsterite (average ± SD/min–max).
RockPeridotitePhoscoriteCarbonatites
(Ap)-FoLow-Cb Mag-RichCal-RichPhoscorite-RelatedVein
n739176117207
SiO2, wt %41.1 ± 0.9
40.37–42.63
40.8 ± 0.6
39.73–42.55
40.9 ± 0.6
38.48–42.21
40.8 ± 0.6
39.33–43.98
40.8 ± 0.6
39.60–42.01
40.8 ± 0.7
39.65–41.68
MgO47 ± 2
44.12–50.26
52 ± 1
47.73–53.87
53 ± 1
47.10–55.25
52 ± 1
46.65–55.93
53 ± 1
48.51–54.43
52 ± 2
48.53–53.69
FeO10 ± 1
8.68–12.11
7 ± 1
4.43–11.10
6 ± 1
3.48–8.82
6 ± 1
1.53–10.89
6 ± 1
3.73–10.22
6 ± 1
4.22–8.04
MnO0.4 ± 0.2
0.10–0.55
0.34 ± 0.07
0.23–0.56
0.3 ± 0.3
0.14–0.49
0.33 ± 0.06
0.19–0.53
0.34 ± 0.09
0.25–0.66
0.33 ± 0.04
0.28–0.39
CaO0.3 ± 0.1
0.13–0.36
0.13 ± 0.08
<0.03–0.40
0.12 ± 0.08
<0.03–0.55
0.13 ± 0.08
<0.03–0.60
0.17 ± 0.06
0.09–0.31
0.19 ± 0.16
0.05–0.49
TiO2<0.02
<0.02–0.02
<0.02
<0.02–0.07
<0.02
<0.02–0.05
<0.02
<0.02–0.04
<0.02
<0.02–0.03
<0.02
<0.02–0.03
Al2O3<0.05<0.05<0.05<0.05<0.05<0.05
Cr2O3<0.02
<0.02–0.03
<0.02<0.02≤0.02<0.02
<0.02–0.04
<0.02
NiO0.10 ± 0.05
<0.02–0.17
<0.02
<0.01–0.06
<0.01
<0.01–0.03
<0.01
<0.01–0.03
<0.01<0.01
Sc2O3<0.02<0.02<0.02
<0.02–0.03
<0.02
<0.02–0.11
<0.02<0.02
Mg, apfu1.75 ± 0.06
1.66–1.82
1.87 ± 0.04
1.77–1.92
1.89 ± 0.03
1.74–1.95
1.89 ± 0.04
1.75–1.99
1.89 ± 0.03
1.79–1.93
1.88 ± 0.04
1.8–1.93
Fe2+0.21 ± 0.03
0.15–0.24
0.11 ± 0.04
0.05–0.21
0.09 ± 0.03
0.00–0.18
0.08 ± 0.04
0.00–0.23
0.09 ± 0.03
0.03–0.17
0.09 ± 0.04
0.04–0.17
Fe3+0.01 ± 0.01
0.00–0.03
0.02 ± 0.02
0.00–0.07
0.03 ± 0.02
0.00–0.11
0.03 ± 0.02
0.00–0.09
0.03 ± 0.02
0.00–0.05
0.03 ± 0.02
0.00–0.06
Mn0.01
0.00–0.01
0.01
0.00–0.01
0.01+0.01
0.00–0.01
0.01
0.00–0.01
0.01
0.00–0.01
0.01
0.00–0.01
Ca0.01
0.00–0.01
0.00
0.00–0.01
0.00
0.00–0.01
0.00
0.00–0.02
0.00
0.00–0.01
0.00
0.00–0.01
Si1.02 ± 0.03
0.98–1.08
0.99 ± 0.01
0.97–1.04
0.99 ± 0.01
0.93–1.03
0.99 ± 0.01
0.95–1.06
0.98 ± 0.01
0.97–1.00
0.99 ± 0.01
0.97–1.01
Table 4. Results of factor analysis of forsterite composition.
VariablesFactor Loadings
Factor 1Factor 2
Mg−0.927−0.248
Fe2+0.9610.179
Fe3+−0.680−0.021
Mn0.6760.219
Ca0.3570.014
Ti0.1640.844
Ni0.0900.861
Explained variance2.8631.596
% of total variance40.922.8
Factor loadings above 0.6 are shown in bold.
Table 5. Chemical composition of forsterite analyzed with single crystal X-ray diffraction.
Sample12345
Drill hole919924924966987
Depth, m18.526.7169.162.967.2
PhoscoriteMag-Ap-FoCal-Mag-Ap-FoAp-FoMag-Ap-FoCal-Mag-Ap-Fo
SiO2, wt %39.3740.6940.7140.1640.74
TiO2bd0.010.07bdbd
FeO6.208.968.518.426.89
MnO0.300.460.494.270.39
MgO53.3747.7948.9647.1052.18
CaO0.130.340.060.140.09
NiObdbd0.06bdbd
Total99.3798.2598.86100.09100.29
Mg, apfu1.9171.7781.8041.7381.871
Fe2+0.0220.1870.1760.1630.098
Fe3+0.1030.0120.040
Mn2+0.0060.0100.0100.0900.008
Ca2+0.0030.0090.0020.0040.002
Ni2+0.001
Ti4+0.001
Si4+0.9491.0161.0060.9940.980
bd—below detection limit.
Table 6. Crystal data, data collection and structure refinement parameters of forsterite.
Sample12345
Refined formulaMg1.94Fe0.06SiO4Mg1.87Fe0.13SiO4Mg1.84Fe0.16SiO4Mg1.89Fe0.11SiO4Fe0.10Mg1.90SiO4
Temperature/K293(2)
Crystal systemorthorhombic
Space groupPnma
a, (Å)10.1899(6)10.2165(4)10.2097(4)10.2027(4)10.1980(4)
b, (Å)5.9730(4)5.9911(2)5.9876(3)5.9775(3)5.9810(2)
c, (Å)4.7403(3)4.76168(14)4.7600(2)4.7541(2)4.75403(16)
α = β = γ, (°)9090909090
Volume, (Å3)288.51(3)291.453(18)290.99(2)289.94(2)289.970(18)
Z44444
ρcalc, (g/cm3)3.2793.2983.3313.2993.299
μ/mm−11.3211.6391.8131.5441.544
Crystal size, (mm3)0.23 × 0.18 × 0.160.27 × 0.21 × 0.180.29 × 0.25 × 0.160.18 × 0.15 × 0.140.19 × 0.17 × 0.16
RadiationMo (λ = 0.71073)
2Θ range for data collection, (°)7.99–54.9167.978–54.9147.984–54.9427.99–54.8447.992–54.86
Index ranges−13 ≤ h ≤ 11,
−7 ≤ k ≤ 4,
−6 ≤ l ≤ 5
−13 ≤ h ≤ 5,
−4 ≤ k ≤ 7,
−6 ≤ l ≤ 5
−13 ≤ h ≤ 3,
−6 ≤ k ≤ 7,
−6 ≤ l ≤ 3
−13 ≤ h ≤ 9,
−6 ≤ k ≤ 7,
−5 ≤ l ≤ 6
−6 ≤ h ≤ 13,
−5 ≤ k ≤ 7,
−6 ≤ l ≤ 3
Reflections collected725755794753738
Independent reflections361
[Rint = 0.0222, Rsigma = 0.0333]
364
[Rint = 0.0161, Rsigma = 0.0228]
364
[Rint = 0.0291, Rsigm = 0.0414]
363
[Rint = 0.0212, Rsigma = 0.0290]
363
[Rint = 0.0149, Rsigma = 0.0214]
Data/restraints/parameters361/0/42364/0/36364/0/42363/0/42363/0/42
Goodness-of-fit on F21.0401.1461.0771.1491.253
Final R indexes [I >= 2σ (I)]R1 = 0.0334,
wR2 = 0.0852
R1 = 0.0274,
wR2 = 0.0713
R1 = 0.0260,
wR2 = 0.0593
R1 = 0.0239,
wR2 = 0.0602
R1 = 0.0258,
wR2 = 0.0683
Final R indexes [all data]R1 = 0.0359,
wR2 = 0.0873
R1 = 0.0283,
wR2 = 0.0722
R1 = 0.0336,
wR2 = 0.0634
R1 = 0.0261,
wR2 = 0.0619
R1 = 0.0273,
wR2 = 0.0690
Largest diff. peak/hole, (e/Å−3)0.57/−0.550.53/−0.690.50/−0.480.47/−0.600.46/−0.65
Table 7. Refined iron content of octahedral M1 and M2 sites for 15 samples (apfu).
SampleM1M2
10.0200.035
20.0570.070
30.0800.084
40.0470.057
50.040.065

