The Effects of Sodium Ions, Phosphorus, and Silicon on the Eco-Friendly Process of Vanadium Precipitation by Hydrothermal Hydrogen Reduction


1
School of Resources and Environmental Engineering, Wuhan University of Technology, Wuhan 430070, China
2
Hubei Key laboratory of Mineral Resources Processing and Environment, Wuhan 430070, China
3
State Environmental Protection Key Laboratory of Mineral Metallurgical Resources Utilization and Pollution Control, Wuhan University of Science and Technology, Wuhan 430081, China
4
Hubei Collaborative Innovation Center for High Efficient Utilization of Vanadium Resources, Wuhan 430081, China
*
Authors to whom correspondence should be addressed.
Minerals 2018, 8(7), 294; https://doi.org/10.3390/min8070294
Submission received: 11 May 2018
/
Revised: 29 June 2018
/
Accepted: 5 July 2018
/
Published: 11 July 2018
(This article belongs to the Special Issue Towards Sustainability in Extractive Metallurgy)
Abstract
:The effects of sodium ions, phosphorus, and silicon on the eco-friendly process of vanadium precipitation by hydrothermal hydrogen reduction were investigated to establish the suitable concentrated solution system for this eco-friendly process. The results showed that sodium ions had no negative effects on the vanadium precipitation process. Phosphorus can reduce vanadate ion activity, and results in the decrease of vanadium precipitation percentage from 99.5% to 61.3%, as the phosphorus concentration in the feed solution increased from 0.05 g/L to 3 g/L. As a result, the aimed products of V2O3 were hard to be obtained, and the purity of the precipitates was lowered. Silicon can absorb in the form of H3Si3O7 on the surface of the precipitates, thus it was difficult for H (activity hydrogen atom) to react with the intermediate vanadium-bearing precipitates. As a result, the vanadium precipitation percentage decreased from 99.5% to 86.2% as the silicon concentration in the feed solution increased from 0.1 g/L to 3 g/L. The aimed products of V2O3 were not easy to be obtained, and only the intermediate vanadium-bearing precipitates containing sodium ions were obtained. The upper limits of the concentrations of phosphorus and silicon in the feed V (V) solution were ascertained as 0.5 g/L and 0.1 g/L, respectively. As the concentrations of phosphorus and silicon in the purified alkaline-concentrated V (V) solution extracted from vanadium-bearing shale are usually below the upper limits of the concentrations, the eco-friendly process of vanadium precipitation by hydrothermal hydrogen reduction has a great application prospect in the field of vanadium extraction from vanadium-bearing shale.
1. Introduction
Vanadium has been widely used in defense-related, aerospace, chemical industry, medicine, advanced materials, and other high-tech fields due to its unique physical and chemical properties [1,2,3,4,5,6]. In China vanadium-bearing shale is a dominant vanadium resource, and more than 87% of the vanadium exists in this unique vanadium resource [7,8,9]. Therefore, vanadium extraction from vanadium-bearing shale has been attracting enormous attention recently [10,11,12,13,14,15,16].
At present, vanadium precipitation is an indispensable process for vanadium extraction from vanadium-bearing shale [7]. The most popular vanadium precipitation method is vanadium precipitation with ammonium salt, due to its high recovery of vanadium and high purity of the obtained vanadium products [7,17,18,19]. But this process can cause serious water and air pollution due to the addition of a large amount of ammonium salt. This environmental problem has become one of the most important factors restricting the green and sustainable development of the vanadium extraction industry.
In order to solve the environmental problem in the present vanadium extraction process, an eco-friendly vanadium precipitation process without the addition of ammonium salt has been developed and reported in our previous study [20]. In this eco-friendly process, the hydrothermal hydrogen reduction technology was used for precipitating V2O3 products from the stripped pentavalent vanadium (V (V)) solution extracted from vanadium-bearing shale. Both of the vanadium precipitation efficiency and the purity of the products can reach more than 99%. However, the contents of the impurity elements, such as phosphorus and silicon, in the stripped vanadium solution were very low, which cannot represent all the concentrated vanadium solutions obtained from vanadium-bearing shale through various vanadium extraction processes.
In general, there are two major kinds of concentrated vanadium solutions with different properties. One is the acidic concentrated vanadium solution. The other is the alkaline concentrated vanadium solution. In the acidic concentrated vanadium solution, the main impurities are iron, aluminum, magnesium, phosphorus, silicon, and calcium, and the valency of the vanadium is tetravalent. In the alkaline concentrated vanadium solution, the valency of the vanadium is pentavalent. The alkaline concentrated vanadium solution can be divided into three kinds according to the different extraction processes. One is the alkaline-stripped vanadium solution, another is the alkaline desorption vanadium solution, and the third is the alkaline vanadium circulating leaching solution. These solutions are obtained by using NaOH or Na2CO3 solutions as stripping, desorption, and leaching agents, respectively. In the alkaline-concentrated vanadium solutions, the main impurities are sodium ions, phosphorus, and silicon.
In our previous study [20], it has been proved that the pH value of the vanadium solution would increase to more than 11 during the vanadium precipitation process by hydrothermal hydrogen reduction technology (HRVP process). Therefore, the HRVP process is more suitable for precipitating vanadium from alkaline-concentrated vanadium solution than acidic-concentrated vanadium solution, because the former can avoid the hydrolytic precipitation of iron, aluminum, magnesium, and calcium. However, the effects of sodium ions, phosphorus, and silicon in the alkaline concentrated vanadium solution on the HRVP process are rarely reported. Thus, it is necessary to investigate the effects of sodium ions, phosphorus, and silicon on the HRVP process, to establish the suitable alkaline concentrated vanadium solution system for this eco-friendly method. Meanwhile, the establishment of the suitable concentrated vanadium solution for the HRVP process is also of great significance for guiding the development of the whole process of vanadium extraction in an eco-friendly direction.
In this research, some simulated concentrated vanadium solutions with different concentrations of ions were used as the feed solution. The effects of sodium ions, phosphorus, and silicon on the HRVP process were investigated respectively through the characterization analysis of the precipitates and the filtrates. The mechanisms of the effects of sodium ions, phosphorus, and silicon on the HRVP process were discussed. The suitable concentration ranges of the sodium ions, phosphorus, and silicon for the HRVP process were ascertained. Furthermore, a desorption vanadium solution extracted from the vanadium-bearing shale was used as the actual concentrated vanadium solution for the HRVP process to verify the results of the simulated experiments.
2. Materials and Methods
2.1. Materials and Reagents
V2O5 powders of 99% in purity and NaOH used for preparing the simulated concentrated alkaline vanadium solutions were supplied by Guoyao Chemistry Co., Ltd. (Beijing, China). Na3PO4 and Na2SiO3·9H2O used as resources of phosphorus and silicon in the simulated concentrated vanadium solutions were also supplied by Guoyao Chemistry Co., Ltd. (Beijing, China). Deionized water was used in all experiments. Other reagents were of analytical grade.
2.2. Procedures and Characterizations
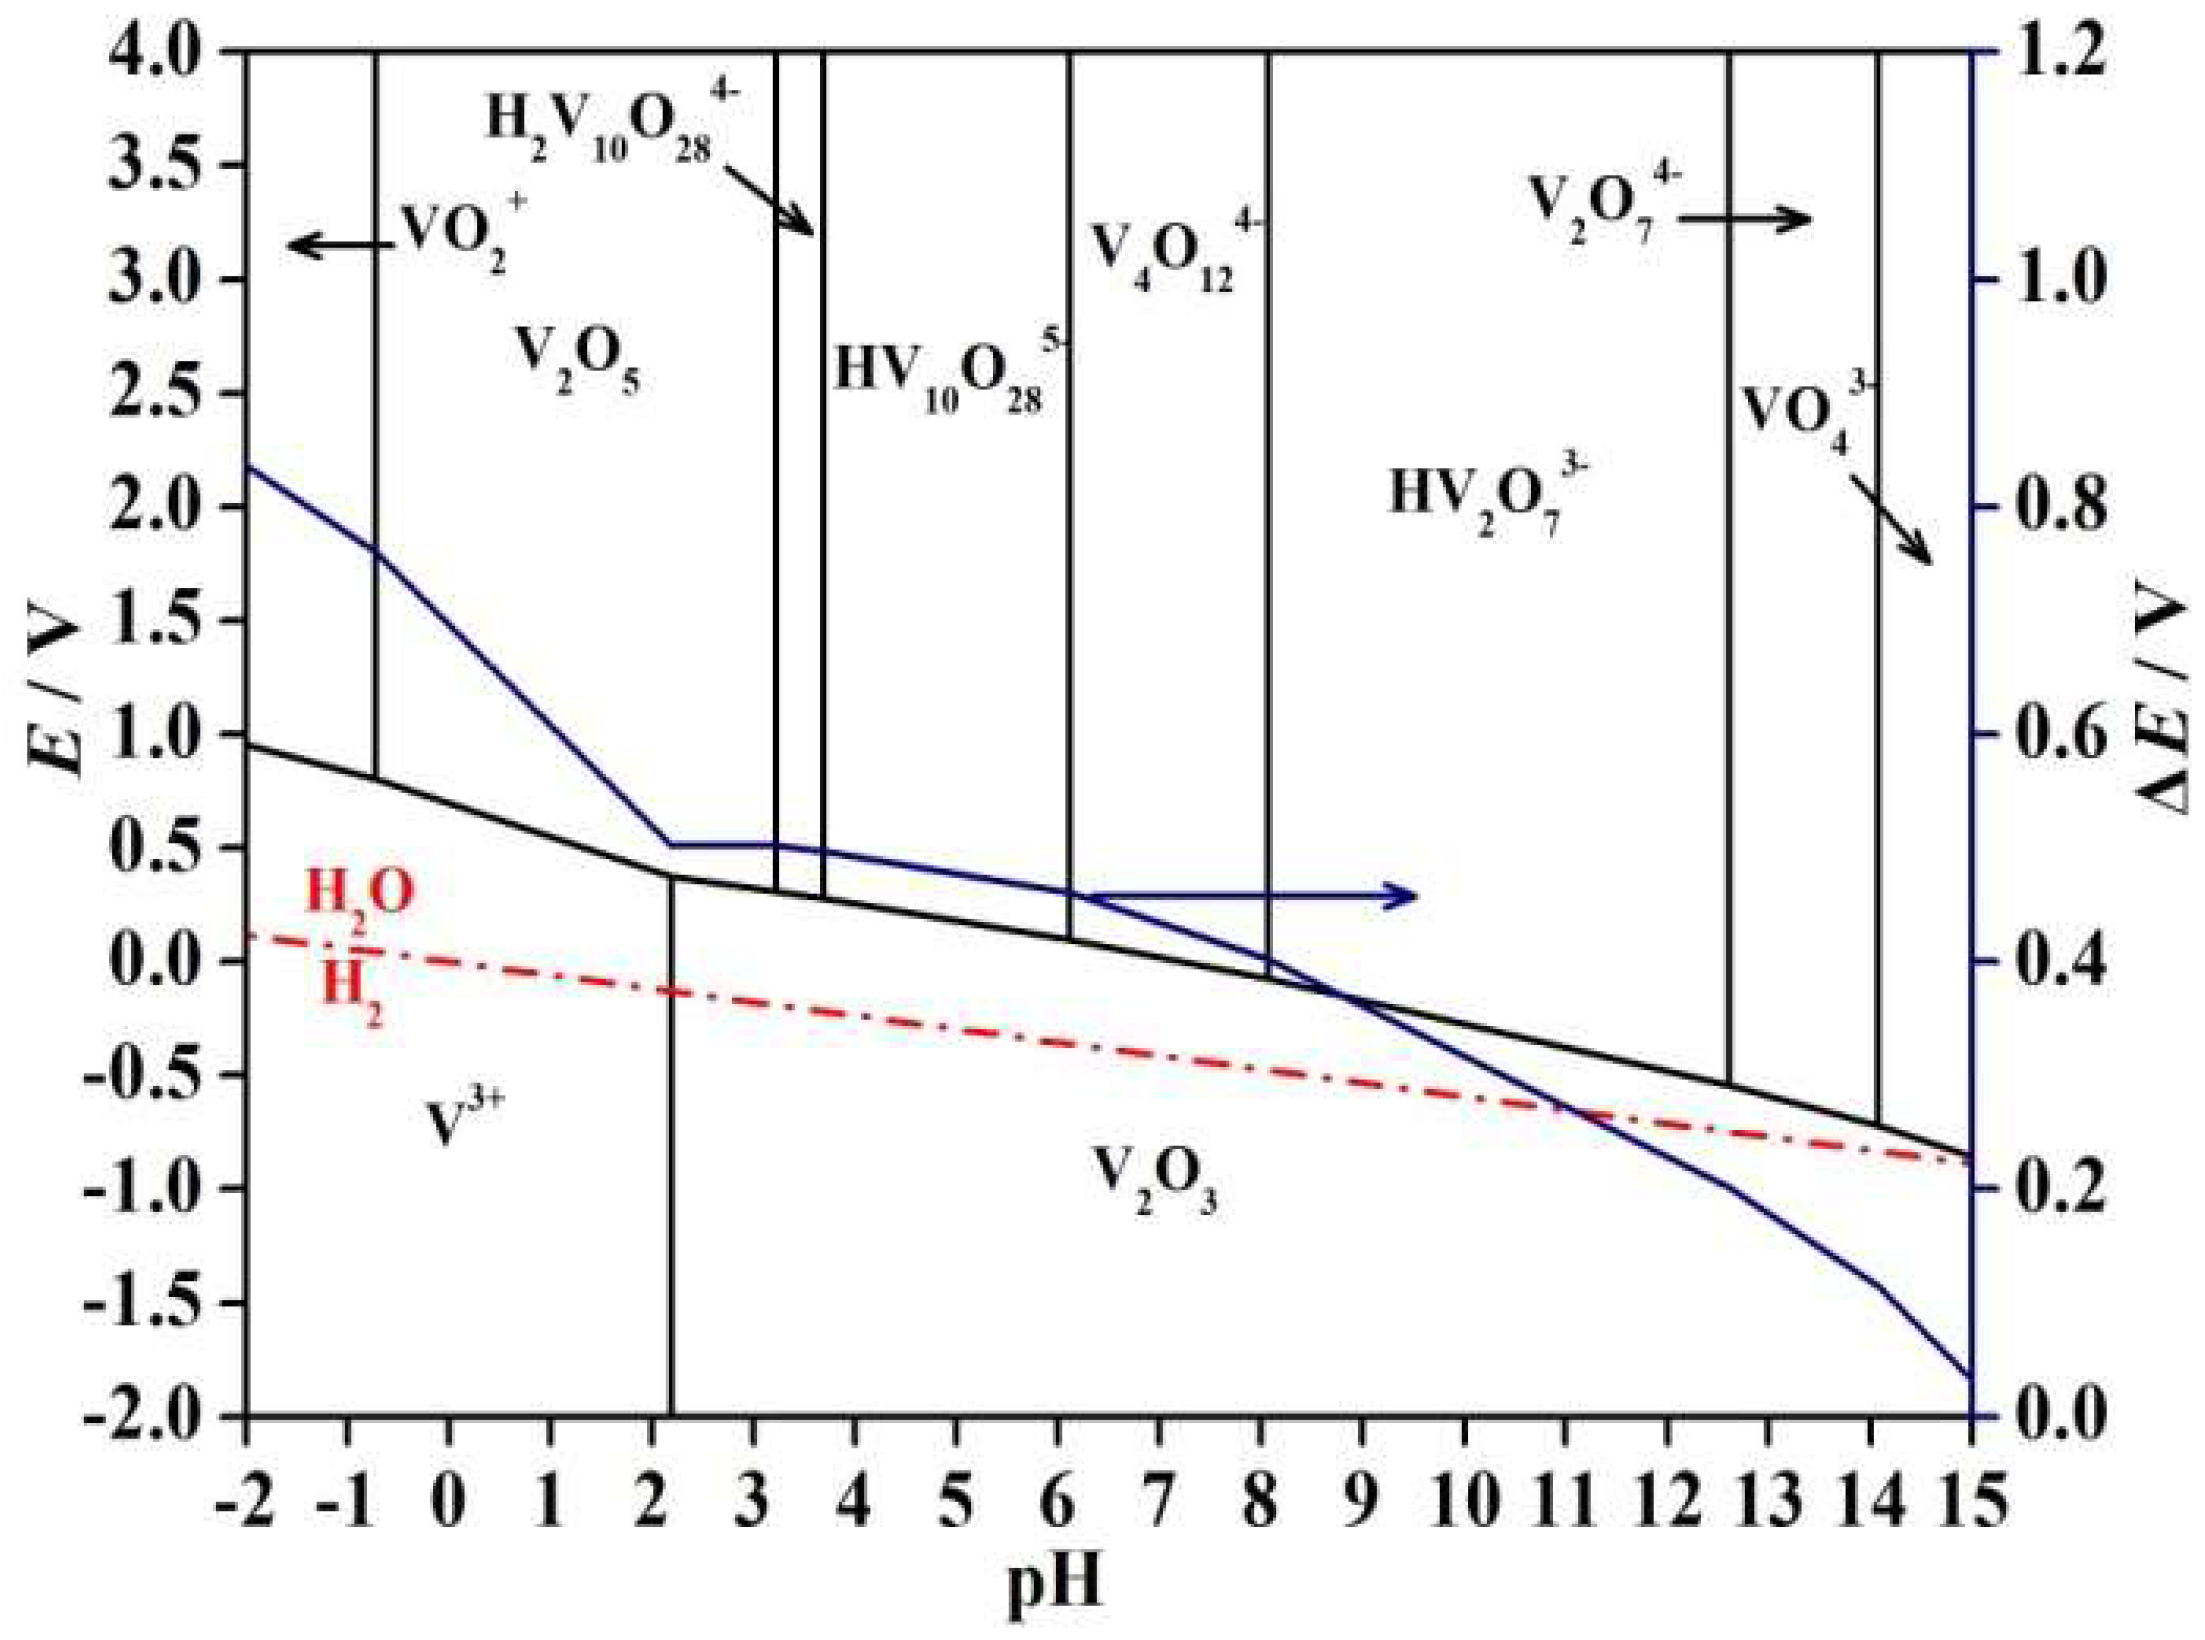
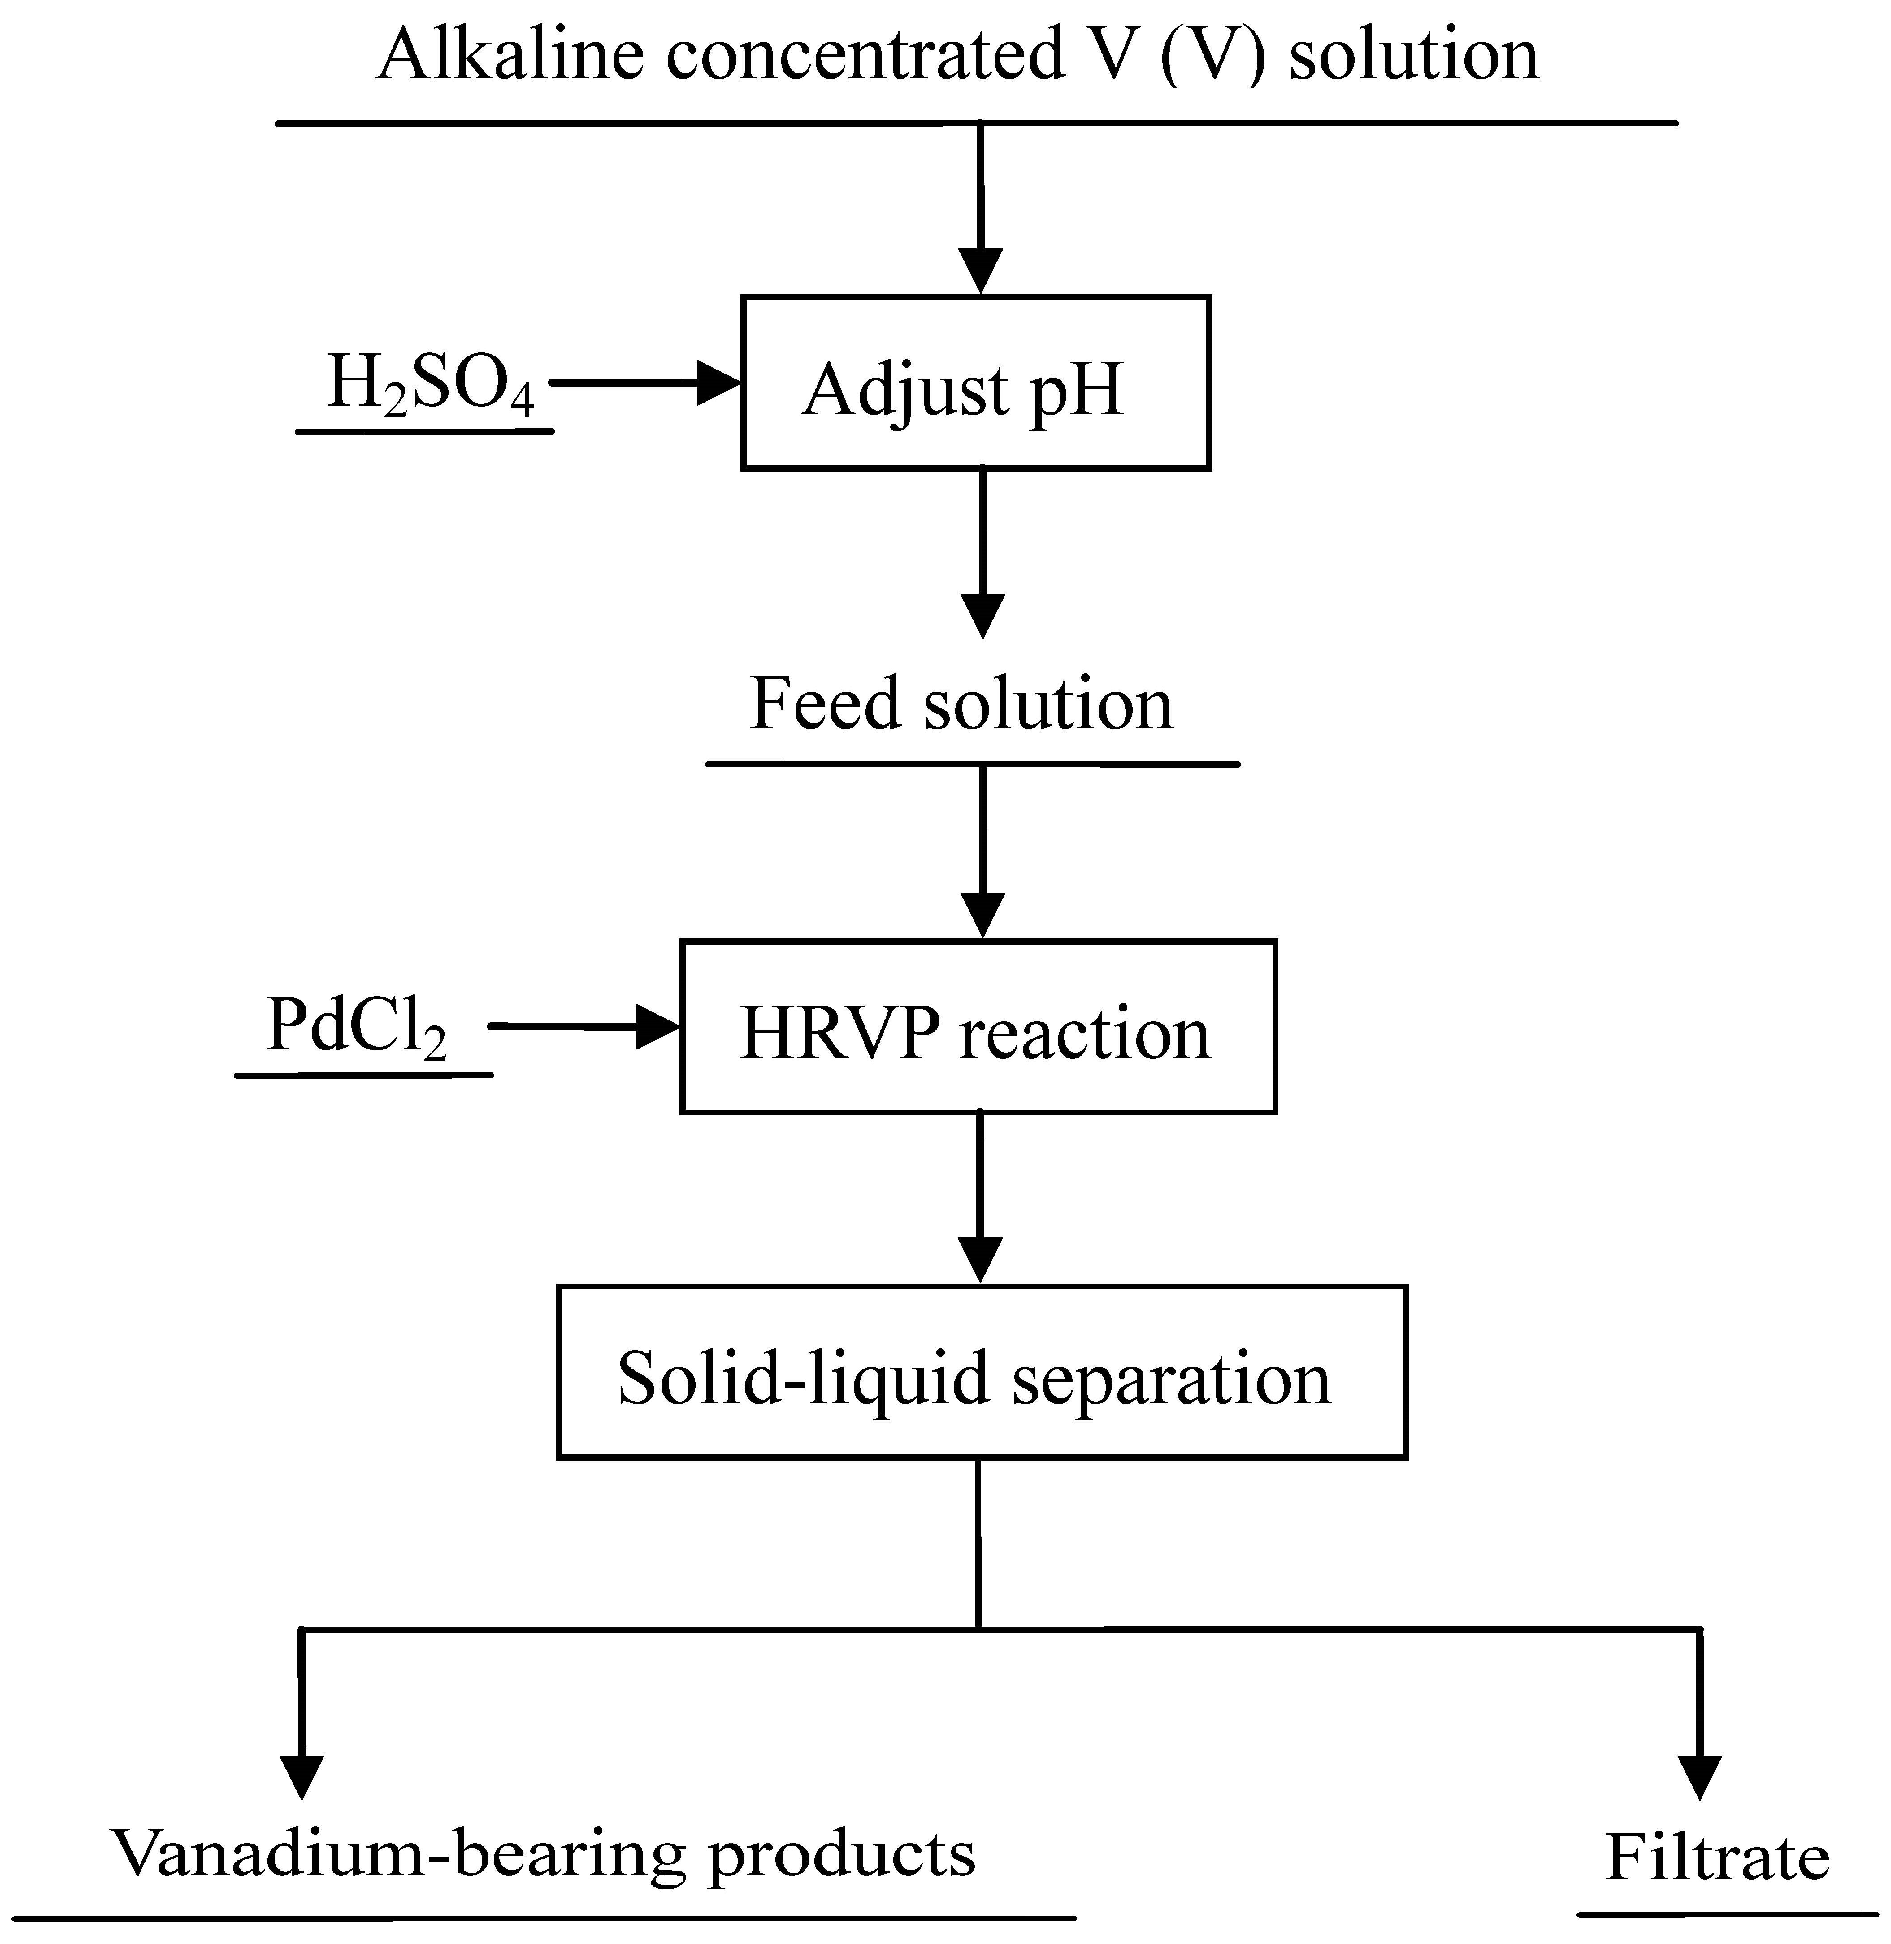
In our previous study [20], the overall reaction of the HRVP was proposed as Equation (1). The potential–pH diagram for V–H2O system at 298 K (Figure 1) was developed to investigate the thermodynamic feasibility of the HRVP reaction [20]. As shown in Figure 1, the electromotive force (ΔE) of the reaction is positive, which indicates this reaction is thermodynamically favourable. The proposed flowsheet of the HRVP process is shown in Figure 2 [20]. The optimum conditions in this process are as follows: feed solution pH value of 6.0, reaction temperature of 523 K, reaction times of 2 h and H2 partial pressure of 4 MPa [20]. In the present study, the flowsheet and the reaction conditions of the HRVP process were also used as the same as those in the previous study [20].
2.2.1. Preparation of Simulated Feed Vanadium Solutions
Firstly, V2O5 powders of 99.9% in purity were dissolved in the 500 mL NaOH (1 mol/L) solution to obtain the pure simulated concentrated vanadium (20 g/L) solution (except the experiments of the effects of sodium ions on the HRVP process). Then, Na3PO4 or Na2SiO3·9H2O were dissolved in the pure simulated concentrated vanadium solution to prepare the concentrated alkaline vanadium solutions with different concentrations of phosphorus and silicon. At last, the solutions were adjusted to pH value of 6.0 by using H2SO4 solution.
2.2.2. Vanadium Precipitation Procedure
Firstly, 5 mg PdCl2 was used as the catalyst [21] and transferred with 500 mL feed vanadium solution to a 1 L autoclave (Herein, PdCl2 is firstly reduced to metallic Pd by hydrogen, then the metallic Pd will absorb 700 times volume of hydrogen gas and turn the adsorbed hydrogen to activity hydrogen atom (H) for the reduction reaction [21]). Then, N2 gas was used to replace the air in the autoclave three times. Once the autoclave was heated to 523 K, hydrogen gas with 4 MPa pressure was injected to the autoclave. After two hours reaction at 523 K with a stirring rate of 800 rpm, the autoclave was cooled down to the room temperature. The slurry was collected from the autoclave and washed several times with deionized water during the filtration. Lastly, the precipitates were dried in a vacuum drying oven and then the vanadium-bearing products were obtained.
2.2.3. Characterizations
The pH value of solution was measured by a pH meter (PHS-3C, Shanghai Rex Instruments Factory, Shanghai, China). The concentrations of the elements except for vanadium in solutions and the precipitates were determined by inductively coupled plasma–optical emission spectroscopy (ICP–OES, Optima 4300DV, Perkin–Elmer, Waltham, MA, USA). The vanadium concentration of the solutions and the precipitates were detected by ferrous ammonium sulfate titration [22]. The surface morphology and the corresponding microchemical-analysis of the vanadium-bearing products were examined by scanning electron microscopy (SEM, JSM-IT300 JEOL Co., Tokyo, Japan) equipped with X-ray energy dispersive spectroscopy (EDS, Inca X-Act, Oxford Instruments, Oxford, UK). The phase composition of the precipitates was analyzed using the X-ray diffractometer (XRD, D/MAX-RB, Rigaku, Tokyo, Japan) equipped with Cu Kα radiation (λ = 0.15406 nm at 40 KV and 40 KA).
2.3.Data Treatment
The vanadium precipitation percentage can be calculated by using the Equation (2), in which η is the vanadium precipitation percentage (%), β is the vanadium concentration in the filtrate (mg/L), Vβ is the volume of the filtrate (L), α is the vanadium concentration in the feed solution (mg/L), Vα is the volume of the feed solution (L):
3. Results
3.1. The Results of the Effects of Sodium Ions
Usually the concentration of NaOH solution used for vanadium extraction ranges from 1 mol/L to 3 mol/L. In this study, the NaOH solutions with five different concentrations (1 mol/L, 1.5 mol/L, 2 mol/L, 2.5 mol/L, and 3 mol/L), which were numbered with 1#, 2#, 3#, 4# and 5#, were used to dissolve V2O5 powders for preparing the concentrated alkaline vanadium solutions with different concentrations of sodium ions. After that, the pH value of the concentrated alkaline vanadium solutions were adjusted to 6.0 by H2SO4 solution for the vanadium precipitation experiments. The main composition (vanadium and sodium ions) of the feed solutions is tabulated in Table 1.
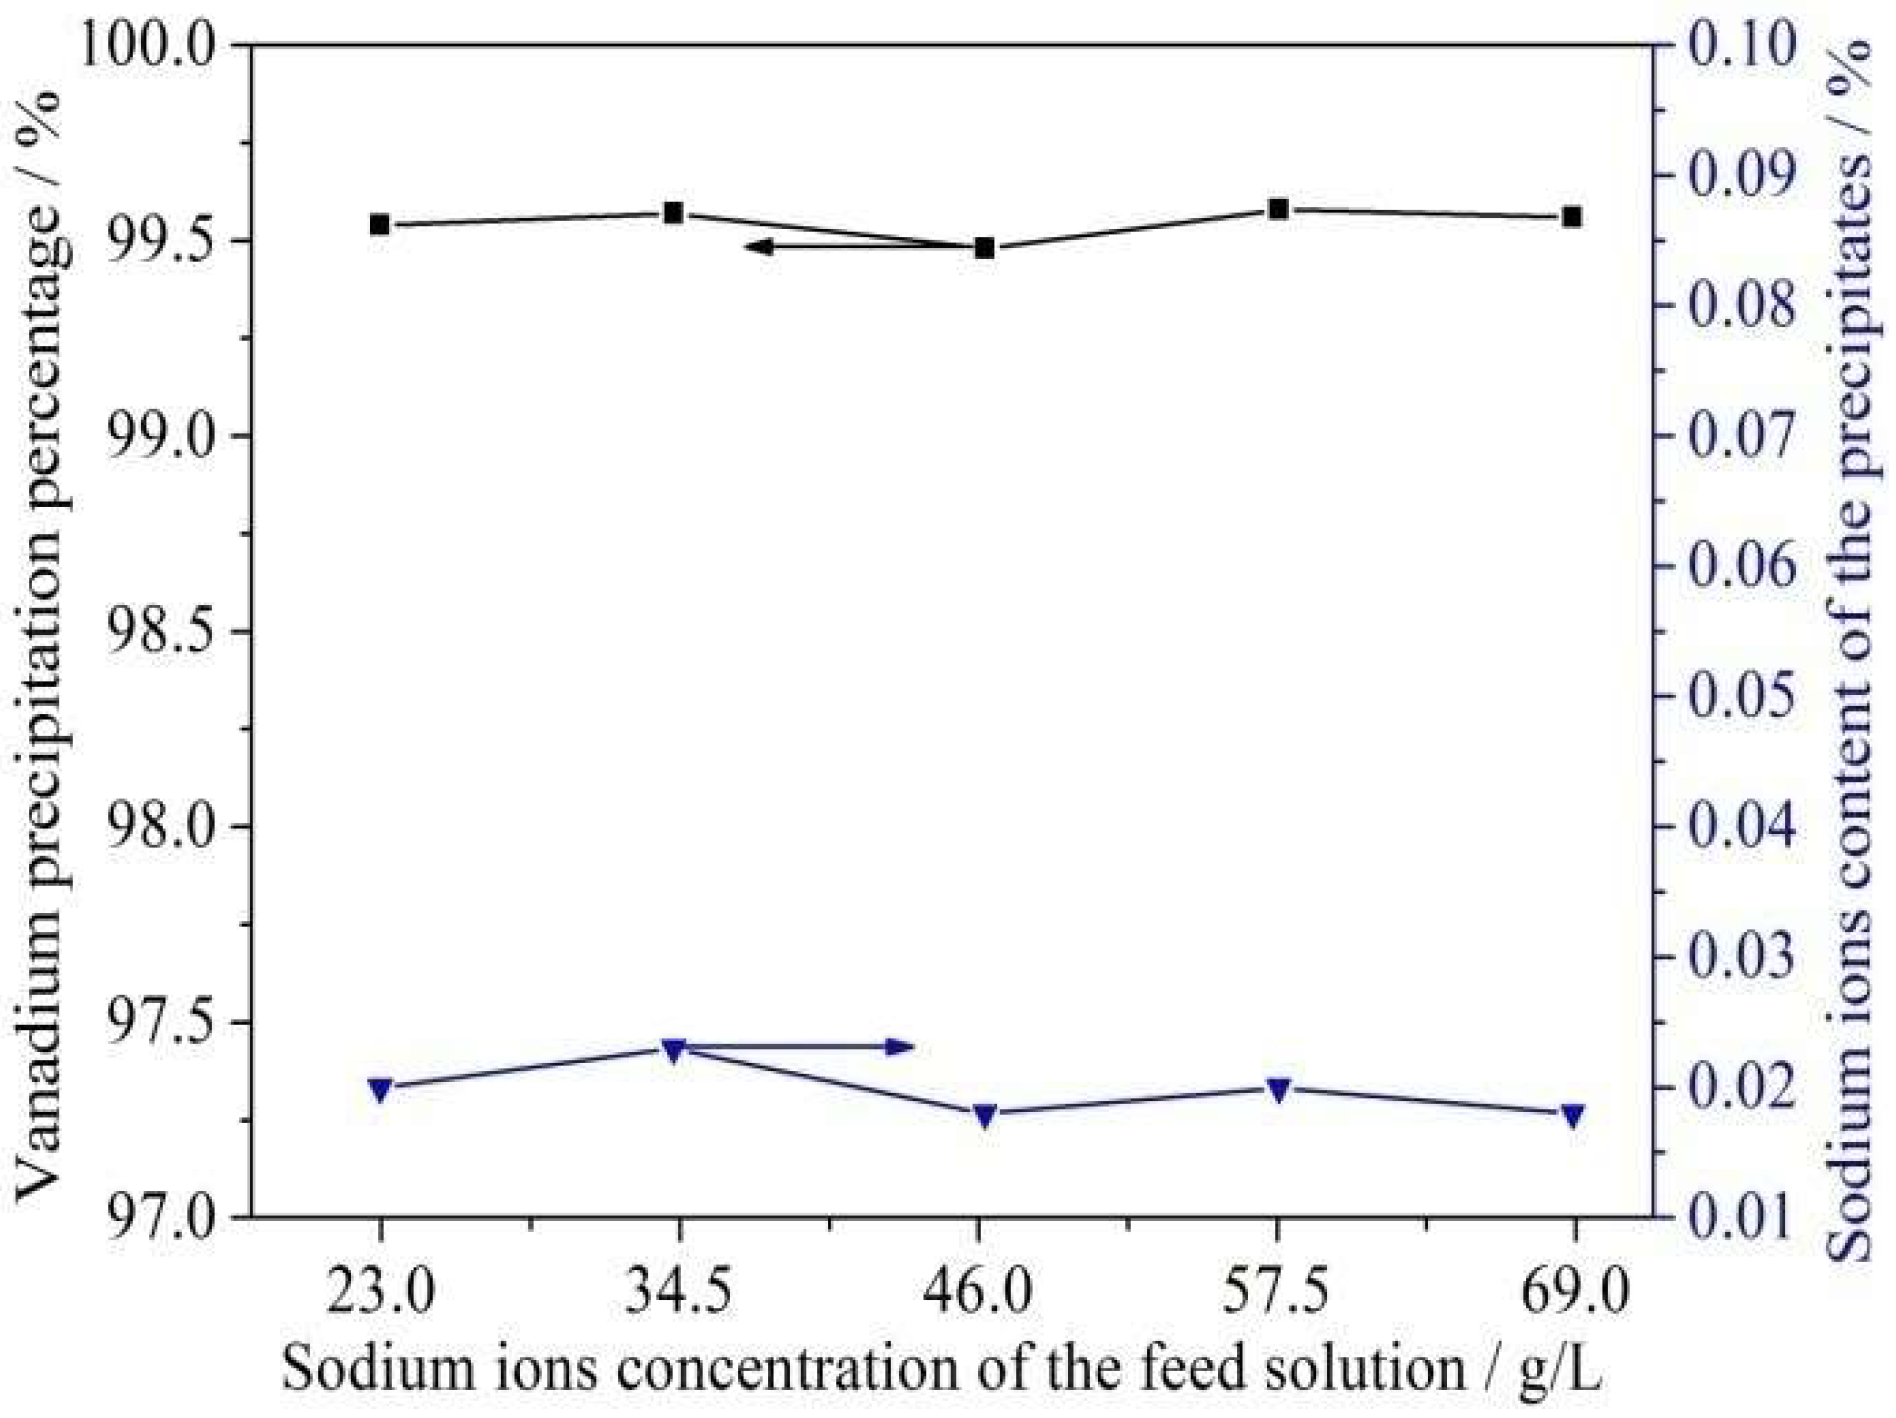
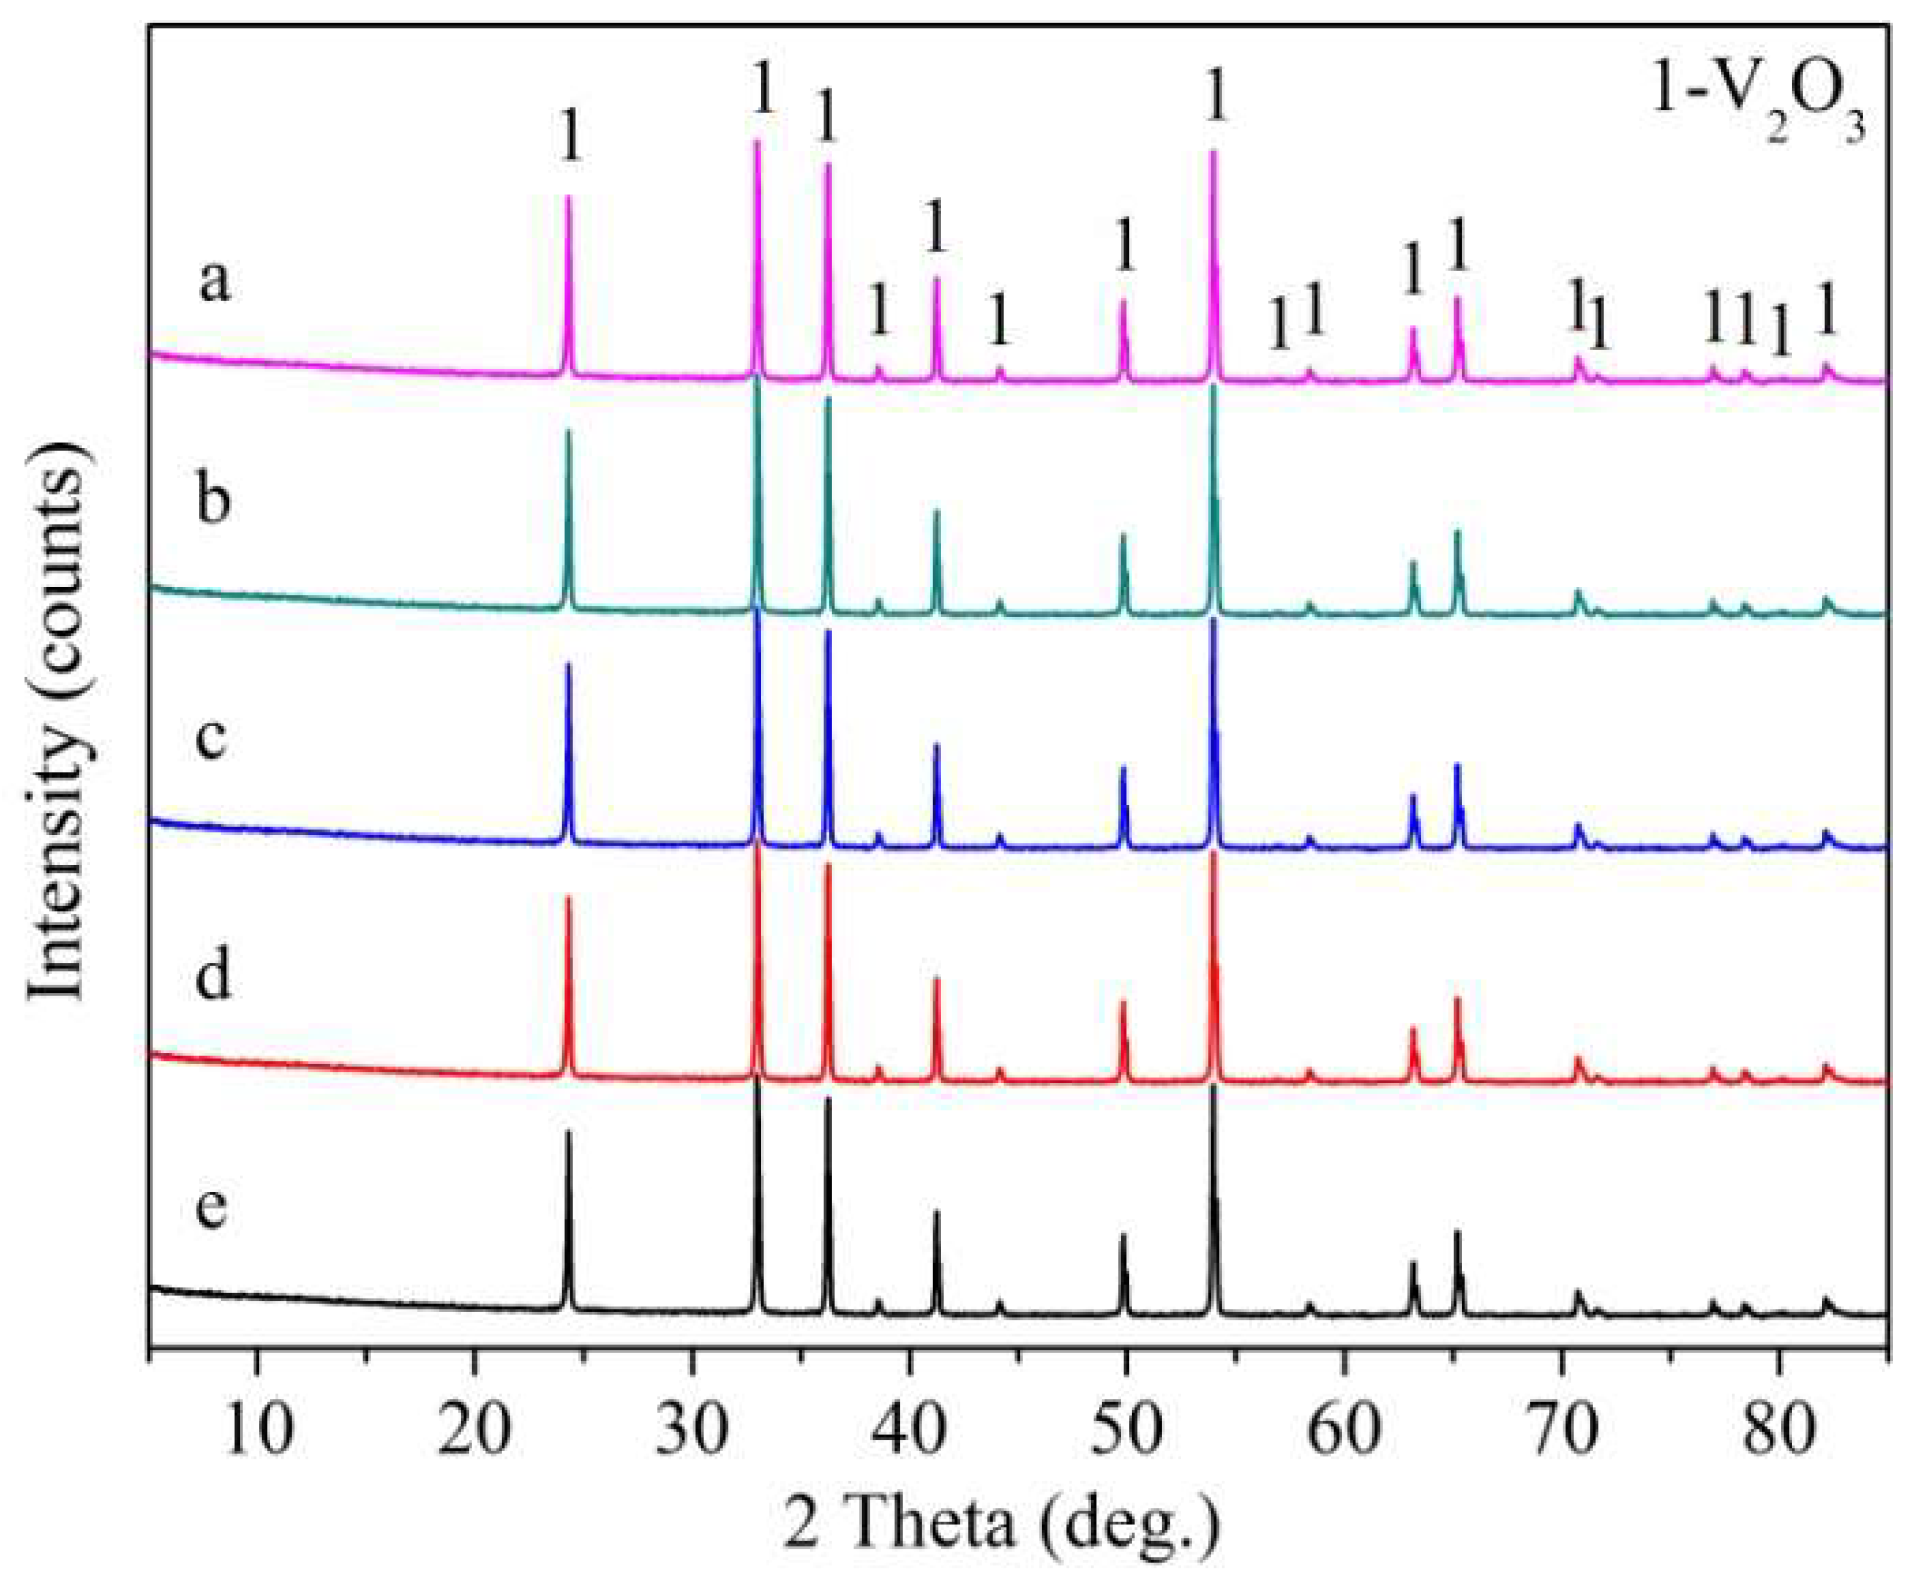
The effects of sodium ions concentration of the feed solution on the vanadium precipitation percentage and sodium ions content of the precipitates are shown in Figure 3. The phases of the precipitates are shown in Figure 4.
As shown in Figure 3, the vanadium precipitation percentage remained at about 99.5% and the sodium ions content of the precipitates remained at about 0.02% when the sodium ions concentration of the feed solution increased from 22.95 g/L to 68.87 g/L. Figure 4 shows that the diffraction peaks of the precipitates obtained at different sodium ions concentrations of the feed solution were all indexed to the aimed phase of V2O3.
3.2. The Results of the Effects of Phosphorus
In the alkaline-stripped vanadium solution, the concentration of phosphorus was usually below 0.1 g/L, due to the high selectivity of the solvent extraction process. It is known that the selectivity of ion exchange process is lower than that of solvent extraction process. So the concentration of phosphorus in the alkaline desorption vanadium solution usually ranges from 0.1 g/L to 0.5 g/L. In contrast, in the process of circulating alkaline leaching, phosphorus can be leached from the raw ore with vanadium by NaOH solution. The concentration of phosphorus in the alkaline vanadium leaching solution is usually higher than 1 g/L.
In order to simulate the concentrated alkaline vanadium solutions, six feed solutions with the phosphorus concentration ranges from about 0.05 g/L to about 3 g/L, which were numbered from 6# to 11#, were prepared. The main composition (vanadium, phosphorus, and sodium ions) of the feed solutions is tabulated in Table 2.
The effects of different phosphorus concentrations of the feed solutions on the vanadium precipitation percentage and the contents of phosphorus and sodium ions in the precipitates are shown in Figure 5 and Figure 6, respectively. The XRD and SEM-EDS analysis of the precipitates obtained at different phosphorus concentrations of the feed solutions were developed, and the results are shown in Figure 7 and Figure 8, respectively.
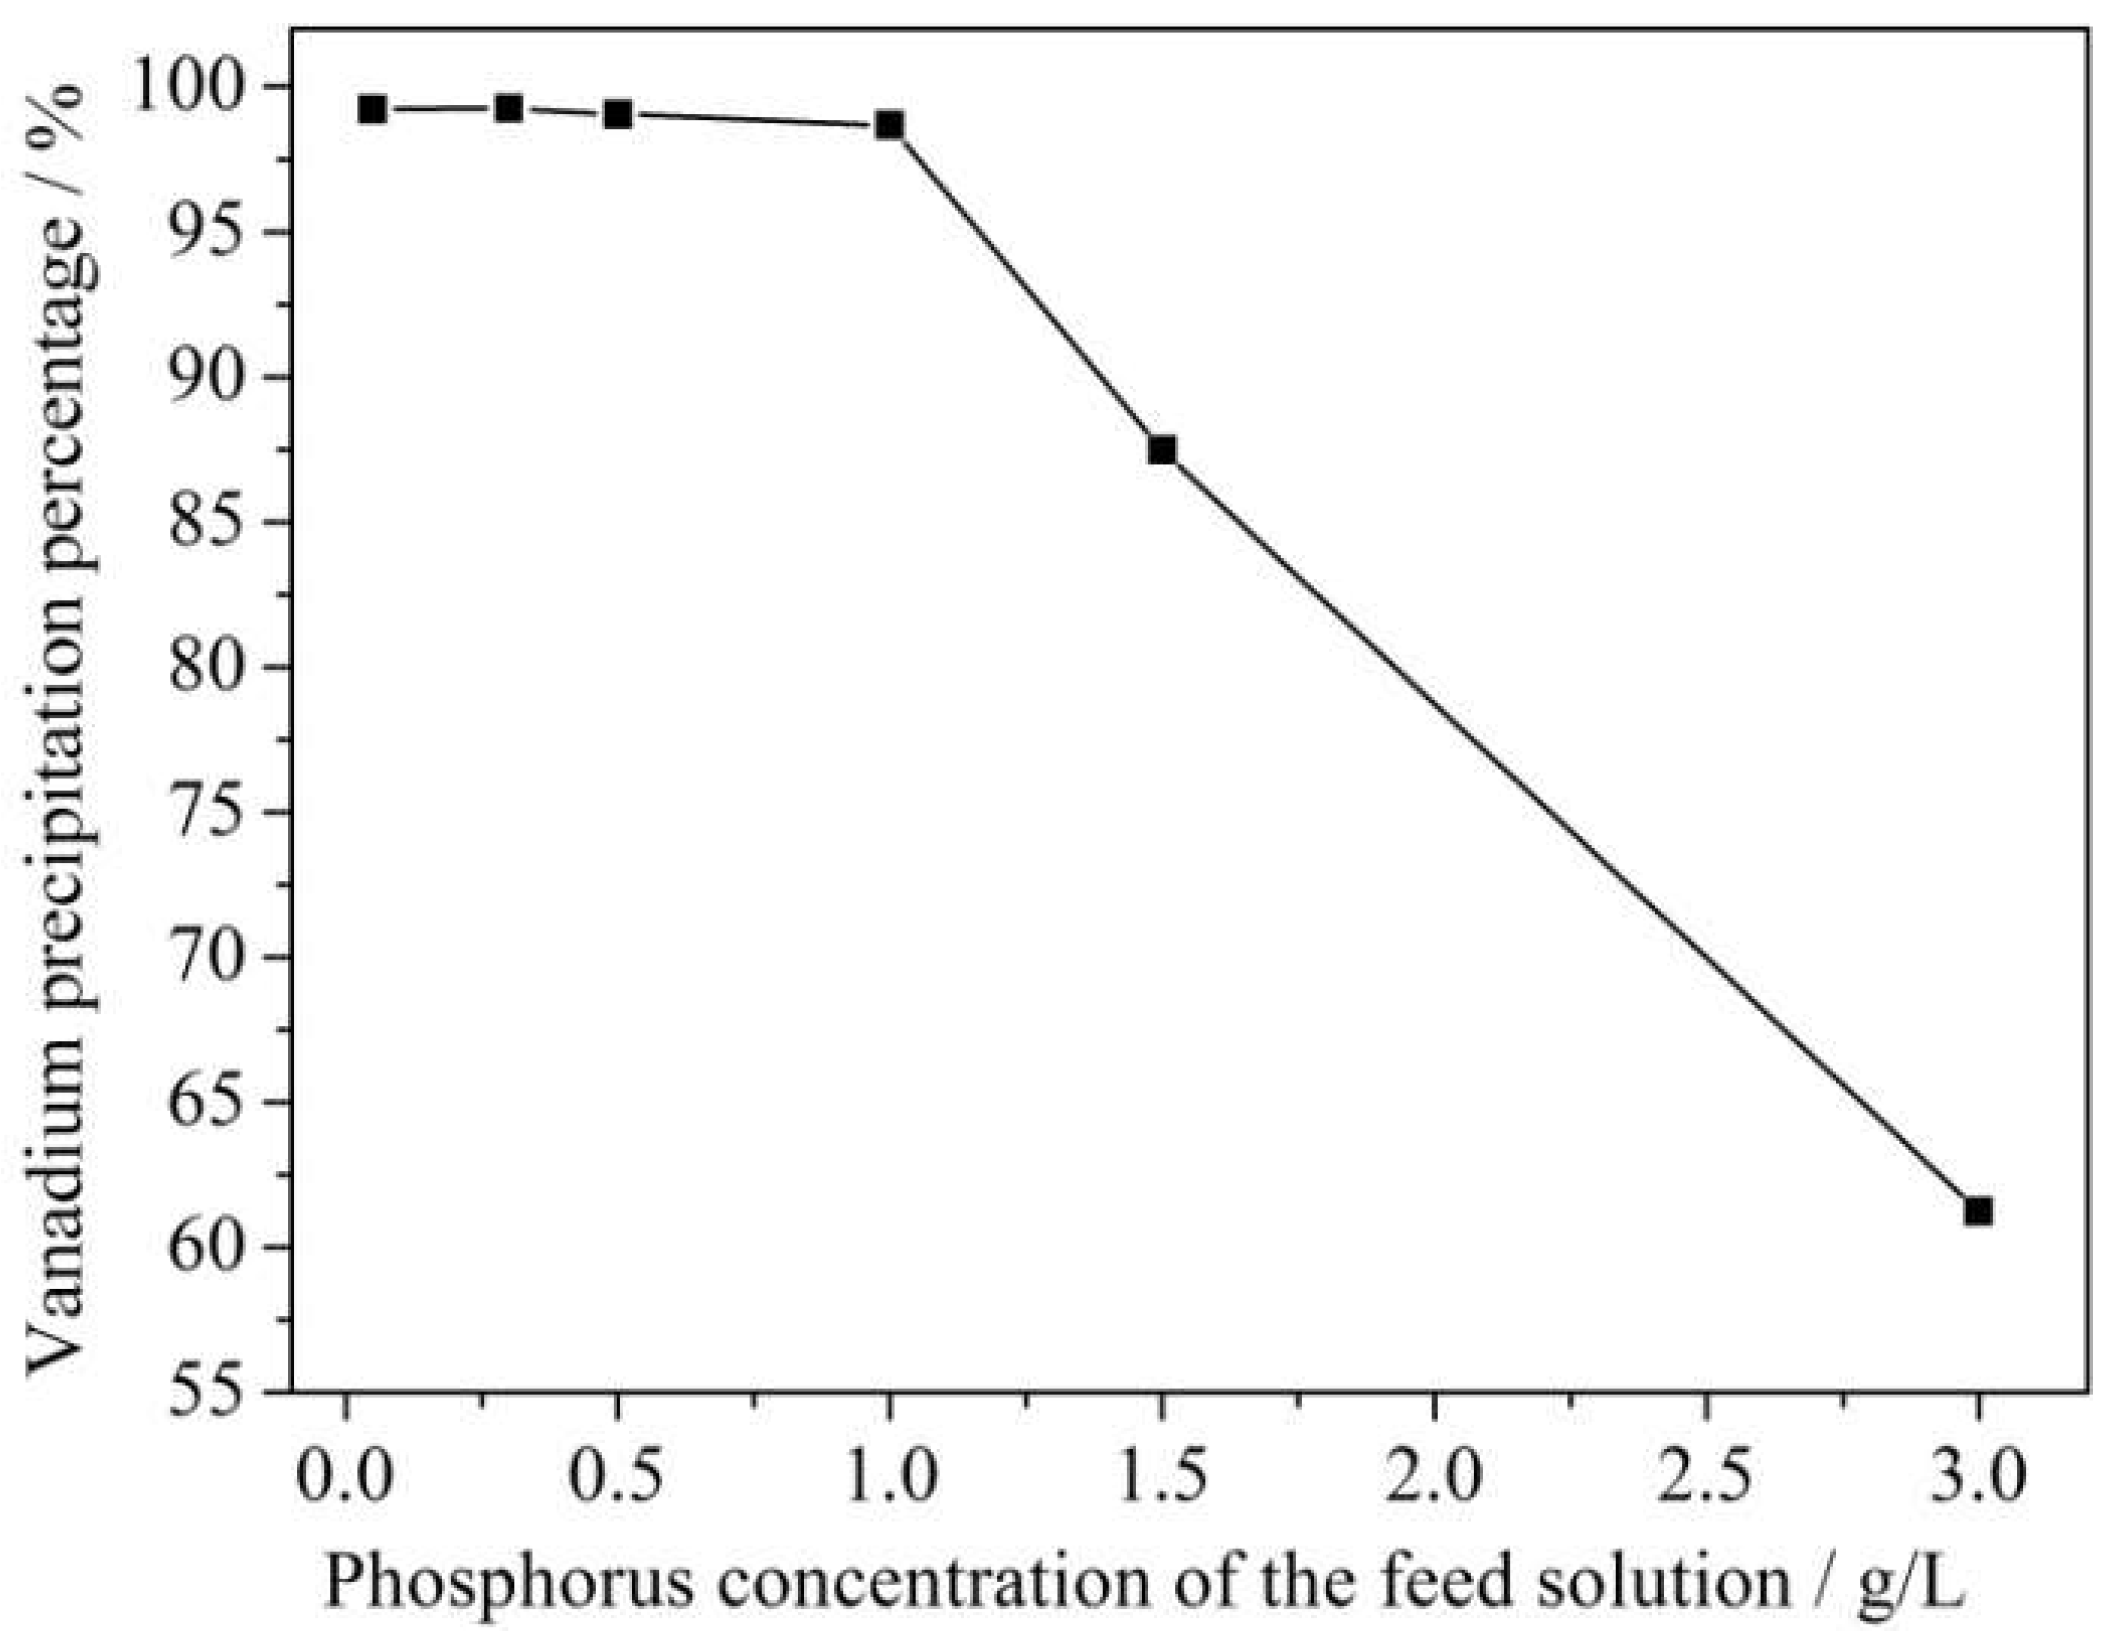
As shown in Figure 5, the vanadium precipitation percentage can still remain at about 99%, as the phosphorus concentration of the feed solution increases from 0.05 g/L to 1 g/L. However, as the phosphorus concentration of the feed solution increased from 1 g/L to 3 g/L, the vanadium precipitation percentage dramatically decreased from 98.7% to 61.3%. It indicates that the efficiency of the HRVP reaction can be influenced by phosphorus concentration in the feed solution.
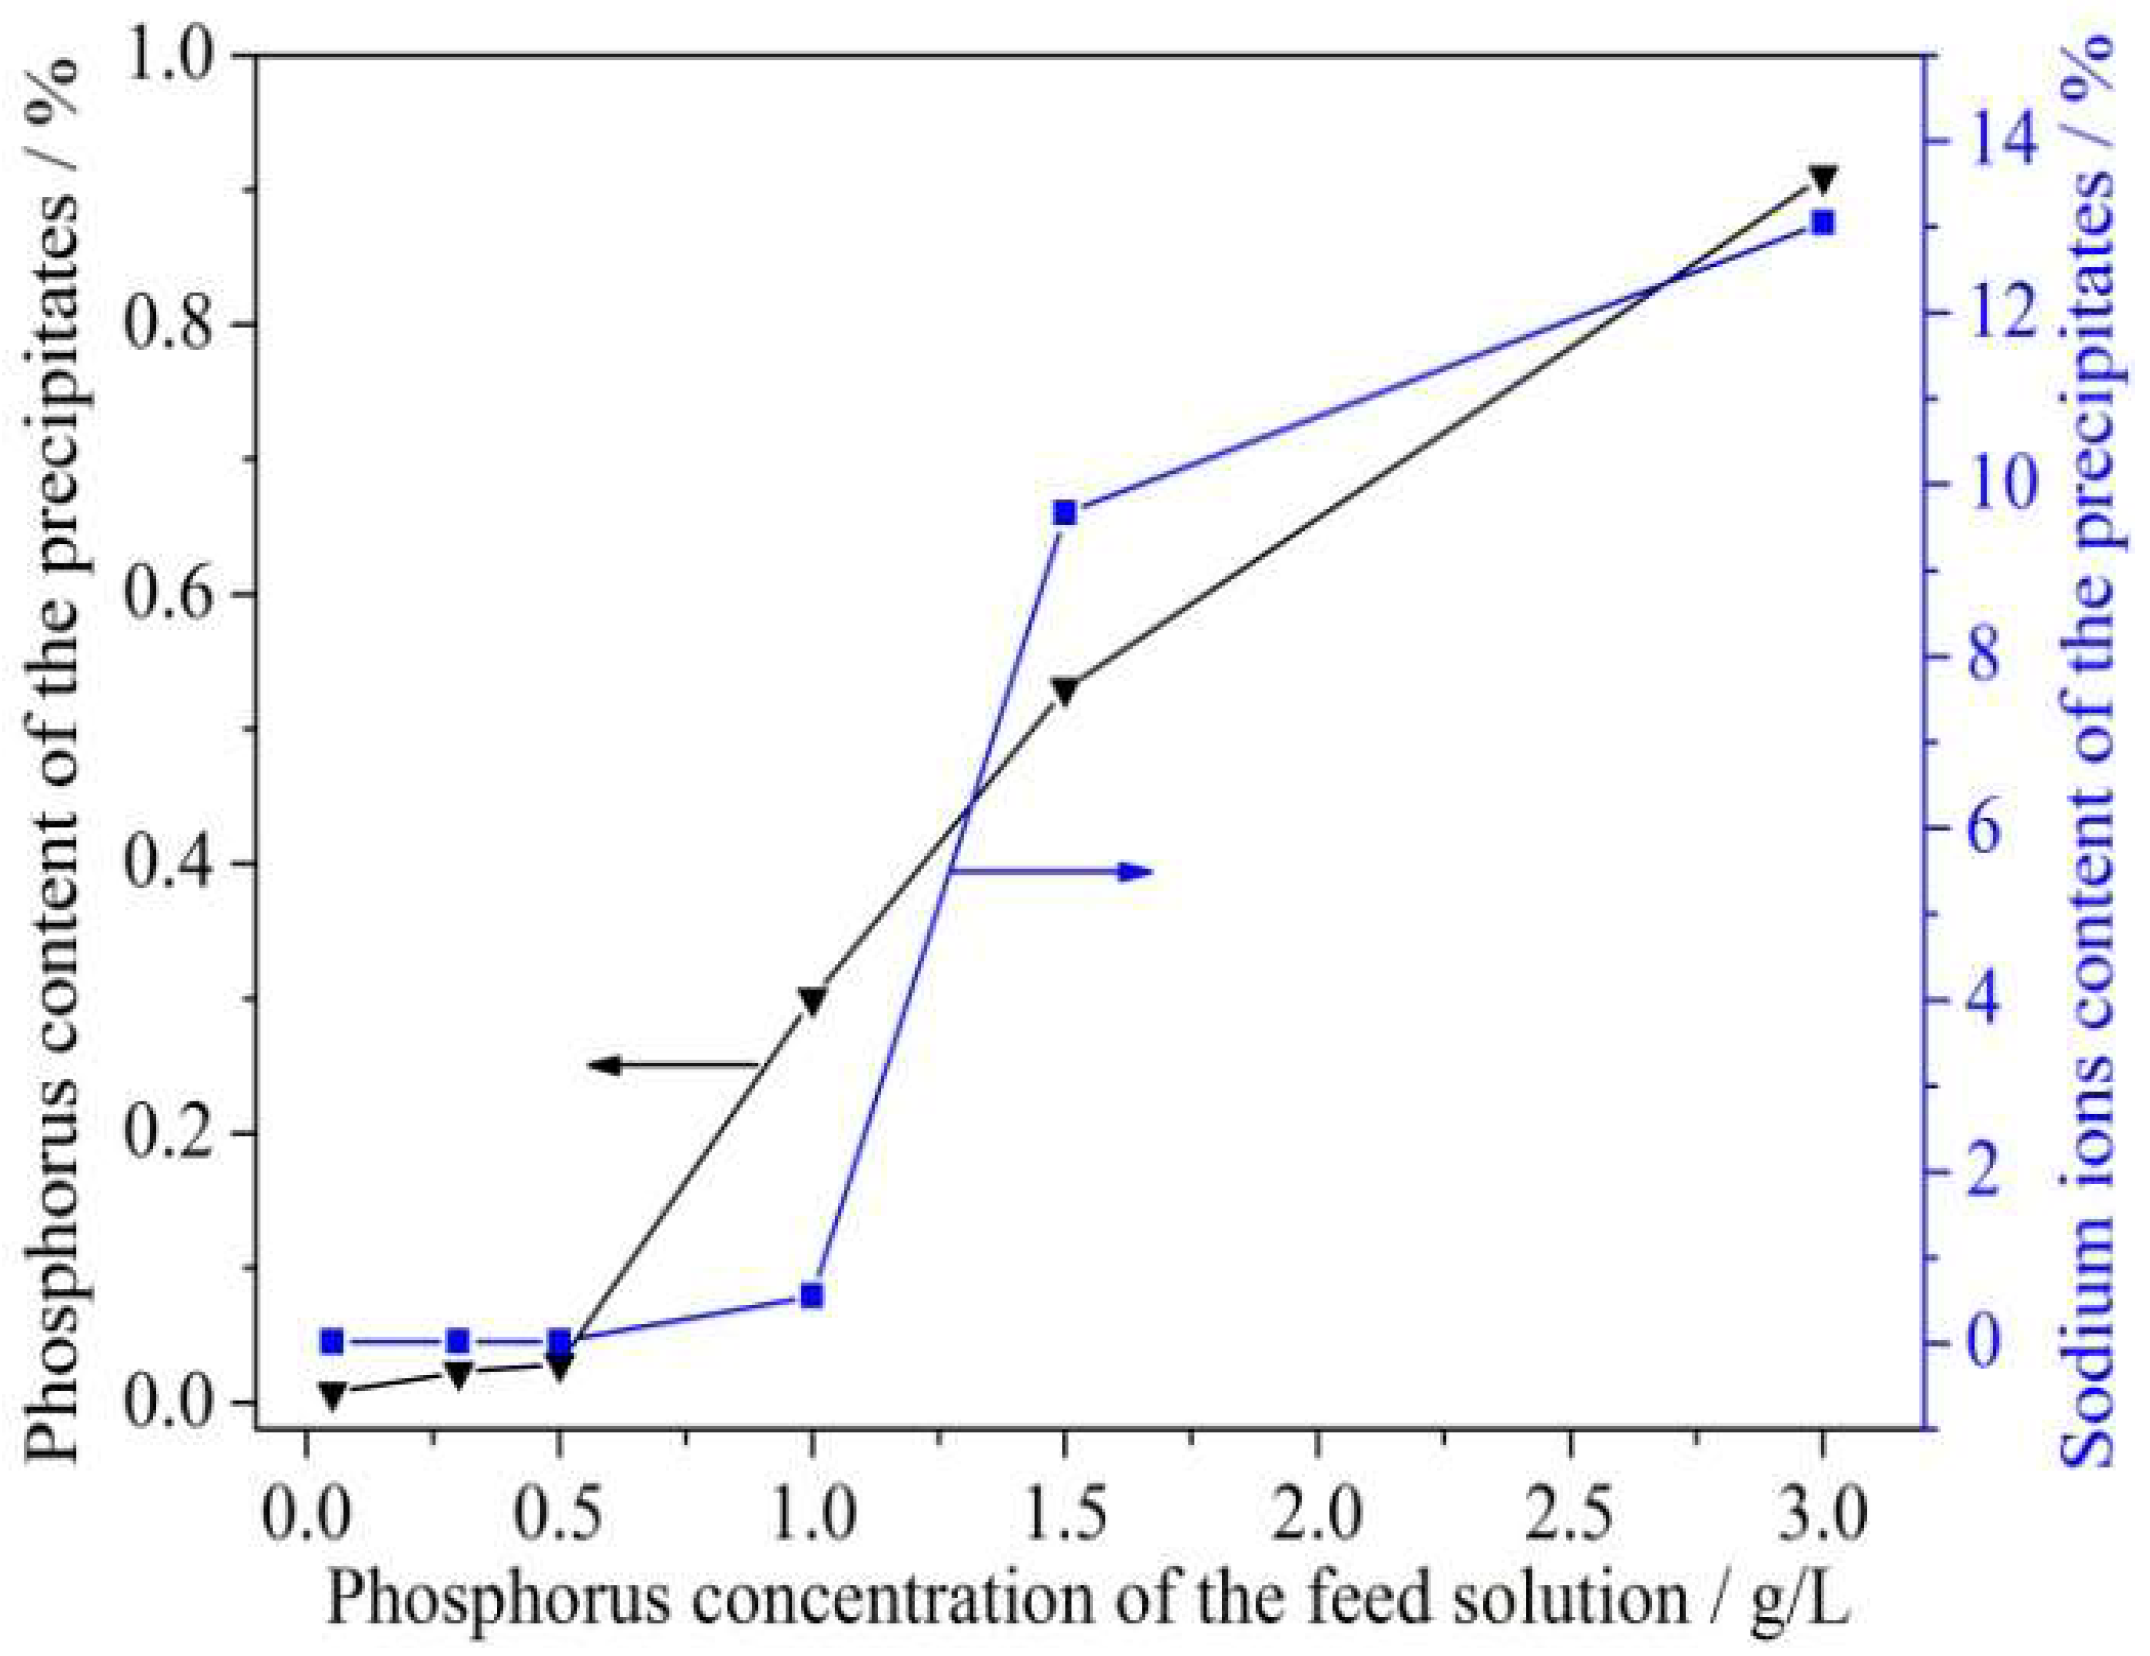
Figure 6 shows that the phosphorus content of the precipitates slightly increased from 0.008% to 0.029% as the phosphorus concentration of the feed solution increased from 0.05 g/L to 0.5 g/L. After that, when the phosphorus concentration of the feed solution increased from 0.5 g/L to 3 g/L the phosphorus content of the precipitates considerably increased from 0.029% to 0.91%. Similarly, the sodium ions content of the precipitates had no significant change as the phosphorus concentration of the feed solution increased from 0.05 g/L to 0.5 g/L. Besides, the sodium ions content of the precipitates increased from 0.02% to 9.7% when the phosphorus concentration of the feed solution increased from 0.5 g/L to 3 g/L.
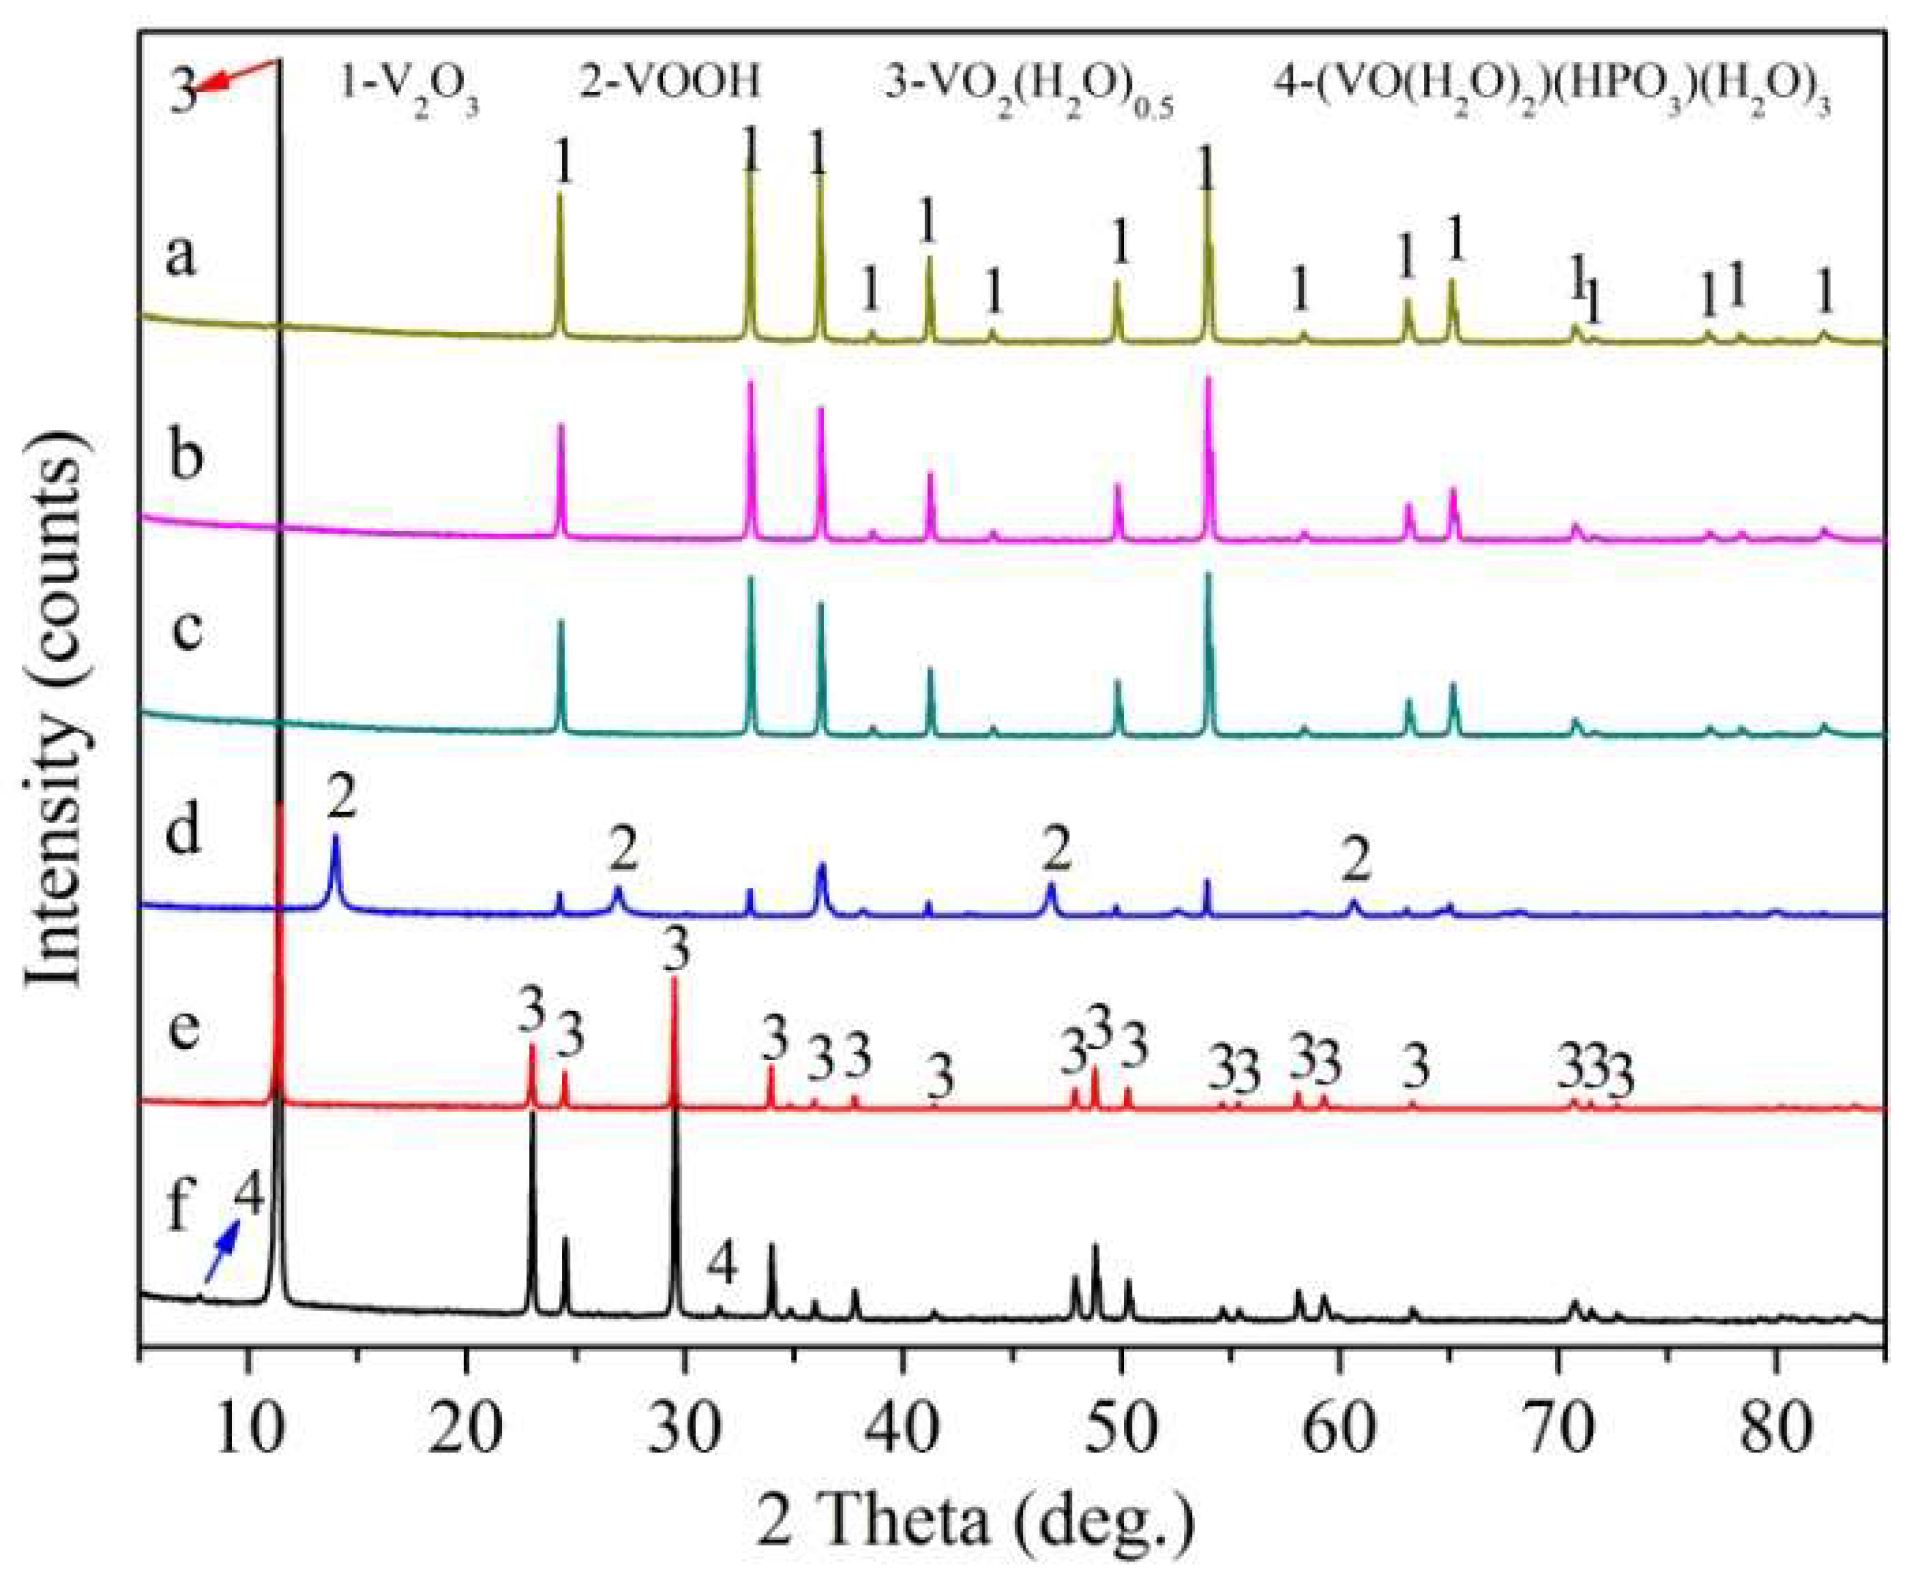
Figure 7 shows that all the diffraction peaks can be indexed to the aimed phase of V2O3 when the phosphorus concentration of the feed solution ranged from 0.05 g/L to 0.5 g/L. As the phosphorus concentration of the feed solution reached 1 g/L, the precipitates were a mixture of VOOH and V2O3. After that, only the intermediate products of VO2(H2O)0.5 could be obtained, as the phosphorus concentration of the feed solution was above 1.5 g/L. It is noted that the diffraction peaks indexed to the phase of (VO(H2O)2)(HPO3)(H2O)3 could be found when the phosphorus concentration of the feed solution increased to 3 g/L. The results indicate that when the phosphorus concentration of the feed solution was above 0.5 g/L, the HRVP reaction would not be completed so that the precipitates could not be reduced to the final products of V2O3.
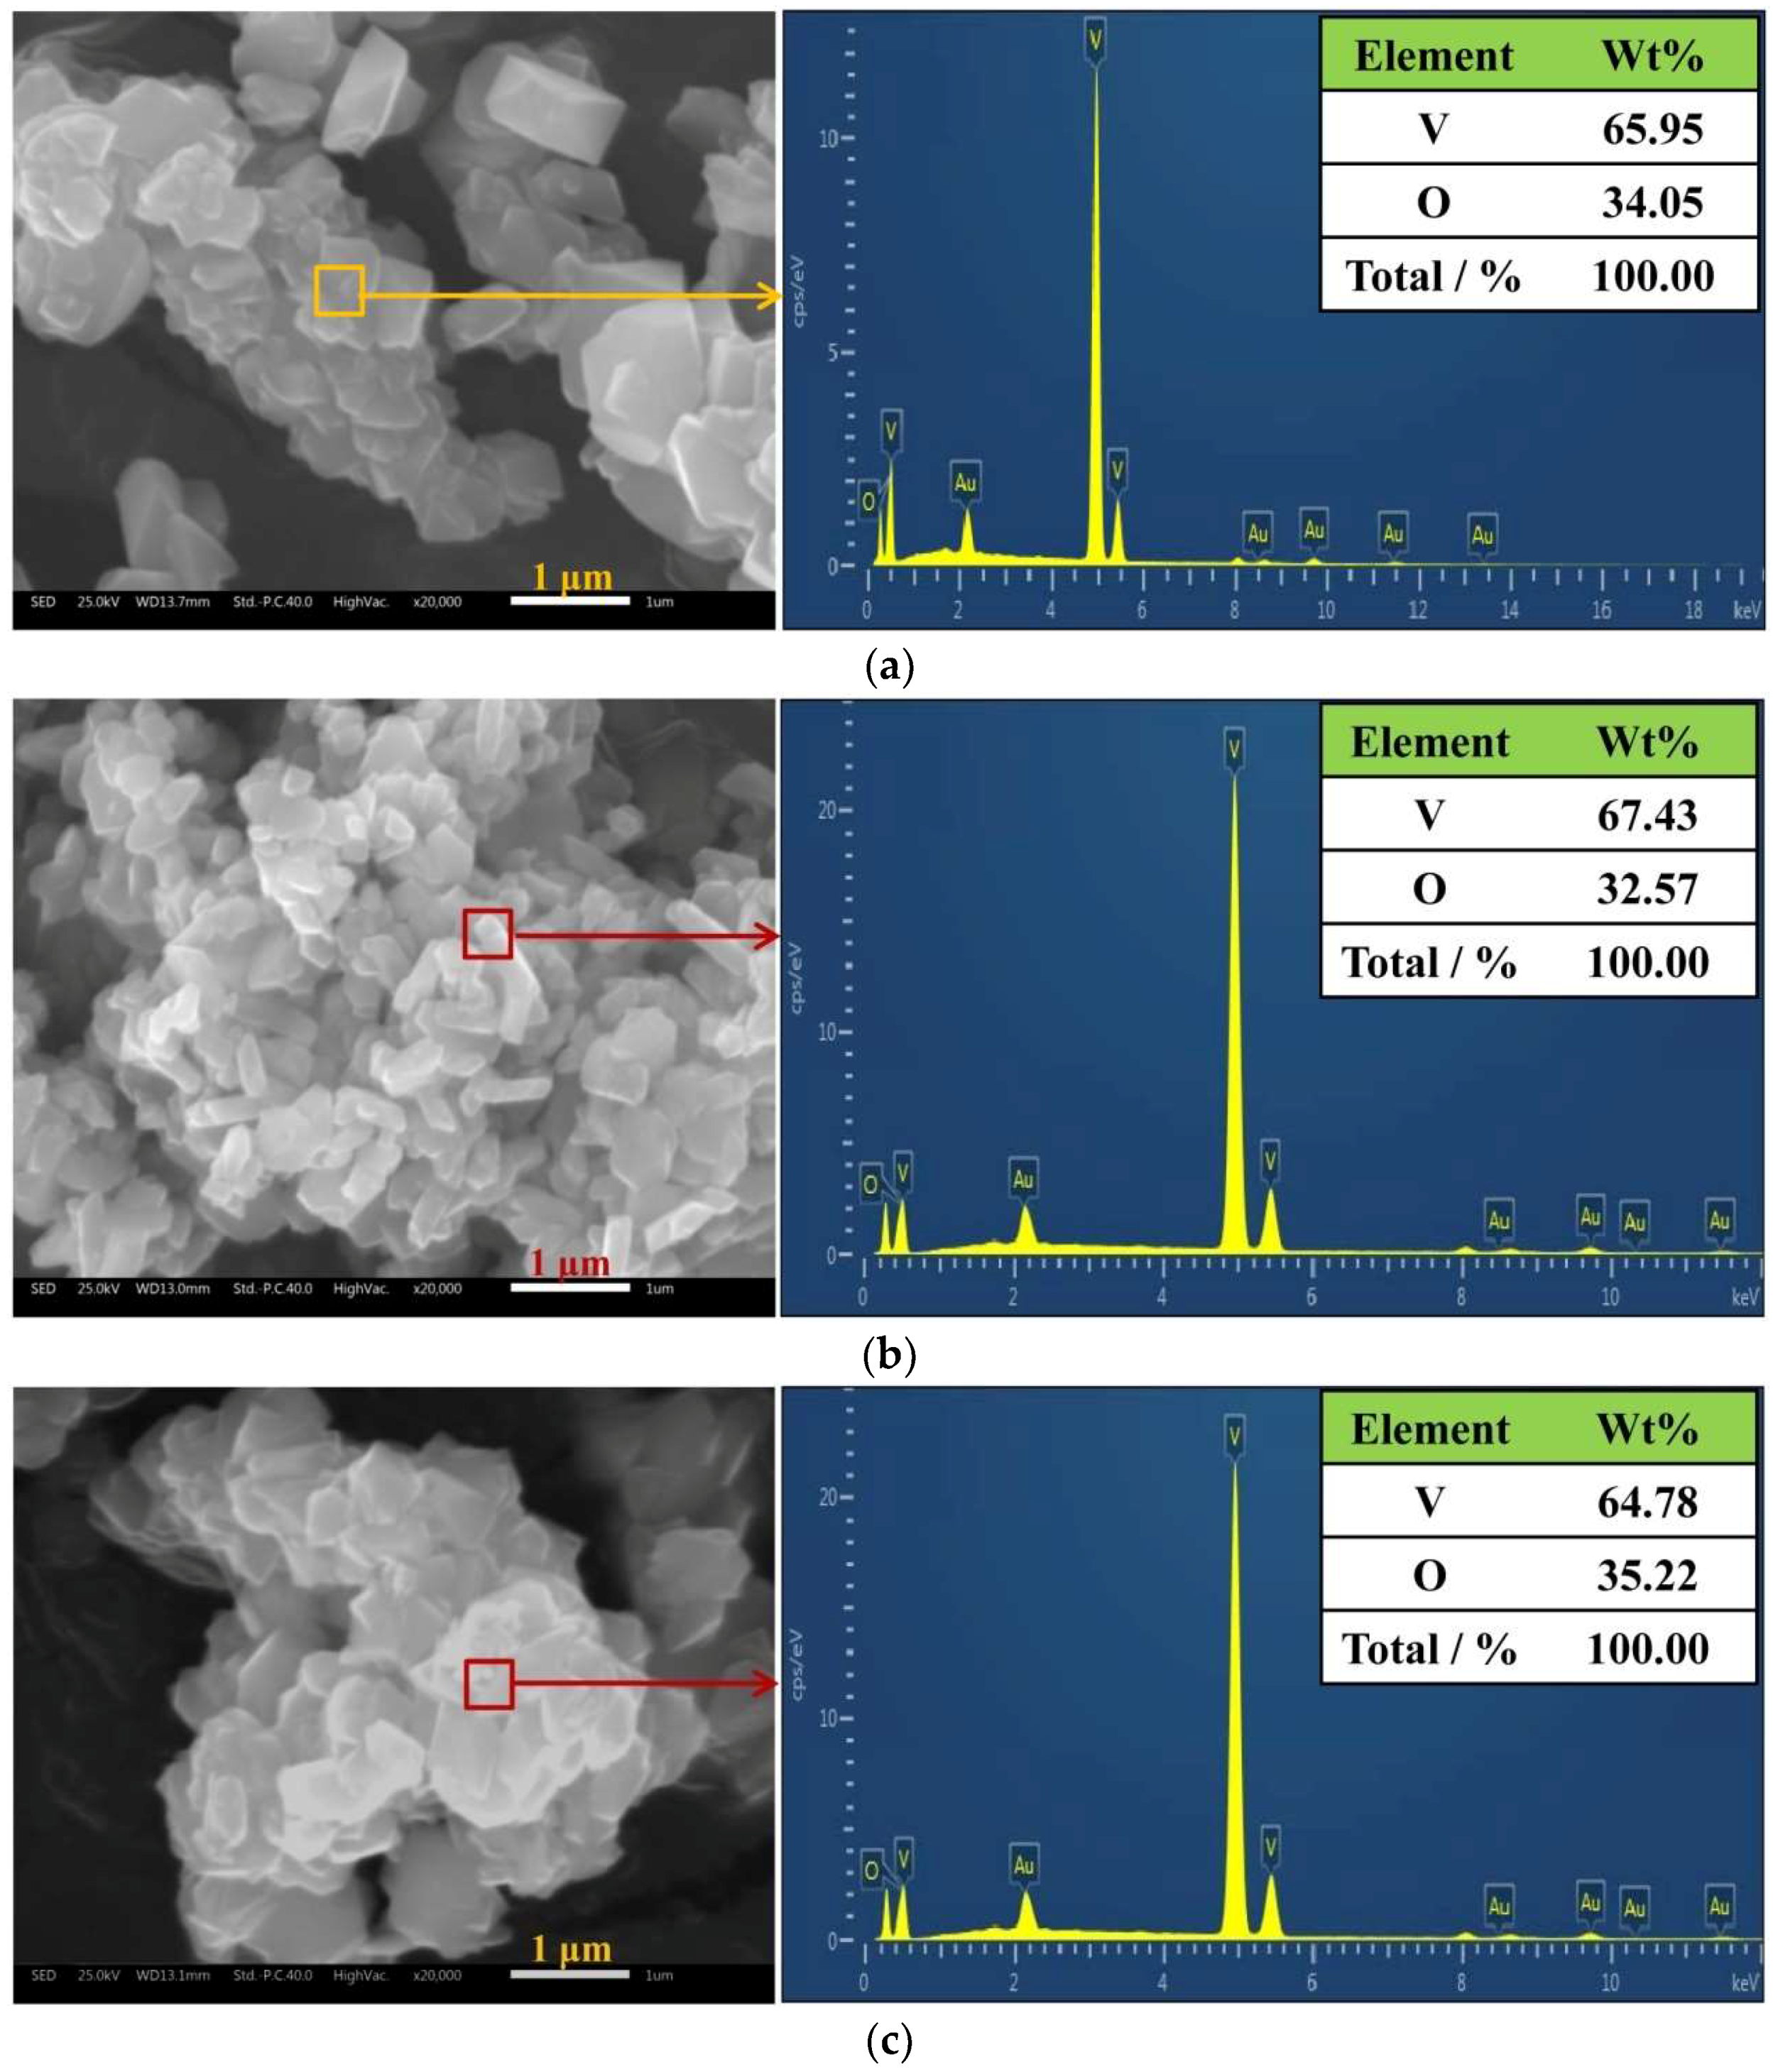
Through SEM-EDS analysis (Figure 8), it can be seen that when the phosphorus concentration of the feed solution ranged from 0.05 g/L to 0.5 g/L, the obtained V2O3 crystals demonstrated a granular structure with smooth surface. Furthermore, the granular crystals closely aggregated with each other for crystallization. Almost no other elements could be detected in the crystals through the EDS analysis, except for the aimed elements of V and O. As the phosphorus concentration of the feed solution increases to 1 g/L, the morphology of the mixture of VOOH and V2O3 crystals demonstrated sheet structures. The phosphorus and sodium ions are detected with the content of 0.22% and 0.75% respectively according to the EDS analysis. When the phosphorus concentration of the feed solution increases from 1.5 g/L to 3 g/L, the morphology of the VO2(H2O)0.5 crystals are of sheet structures with rough surface. According to the EDS analysis, when the content of phosphorus increases from 0.75% to 1.02%, the content of sodium ions increases from 8.67% to 12.58%. Moreover, the distribution of sodium ions in the precipitates was highly correlated with vanadium and oxygen (as shown in Figure 8e).
3.3. The Results of the Effects of Silicon
The concentration ranges of silicon in the concentrated alkaline vanadium solutions obtained by different vanadium extraction processes were similar to that of the concentration ranges of phosphorus. In the alkaline-stripped vanadium solution, the concentration of silicon was usually below 0.1 g/L. The concentration of silicon in the alkaline desorption vanadium solution usually ranged from 0.1 g/L to 1 g/L. In contrast, the concentration of silicon in the alkaline vanadium leaching solution was usually higher than 1 g/L.
In order to simulate the concentrated alkaline vanadium solutions, the silicon concentration of seven feed solutions ranged from approximately 0.1 g/L to 3 g/L, which were numbered from 12# to 18#, were prepared. The main composition (vanadium, silicon and sodium ions) of the feed solutions is tabulated in Table 3.
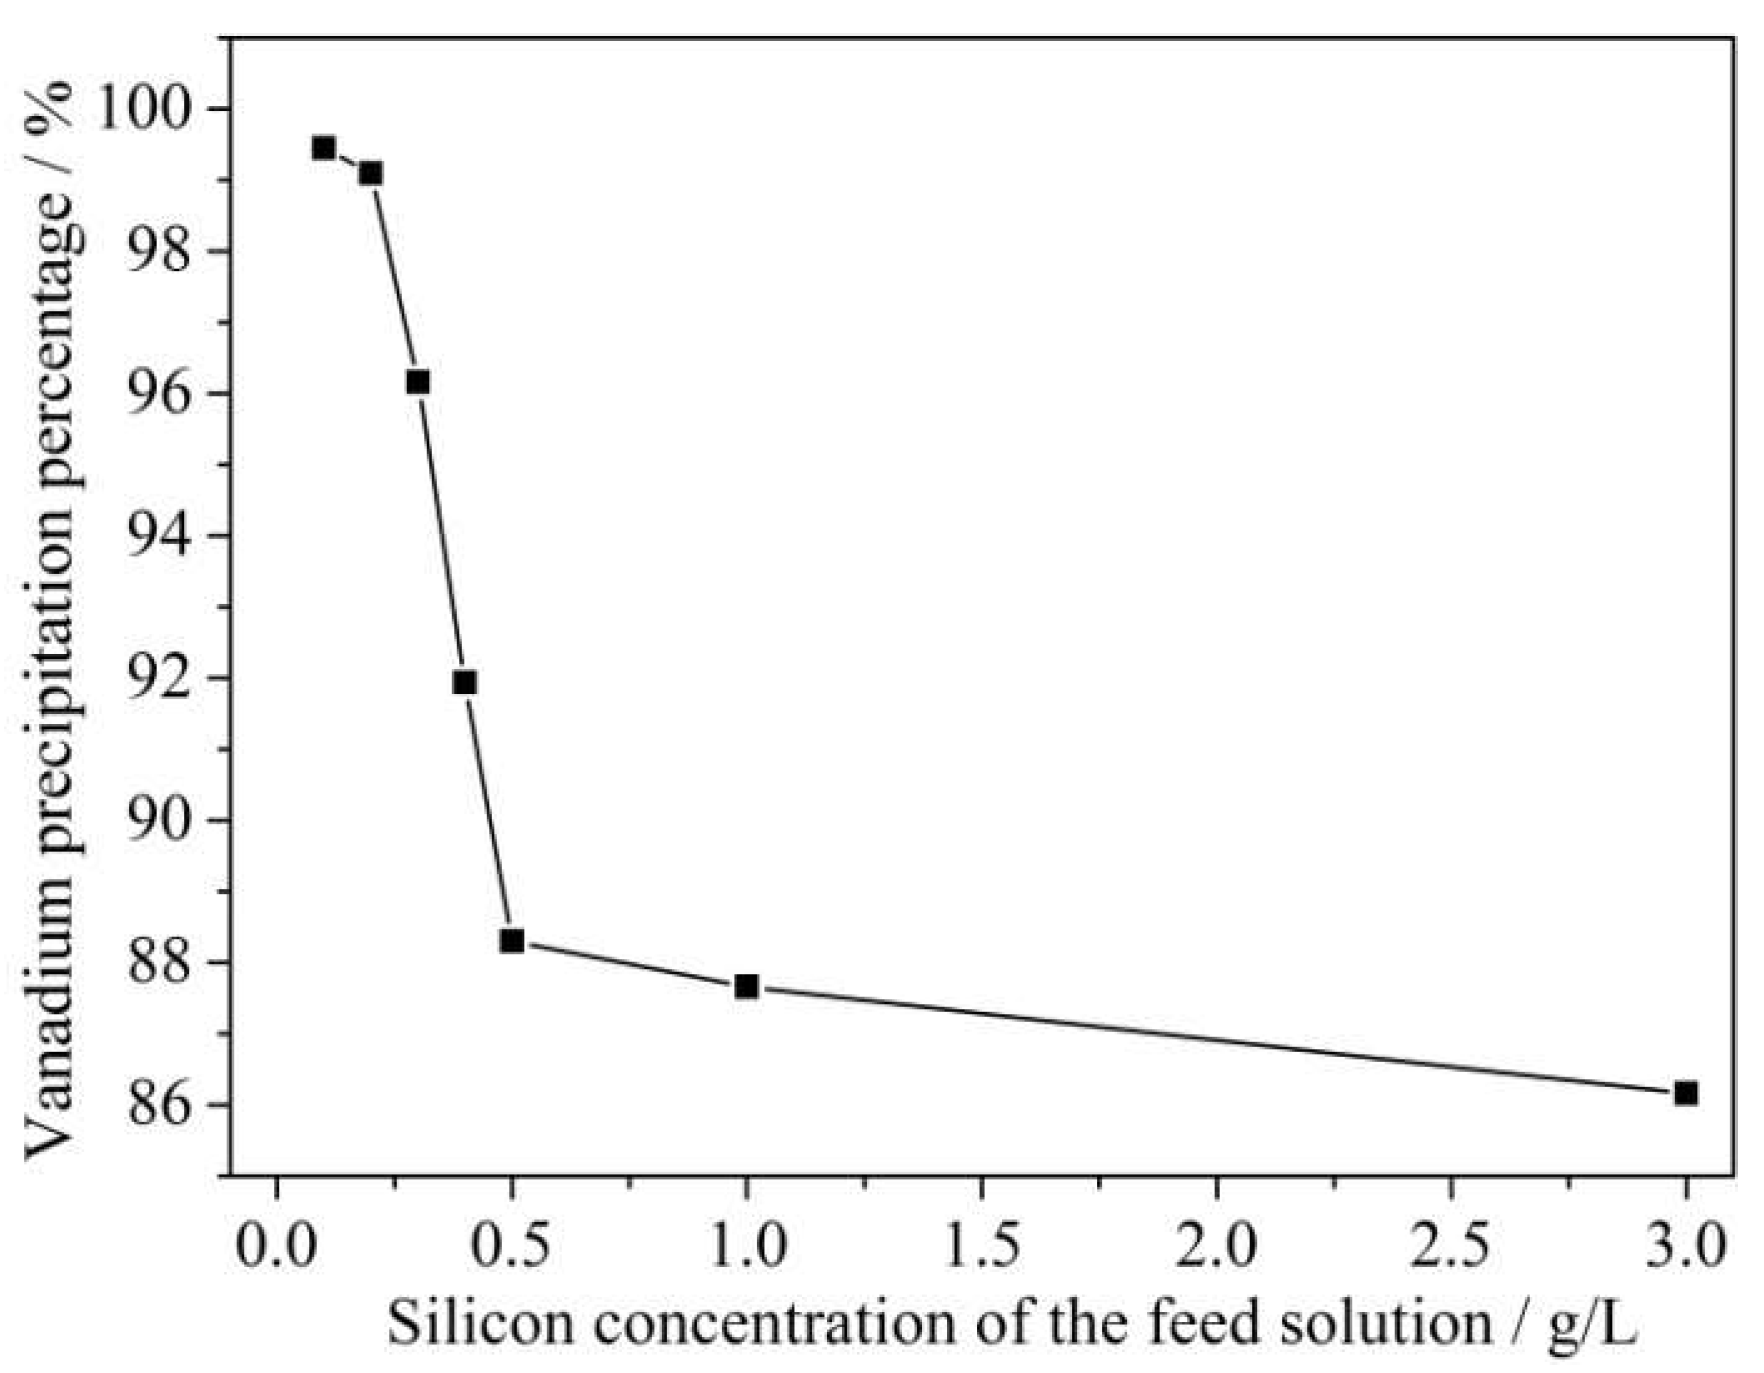
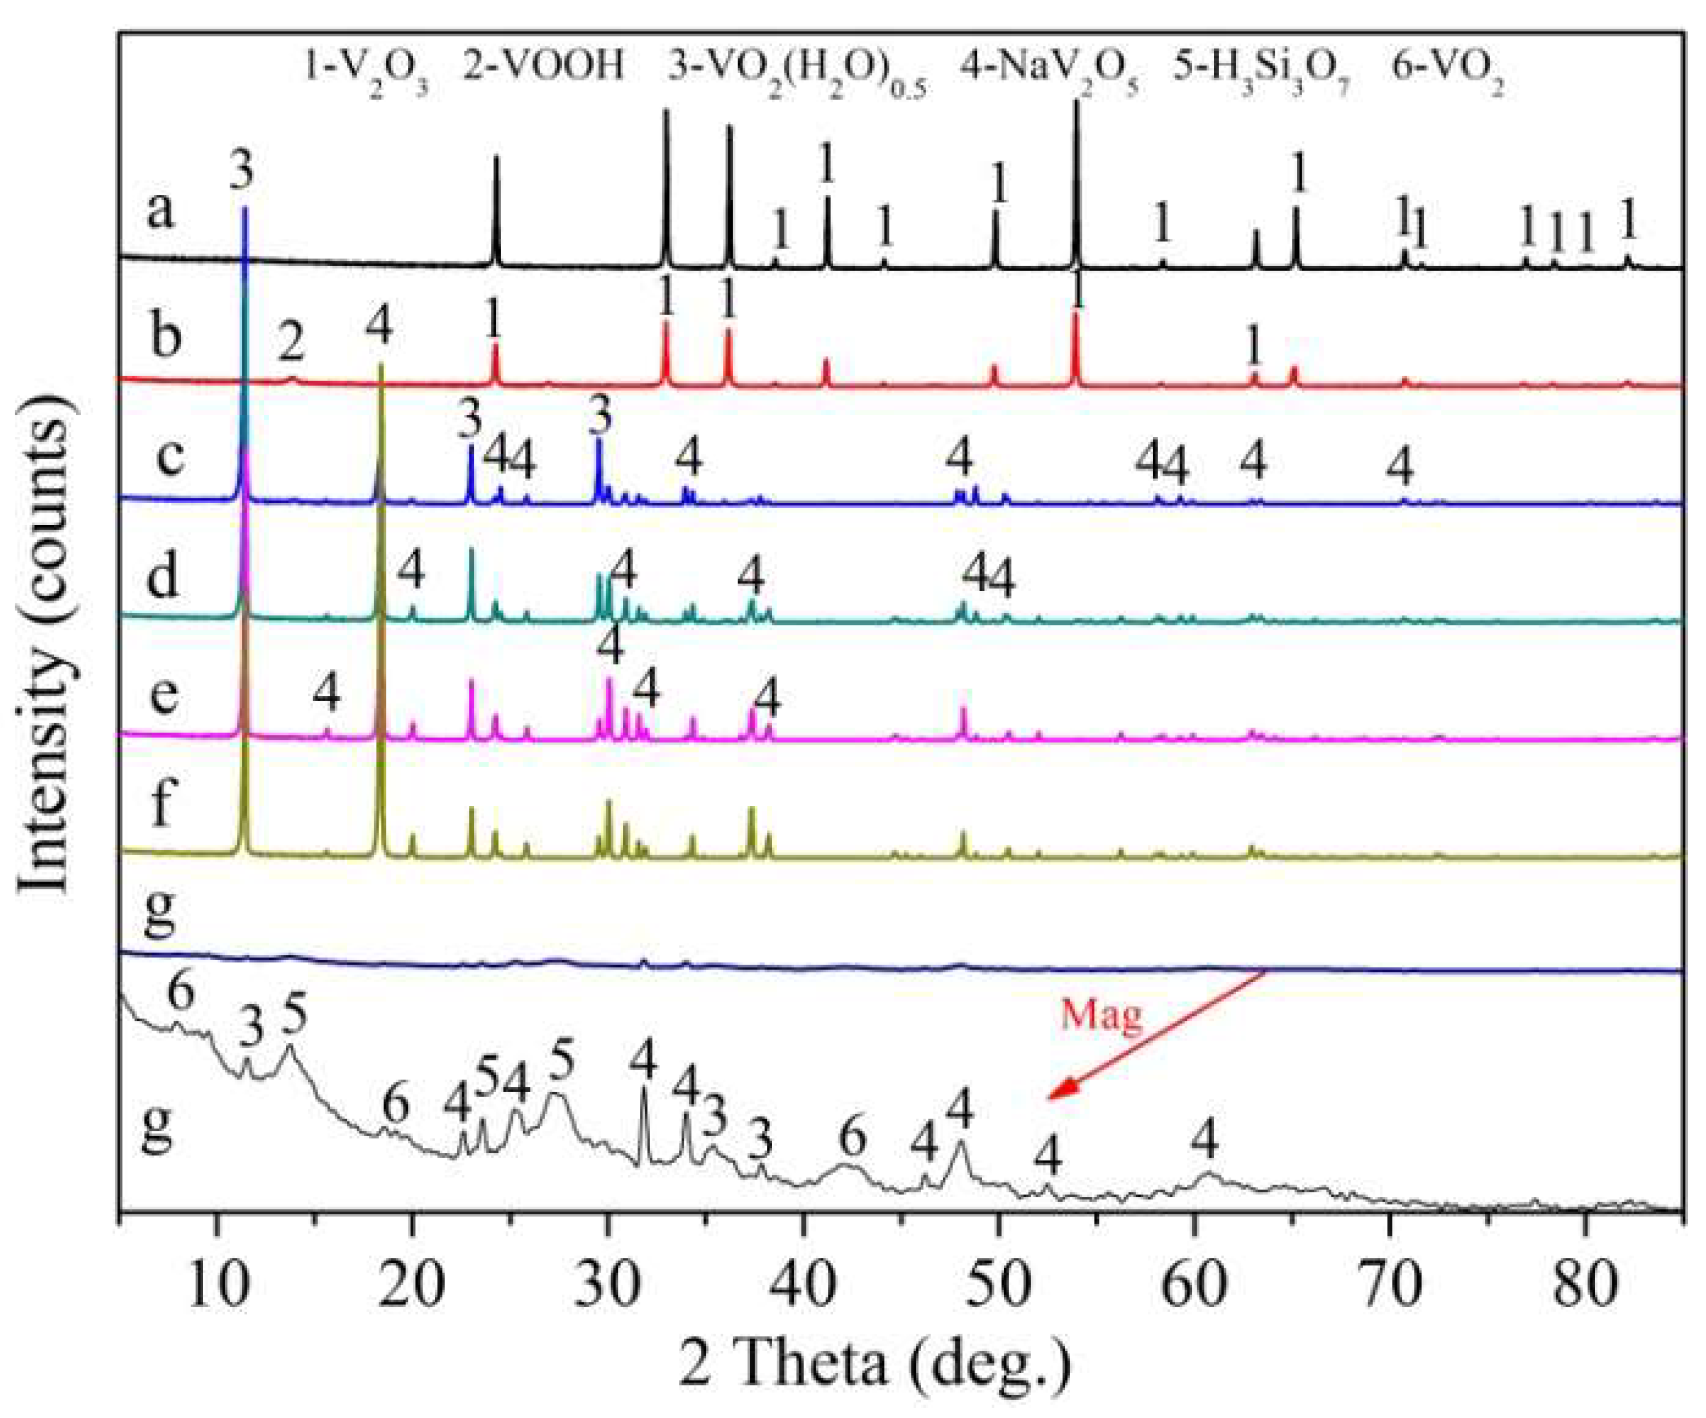
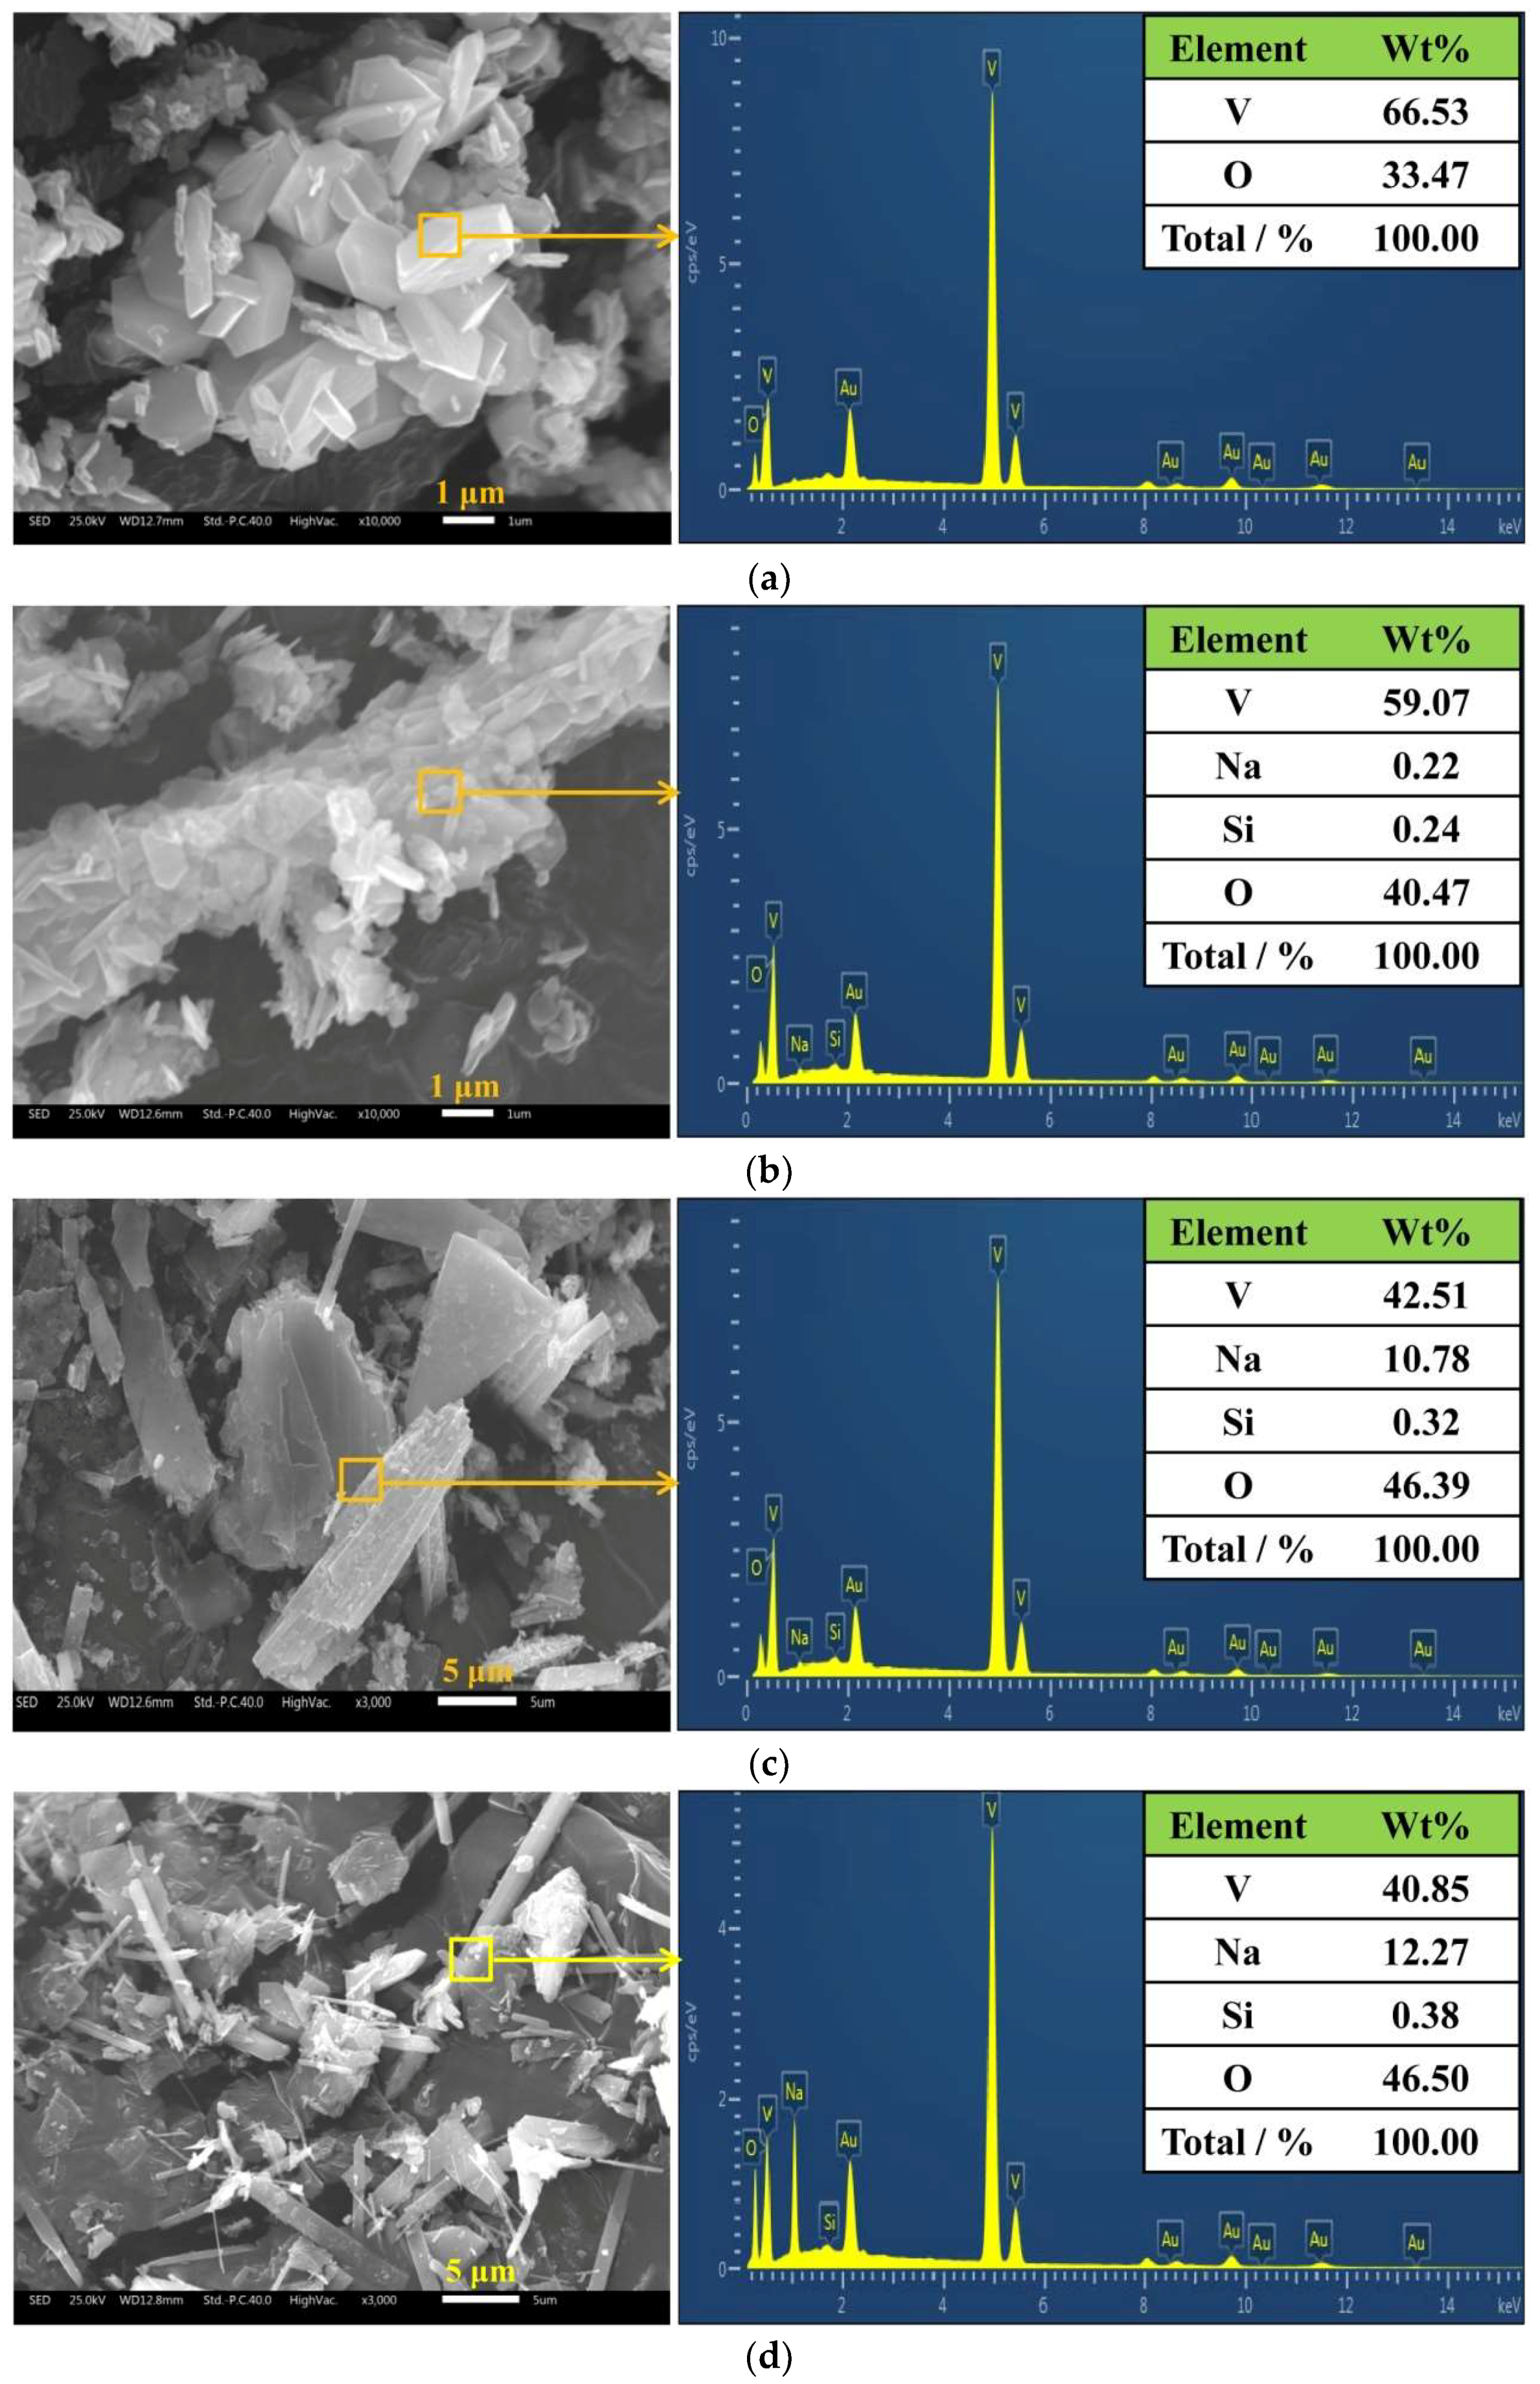
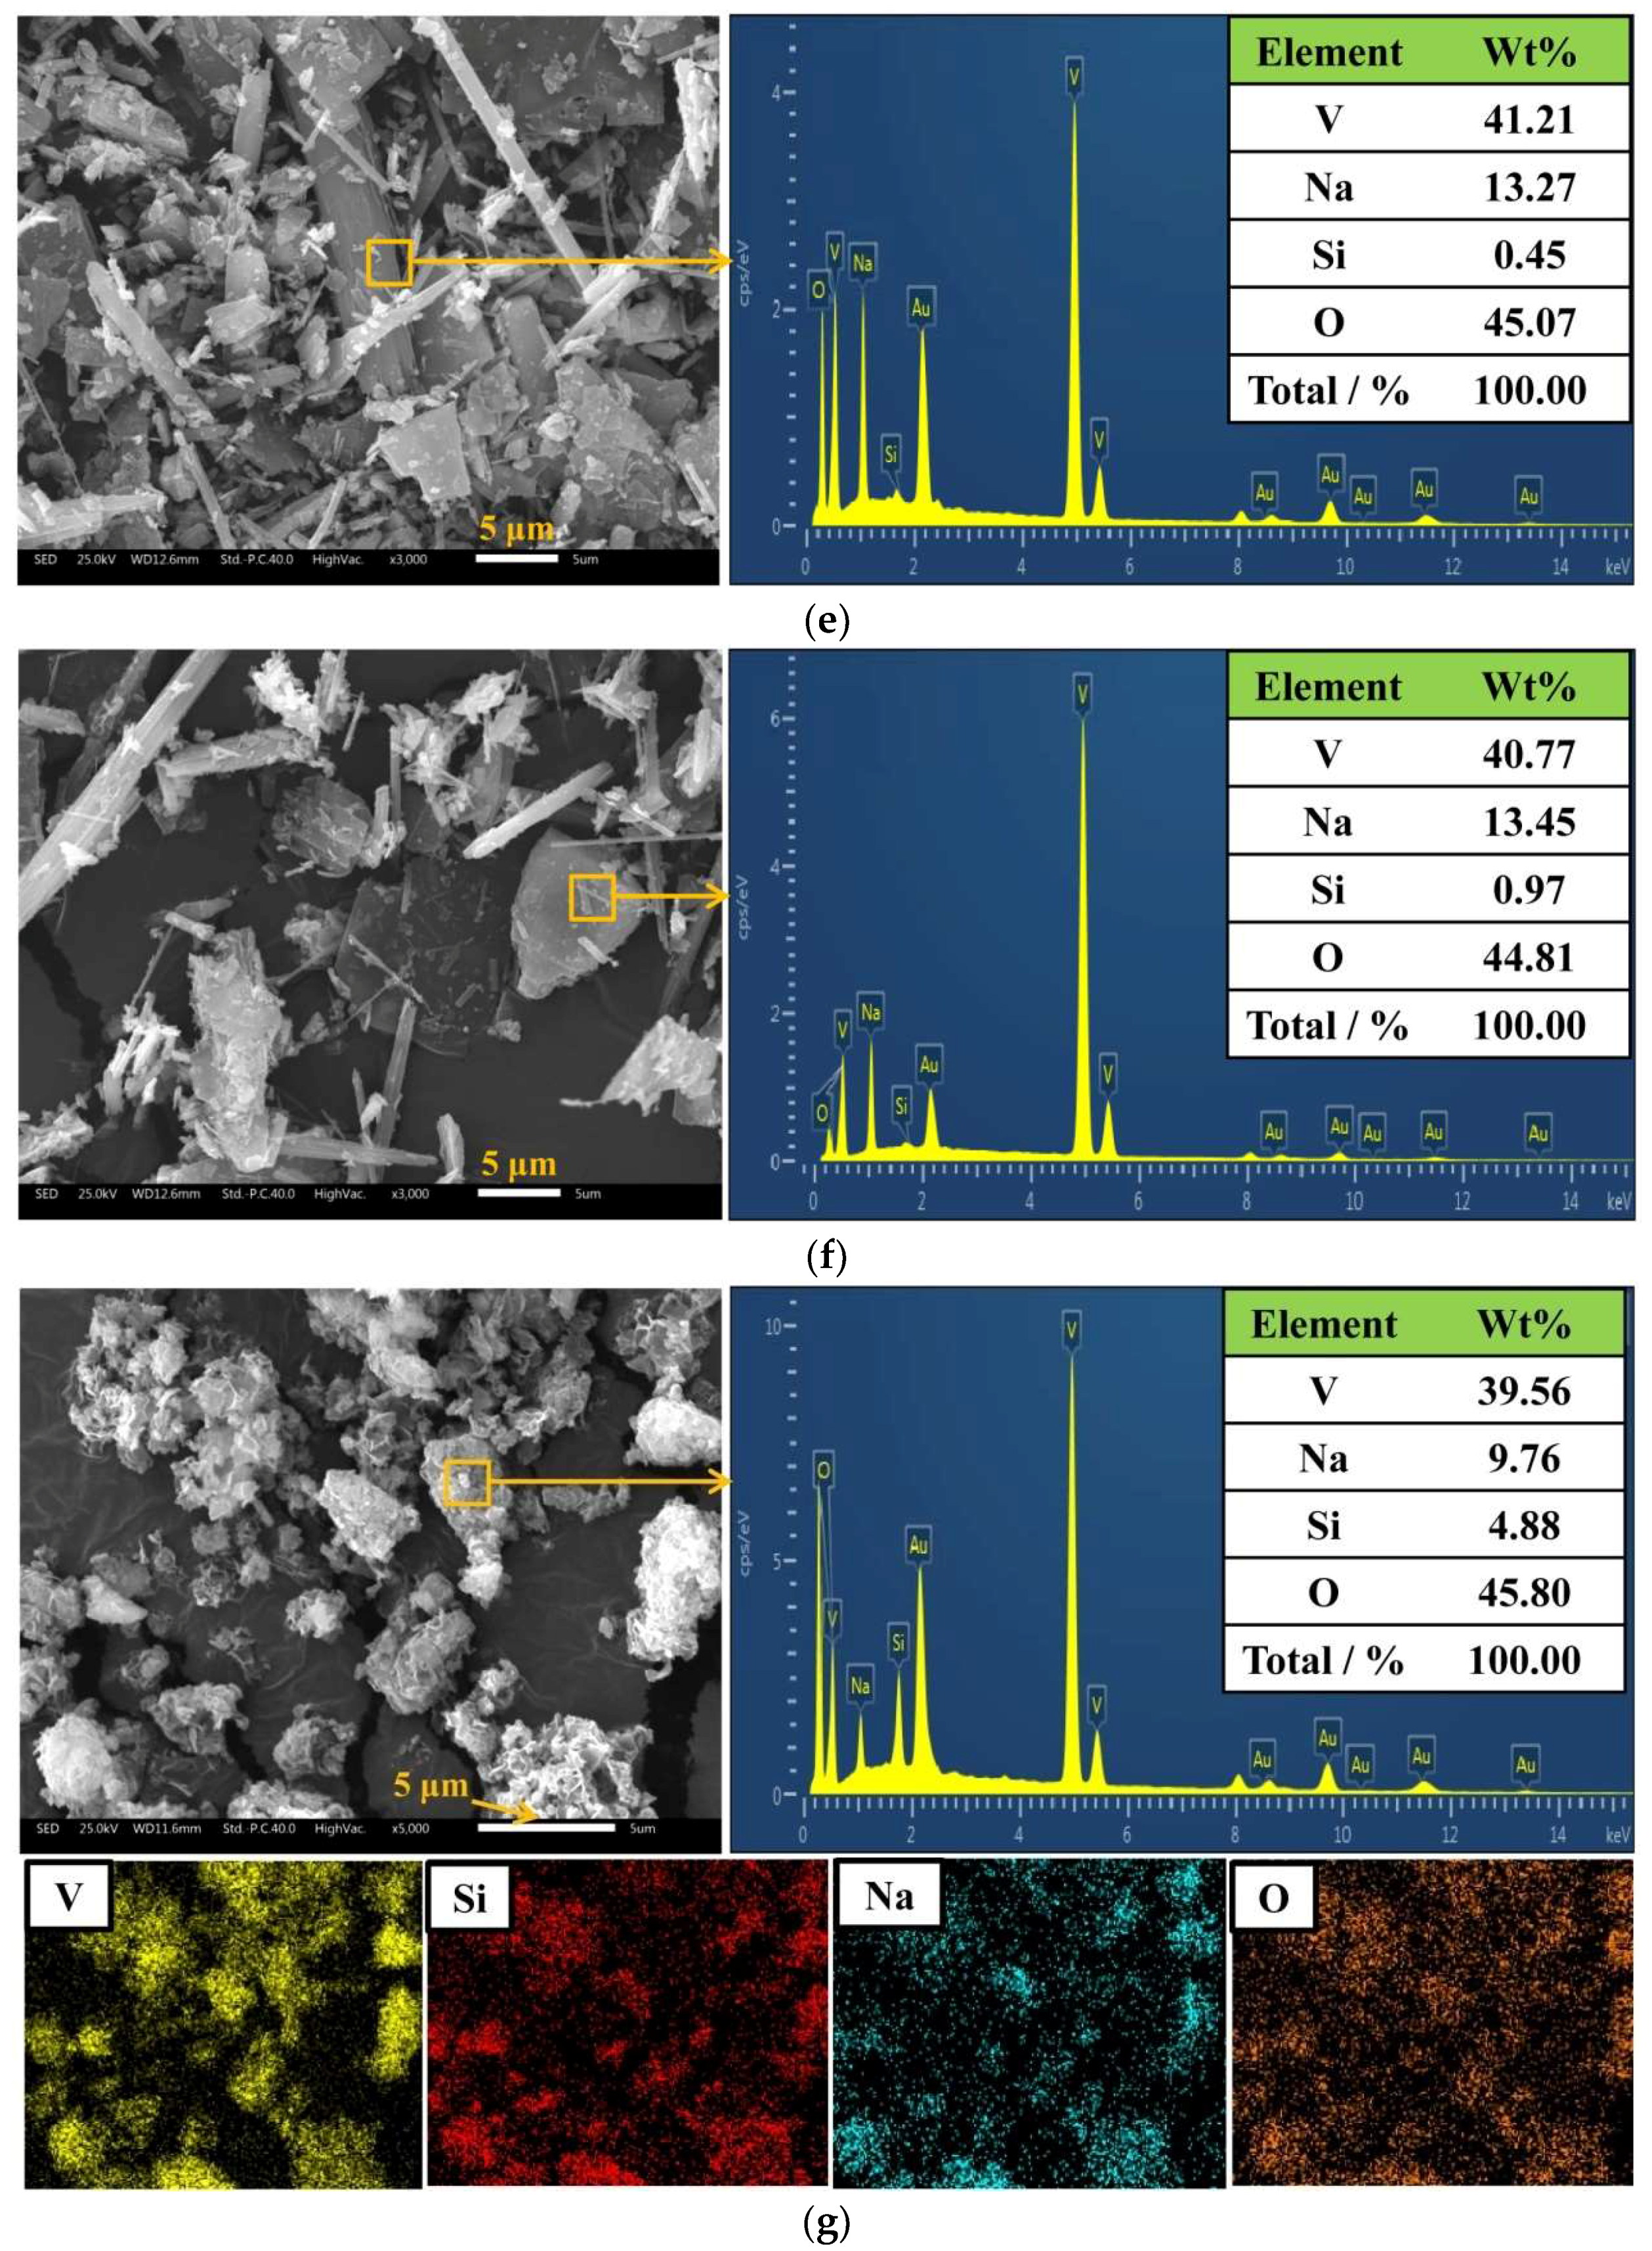
The effects of different silicon concentration of the feed solution on the vanadium precipitation percentage, silicon and sodium ions content of the precipitates are shown in Figure 9 and Figure 10 respectively. The XRD and SEM-EDS analysis of the precipitates obtained at different silicon concentrations of the feed solutions were developed, and the results are shown in Figure 11 and Figure 12 respectively.
As shown in Figure 9, the vanadium precipitation percentage gradually decreased from 99.5% to 86.2% when the silicon concentration of the feed solution increased from 0.1 g/L to 3 g/L. This result indicates that the silicon in the feed solution has a negative effect on the efficiency of the HRVP process.
Figure 10 reveals that the silicon concentration of the feed solution also had significant effect, not only on the silicon content, but also on the sodium ions content of the precipitates. The silicon content of the precipitates increased from 0.14% to 4.78% when the silicon concentration of the feed solution increased from 0.1 g/L to 3 g/L. The sodium ions content of the precipitates increased from 0.02% to 12.33% as the silicon concentration of the feed solution increases from 0.1 g/L to 1 g/L, followed by a decrease to 10.23% when the silicon concentration of the feed solution continued to increase to 3 g/L. The decrease of the sodium ions content of the precipitates as the silicon concentration of the feed solution increases from1 g/L to 3 g/L was due to the increase of the percentage of silicon content in the precipitates.
From the XRD analysis (Figure 11), all the diffraction peaks can be indexed to a single phase of V2O3 as the silicon concentration of the feed solution is 0.1 g/L. However, the VOOH precipitates began to appear in the XRD pattern as the silicon concentration of the feed solution increased to 0.2 g/L. As the silicon concentration of the feed solution increased above 0.3 g/L, the aimed products of V2O3 could not be obtained. In contrast, the diffraction peaks of the precipitates were indexed to a mixture of VO2(H2O)0.5 and NaV2O5 when the silicon concentration of the feed solution increased from 0.3 g/L to 1 g/L. Moreover, the intensity of the NaV2O5 diffraction peaks increased gradually, whereas the intensity of the VO2(H2O)0.5 diffraction peaks decreased gradually. In addition, when the silicon concentration of the feed solution continued to increase to 3 g/L, H3Si3O7 could be detected in the precipitates, as shown in Figure 11g. The corresponding diffraction peaks of the precipitates were wide and weak, which indicated the precipitates presented bad crystallization in intensity.
Through the further SEM-EDS analysis (Figure 12) it can be seen when the silicon concentration of the feed solution was 0.1 g/L, the obtained V2O3 crystals demonstrated a granular structure with smooth surface. Almost no other elements could be detected in the granular crystals through the EDS analysis, except for the aimed elements of vanadium and oxygen. As the silicon concentration of the feed solution increased to 0.2 g/L, the morphology of the crystals transforms from granular to sheet. Moreover, the silicon can be detected on the surface of the crystals with the content of 0.24% according to SEM-EDS analysis. As the silicon concentration of the feed solution increases from 0.3 g/L to 1 g/L, the obtained mixture crystals of NaV2O5 and VO2(H2O)0.5 were of clubbed and sheet morphology, and mixed with each other. The surfaces of the crystals were very rough. According to the EDS analysis (Figure 12c–f), the silicon content in the crystals increases from 0.32% to 0.97%, and the sodium ions content increases from 10.78% to 13.45%. When the silicon concentration of the feed solution increases to 3 g/L, the precipitates presented a flocculation without any certain crystal form, which reveals the bad crystallization of the precipitates. According to the EDS spot scanning analysis, the silicon content of the crystals increases to 4.88%. The distribution of silicon has a strong correlation with vanadium, sodium and oxygen according to the surface scanning of the EDS analysis. Combined with the XRD analysis (Figure 7f), it indicates that the silicon was in the form of H3Si3O7 and absorbed onto the surface of the vanadium-bearing precipitates.
4. Discussion
4.1. Effects of Sodium Ions
The results of the effect of sodium ions on the HRVP process demonstrate the sodium ions have no harmful effects on the HRVP process. The results can be explained by our previous findings about the phase transformation mechanism of the HRVP process. In our previous study [20], we found that the phase transformation mechanism of the HRVP process can be described as serial reductions with the phase transformation of HxVyOz(2z−x−5y)−→NaV2O5→VO2(H2O)0.5→VOOH→V2O3. Although the V (V) in the solution formed the precipitate of NaV2O5, the sodium ions existing in the NaV2O5 would gradually dissolve in solution during the phase transformation. As a result, the final products of V2O3 can be pure without contamination of sodium ions.
4.2. Effects of Phosphorus
In the results on the effects of phosphorus on the HRVP process, an interesting phenomenon that needs to be discussed first is that the sodium ions content of the precipitates is closely related to the phase of the precipitates. The content of sodium ions in the precipitates of the VO2(H2O)0.5, the mixture of VOOH and V2O3, and the V2O3, decreases successively. It is noted that the sodium ion content in the VO2(H2O)0.5 can reach to 9.7% (Figure 6). The distribution of sodium ions in the precipitates strongly correlates with vanadium and oxygen, according to the EDS surface scanning results (Figure 8e). However, the sodium-containing phase cannot be detected during the XRD analysis. In fact, even though the precipitates were washed with large amounts of deionized water, the sodium ions still could not be removed. Therefore, the sodium ions do not simply adsorb on the precipitates’ surface, and may still exist in the crystal lattice of VO2(H2O)0.5.
This phenomenon can be explained based on the phase transition process of the HRVP process. In our previous study [20], the phase transition process of the HRVP process was ascertained as HxVyOz(2z−x−5y)−→NaV2O5→VO2(H2O)0.5→VOOH→V2O3. When NaV2O5 is reduced to VO2(H2O)0.5 by H (activity atom hydrogen), V (V) is firstly reduced to V(IV) so that the crystal of NaV2O5 has a negative charge and the stability of the crystal is decreased. Then H+ goes into the lattice of NaV2O5 to maintain the charge balance. As the radius of H+ and Na+ are very different from each other, the stability of the transformed crystal is much lower than that of NaV2O5. Thereby, the sodium ions are dissolved in the solution, and H+ continuously goes into the lattice to maintain the charge balance and the stability of the crystal. As a result, the crystal form gradually transforms to the direction of VO2(H2O)0.5. However, when the sodium ions are not completely dissolved in the solution from the lattice while the crystal form has already converted to VO2(H2O)0.5, the precipitates are detected as VO2(H2O)0.5 through the XRD analysis, and the sodium ions can also be detected according to EDS and ICP analysis. At this time, the chemical formula of the crystal can be expressed as VO2(Na(2−x)HxO)0.5. Subsequently, when the VO2(H2O)0.5 is reduced to VOOH with dehydration, most of the sodium ions are dissolved in the solution. Finally, when the VOOH is dehydrated and transformed to V2O3, the sodium ions absorbed on the surface can be removed. Based on the above explanation the relevant reactions for describing the change trend of sodium ions content in the different vanadium-bearing products obtained during the HRVP process can be expressed as Equations (3)–(5). As shown in Figure 1, hydrogen gas has the ability to reduce V (V) to V (III). Thus hydrogen gas also has the ability to reduce V (V) to V (IV), then to trivalent vanadium (V (III)). Also, the precipitates shown in these Equations have already been ascertained, combining the analysis of XRD (Figure 7) and SEM-EDS (Figure 8). Therefore, it can be indicated that Equations (3)–(5) are thermodynamically favourable.
Based on the explanation and the results of the effects of phosphorus on the HRVP process, it can be revealed that phosphorus has no significant detrimental effects on the HRVP process when the phosphorus concentration of the feed solution is below 0.5 g/L. But phosphorus begins to demonstrate unfavorable effects on this process when the phosphorus concentration of the feed solution is above 0.5 g/L. The negative effects can be explained as follows.
Phosphorus in the feed solution can reduce vanadate ion activity, which makes vanadium precipitation more difficult to occur [23]. Because of it, the efficiency of the HRVP process is decreased as the phosphorus concentration of the feed solution increases (as shown in Figure 5). Thereby, the HRVP reaction cannot be completed so that the phase of the products transforms from a single phase of V2O3 to a mixture phase of VOOH and V2O3, then to the VO2(H2O)0.5 as the phosphorus concentration of the feed solution increases (as shown in Figure 7). As it has been discussed, the sodium ions content of the precipitates is strongly related to the phase of the precipitates, and increases from VO2(H2O)0.5 to VOOH, then to V2O3. Thus, the sodium ions content of the precipitates increases as the phosphorus concentration of the feed solution increases. Moreover, phosphorus (V) can be reduced to phosphorus (III) in the vanadium precipitation process of hydrogen reduction reaction, and forms the precipitate of (VO(H2O)2)(HPO3)(H2O)3 (as shown in Figure 7f). Therefore, the increase of the phosphorus concentration in the feed solution make the increase of phosphorus content of the precipitates (as shown in Figure 6 and the analysis of EDS in Figure 8).
Therefore, it is necessary to control the phosphorus concentration of the feed solution for the HRVP process. As there is no standard on the content of impurities in V2O3 products, we use the standard of V2O5 products to judge the quality of vanadium trioxide. It defines that the content of phosphorus cannot exceed 0.03% in the V2O5 products with a purity of 99%. Considering the phosphorus content in the V2O3 products and the efficiency of the vanadium precipitation, the suggested phosphorus concentration in the feed vanadium solution for the HRVP process should not exceed 0.5 g/L.
4.3. Effects of Silicon
Based on the results of the effects of silicon on the HRVP process, some conclusions can be drawn as follows. Silicon has no significant harmful effects on the HRVP process when the silicon concentration in the feed solution is below 0.1 g/L. The vanadium precipitation percentage can remain at about 99.5%. The obtained precipitates are the aimed products of V2O3. The silicon content of the precipitates is only 0.14%. However, as the silicon concentration in the feed solution is above 0.1 g/L, silicon begins to demonstrate harmful effects on the HRVP process. The silicon content of the precipitates increases as the silicon concentration in the feed solution increases (as shown in Figure 10 and the EDS analysis in Figure 12). Based on the analysis of XRD (Figure 11g) and SEM-EDS (Figure 12), silicon in the precipitates is more likely in the form of H3Si3O7 and adsorbs on the surface of the vanadium-bearing precipitates. As a result, it is difficult for hydrogen to react with the intermediate precipitates of vanadium. Thereby, the efficiency of the HRVP process is decreased as the silicon concentration in the feed solution increases (Figure 9). As a result, the aimed products of V2O3 are hard to be obtained as the increase of the silicon concentration in the feed solution and only the intermediate vanadium-bearing precipitates of NaV2O5 and VO2(H2O)0.5 can be obtained (Figure 11c–g). It is obvious that sodium ions are the essential component of NaV2O5, and also exist in VO2(H2O)0.5 according to the previous analysis. Thus, the content of the sodium ions in the precipitates dramatically increases as the precipitates are in the forms of NaV2O5 and VO2(H2O)0.5. Moreover, as the efficiency of the HRVP process is decreased as the silicon concentration in the feed solution increased, the percentage of NaV2O5 in the precipitates increased (as shown in Figure 11c–f). Thereby, the sodium content of the precipitates increases as the silicon concentration in the feed solution increases (as shown in Figure 10).
Therefore, it is necessary to control the silicon concentration of the feed solution for the HRVP process. Because the standard of V2O5 products defines that the content of silicon cannot exceed 0.15% in the V2O5 products with a purity of 99%, the suggested silicon concentration in the feed vanadium solution for the HRVP process should not exceed 0.1 g/L.
4.4. Verification Experiment
Based on the discussion mentioned above, the upper limits of the concentrations of the detrimental impurities of phosphorus and silicon for the HRVP process have been ascertained. However, it is also necessary to verify the experimental results by using the actual concentrated vanadium solution.
A desorption V(V) solution extracted from the vanadium-bearing shale was used as the concentration vanadium solution for the HRVP process. The chemical composition of the solution (Table 4) shows that the vanadium, sodium ions, phosphorus, and silicon concentration are 20.56 g/L, 23.21 g/L, 0.48 g/L, and 0.09 g/L respectively, the other impurities concentration are in trace amounts. The phosphorus and silicon concentration in this actual solution are close to the limits of the allowed concentration. Therefore, this desorption V(V) solution can be reasonably used as a typical actual concentrated V (V) solution for the HRVP process.
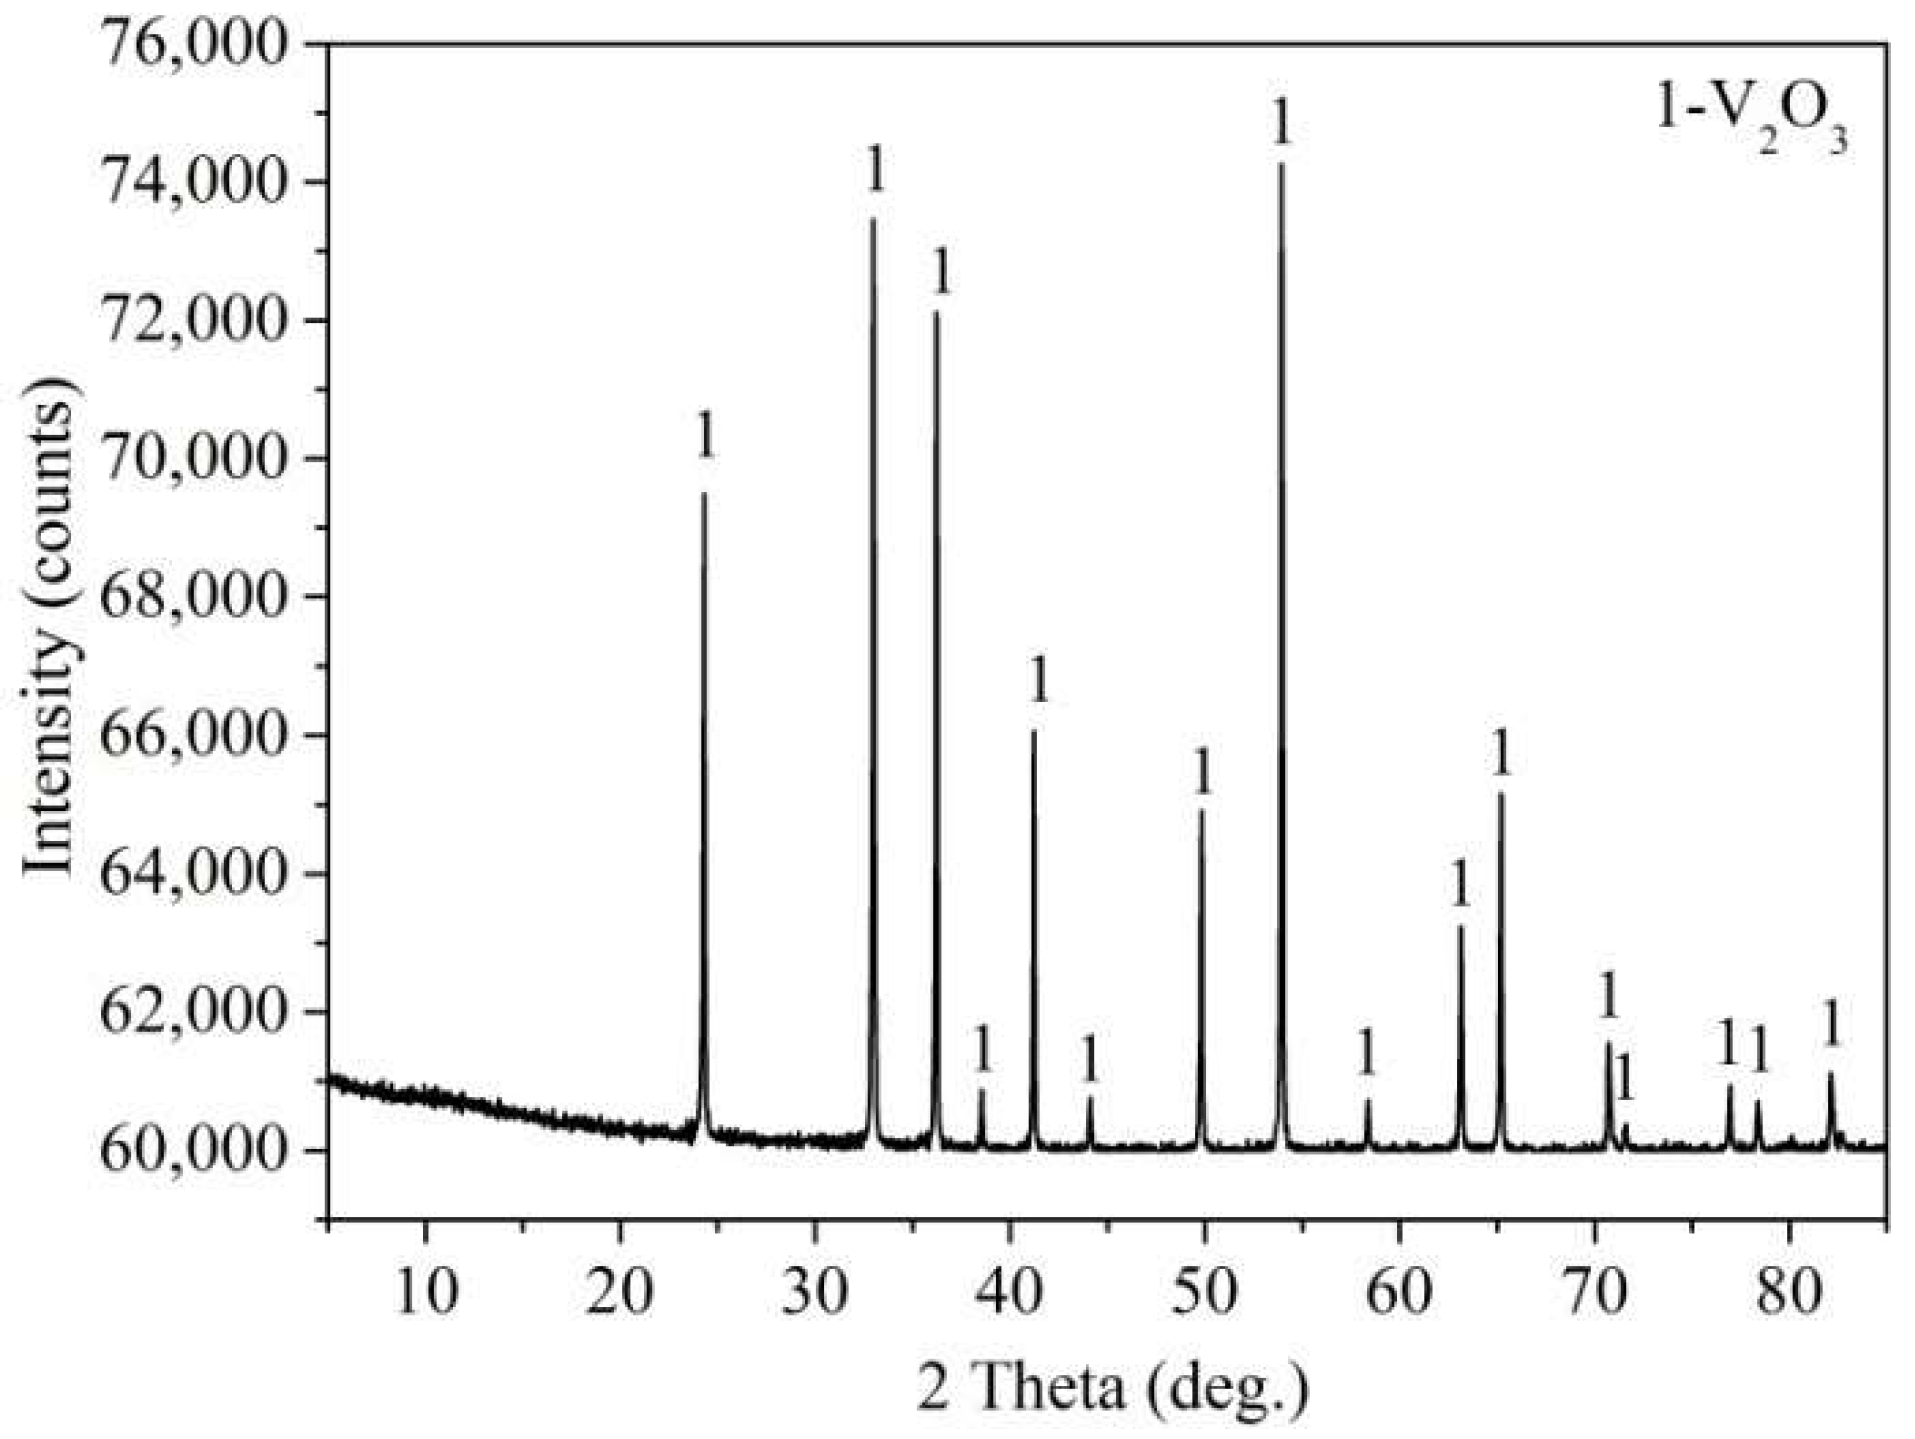
After the reaction, the vanadium precipitation efficiency was calculated as 99.6%, which agreed well with the experiments using simulated solutions. From the XRD analysis (Figure 13) of the obtained products, all the diffraction peaks can be indexed to a single phase of V2O3. The chemical composition of the products (Table 5) show that the purity of the obtained V2O3 is 99.8% and the content of phosphorus and silicon are below 0.03% and 0.15% respectively. All these results agree well with the results of the simulated solution experiments.
Therefore, in the HRVP process the vanadium precipitation efficiency can be assured above 99% and the quality of the V2O3 can be assured above 99% grade when the phosphorus and silicon concentration of the actual vanadium concentrated solution are below 0.5 g/L and 0.1 g/L, respectively.
In the process of vanadium extraction from vanadium-bearing shale, phosphorus, and silicon can be effectively removed from the alkaline concentrated vanadium solution by the addition of MgSO4 as the precipitant. The concentrations of phosphorus and silicon in the purified solution are usually below 0.5 g/L and 0.1 g/L. Therefore, the HRVP process is a promising method for the vanadium precipitation in the field of vanadium extraction from vanadium-bearing shale.
5. Conclusions
- (1)
- Sodium ions in the feed vanadium solution have no significantly negative effects on the HRVP process, because sodium ions exist in the NaV2O5 can be gradually dissolved in the solution with the phase transformation of HxVyOz(2z−x−5y)−→NaV2O5→VO2(H2O)0.5→VOOH→V2O3 of the HRVP process.
- (2)
- Phosphorus in the feed vanadium solution can reduce vanadate ion activity, which makes vanadium precipitation more difficult to occur. As a result, the vanadium precipitation percentage decreases from 99.5% to 61.3% as the phosphorus concentration of the feed solution increases from 0.05 g/L to 3 g/L. Also, the aimed products of V2O3 are hard to be obtained, and only VO2(H2O)0.5 can be obtained when the phosphorus concentration of the feed solution is above 1 g/L, which causes the increase of the sodium ions content of the precipitates. Moreover, P (V) can be reduced to P (III) in the process and may form the precipitates of (VO(H2O)2)(HPO3)(H2O)3. Thereby, the phosphorus content of the precipitates increases from 0.008% to 0.9% when the phosphorus concentration in the feed solution increases from 0.05 g/L to 3 g/L. The phosphorus concentration of the feed vanadium solution should be controlled at no more than 0.5 g/L to obtain aV2O3 product with a purity of more than 99%.
- (3)
- Silicon in the feed vanadium solution can influence the crystallization process of the precipitates and adsorbs on the surface of the precipitates in the form of H3Si3O7, causing the difficulty for H to react with the intermediate precipitates of vanadium. As a result, the vanadium precipitation percentage decreases from 99.5% to 86.2%, when the silicon concentration in the feed solution increases from 0.1 g/L to 3 g/L. Moreover, the aimed products of V2O3 cannot be obtained easily. The obtained intermediate precipitates of vanadium which contain sodium also result in the increase of sodium ions content in the precipitates. The silicon concentration of the feed vanadium solution should be controlled at no more than 0.1 g/L to obtain the V2O3 product with a purity of more than 99%.
In summary, the effects of the main elements of sodium ions, phosphorus and silicon in the alkaline concentrated V (V) solution on the vanadium precipitation process of hydrogen reduction reaction were investigated. The upper limits of the concentration for the negative elements of phosphorus and silicon in the alkaline-concentrated V (V) solution were ascertained to be 0.5 g/L and 0.1 g/L respectively. The results were also be verified by a verification experiment. Actually, the concentrations of phosphorus and silicon in the purified alkaline concentrated V (V) solution extracted from vanadium-bearing shale are usually below the upper limits of the concentrations. Therefore, the eco-friendly process of vanadium precipitation by hydrothermal hydrogen reduction has a great application prospect in the field of vanadium extraction from vanadium-bearing shale.
Author Contributions
G.Z. and Y.Z. provided the original ideas and designed the experiments; G.Z. performed the experiments; G.Z. analyzed the data; S.B. contributed reagents/materials/analysis tools; G.Z. wrote the paper.
Funding
This research was funded by the National Key Science-Technology Support Programs of China (No. 2015BAB03B05) and the Hubei province technical innovation special major project (No. 2018ACA157).
Acknowledgments
The authors would like to thank the National Key Science-Technology Support Programs of China (No. 2015BAB03B05) and the Hubei province technical innovation special major project (No. 2018ACA157).
Conflicts of Interest
The authors declare no conflict of interest.
References
- Zheng, Q.; Zhang, Y.; Huang, J.; Liu, T.; Xue, N.; Shi, Q. Optimal location of vanadium in muscovite and its geometrical and electronic properties by DFT calculation. Minerals 2017, 7, 32. [Google Scholar] [CrossRef]
- Yang, X.; Zhang, Y.; Bao, S. Preparation high purity V2O5 from a typical low-grade refractory stone coal using a pyro-hydrometallurgical process. Minerals 2016, 6, 69. [Google Scholar] [CrossRef]
- Chen, F.; Zhang, Y.; Huang, J.; Liu, T.; Xue, N. Mechanism of enhancing extraction of vanadium from stone coal by roasting with MgO. Minerals 2017, 7, 33. [Google Scholar] [CrossRef]
- Moskalyk, R.; Alfantazi, A. Processing of vanadium: A review. Miner. Eng. 2003, 16, 793–805. [Google Scholar] [CrossRef]
- Zhang, G.; Chen, D.; Zhao, W.; Zhao, H.; Wang, L.; Li, D.; Qi, T. A novel synergistic extraction method for recovering vanadium (V) from high-acidity chloride leaching liquor. Sep. Purif. Technol. 2016, 165, 166–172. [Google Scholar] [CrossRef]
- Skyllaskazacos, M.; Cao, L.Y.; Kazacos, M.; Kausar, N.; Mousa, A. Vanadium electrolyte studies for the vanadium redox battery—A review. ChemSusChem 2016, 47, 1521–1543. [Google Scholar] [CrossRef] [PubMed]
- Zhang, Y.; Bao, S.; Liu, T.; Chen, T.; Huang, J. The technology of extracting vanadium from stone coal in China: History, current status and future prospects. Hydrometallurgy 2011, 109, 116–124. [Google Scholar] [CrossRef]
- Hu, P.; Zhang, Y.; Liu, T.; Huang, J.; Yuan, Y. Highly selective separation of vanadium over iron from stone coal by oxalic acid leaching. Ind. Eng. Chem. 2017, 45, 241–247. [Google Scholar] [CrossRef]
- Wang, B.; Liu, T.; Zhang, Y.; Huang, J. Effect of CaF2/CaO composite additive on roasting of vanadium-bearing stone coal and acid leaching kinetics. Minerals 2017, 7, 43. [Google Scholar] [CrossRef]
- Cai, Z.; Zhang, Y.; Liu, T.; Huang, J. Mechanisms of vanadium recovery from stone coal by novel BaCO3/CaO composite additive roasting. Minerals 2016, 6, 26. [Google Scholar] [CrossRef]
- Liu, Y.; Yang, C.; Li, P.; Li, S. A new process of extracting vanadium from stone coal. Int. J. Miner. Metall. Mater. 2010, 17, 381–388. [Google Scholar] [CrossRef]
- Li, X.; Xie, B. Extraction of vanadium from high calcium vanadium slag using direct roasting and soda leaching. Int. J. Miner. Metall. Mater. 2012, 19, 595–601. [Google Scholar] [CrossRef]
- Wang, M.; Xiao, L.; Li, Q.; Wang, X.; Xiang, X. Leaching of vanadium from stone coal with sulfuric acid. Rare Met. 2009, 28, 1–4. [Google Scholar] [CrossRef]
- Chen, X.; Lan, X.; Zhang, Q.; Ma, H.; Zhou, J. Leaching vanadium by high concentration sulfuric acid from stone coal. Trans. Non-Ferrous Metall. Soc. China 2010, 20, s123–s126. [Google Scholar] [CrossRef]
- Deng, Z.; Wei, C.; Fan, G.; Li, M.; Li, C.; Li, X. Extracting vanadium from stone-coal by oxygen pressure acid leaching and solvent extraction. Trans. Non-Ferrous Metall. Soc. China 2010, 20, s118–s122. [Google Scholar] [CrossRef]
- Wang, X.; Wang, M.; Shi, L.; Hu, J.; Qiao, P. Recovery of vanadium during ammonium molybdate production using ion exchange. Hydrometallurgy 2010, 104, 317–321. [Google Scholar] [CrossRef]
- He, D.; Feng, Q.; Zhang, G.; Ou, L.; Lu, Y. An environmentally-friendly technology of vanadium extraction from stone coal. Miner. Eng. 2007, 2011, 1184–1186. [Google Scholar] [CrossRef]
- Ning, P.; Lin, X.; Wang, X.; Cao, H. High-efficient extraction of vanadium and its application in the utilization of the chromium-bearing vanadium slag. Chem. Eng. J. 2016, 301, 132–138. [Google Scholar] [CrossRef]
- Wang, Y.; Li, D.; Zhang, H. Main factors affecting precipitation of vanadium with acidic ammonium salt and its counter measures. Iron Alloy 2012, 4, 12–16. (In Chinese) [Google Scholar]
- Zhang, G.; Zhang, Y.; Bao, S.; Huang, J.; Zhang, L. A Novel Eco-Friendly Vanadium Precipitation Method by Hydrothermal Hydrogen Reduction Technology. Minerals 2017, 7, 182. [Google Scholar] [CrossRef]
- Liang, H.; Tang, Q.; Yu, K.; Li, S.; Ke, J. Preparation of metallic silver from Ag2S slurry by direct hydrogen reduction under hydrothermal conditions. Mater. Lett. 2007, 61, 1020–1022. [Google Scholar] [CrossRef]
- Li, X.; Wei, C.; Deng, Z. Selective solvent extraction of vanadium over iron from a stone coal/black shale acid leach solution by D2EHPA/TBP. Hydrometallurgy 2011, 105, 359–363. [Google Scholar] [CrossRef]
- Martins, A. The influence of calcium, magnesium, phosphorus and silica on vanadium precipitation in acidic sulfate solutions. Braz. J. Chem. Eng. 2000, 17. [Google Scholar] [CrossRef]
Figure 1.
Potential–pH diagram for V–H2O system (only includes V (V) and V (III) species) at 298 K with activities of dissolved vanadium of 1 mol/L and H2 partial pressure of 1 atm.
Figure 1.
Potential–pH diagram for V–H2O system (only includes V (V) and V (III) species) at 298 K with activities of dissolved vanadium of 1 mol/L and H2 partial pressure of 1 atm.

Figure 2.
The hydrothermal hydrogen reduction technology (HRVP) process used in this study [20].
Figure 2.
The hydrothermal hydrogen reduction technology (HRVP) process used in this study [20].

Figure 3.
The effect of sodium ions concentration of the feed solution on the vanadium precipitation percentage and the sodium ions content of the precipitates.
Figure 3.
The effect of sodium ions concentration of the feed solution on the vanadium precipitation percentage and the sodium ions content of the precipitates.

Figure 4.
X-ray diffractometer (XRD) patterns of the precipitates obtained at different sodium ions concentrations of (a) 22.95 g/L; (b) 34.25 g/L; (c) 46.23 g/L; (d) 57.55 g/L, and (e) 68.87 g/L in the feed solutions.
Figure 4.
X-ray diffractometer (XRD) patterns of the precipitates obtained at different sodium ions concentrations of (a) 22.95 g/L; (b) 34.25 g/L; (c) 46.23 g/L; (d) 57.55 g/L, and (e) 68.87 g/L in the feed solutions.

Figure 5.
The effect of phosphorus concentration of the feed solution on the vanadium precipitation percentage.
Figure 5.
The effect of phosphorus concentration of the feed solution on the vanadium precipitation percentage.

Figure 6.
The effects of phosphorus concentration of the feed solution on the phosphorus and sodium ions content of the precipitates.
Figure 6.
The effects of phosphorus concentration of the feed solution on the phosphorus and sodium ions content of the precipitates.

Figure 7.
XRD patterns of the precipitates obtained at different P concentrations of (a) 0.05 g/L; (b) 0.29 g/L; (c) 0.5 g/L; (d) 1 g/L; (e) 1.48 g/L and (f) 3 g/L in the feed solutions.
Figure 7.
XRD patterns of the precipitates obtained at different P concentrations of (a) 0.05 g/L; (b) 0.29 g/L; (c) 0.5 g/L; (d) 1 g/L; (e) 1.48 g/L and (f) 3 g/L in the feed solutions.

Figure 8.
Scanning electron microscopy (SEM) images with EDS analysis of the precipitates obtained at different P concentrations of (a) 0.05 g/L; (b) 0.29 g/L; (c) 0.5 g/L; (d) 1 g/L; (e) 1.48 g/L and (f) 3 g/L in the feed solutions.
Figure 8.
Scanning electron microscopy (SEM) images with EDS analysis of the precipitates obtained at different P concentrations of (a) 0.05 g/L; (b) 0.29 g/L; (c) 0.5 g/L; (d) 1 g/L; (e) 1.48 g/L and (f) 3 g/L in the feed solutions.


Figure 9.
The effect of silicon concentration of the feed solution on the vanadium precipitation percentage.
Figure 9.
The effect of silicon concentration of the feed solution on the vanadium precipitation percentage.

Figure 10.
The effects of silicon concentration of the feed solution on the silicon and sodium ions content of the precipitates.
Figure 10.
The effects of silicon concentration of the feed solution on the silicon and sodium ions content of the precipitates.

Figure 11.
XRD patterns of the precipitates obtained at different silicon concentrations of (a) 0.1 g/L; (b) 0.2 g/L; (c) 0.31 g/L; (d) 0.39 g/L; (e) 0.52 g/L; (f) 1.01 g/L, and (g) 3 g/L in the feed solutions.
Figure 11.
XRD patterns of the precipitates obtained at different silicon concentrations of (a) 0.1 g/L; (b) 0.2 g/L; (c) 0.31 g/L; (d) 0.39 g/L; (e) 0.52 g/L; (f) 1.01 g/L, and (g) 3 g/L in the feed solutions.

Figure 12.
SEM images with X-ray energy dispersive spectroscopy (EDS) analysis of the precipitates obtained at different silicon concentrations of (a) 0.1 g/L; (b) 0.2 g/L; (c) 0.31 g/L; (d) 0.39 g/L; (e) 0.52 g/L; (f) 1.01 g/L, and (g) 3 g/L in the feed solutions.
Figure 12.
SEM images with X-ray energy dispersive spectroscopy (EDS) analysis of the precipitates obtained at different silicon concentrations of (a) 0.1 g/L; (b) 0.2 g/L; (c) 0.31 g/L; (d) 0.39 g/L; (e) 0.52 g/L; (f) 1.01 g/L, and (g) 3 g/L in the feed solutions.


Figure 13.
XRD pattern of the precipitates obtained from the actual concentrated vanadium solution.


Table 1.
Main chemical composition of the simulated feed vanadium solutions with different sodium ions concentrations, g/L.
Table 1.
Main chemical composition of the simulated feed vanadium solutions with different sodium ions concentrations, g/L.
| Items | V | Na |
|---|---|---|
| 1# | 20.45 | 22.95 |
| 2# | 20.12 | 34.25 |
| 3# | 20.32 | 46.23 |
| 4# | 20.36 | 57.55 |
| 5# | 20.05 | 68.87 |
Table 2.
Main chemical composition of the simulated feed vanadium solutions with different phosphorus concentrations, g/L.
Table 2.
Main chemical composition of the simulated feed vanadium solutions with different phosphorus concentrations, g/L.
| Items | V | Na | P |
|---|---|---|---|
| 6# | 20.35 | 23.01 | 0.05 |
| 7# | 20.23 | 22.98 | 0.29 |
| 8# | 20.45 | 23.05 | 0.50 |
| 9# | 20.24 | 22.65 | 1.00 |
| 10# | 20.15 | 22.45 | 1.48 |
| 11# | 20.42 | 22.85 | 3.00 |
Table 3.
Main chemical compositions of the simulated feed vanadium solutions with different silicon concentrations, g/L.
Table 3.
Main chemical compositions of the simulated feed vanadium solutions with different silicon concentrations, g/L.
| Items | V | Na | Si |
|---|---|---|---|
| 12# | 20.35 | 23.01 | 0.10 |
| 13# | 20.23 | 22.98 | 0.20 |
| 14# | 20.45 | 23.05 | 0.31 |
| 15# | 20.24 | 22.65 | 0.39 |
| 16# | 20.15 | 22.45 | 0.52 |
| 17# | 20.42 | 22.85 | 1.01 |
| 18# | 20.21 | 22.98 | 3.00 |
Table 4.
Main chemical composition of desorption V (V) solution.
| Items | V | Fe | Al | Mg | Na | K | Ca | P | Si |
|---|---|---|---|---|---|---|---|---|---|
| Concentration (g/L) | 20.56 | 0.01 | 0.02 | 0.01 | 23.21 | 0 | 0 | 0.48 | 0.09 |
Table 5.
Chemical composition of V2O3 products, wt %.
| Composition | V2O3 | Fe | Si | P | S | K2O | Na2O | As |
|---|---|---|---|---|---|---|---|---|
| Content | 99.81 | 0.001 | 0.13 | 0.023 | 0.002 | 0 | 0.029 | 0 |
© 2018 by the authors. Licensee MDPI, Basel, Switzerland. This article is an open access article distributed under the terms and conditions of the Creative Commons Attribution (CC BY) license (http://creativecommons.org/licenses/by/4.0/).
Share and Cite
MDPI and ACS Style
Zhang, G.; Zhang, Y.; Bao, S. The Effects of Sodium Ions, Phosphorus, and Silicon on the Eco-Friendly Process of Vanadium Precipitation by Hydrothermal Hydrogen Reduction. Minerals 2018, 8, 294. https://doi.org/10.3390/min8070294
AMA Style
Zhang G, Zhang Y, Bao S. The Effects of Sodium Ions, Phosphorus, and Silicon on the Eco-Friendly Process of Vanadium Precipitation by Hydrothermal Hydrogen Reduction. Minerals. 2018; 8(7):294. https://doi.org/10.3390/min8070294
Chicago/Turabian StyleZhang, Guobin, Yimin Zhang, and Shenxu Bao. 2018. "The Effects of Sodium Ions, Phosphorus, and Silicon on the Eco-Friendly Process of Vanadium Precipitation by Hydrothermal Hydrogen Reduction" Minerals 8, no. 7: 294. https://doi.org/10.3390/min8070294
Note that from the first issue of 2016, this journal uses article numbers instead of page numbers. See further details here.