Variographic Assessment of Total Process Measurement System Performance for a Complete Ore-to-Shipping Value Chain


1
Luossavaara-Kiirunavaara AB (LKAB), Kiruna 98186, Sweden
2
Department of Chemistry and Bioscience, Aalborg University, Esbjerg 6700, Denmark
3
KHE Consulting, Copenhagen 2100, Denmark
4
Geological Survey of Denmark and Greenland (GEUS), Copenhagen 1350, Denmark
5
Sciences de la Terre, Université du Québec à Chicoutimi, Quebec, QC G7H 2B1, Canada
*
Author to whom correspondence should be addressed.
†
Industrial PhD student, Aalborg University, Denmark.
Minerals 2018, 8(7), 310; https://doi.org/10.3390/min8070310
Submission received: 21 June 2018
/
Revised: 18 July 2018
/
Accepted: 19 July 2018
/
Published: 23 July 2018
(This article belongs to the Special Issue Sampling Across the Mine Value Chain)
Abstract
:Variographic characterisation has been shown to be a powerful tool to assess the performance of process measurement systems, using existing process data. Variogram interpretation enables decomposition of variabilities stemming from the process and measurement system, respectively, allowing to determine if measurements are able to describe the true process variability with sufficient resolution. This study evaluated 14 critical sampling locations, covering a total of 34 separate measurement systems, along the full processing value chain at Luossavaara Kiirunavaara limited company (LKAB), Sweden. A majority of the variograms show low sill levels, indicating that many sub-processes are well controlled. Many also show low nugget effect, indicating satisfactory measurement systems. However, some notable exceptions were observed, pointing to systems in the need of improvement. Even if some of these were previously recognized internally at LKAB, the use of variographic characterisation provide objective and numerical evidence of measurement system performance. The study also showed some unexpected results, for example that slurry shark-fin and spear sampling show acceptable variogram characteristics for the present materials, despite the associated incorrect sampling errors. On the other hand, the results support previous conclusions indicating that manual sampling and cross belt hammer samplers are leading to unacceptably large sampling errors and should be abandoned. Such specific findings underline the strength of comprehensive empirical studies. Based on the present compilation of results, it is possible to conduct rational enquiry of all evaluated measurement systems, enabling objective prioritization of where improvement efforts will have the largest cost–benefit effect.
1. Introduction
Grade control is an essential element in quality assurance and quality control (QA/QC) of refined and high-quality products in many global process industry sectors, e.g., in fields from mining, ore and minerals processing to cement, pharmaceuticals, food and feed. Grade control is used to assess the quality of intermediary and final products and to control and adjust a range of critical process parameters. Grade control can be conducted in a variety of fashions specific for different situations e.g., on-line measurements, sensor measurements, in-line or at-line sampling and measurement systems, automatic or manual sampling. However, a key factor in all methods for grade control is sampling. No matter if the measurements include physical sampling extraction, or pointing a sensor to a process stream, sampling is being conducted as analysis is only addressing a very small part of the lot (physical extracted sample) or of a stream (the part interacting with the sensor). All sampling processes generate a complement of sampling errors that only can be eliminated or minimized through understanding of how and why they originate [1,2,3]. The Theory of Sampling (TOS) presents a complete framework for how to eliminate the so-called ‘incorrect sampling errors’ (ISE) and evaluate the magnitude of the remaining error effects called ‘correct sampling errors’ (CSE). The representativity of an extracted sample is of utmost importance in order to optimize resource utilisation, maximize profitability and minimizing financial risk in the complete process value chain [4]. The rationale for representative sampling, the Fundamental Sampling Principle (FSP), is that all lot units (grains, fragments, increments) have equal opportunity of ending up in the final sample. A representative sample is both accurate and reproducible, i.e., ISE have been eliminated, and CSE have been minimized through appropriate sampling procedures [2,5].
This paper gives a brief background regarding TOS and variographic characterization and presents an overview of all evaluated measurement systems. It also includes in-depth discussion of specific variograms with deviating appearances (i.e., high or unexpected variability or periodicity). The complete TOS framework and terminology is presented in the sampling standard DS 3077 [6], as well as in the other references given above.
1.1. Luossavaara Kiirunavaara AB
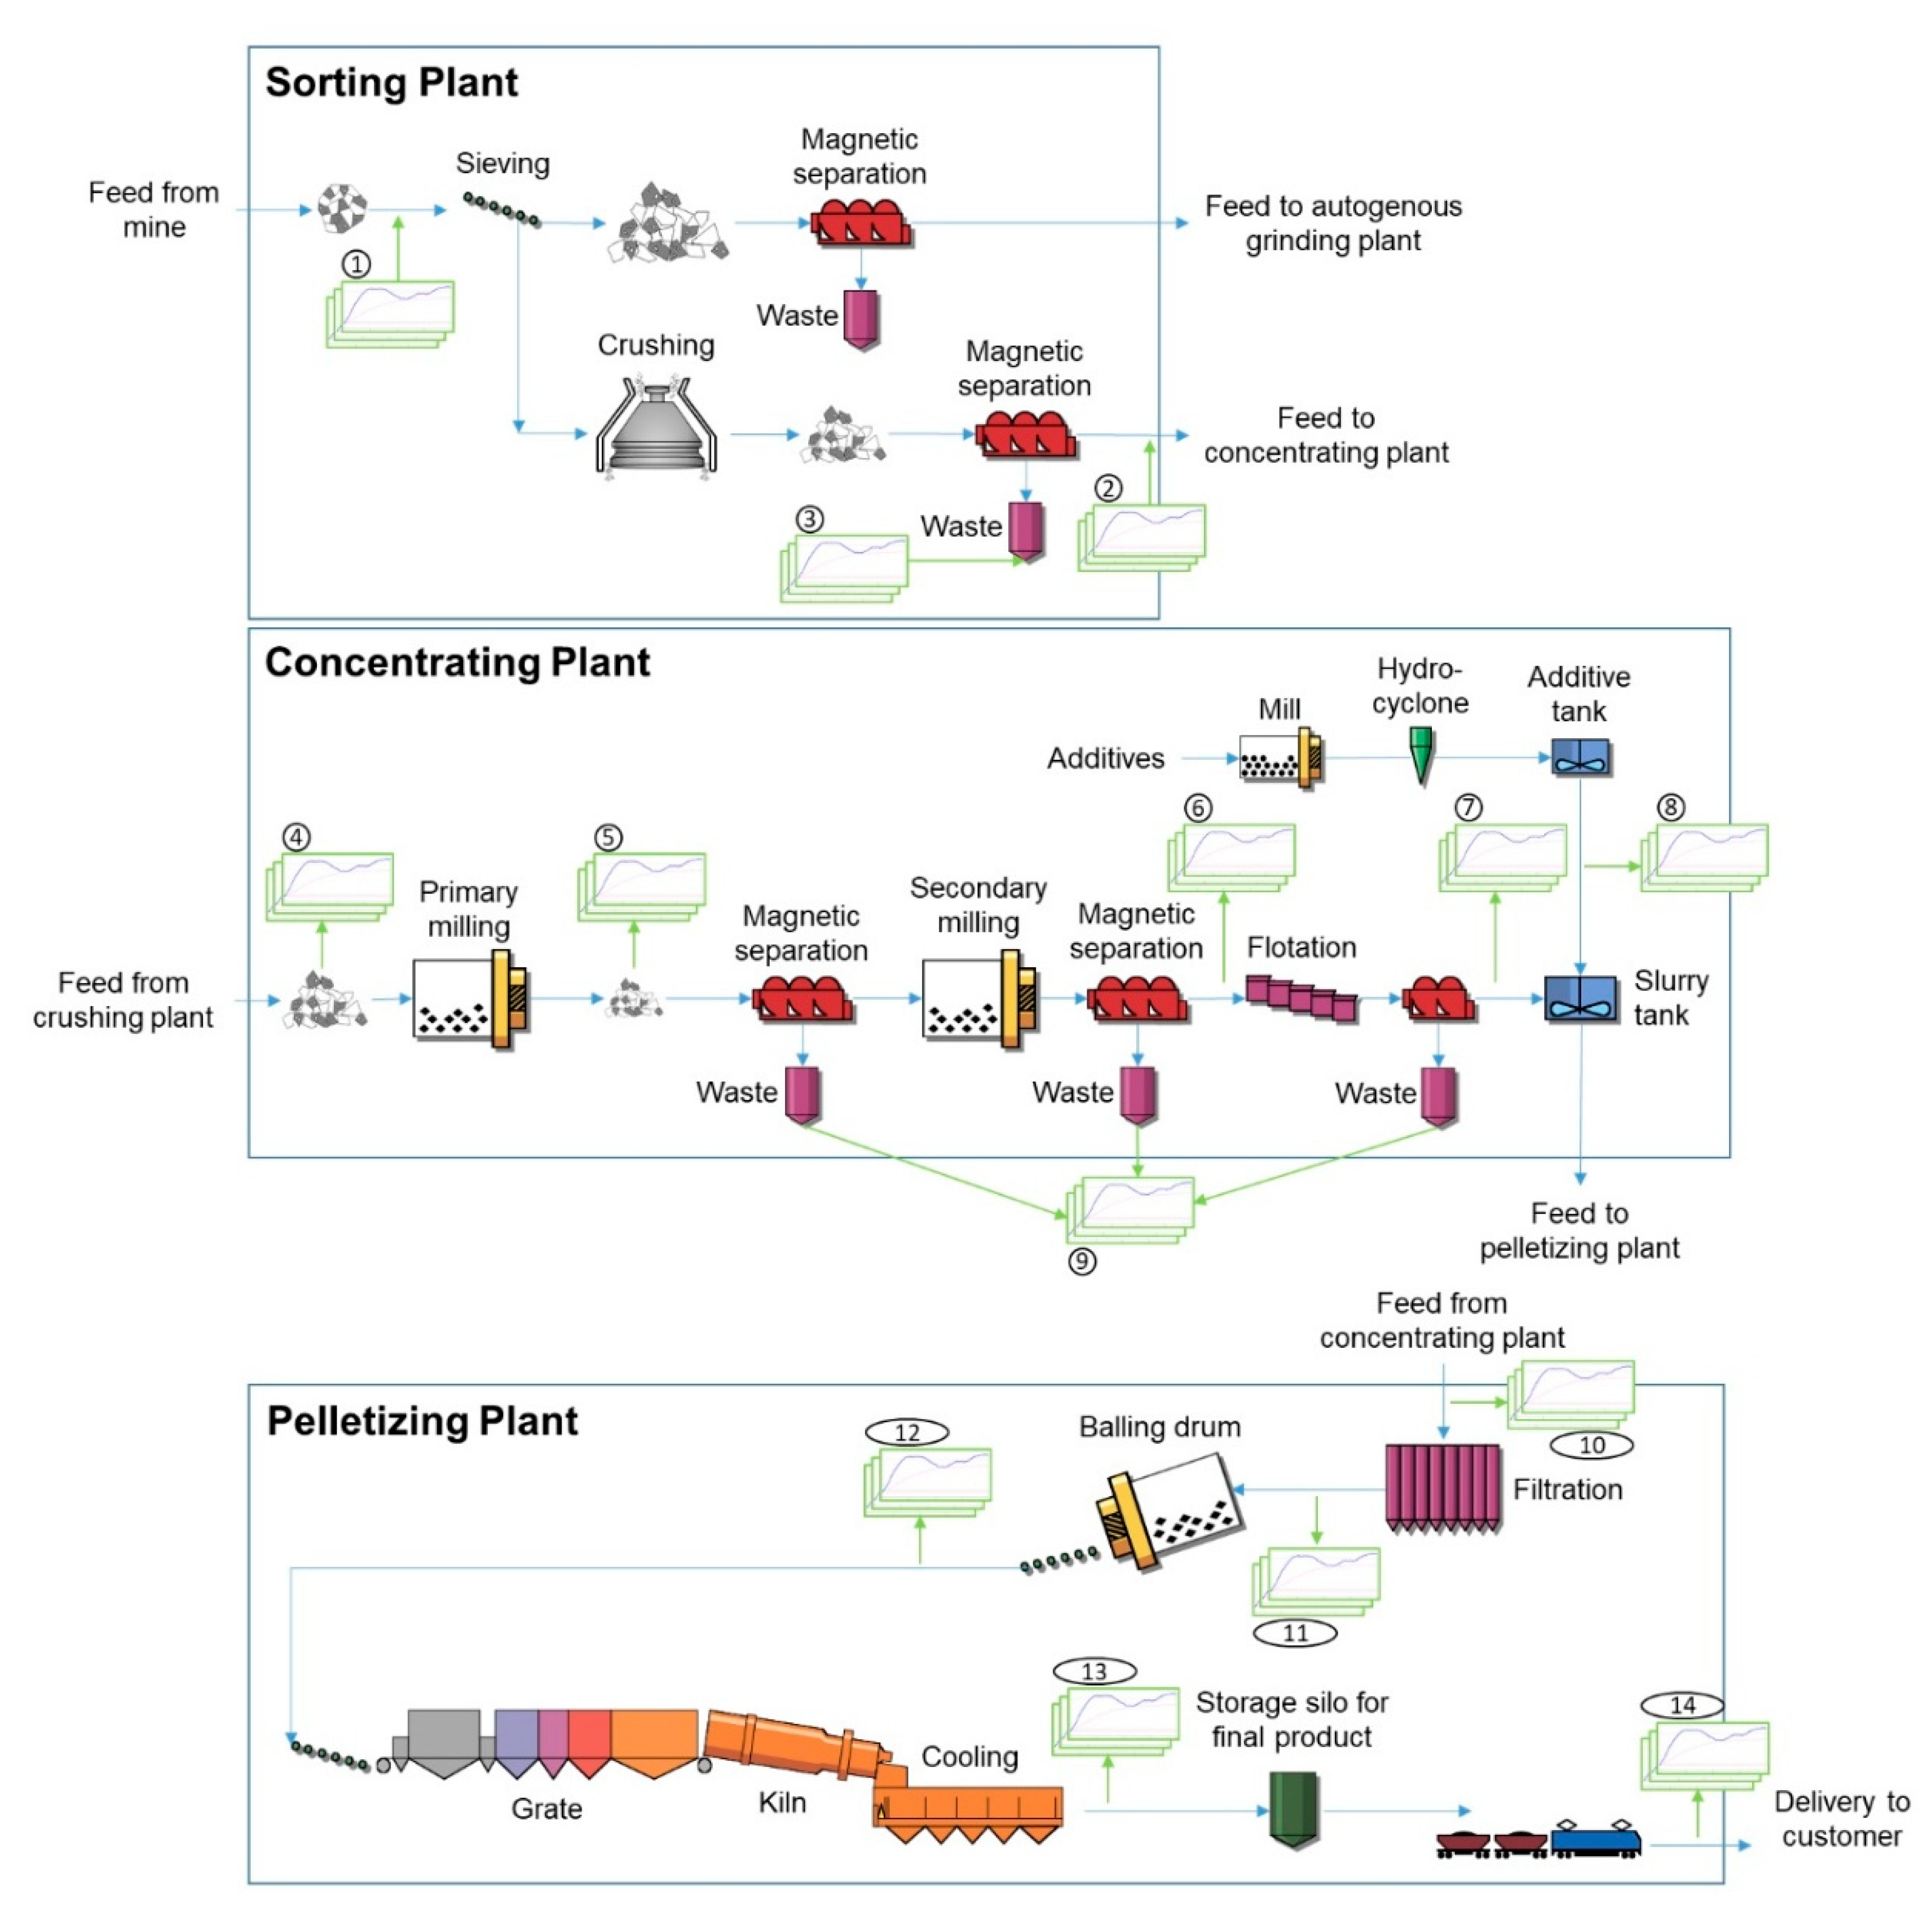
Luossavaara Kiirunavaara limited company (LKAB) is a state-owned iron ore mining company located in the north of Sweden. LKAB was founded in 1890 and has supplied the world steel market with iron ore products and been an important cog in Sweden’s industrial development for more than a hundred years. LKAB’s competitive positioning is as a high quality, sustainable supplier of processed iron ore; the main product is iron ore pellets either for blast furnace (BF pellets), or for direct reduction (DR pellets) steel making. LKAB’s iron ore operations include two underground mines and one open pit mine in Kiruna, Malmberget and Svappavaara in northern Sweden respectively. Sorting, concentrating and pelletizing plants at the three mine sites refine the mined magnetite ore to iron ore pellets, requiring only one third of the carbon emissions necessary for sintering compared to hematite pellet or one seventh compared to sintering of fines.
As the competitive advantage of LKAB is processed specialty iron ore products, and the aim is to deliver added value to customers through high quality products, it is critical to employ correct grade and quality control in all parts of the mine-to-product value chain. This is done through continuous sampling and analysis at all critical process steps, using both physical sampling combined with laboratory analysis, as well as various types of on-line, in-line and at-line measurement systems. Important quality characteristics evaluated in the grade control in LKAB processing plants are, e.g., size distribution, iron grade, silica grade, phosphorus grade, moisture content, specific surface area, crushing strength, abrasion index.
1.2. Variographic Characterization of Measurement Systems in Process Industries
Control of the LKAB production process is based on a variety of measurement systems, and the possibility for effective and correct process control is critically dependent upon representative samples. Process variability is the key monitoring objective, and the true process variability cannot be allowed to be dampened by variability components stemming from the measurement system. The total process data uncertainty is the sum of error contributions stemming from sampling, sub-sampling, sample pre-processing and analysis. Variographic characterization of continuous process data is a powerful tool for comprehensive understanding of the important relationship between process and measurement system variability [7,8], in effect providing a quality control tool for total process measurement systems. The different variability sources in process data are not identifiable using traditional statistical process control (SPC), while variographic characterization allow for decomposition into individual contributions.
Several publications exemplify and advocate the use of variographic characterization for evaluation and improvement of process measurement systems for a large variety of processes e.g., [7,8,9,10,11,12,13,14]. Variographic characterization is effective for evaluation of (i) measurement system performance [9], (ii) comparison between different measurement systems [15] and (iii) detection of adverse process variations [16,17]. These recent publications point to a broad spectrum of information that can be retrieved by applying variographic characterization to historical and current on-line process data. It is also a favourable option to conduct a variographic experiment in which to obtain information by perturbing existing processes where- or whenever this is possible.
Several publications exemplify and advocate the use of variographic characterization for evaluation and improvement of process measurement systems for a large variety of processes e.g., [7,8,9,10,11,12,13,14]. Variographic characterization is effective for evaluation of (i) measurement system performance [9], (ii) comparison between different measurement systems [15] and (iii) detection of adverse process variations [16,17]. These recent publications point to a broad spectrum of information that can be retrieved by applying variographic characterization to historical and current on-line process data. It is also a favourable option to conduct a variographic experiment in which to obtain information by perturbing existing processes where- or whenever this is possible.
1.3. Study Objectives
In contrast to many published case studies, focusing on one specific sampling system or part of the full process, this study is taking variographic characterization one step further, by applying it throughout the entire ore processing value chain in the LKAB processing plants in Kiruna, Figure 1. The aim is specifically to detect objective patterns for the range of process measurement systems deployed, and to decouple the measurement variability from the true process variability. By applying the same kind of variographic analysis to ‘all’ measurement systems and parameters used for process and quality control, in the sorting, concentrating and pelletizing processing plants, this study aims to compare measurement system performance across the entire mine-to-product pathway. This survey will then enable focused attention to the systems in most need of improvement. An additional objective is to detect patterns regarding the suite of different sampling methods, sampling intervals or analytical techniques used. This kind of complete plant process measurement system characterisation has not been performed before at LKAB.
2. Theory of Sampling (TOS)
The first vestiges of what came to be the Theory of Sampling (TOS) was initially described in 1950 and was subsequently developed over a period of 25 years Pierre Gy. Today TOS ranges as the only complete and comprehensive theory covering sampling of particulate materials [3], and many other types of heterogeneous materials. TOS include practical sampling unit operations, systematization of eight sampling errors and heterogeneity characterization. TOS is comprised by all necessary concepts and process descriptions needed to reach the overall aim of representative sampling [1,2,3,6,18].
Representative samples are imperative for valid process monitoring. It is not possible to ascertain the status of an individual sample from any characteristic pertaining to the sample itself; it is only possible to guarantee representativity of the sampling process. The role of TOS is to supply all tools necessary to always be able to design and perform representative sampling processes.
2.1. Lot Heterogeneity
All sampling operations are error-generating processes; sampling errors are a direct consequence of the interaction between the sampling process (sampling method and the equipment used) and the heterogeneity of the material. Lots of particulate materials have an inherent heterogeneity that can be discriminated at two scale levels, i.e., constitutional heterogeneity (CH) and distributional heterogeneity (DH). CH is the expression of the compositional differences between individual fragments (grains) in the lot at its current state of comminution, meaning that mixing or homogenization does not affect the CH. A sample extracted from a lot is among other affected by an error related to the CH, defined as the Fundamental Sampling Error (FSE) [3].
DH is the heterogeneity at a larger scale level between the mass of the increment and the full lot. DH denotes the compositional difference between increments (group of neighbouring fragments) of the lot. CH and DH are closely related; indeed, DH is a fraction of CH of the material being sampled. However, DH is also dependent upon the grouping factor, i.e., the mass of the sampled increment, and the segregation factor, i.e., the degree of structural heterogeneity of the distribution of the particles [2]. DH is the primary concern for the process of sample extraction as practical sampling is carried out by extracting increments from the lot. DH is a reflection of the spatial heterogeneity in the lot and the error generated by DH is termed the grouping and segregation error (GSE).
If DH were nil (an ideal state of complete spatial homogeneity), GSE would be zero, leaving only FSE. If the lot material were homogenous (an ideal, unreachable state for all materials), FSE would also be zero. However, sampling of all realistic materials in science, technology and industry, will always have some vestige of remaining GSE irrespective of how much this has been suppressed (often GSE is only suppressed to a level so that GSE + FSE can be proved to fall below an a priori expressed maximum acceptance level). The logistics of practical sampling, to reach a state in which FSE + GSE are the only effective sampling errors remaining, a correct sampling process, is an essential part of TOS. To this goal practical representative sampling is always first about how to eliminate the incorrect sampling errors [1,2,3,6,18].
2.2. Process (1D) Sampling and Sampling Errors
The heterogeneity carried by the full lot can be described as a complex totality of CH and DH, where the dimension of the lot is an important determinant. Lot dimensionality is related to the effective number of dimensions involved in physical extraction of a sample form the lot. Zero dimensional (0D) lots, i.e., all smaller batches which can be mixed, manipulated, moved and sampled with complete correctness, are only affected by the heterogeneities described above. Regarding industrial processes, as the ones addressed in the present study, the one-dimensional (1D) lot is the most common lot configuration. 1D lots are defined as elongated piles or process streams of material that can be sampled correctly through an increment-taking process, where a full (and intact) cross section of the material is extracted at regular intervals [19].
In process sampling, increments are often combined (aggregated) to form composite samples. Process sampling is, apart from the short-range heterogeneity fluctuation error (CE1), which is the sum of FSE and GSE, also affected by the long-range fluctuation error (CE2), called the trend error, and the periodic fluctuation error (CE3) [3]. These two errors are not solely dependent upon the properties of the material in the lot, but also on variations stemming from the production processes and/or operator actions.
The process of representative sampling starts with elimination of all incorrect sampling errors (ISE), related to wrongful materialization of the primary increments. ISE includes the increment delimitation error (IDE) related to how the equipment for sample extraction is designed, the increment extraction error (IEE) related to how the sample extraction is performed, the increment weighing error (IWE) related to the weighing of individual increments and the increment preparation error (IPE) representing all adverse changes to the sample after extraction [3]. To the degree that these errors have not been fully eliminated, this will generate a sampling bias. In contrast to the ISE, the correct sampling errors (CSE), comprised of FSE and GSE, cannot be fully eliminated. However, to achieve representative sampling with acceptable precision, the CSE need to be satisfactorily minimised through appropriate sampling protocols [6]. Reduction of GSE is achieved by extensive mixing or blending of the lot, and/or by increasing the number of primary increments making up a composite sample. The most straightforward way of reducing FSE is to comminute the lot material to a smaller particle size and/or increase the sample mass, of which the former is by far the most effective [6].
The sampling bias is by nature inconstant. In contrast to an analytical bias, the sampling bias cannot be statistically quantified and can therefore not be corrected for. The sampling bias is an unavoidable consequence of non-eliminated ISE. In practical situations, a sampling bias will inflate the total measurement system variability unnecessarily. This variability cannot be reduced by increasing the sample mass, number of increments, or replicating the analysis, it can only be eliminated by applying TOS correct sample extraction protocols.
Practical sampling: Practical sample extraction from industrial processes can be performed in countless different ways. Correct sampling processes are essential for valid process control decisions. Nevertheless, poor sampling practices are often found in the mining industry, leading to suboptimal use of resources, increased costs and loss of revenue [4]. The most important rule of process sampling (both slurries or dry particulate material) is to extract a complete cross section of the material stream at regular intervals. This is preferably done at a transfer point between conveyor belts or at dedicated pipeline sampling stations. In most practical mineral process situations, manual sampling is not sufficient as the flow rate generally is too high to enable extraction of a complete cross section. Cross belt cutters (i.e., hammer samplers), are not recommended as they are unable to materialise the complete depth of the ore stream without damaging the conveyor belt and therefore leaving a residual of fine material on the bottom of the belt [20]. A correctly designed cross stream sampler is the preferred solution for extracting representative process increment and samples. These can be combined with automated secondary sampling equipment (e.g., rotary sample dividers) and different forms of automated analytical equipment (e.g., size determination, crushing strength, moisture content or XRF) [21]. Slurry samples in mineral processing are often extracted from long and sometimes pressurized pipes. Common current sampling equipment include shark fin and spear samplers, but these are only extracting a part of the stream all of the time. As they do not result in a complete cross section, severe IDE and IEE are introduced, thereby generating a sampling bias [3]. A perfect TOS correct method for slurry sampling is the Vezin sampler operating on falling streams [22].
2.3. Variographic Characterization
To evaluate the performance of a process measurement system, it is important to understand all the different sources of variabilities. These include (i) sampling error contributions, (ii) analytical errors and (iii) true process variations. There can be large variations in the relative proportions of these error components and their uncertainty influences on any given process data series. In principle, each process situation needs to be assessed on its own merits, which is where TOS’ general principles come to the fore.
Variographic characterization is a structured way of estimating the magnitude and origin of different sources of variability in process data, including estimating the so-called minimum practical error (MPE), aka the nugget effect (V(0)) [1]. Variographic characterization is applicable to all ordered 1-D time or space data series, e.g., process monitoring data or similar experimental data. The variogram most often used is characterized by the relative heterogeneity contributions (hq), equation 1, rather than the absolute analytical concertation (aq). The relative variogram is applied in this study as the focus is to compare variograms for the different sampling protocols in use at LKAB.
The method of variographic characterization, including full mathematical description and all evaluation criteria, is presented in detail in the historical TOS literature and in more recent overview publications e.g., [1,2,3,5,7,8,11]. Point calculations of the relative semi-variogram is following Equations (1) and (2). This variogram is often called the semi-variogram, because of division by a factor 2 needed in order to express the variability as a standard statistical variance.
- v(j): variogram point estimations (expressed as statistical variances)
- Q: total number of measurements used for variographic characterisation
- j: lag (distance between samples in time or space)
- hq: heterogeneity contribution for the sample q
- aL: mean analytical concentration for the lot
- aq: analytical concentration for sample q
- Ms: sample mass (or increment mass).
There are three main characteristics of a variogram: the range, the sill and the nugget effect, all explained in Table 1. TOS is the theoretical framework that has analysed the full meaning of the nugget effect in process sampling, by specifying it as the sum of all remaining ISE plus all CSE, as well as the Total Analytical Error (TAE) effects associated with the current sampling protocol. The nugget effect (or MPE), is thus an estimate of the sum of all residual variance contributions from the total measurement system (sampling, preparation and analysis). Table 1 presents a brief description of the interpretation of the individual components in the semi-variogram.
A critically important feature of the semi-variogram is the nugget-to-sill ratio. This ratio expresses the relative percentage of the variance that is related to the total measurement system in comparison to the overall observable variability, represented by the sill [2,3,23]. This ratio is a quality grading of the total process measurement system; it must be smaller than 30% in order for the process measurement system to be qualified [6]; for specific applications a lower threshold may be appropriate [6,7,8]. The nugget-to-sill ratio is therefore a very useful tool when assessing and comparing different process measurement systems.
3. Results
3.1. Variographic Characterization
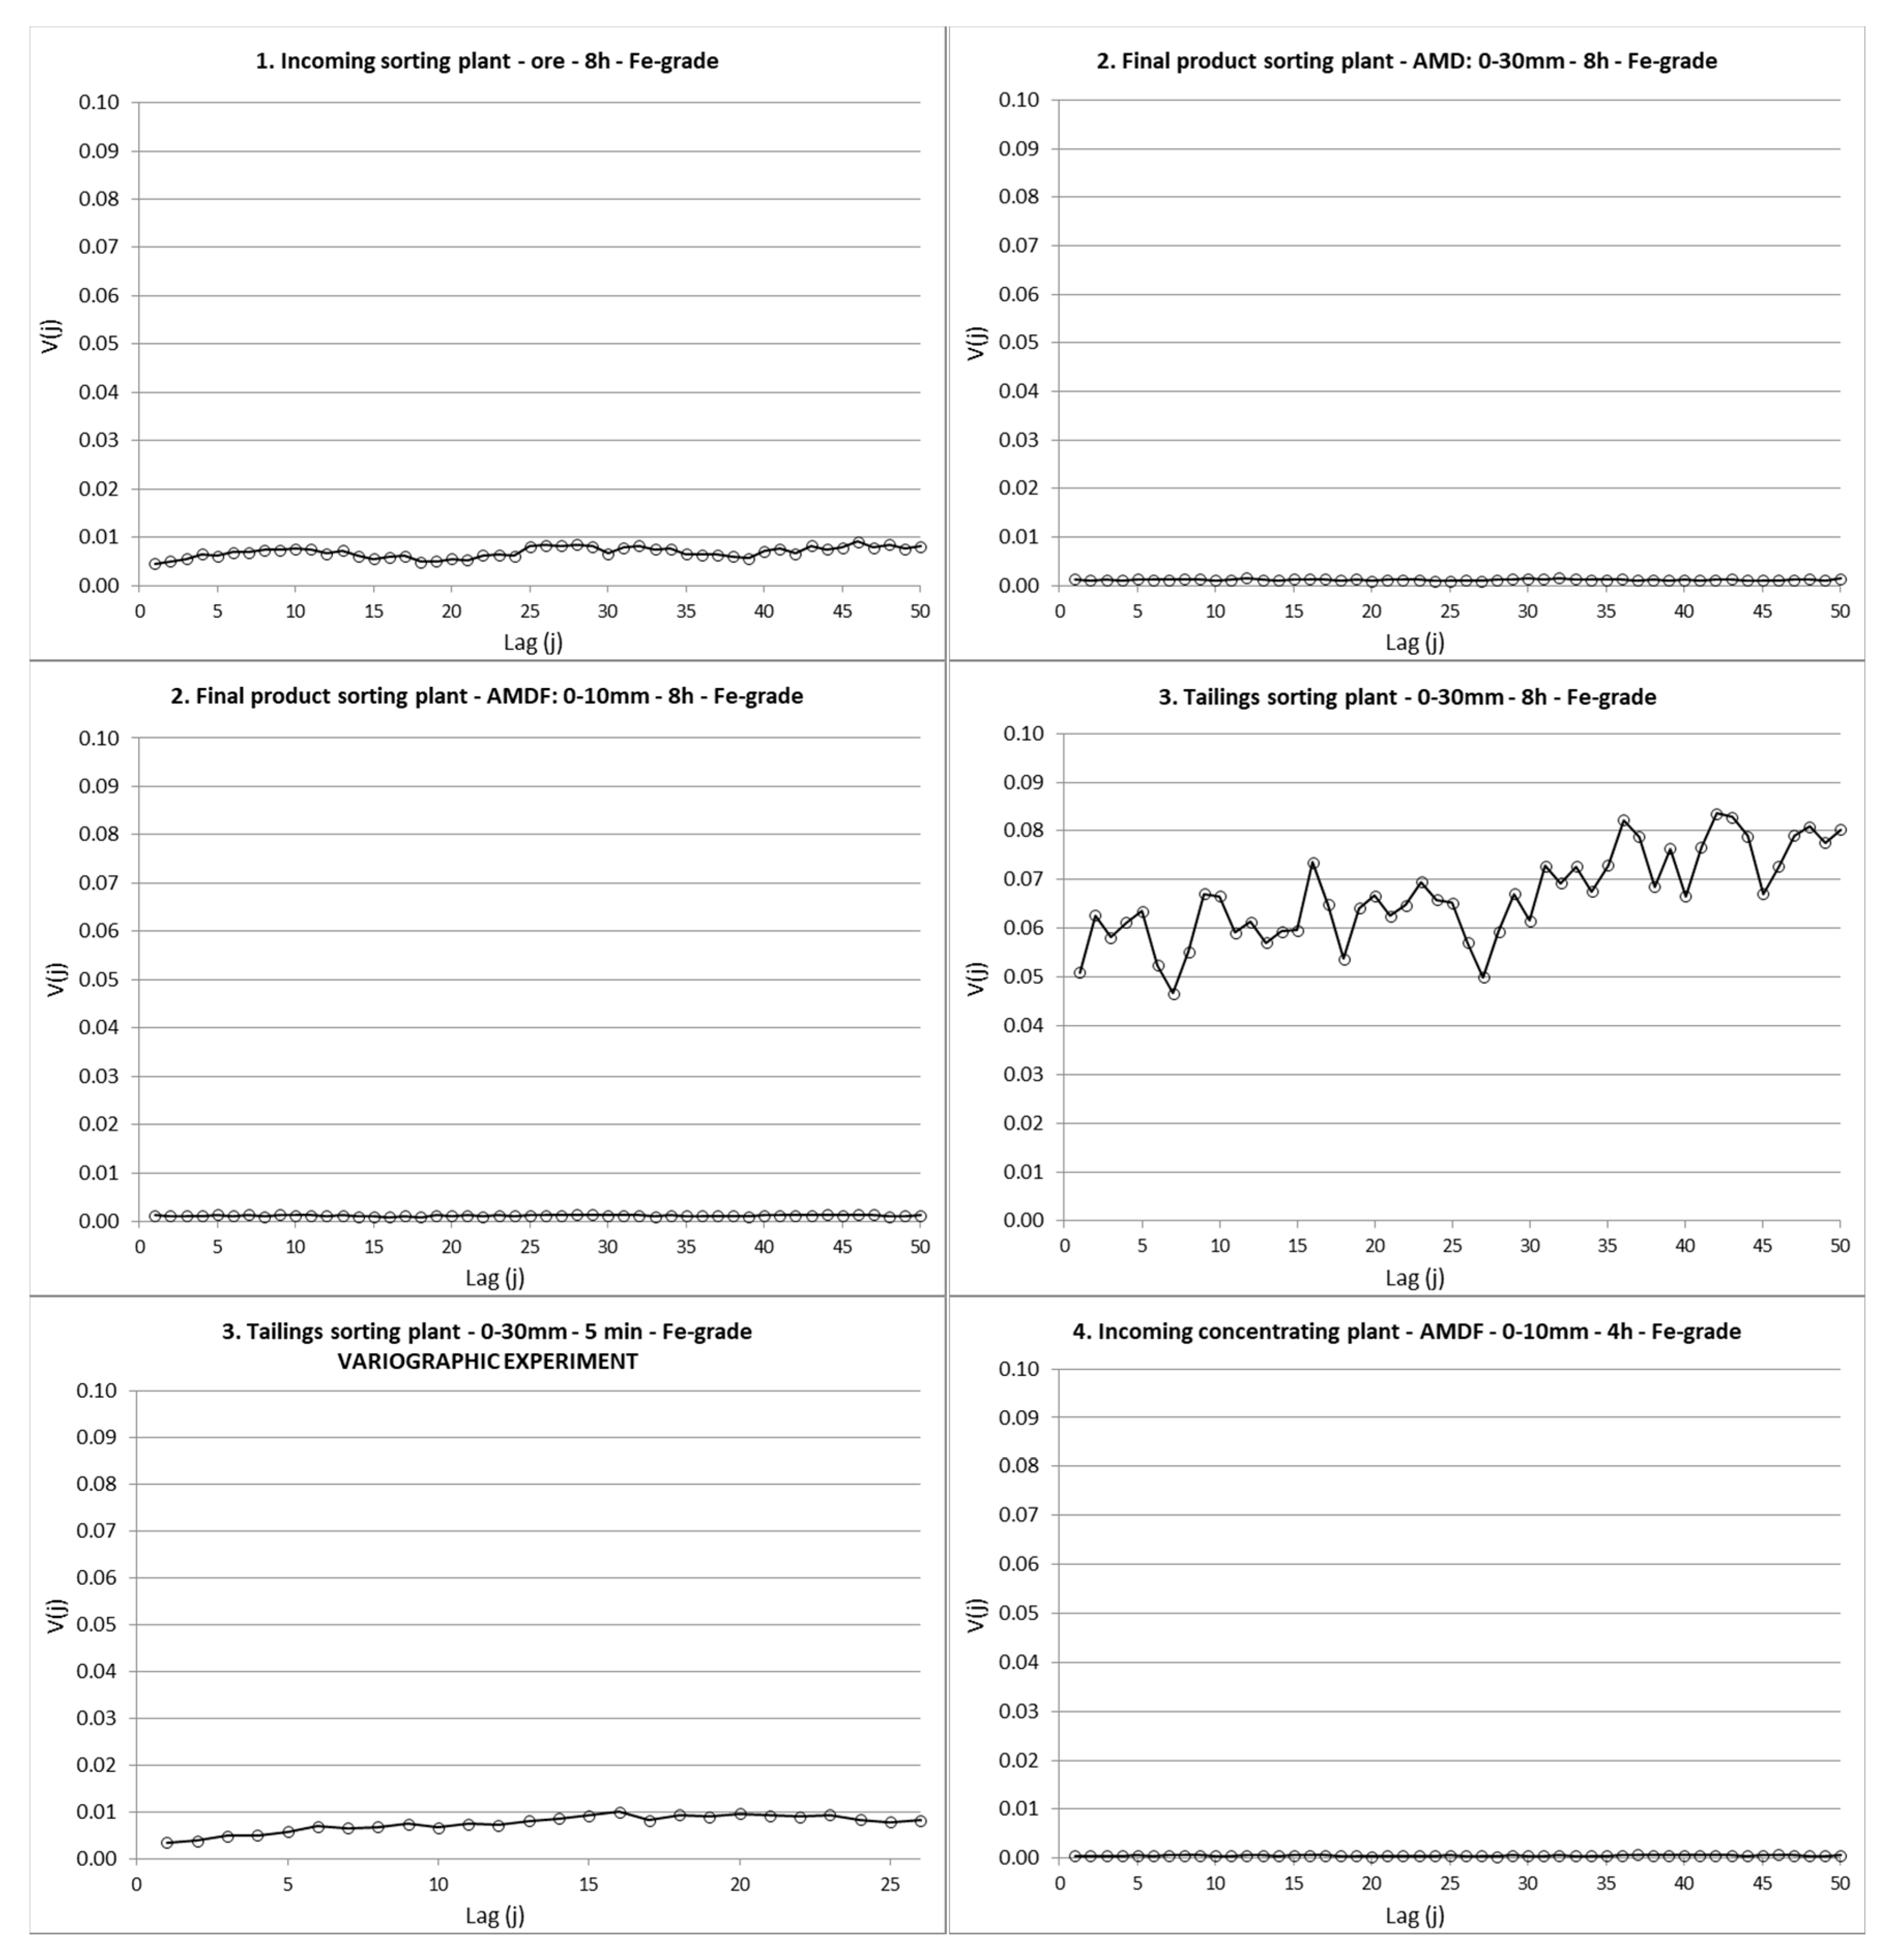
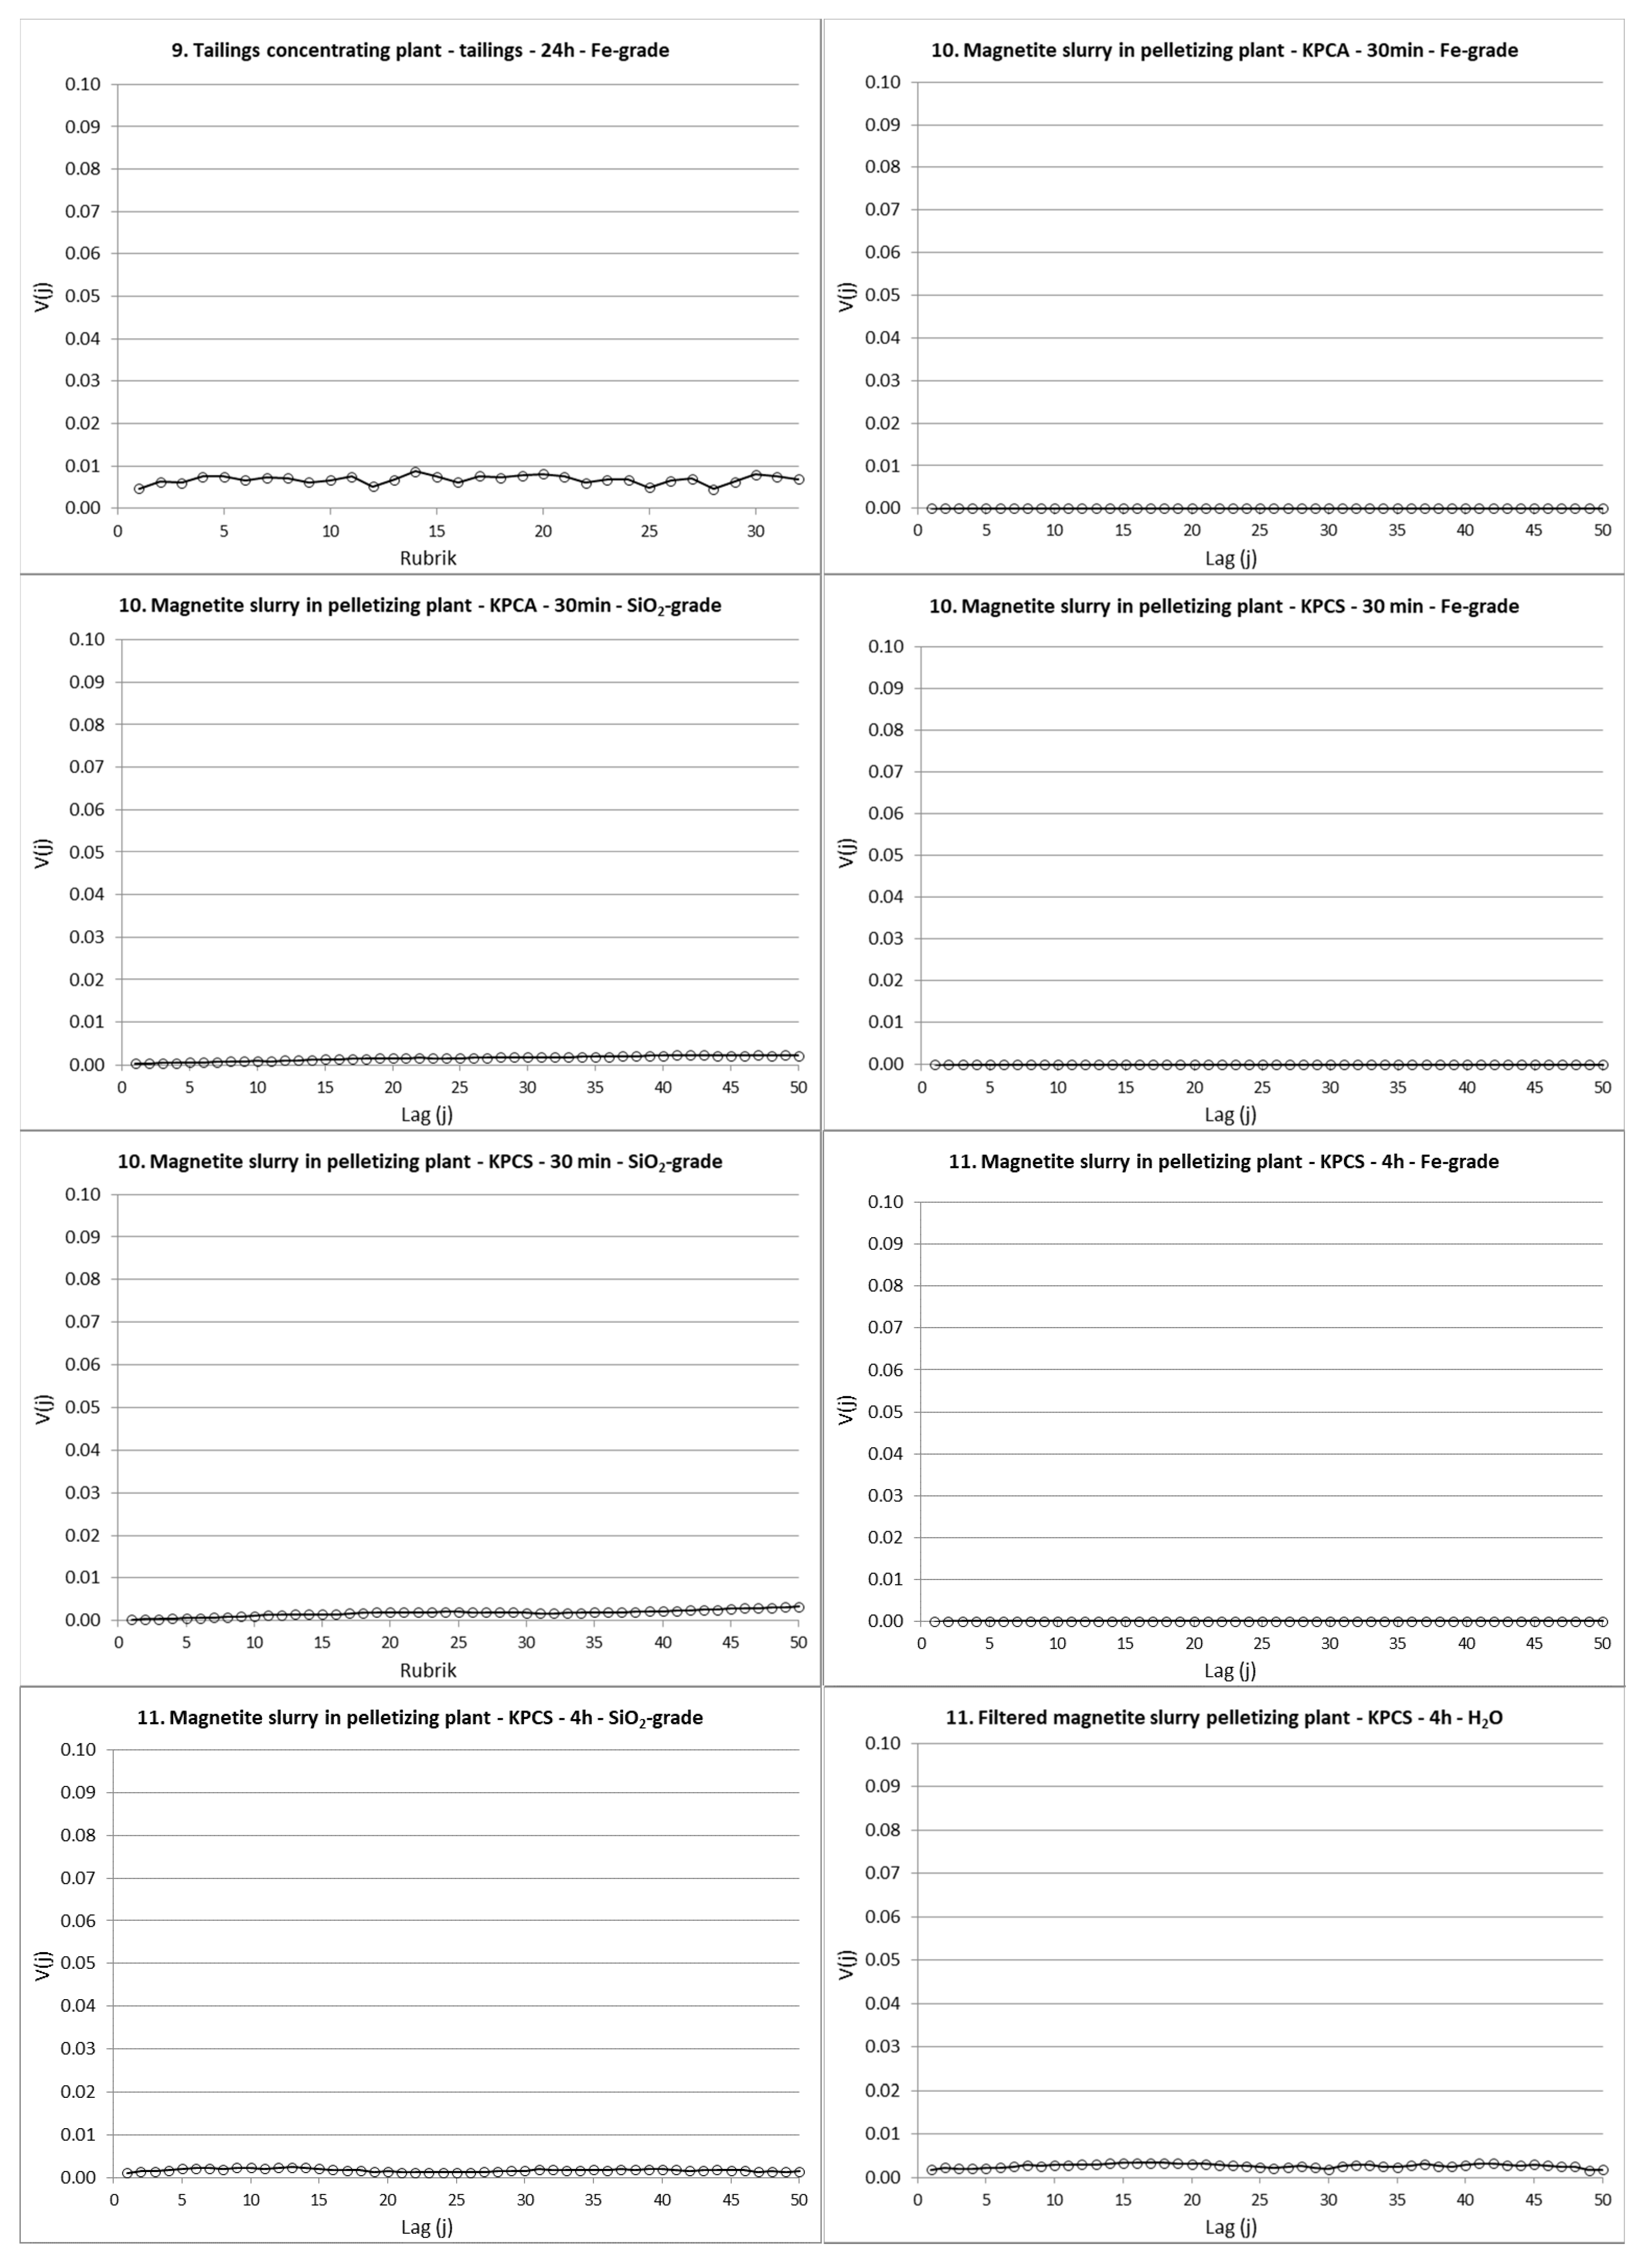
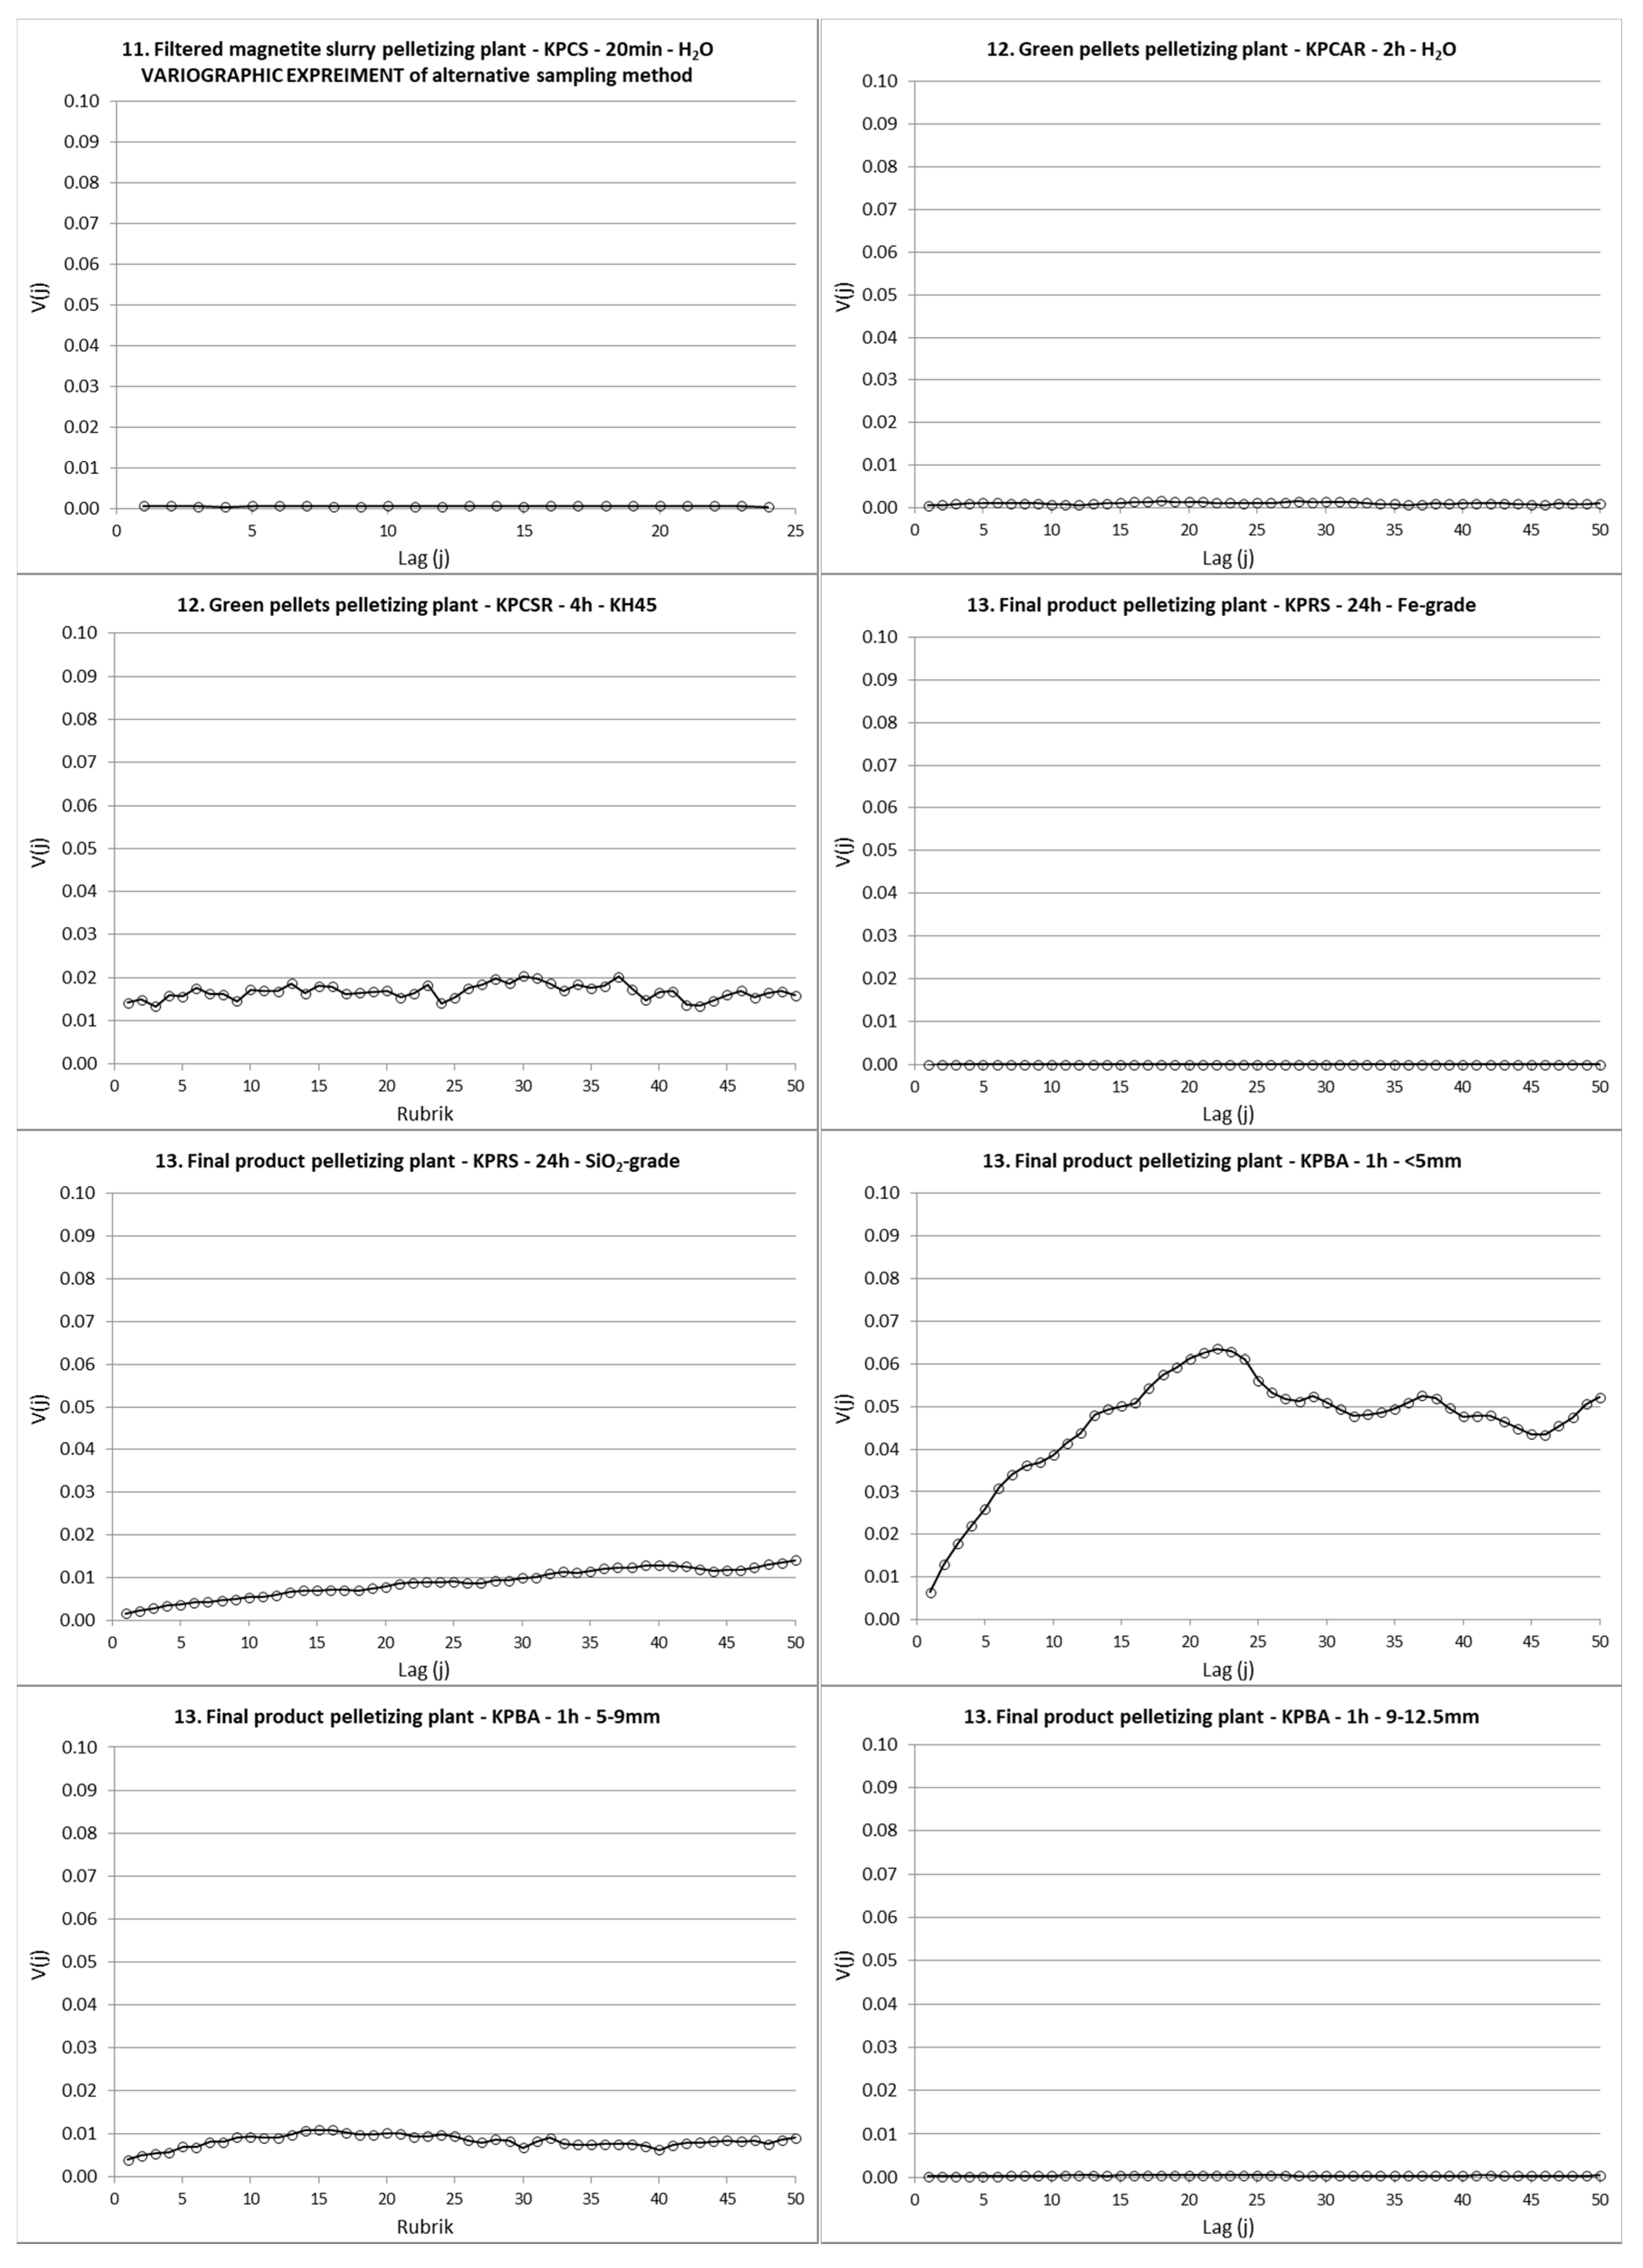
The variographic characterisation of the full iron ore processing value chain, at 14 sampling locations, see Figure 1, resulted in a total of 120 individual semi-variograms. For each sampling location and analytical parameter, two to four variograms were prepared, using 100 data points from separate process times. The purpose of generating replicated variograms for each measurement system was to enable assessment of the general performance for each measurement system over a selected, representative time interval for each measurement system. The objective was to cover six months of operation for measurement systems with up to one-hour analytical interval and one year of operation for measurement systems with more than one hour analytical interval. The selection was based on local process experiences, e.g., locating time periods with stable measurement system performance and eliminating time periods for maintenance shutdowns of the plants. Based hereupon this paper will only present one exemplar variogram for each measurement system, inferred to show the typical performance at each location. To enable a first comparison between the different measurement systems, all relative semi-variograms (except one) are presented on equal scaled y-axis, Figure 2. The choice of relevant lag units for each location/measurement system reflects the current sampling interval used at LKAB. The overview of all calculated variograms is presented below, as a first base-line characterisation of the critical process measurement systems.
The overview results show that the majority of the relative variograms exhibit a low total variability, below 0.01. For many measurement systems this is indicating that the specific processes are stable. However, detailed inspection of individual variograms reveal sampling locations with opportunity for improvements, i.e., where lower process variability and/or lower measurement variability, is needed. The nugget-to-sill ratio is used to quantify if the measurement systems are fit-for-purpose to describe the variability of the process monitored, i.e., if the measurement system variability is below 30% [6].
3.1.1. High-Sill Variograms
Three relative variograms show significantly higher variabilities compared to all other, i.e., sill levels of ≈0.05, ≈0.07 and ≈0.14, respectively. Two of these three high-sill variograms are increasing variograms. These two variograms are describing the measurement systems 13: final product in pelletizing plant, 1 h analysis for <5 mm size fraction and sampling location 14: final product ship loading, 4 min analysis of 5–9 mm size fraction. The measurement systems for these two locations are equivalent, i.e., automated linear cross stream samplers, extracting increments every five and three minutes respectively. Both measurement systems further include automated rotary division and on-line sieving analysis. Both variograms exhibit a low nugget effect and low nugget-to-sill ratios of ≈10% and ≈14%, respectively. This show that these two measurement systems are fit-for-purpose to describe the large variability seen in the size fractions of the production and ship loading processes.
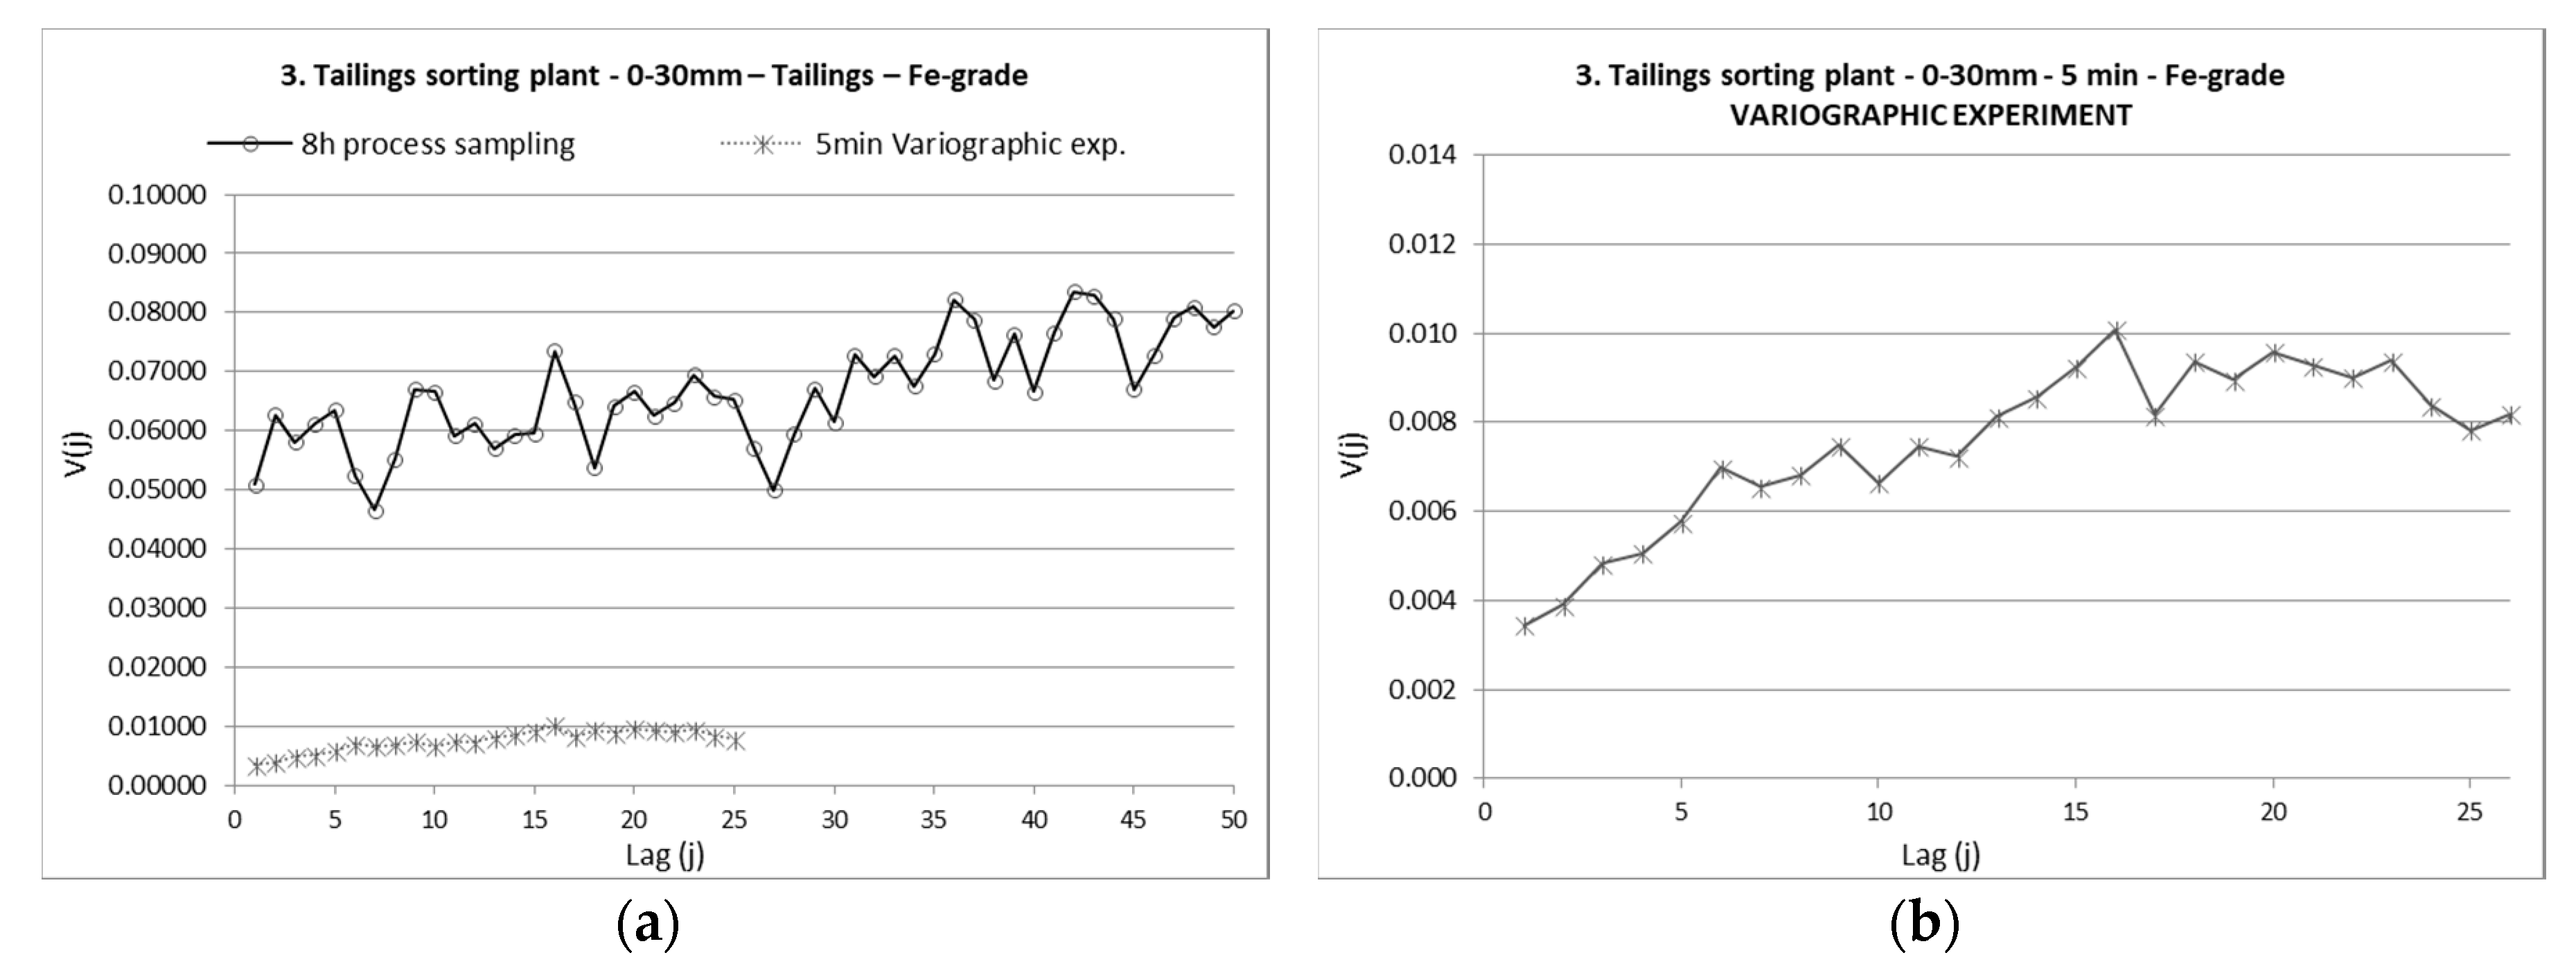
The third variogram showing a high sill level is at sampling location 3: tailings in the sorting plant, 8h analysis for iron-grade. This variogram is close to flat, indicating that a large fraction of the visible variability is stemming from the measurement system. The nugget-to-sill ratio is approximately 70%, showing that the measurement system is inadequate for describing the process variation for Fe-grade of the 0–30 mm tailings in the concentrating plant. To study this measurement system in more detail, a further experiment was executed, extracting and analysing primary increments every five minutes, Figure 3. This experiment shows a lower sill, consistent with that the time for the experiment covered only four hours compared to the process variogram covering 80 h of production. The nugget effect for the five-minute sampling interval is significantly lower, compared to the eight-hour interval for process sampling, which is fully as expected when the sampling interval is lowered. However, the nugget to sill ratio is now approximately 35% which indicate that even with this small sampling interval, the measurement system is barely fit-for-purpose for evaluating the Fe-grade of tailings in the sorting plant.
3.1.2. Medium-Sill Variograms
Four of the variograms indicate slightly higher overall variabilities of the low-sill types (Figure 4). These four show sill levels of ≈0.018, 0.012, 0.010 and 0.016. The morphology of these medium-sill variograms are significantly different.
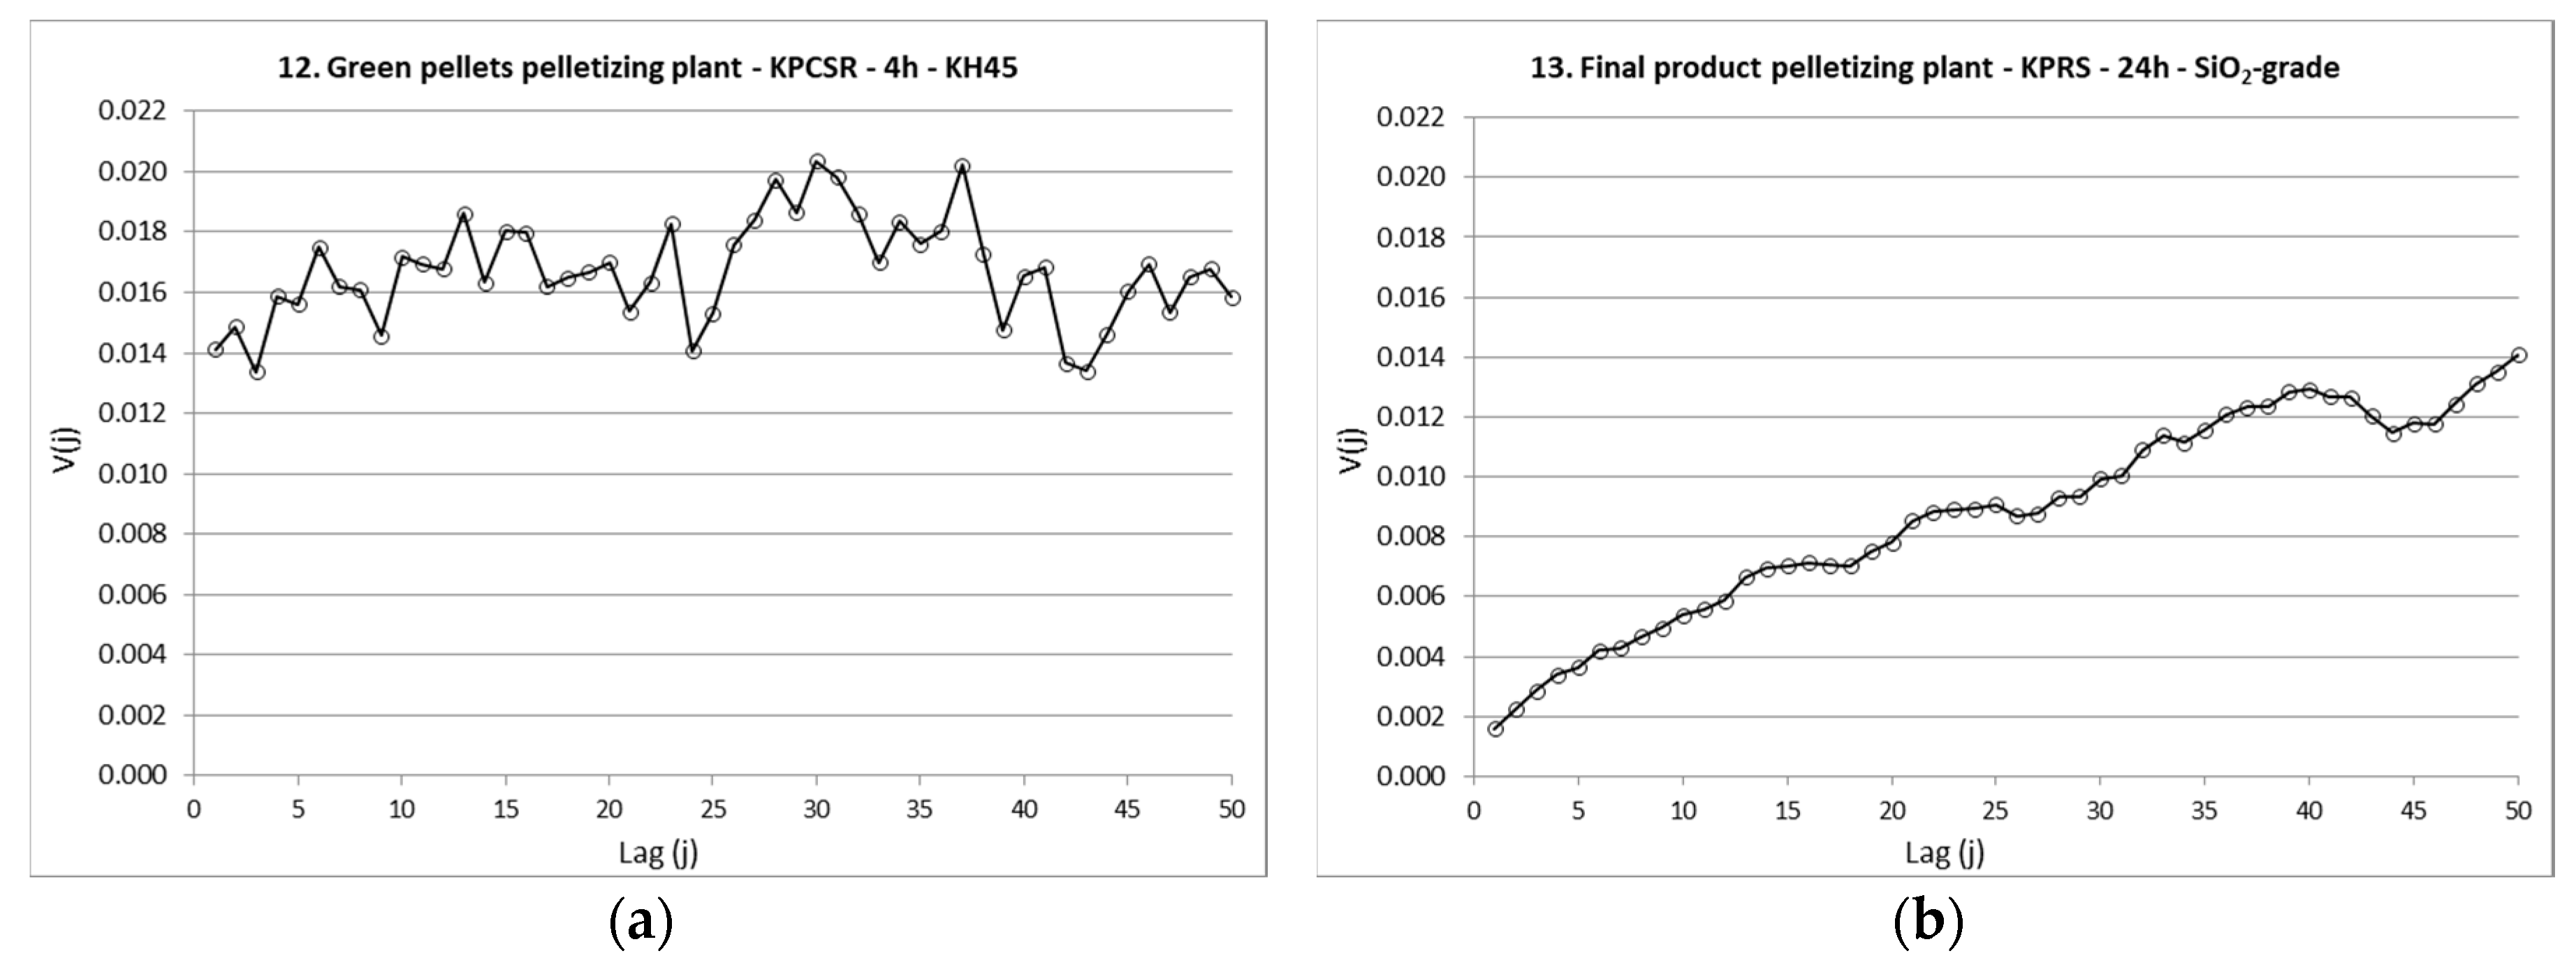
Measurement system 12 (Figure 4a) 4h KH45 analysis of green pellets, is showing a typical flat variogram with a nugget-to-sill ratio of 81%. This measurement system is in itself responsible for the majority of variability observed. This means that the measurement system error is prohibiting a reliable visualization of the true process variability.
Measurement system 13 (Figure 4b) 24 h analysis of silica grade of the final product, DR pellets, shows a continuously increasing variogram, meaning that the autocorrelation between silica grade measurements is sustained throughout the complete process time available for the variogram. The nugget effect is low, and the nugget-to-sill ratio is 10%, showing that the measurement system is fit-for-purpose for determining silica grade of the DR pellets.
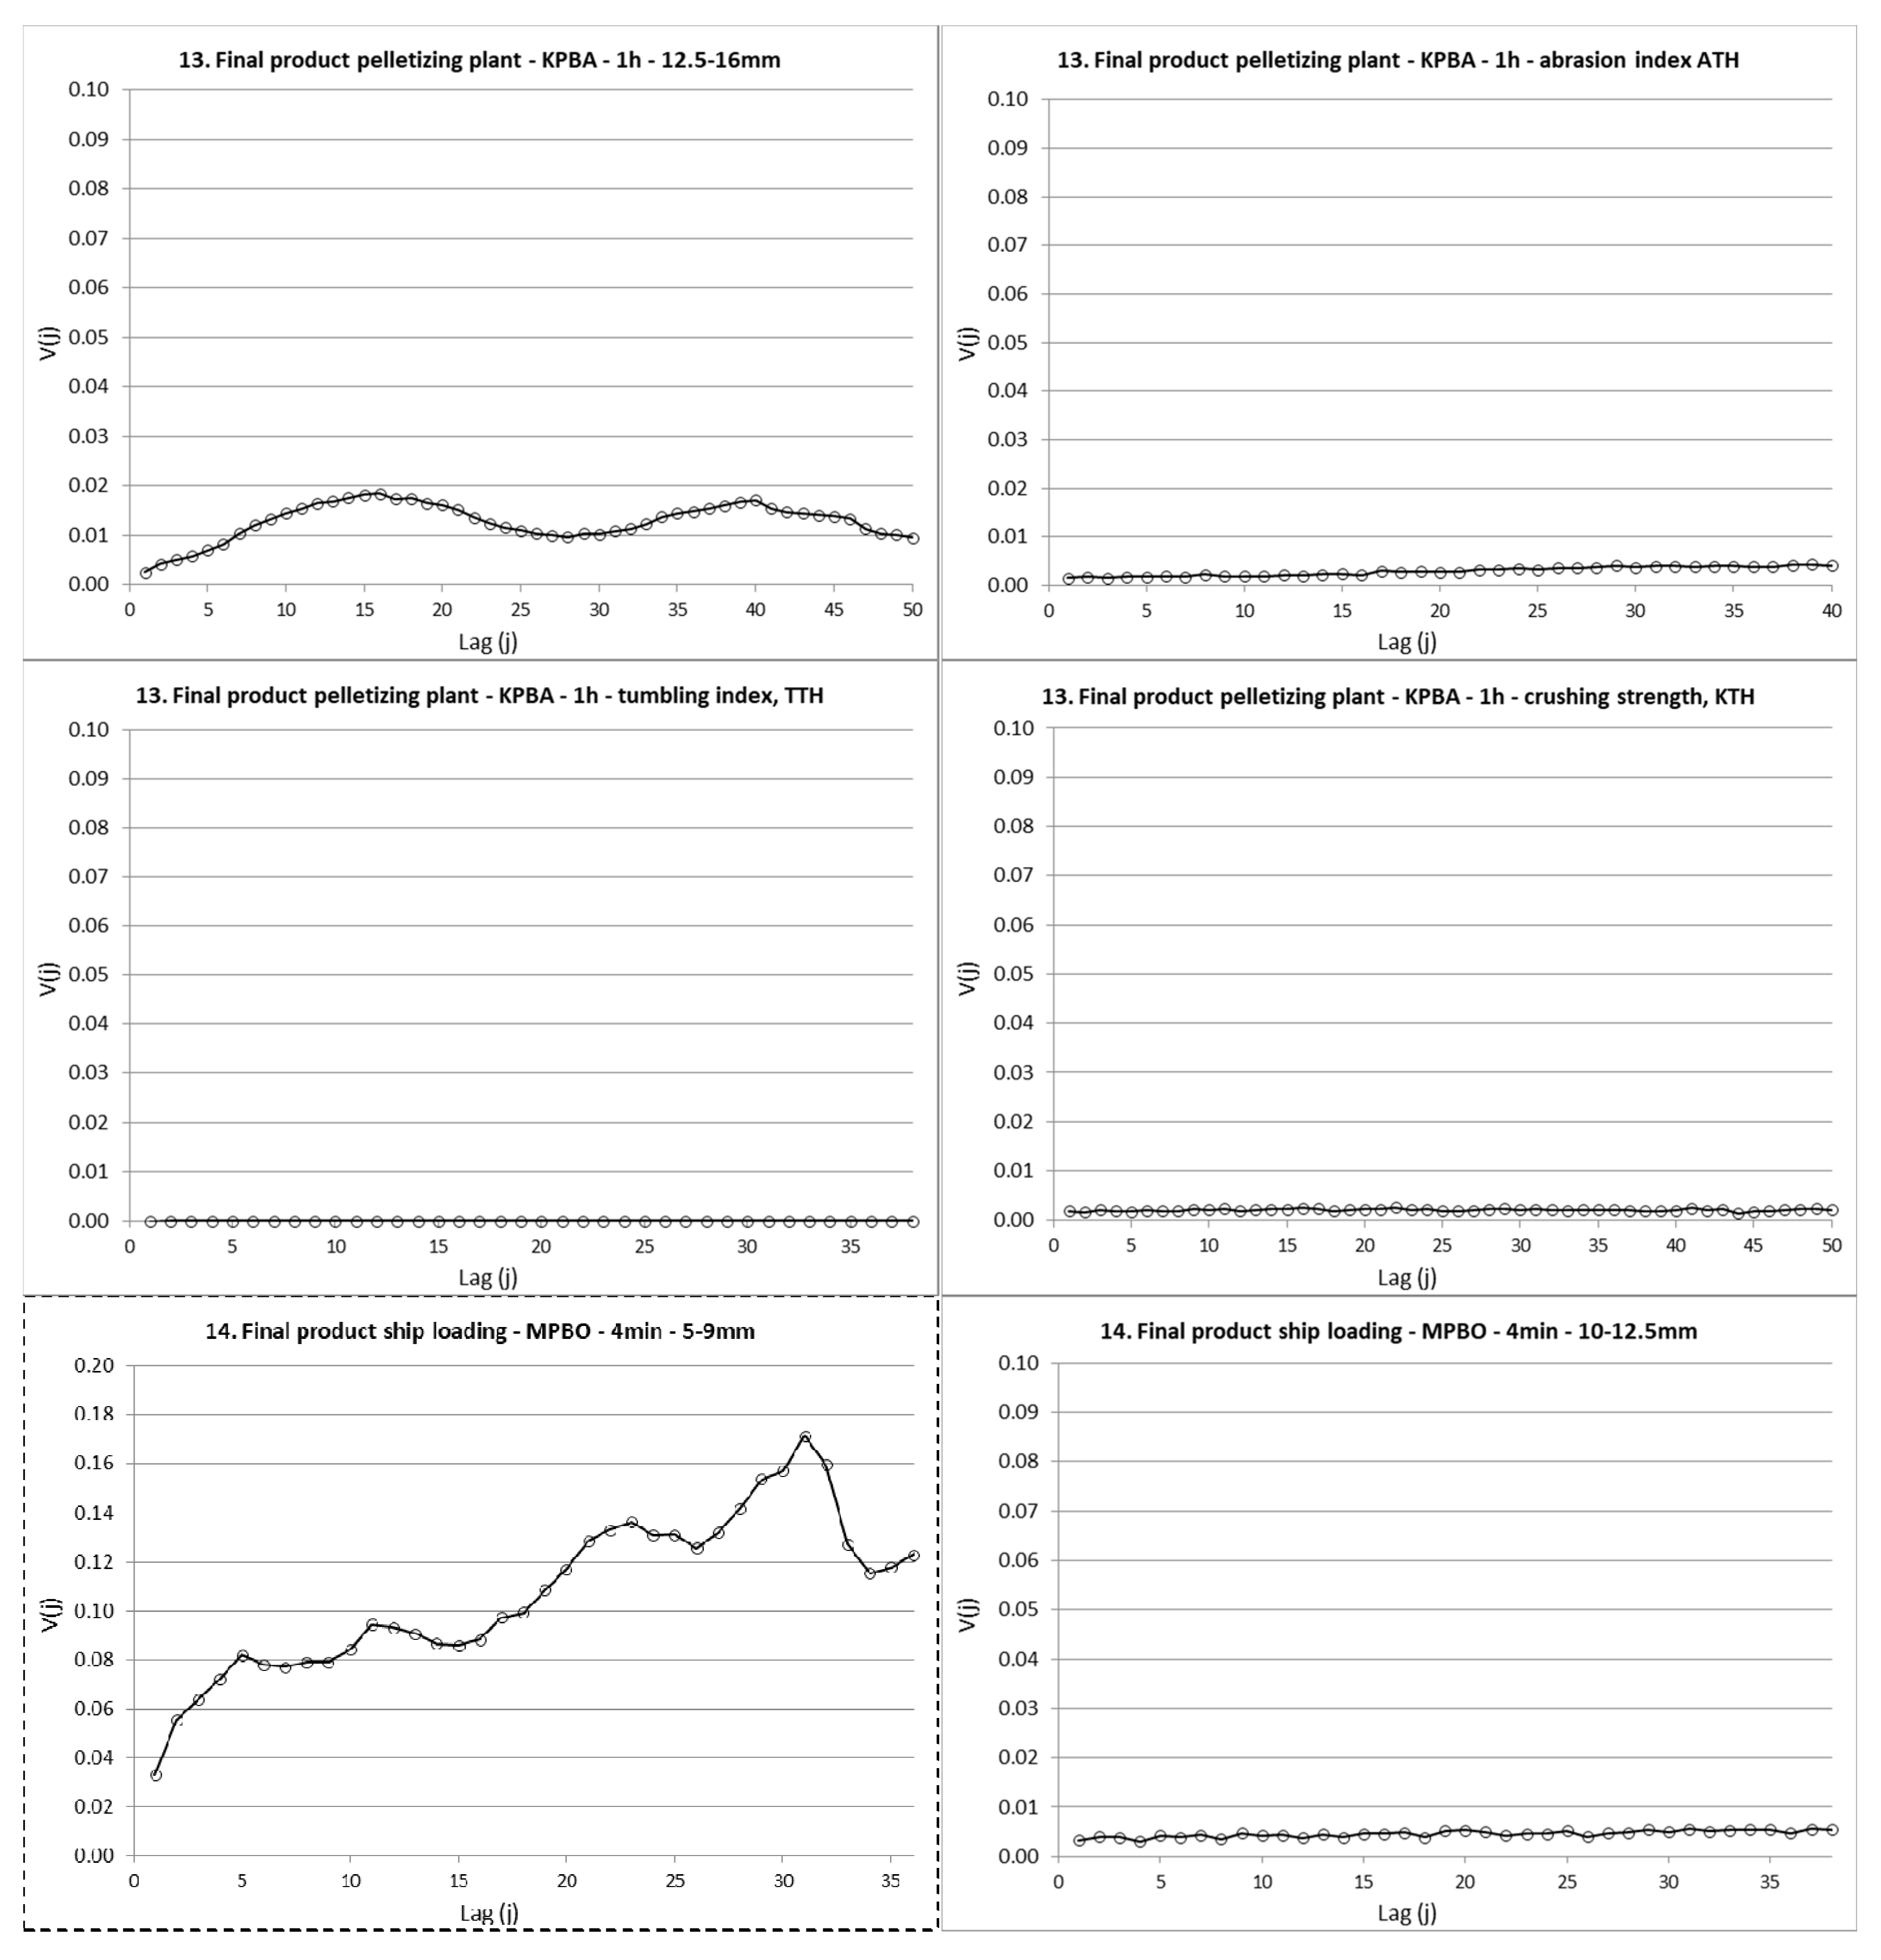
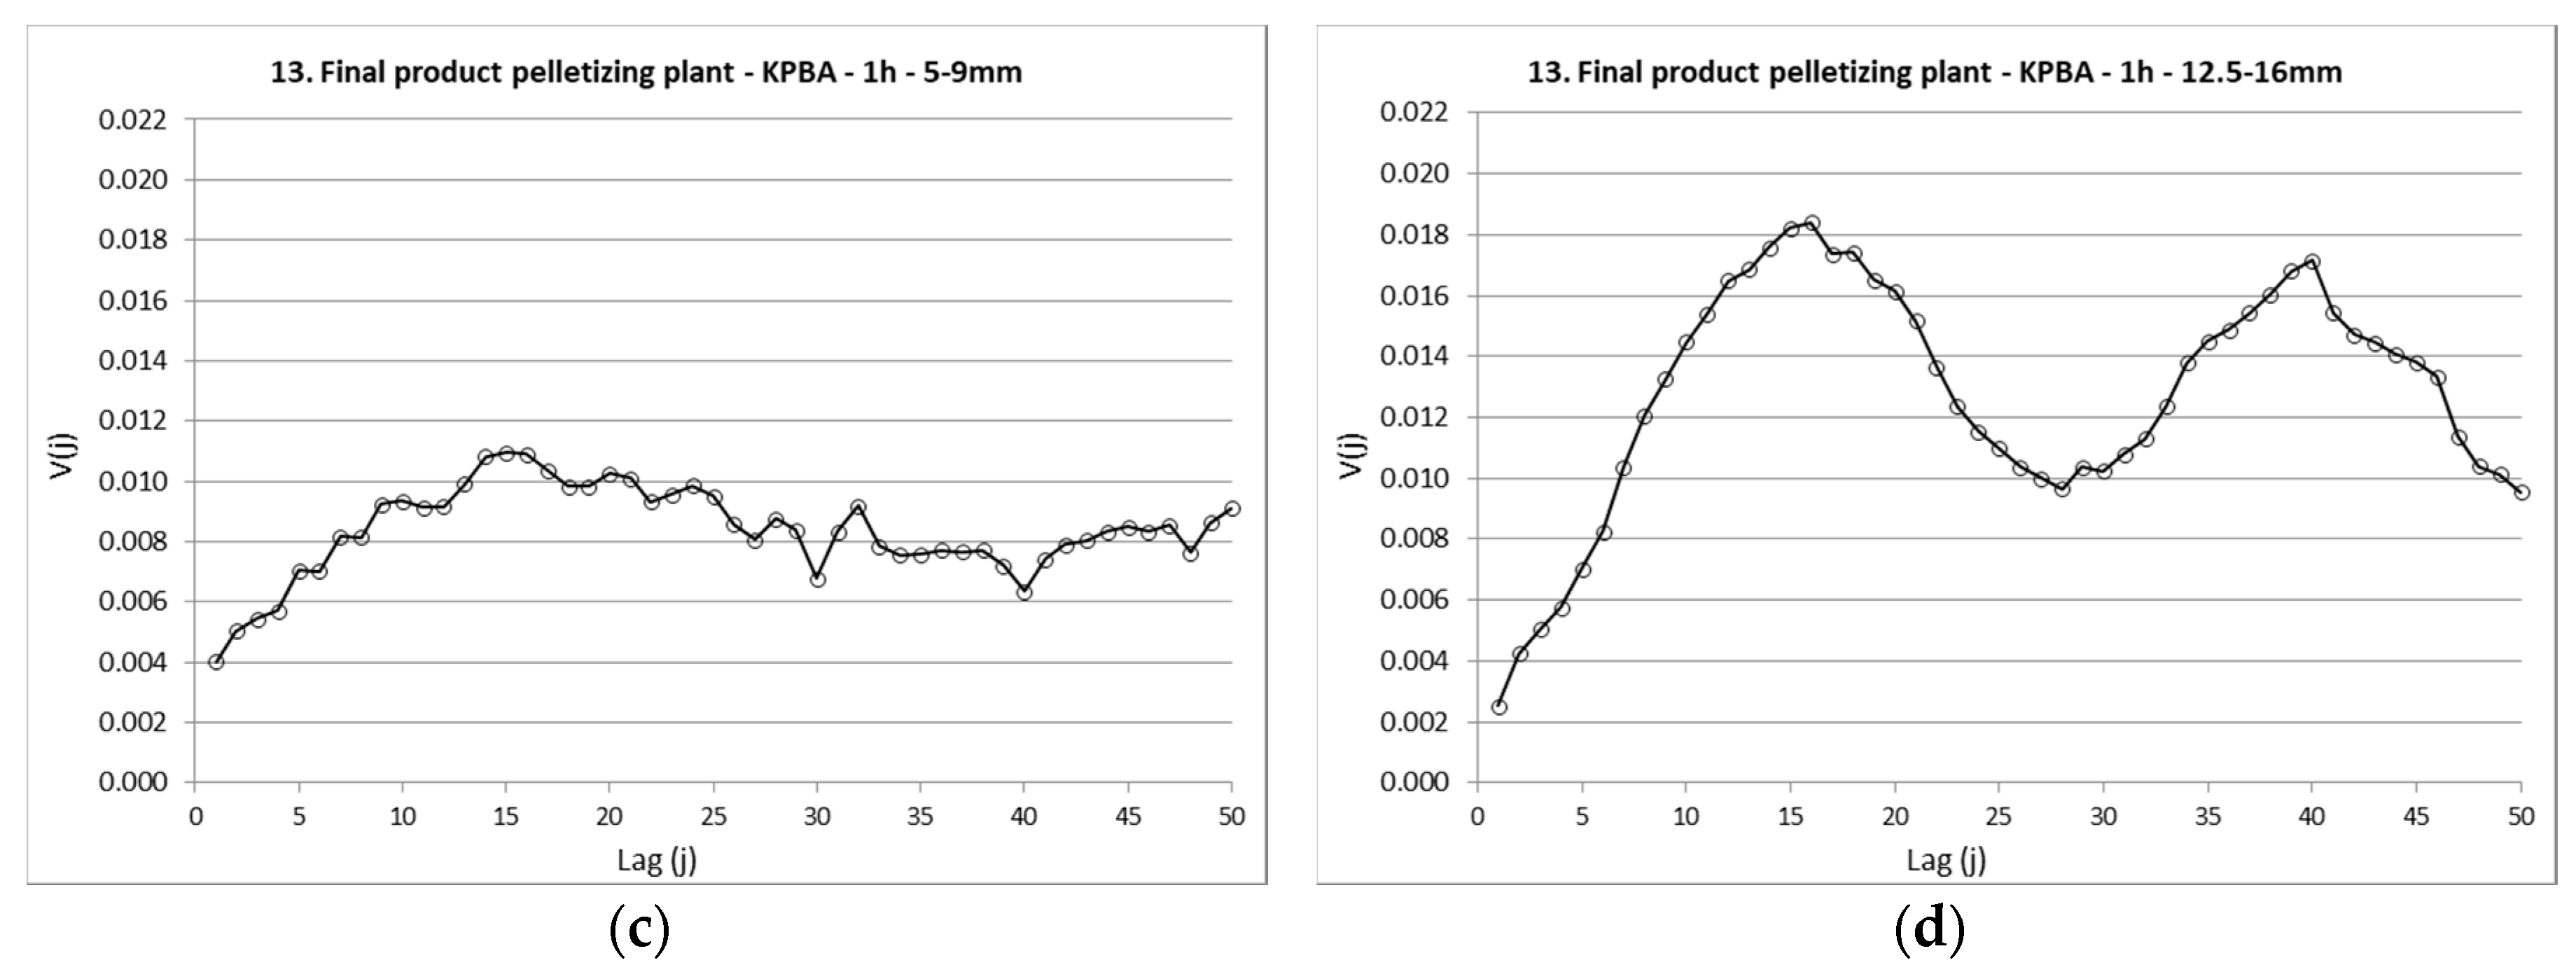
Measurement system 13 (Figure 4c) 1h analysis of size fraction 5–9 mm of the final product, BF pellets is showing an increasing variogram levelling off at range equivalent to lag ≈12. This is representing 12 process hours, indicating that there is no autocorrelation between samples spaced more than 12 h apart. The nugget-to-sill ratio of this measurement system is approximately 30% which is just acceptable.
Measurement system 13 (Figure 4d) 1h analysis of the size fraction 12.5–16 mm of BF pellets shows a typical periodic variogram. The period is approximately 26 lags representing just over 24 h production. The process sieving system, determining the size of green pellets going in to the sintering process is not a process parameter that is changeable from the control room, meaning that human factors cannot be the cause of the periodicity. This periodicity is only present in one of the prepared variograms for this measurement systems. The variability in this periodic variogram is higher (for both nugget effect and sill) compared to the other variograms for the same measurement system. There are apparently non-trivial variations in the process at this specific time period at this sampling location. The nugget-to-sill ratio for the three variograms for this measurement system (the two other variograms are increasing variograms with ranges of 25–30 lags) are all between 3–10%, representing a measurement system that is fit for process control purposes.
3.1.3. Measurement Systems with Distinct Variograms
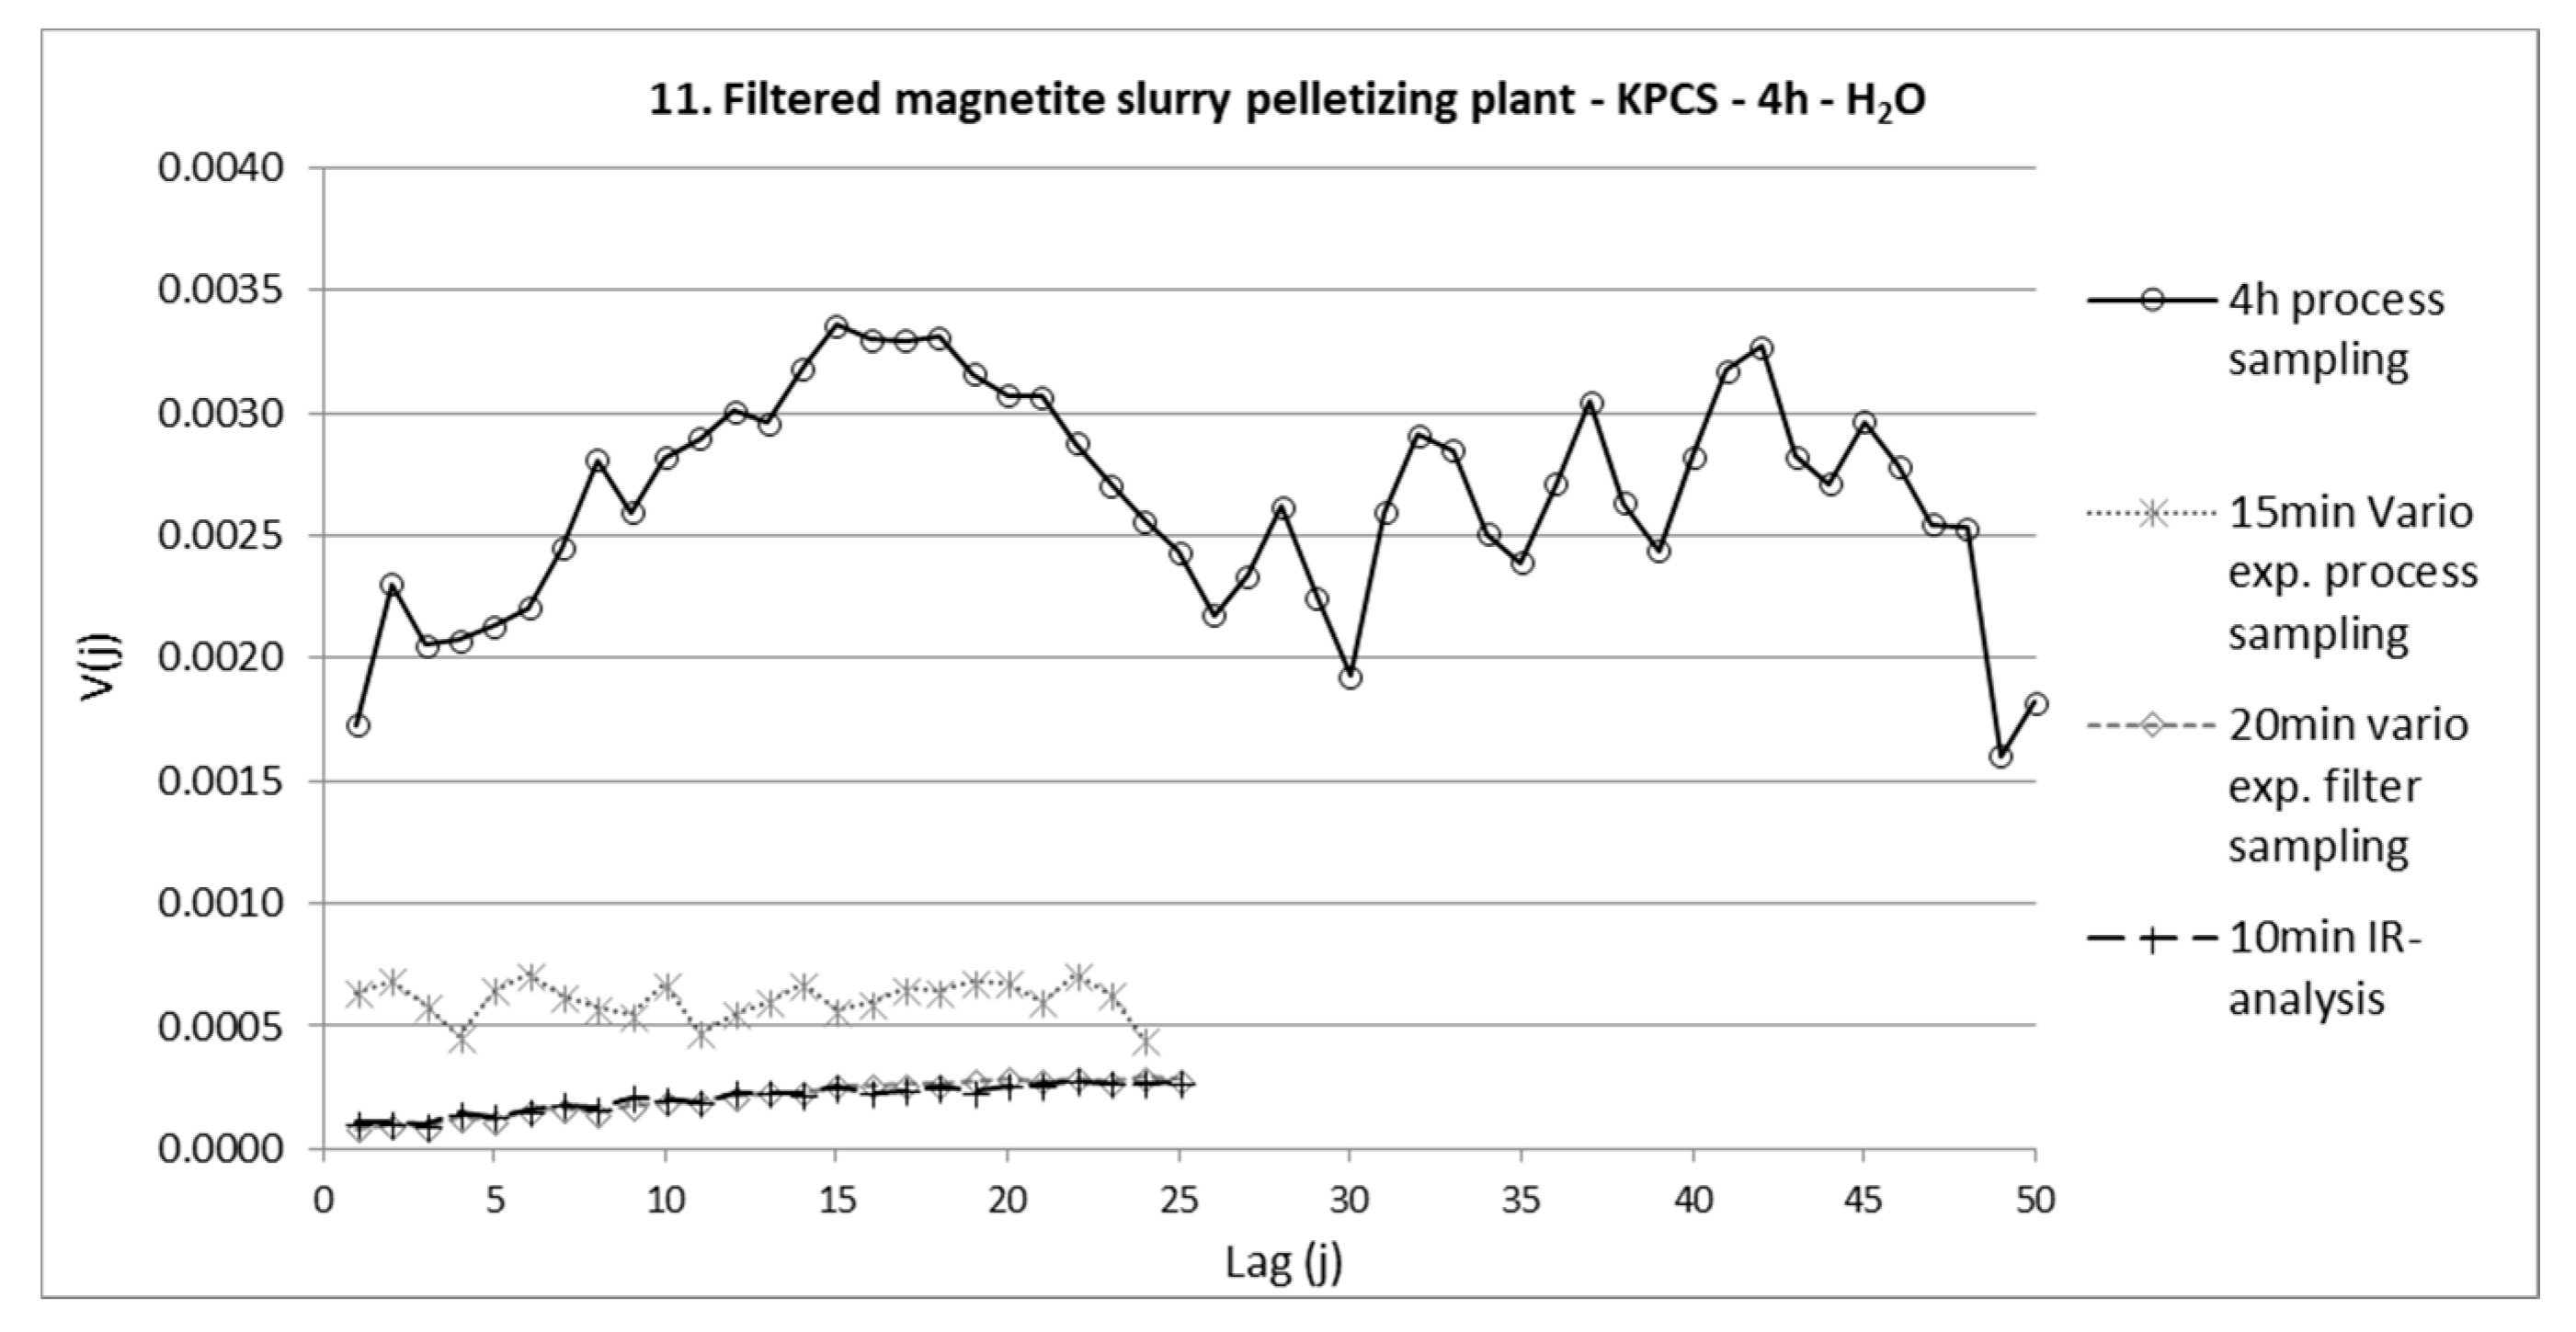
The measurement system for moisture determination of filtered magnetite slurry in the pelletizing plants at LKAB, location 11: Filtered magnetite slurry in pelletizing plant, 4 h, moisture content, has previously been evaluated in Engström et al. [24]. The variographic characterization of the process sampling for moisture content of filtered slurry shows a nugget-to-sill ratio of approximately 60%, Figure 5. This shows that the measurement system is not fit for process control purposes, as it is not able to discern the relevant true process variability. Engström et al. [24] evaluated both the current process sampling method and two alternative measurement systems through variographic experiments, Figure 5. The results indicate that both on-line IR analysis as well as manual sampling of individual filters can produce significantly improved measurements with lower variability than the current process sampling method.
4. Discussion
4.1. Discrete Time Sampling for Variographic Characterization
Manual data collection was used in this study to extract data from the process control system and transfer the data to excel data sheets for variographic calculation. The excel calculation template for variogram development is originating from the standard DS3077 [6]; discrete time sampling must be performed to extract up to 100 equally time spaced data points from the process control system. In practice, any maintenance or disturbance in the measurement systems or maintenance shutdowns of processing plants can result in missing data and disruptions in the time spacing of data points. Such episodes must be eliminated from the possible time periods for valid variogram calculation. For each of the alternative variograms generated for the 34 measurement systems in this study, random discrete time sampling was performed within the normal operating process periods identified. The purpose of preparing several variograms for each measurement system was to evaluate the typical performance of each measurement system. For a few measurement systems, single variograms show deviations, e.g., periodicity, but for the majority, replicate variograms show similar appearances and nugget-to-sill ratios.
It should be noted that the lag distance for the different variograms presented is varying between four minutes for the incremental size determination for the ship loading of iron ore pellets, up to 24 h for example iron grade of tailings in the sorting plant and final product in the pelletizing plant. The lag distance is specified in the headline of each variogram. The reason for these large lag differences is that the evaluated measurement systems are the ones currently operating within LKAB, with the analytical intervals set in accordance to the specific process control requirements.
There are some unavoidable consequences of presenting a comparative overview of variograms based on disparate lag units. A consequence of a small lag spacing, e.g., five minutes, is that all process variability may not be included in the full-time interval covered by the variogram. This might lead to that some missed variability components or periodicities. On the other hand, a large lag spacing, e.g., 8 or 24 h, might well lead to a high degree of process variability being included in the nugget effect. However, this is also an interesting aspect of the current measurement system and its possibility to clearly describe the process variability. Either way, the present study is meant as a first base-line survey with which to compare when improving the indicated measurement systems.
To achieve continuous measurement system monitoring, automated data collection and variogram generation is essential. Target values and tolerance limits for the measurement system and process variability also need to be defined. One result of the present study is a project focused on finding a systematic framework for on-line measurement system evaluation, using variographic characterization. Some desired features of this system concern the use of larger data sets (longer time intervals), and to enable effective handling of missing data. This may for example include weighing of data, in relation to proximity, to promote rapid detection of deviation in measurement system or process variability.
4.2. Identified Improvement Opportunities
The results from this study indicate that most of the measurement systems within the LKAB processing value chain have low sill levels, i.e., low combined process and measurement system variabilities. Even though several of the variograms show a nugget-to-sill ratio above 30%, the low total variability (low sill) mean that the process is under control. However, some of the measurement systems with high nugget-to-sill ratio does show a total variability that is too high for its intended purpose and therefore need to be improved. The measurement systems showing a higher sill in the variographic characterization are in need of improvements (either regarding measurement system, process control or both). The following discussion will present some suggested improvements for measurement systems identified to have too high variabilities.
4.2.1. 1. Incoming Sorting Plant—Ore—8 h—Fe-Grade
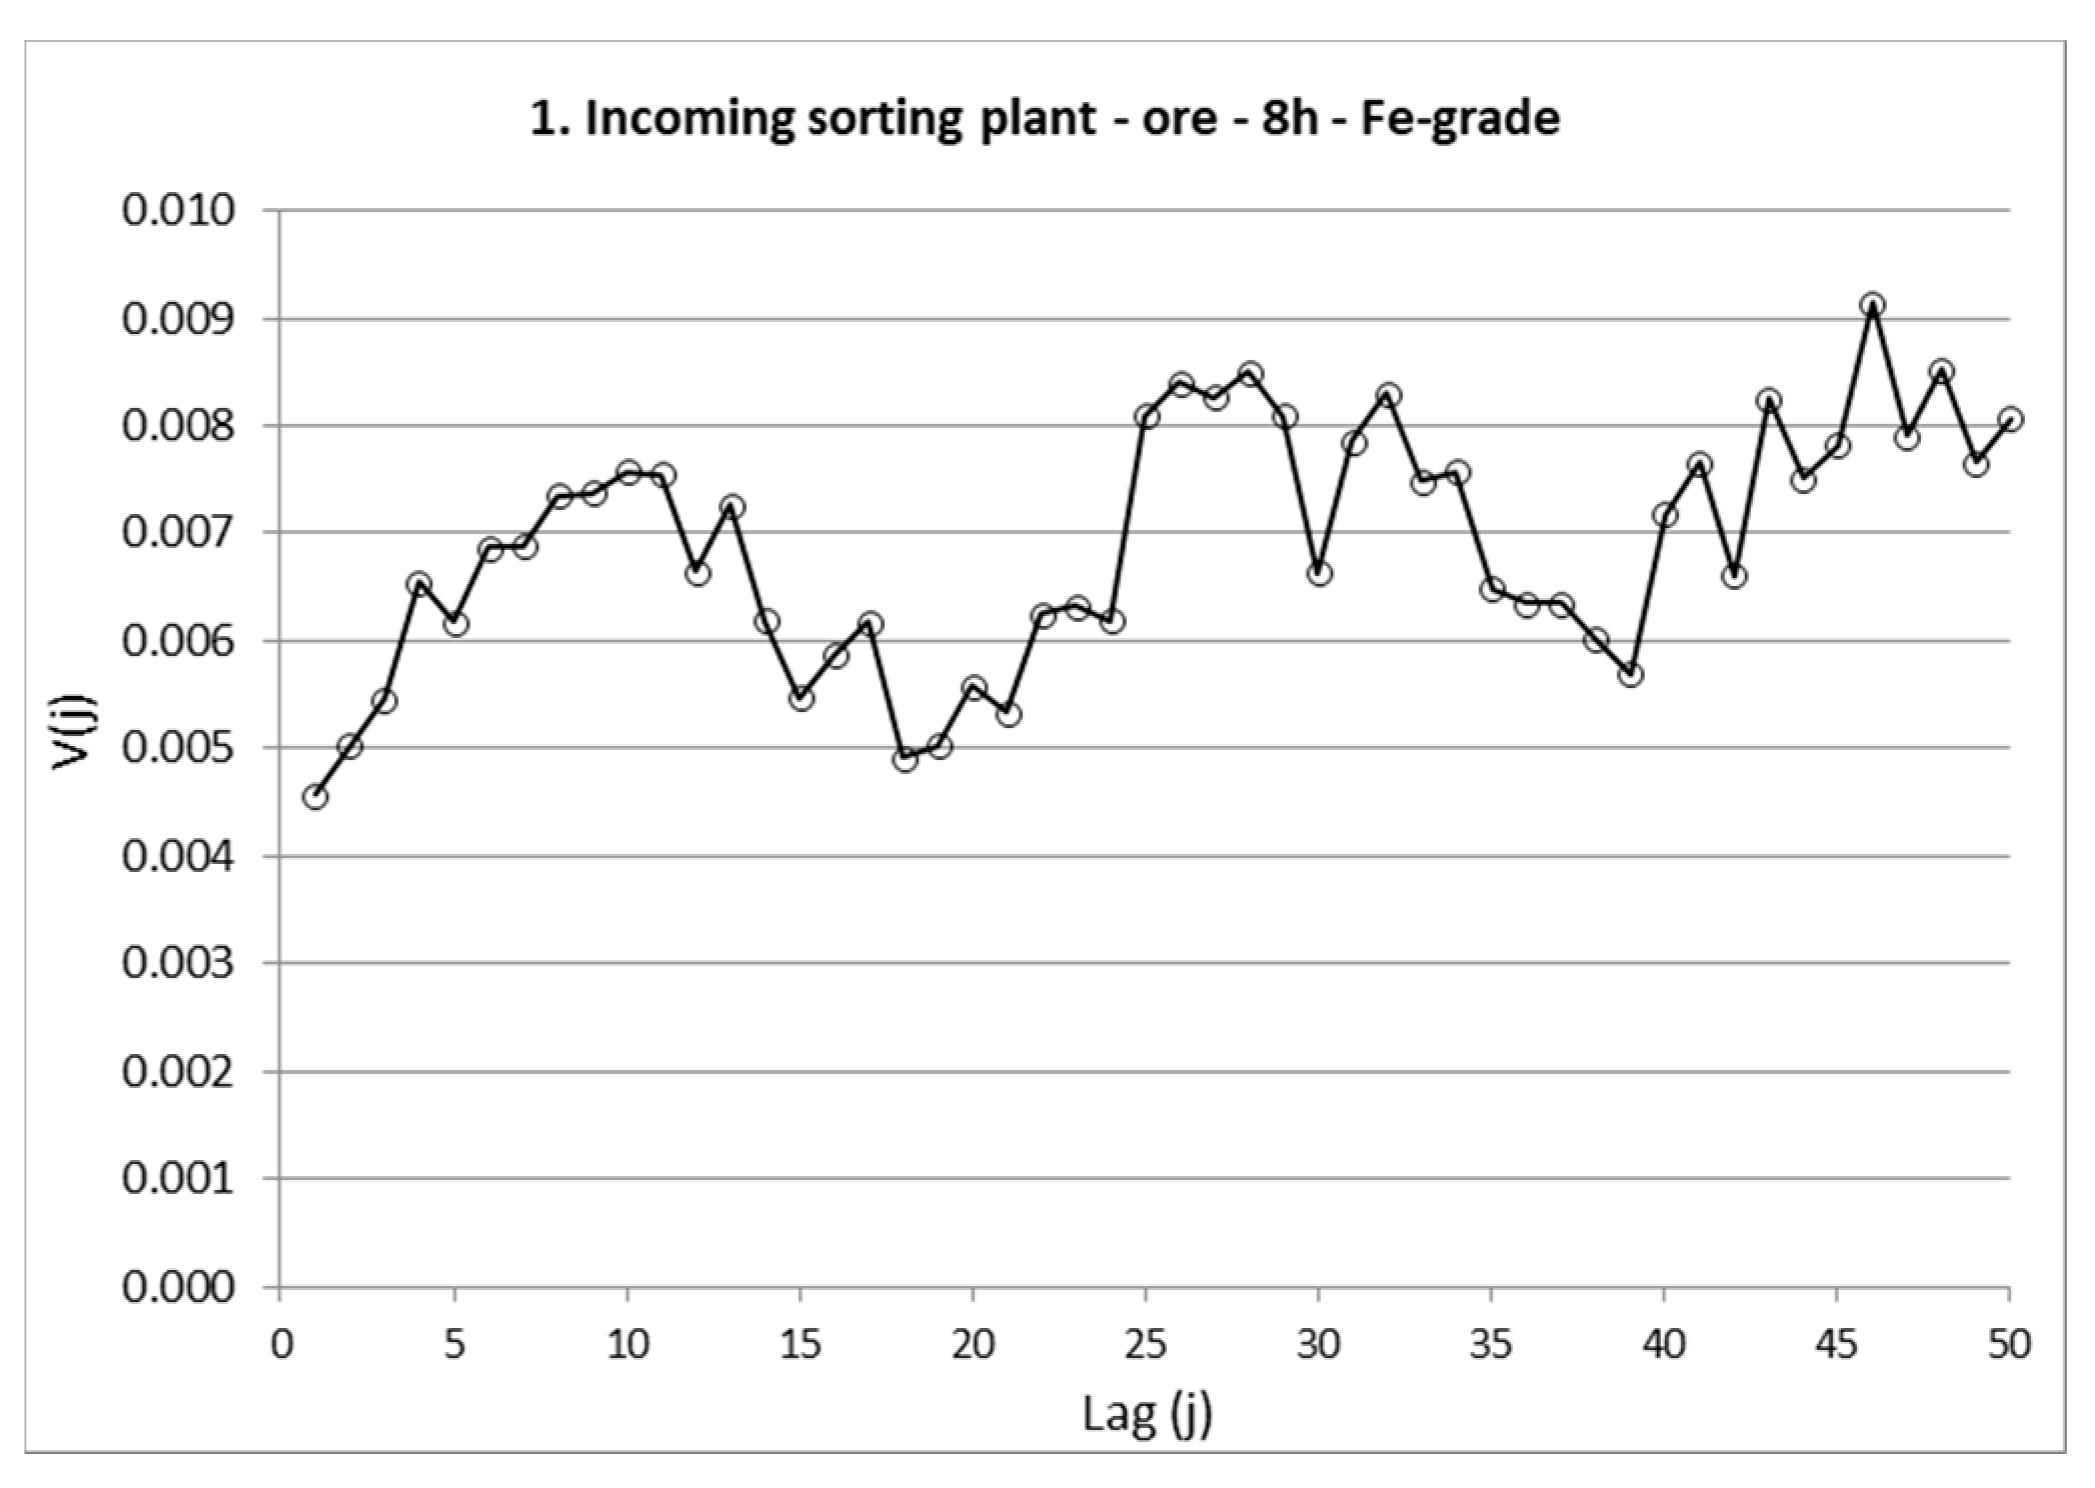
The measurement system for Fe-grade of the incoming ore to the sorting plant starts with a cross belt hammer sampler and automated sorting and secondary sampling in several repetitions, Figure 6. Even though the sill level is relatively low, the variogram shows a nugget-to-sill ratio of approximately 50%, indicating that this measurement system contributes to a large part of the overall variability. Cross belt samplers are known to introduce significant IDE and IEE as the primary sampling equipment cannot transect the complete depth of the cross section of the stream. There will always be some part of the material left on the bottom of the belt. Especially for material of large particle top size (as in this sampling situation) the finer material being segregated to the bottom of the belt is likely to be under-sampled.
The variogram is also indicating some degree of periodicity, perhaps at two different time scales. This could for example be due to the variability from the raw material being mined in different parts of the mine. However, due to the distinct non-representative sample extraction method, this might also be due to periodic variabilities stemming from the measurement system.
A pilot study is initiated to evaluate the possibility of exchanging the hammer samplers at this sampling location and replace them with on-line analysers. The most interesting alternative being evaluated at the moment is to use Pulsed fast and thermal neutron activation (PFTNA) technology. PFTNA use the energy of the gamma rays from the nuclei of the atoms that are induced by the neutrons to quantify the elements of the material. This technique is expected to allow improved analysis of iron grade, as well as nitrogen-grade which are important parameters for the refining processes. An advantage of the PFTNA technique, in contrast, many sensor- and on-line analysis methods can only analyse the surface, e.g., XRF and IR-analysis, is the possibility for complete penetration of the material, allowing analysis of the complete cross section of the material stream.
4.2.2. 3. Tailings Sorting Plant—0–30 mm—8 h—Fe-Grade
The variogram for iron grade of the tailings in the sorting plant is showing both a high sill and a high nugget-to-sill ratio of 70%, which shows that the measurement system is not fit for describing the true process variability. Analysis of iron grade of the tailings is a critical measurement for assessing the performance of the magnetic separation performed in the sorting plant. The primary sample extraction is done by manual sampling of the material that has a 30 mm top size. No matter how good the knowledge or intentions of the sampling staff, it is not possible to collect a representative sample using manual extraction at this location. As for the measurement system for Fe-grade of the incoming ore to the sorting plant (described above) a pilot study is currently evaluating the possibility of installing on-line analysis using PFTNA technique to improve this measurement system.
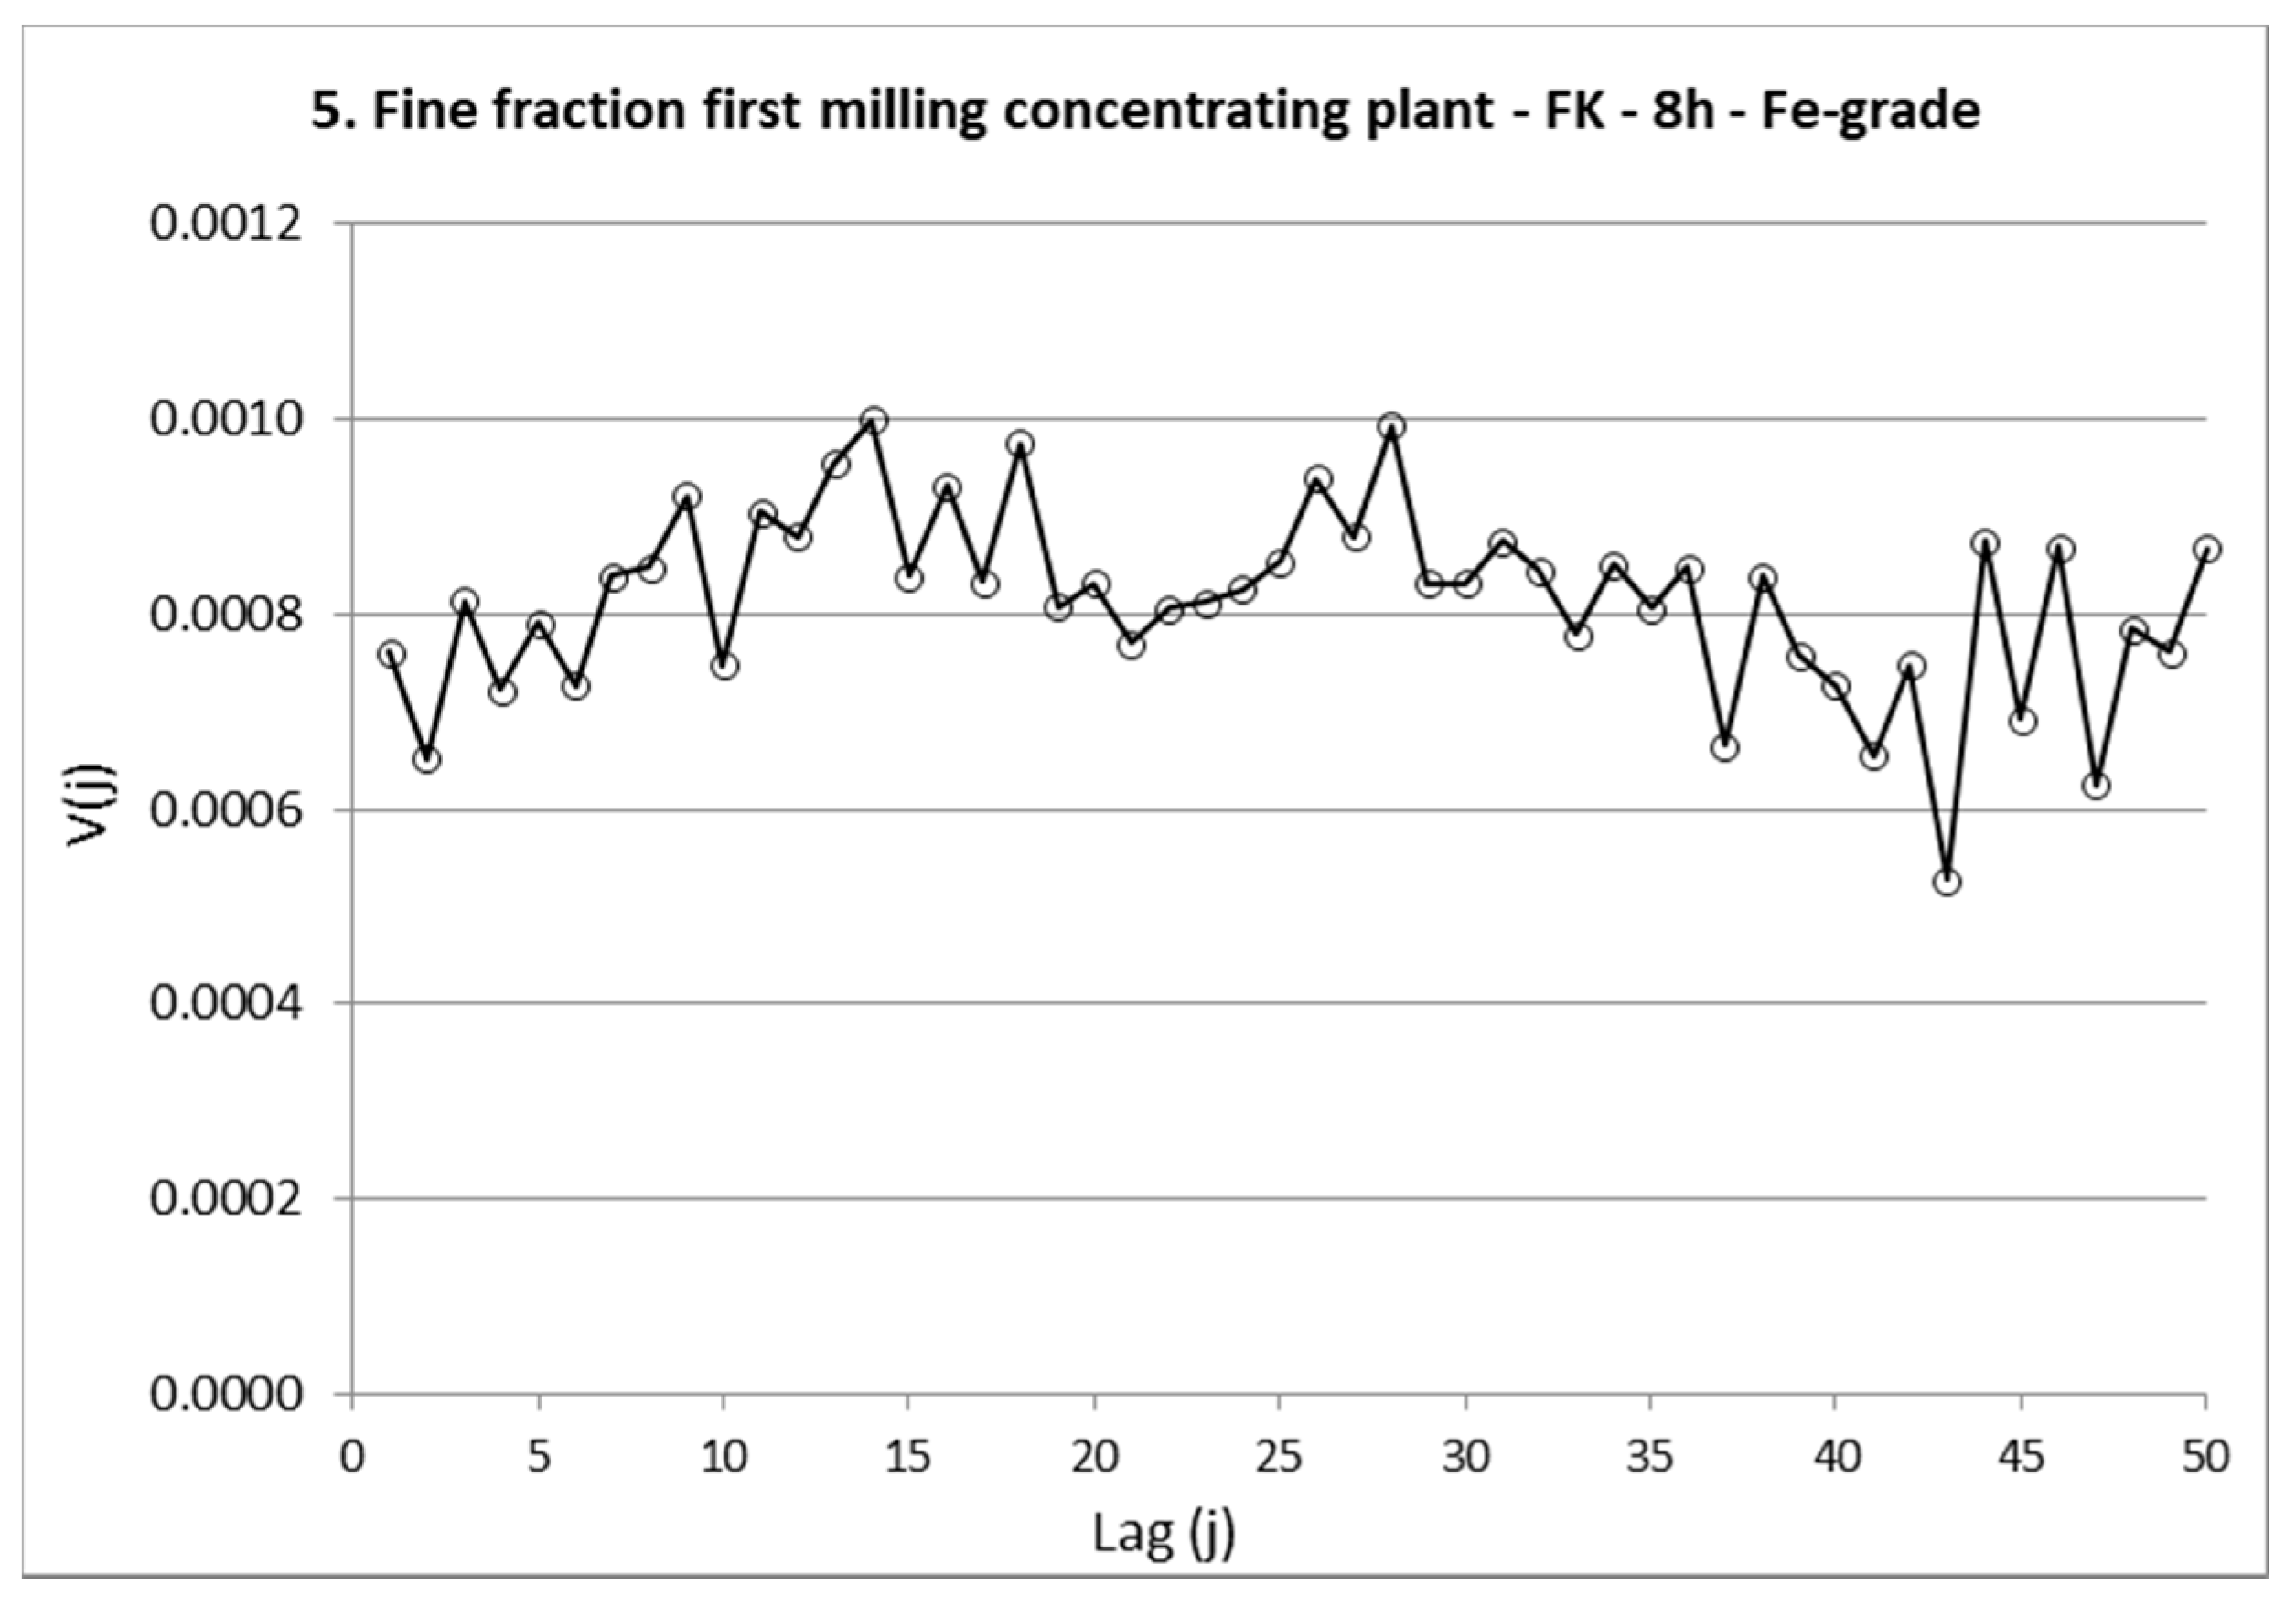
4.2.3. 5. Fine Fraction First Milling Concentrating Plant—FK—8 h—Fe-Grade
The analysis of iron grade of the fine fraction is used for reconciliation purposes in the concentrating plant, Figure 7. Even though the overall relative variability, described by the sill, is low, the high iron grade of the material does in practice mean that the absolute variability of the process control data is higher than desirable. Furthermore, the nugget-to-sill ratio of 75% is suggesting that most of the variability visible in the process control data is stemming from the measurement system rather than the process itself. The primary sample extraction for this measurement system is currently manual collection of slurry from the overflow of the spiral separator after primary milling. This sample extraction method disables any possibility for a representative cross section of the slurry material. A possible improvement would be to use a recirculation system where the sample extraction is placed in the smaller recirculating slurry flow. This would enable a more correct sample extraction as well as the possibility to collect a composite sample for analysis, in contrast to the current manual grab sampling.
4.2.4. 11. Filtered Magnetite Slurry Pelletizing Plant—KPCS—4 h—H2O
The moisture sampling of filtered magnetite slurry has previously been studied in Engström et al. (2018). The conclusion was that the current belt sampling method does not achieve representative measurements and the measurement system need to be improved. The present study shows similar results, where the nugget to sill ratio is approximately 50% and the moisture content requirements are so precise that a lower variability in both process and measurement is necessary. As correct moisture content of filtered slurry is a critical aspect for successful balling of green pellets, this is a measurement system improvement priority. A current pilot study is evaluating the possibility to use machine learning to predict the moisture content of each individual filter, based on the abundant availability of process data. Parallel to this, both infra-red and image analysis are evaluated and tested to determine if any of these on-line methods could replace the current non-representative manual grab sampling.
4.2.5. 12. Green Pellets Pelletizing Plant—KPCSR—4 h—KH45
For the measurement system of 4h analysis of the analytical parameter KH45, the primary sampling method is again a manual grab sample. The variogram is indicating a higher sill compared to most other measurement systems, and the nugget-to-sill ratio of approximately 75% is suggesting that the true process variability is largely masked by the measurement system variability. The method of sample extraction is not conforming to TOS, and furthermore, the analytical method is a mechanic and operator dependent, leading to large variabilities in both sampling and analysis. As the green pellets are quite fragile, automated sampling or splitting is not possible to apply to this product, leaving small possibilities for improvement. Internal studies at LKAB have also indicated large measurement uncertainty in the KH45 analysis and the purpose of its usefulness is therefore questionable. Perhaps it is better not to measure when conditions for proper sampling and analysis are so adverse?
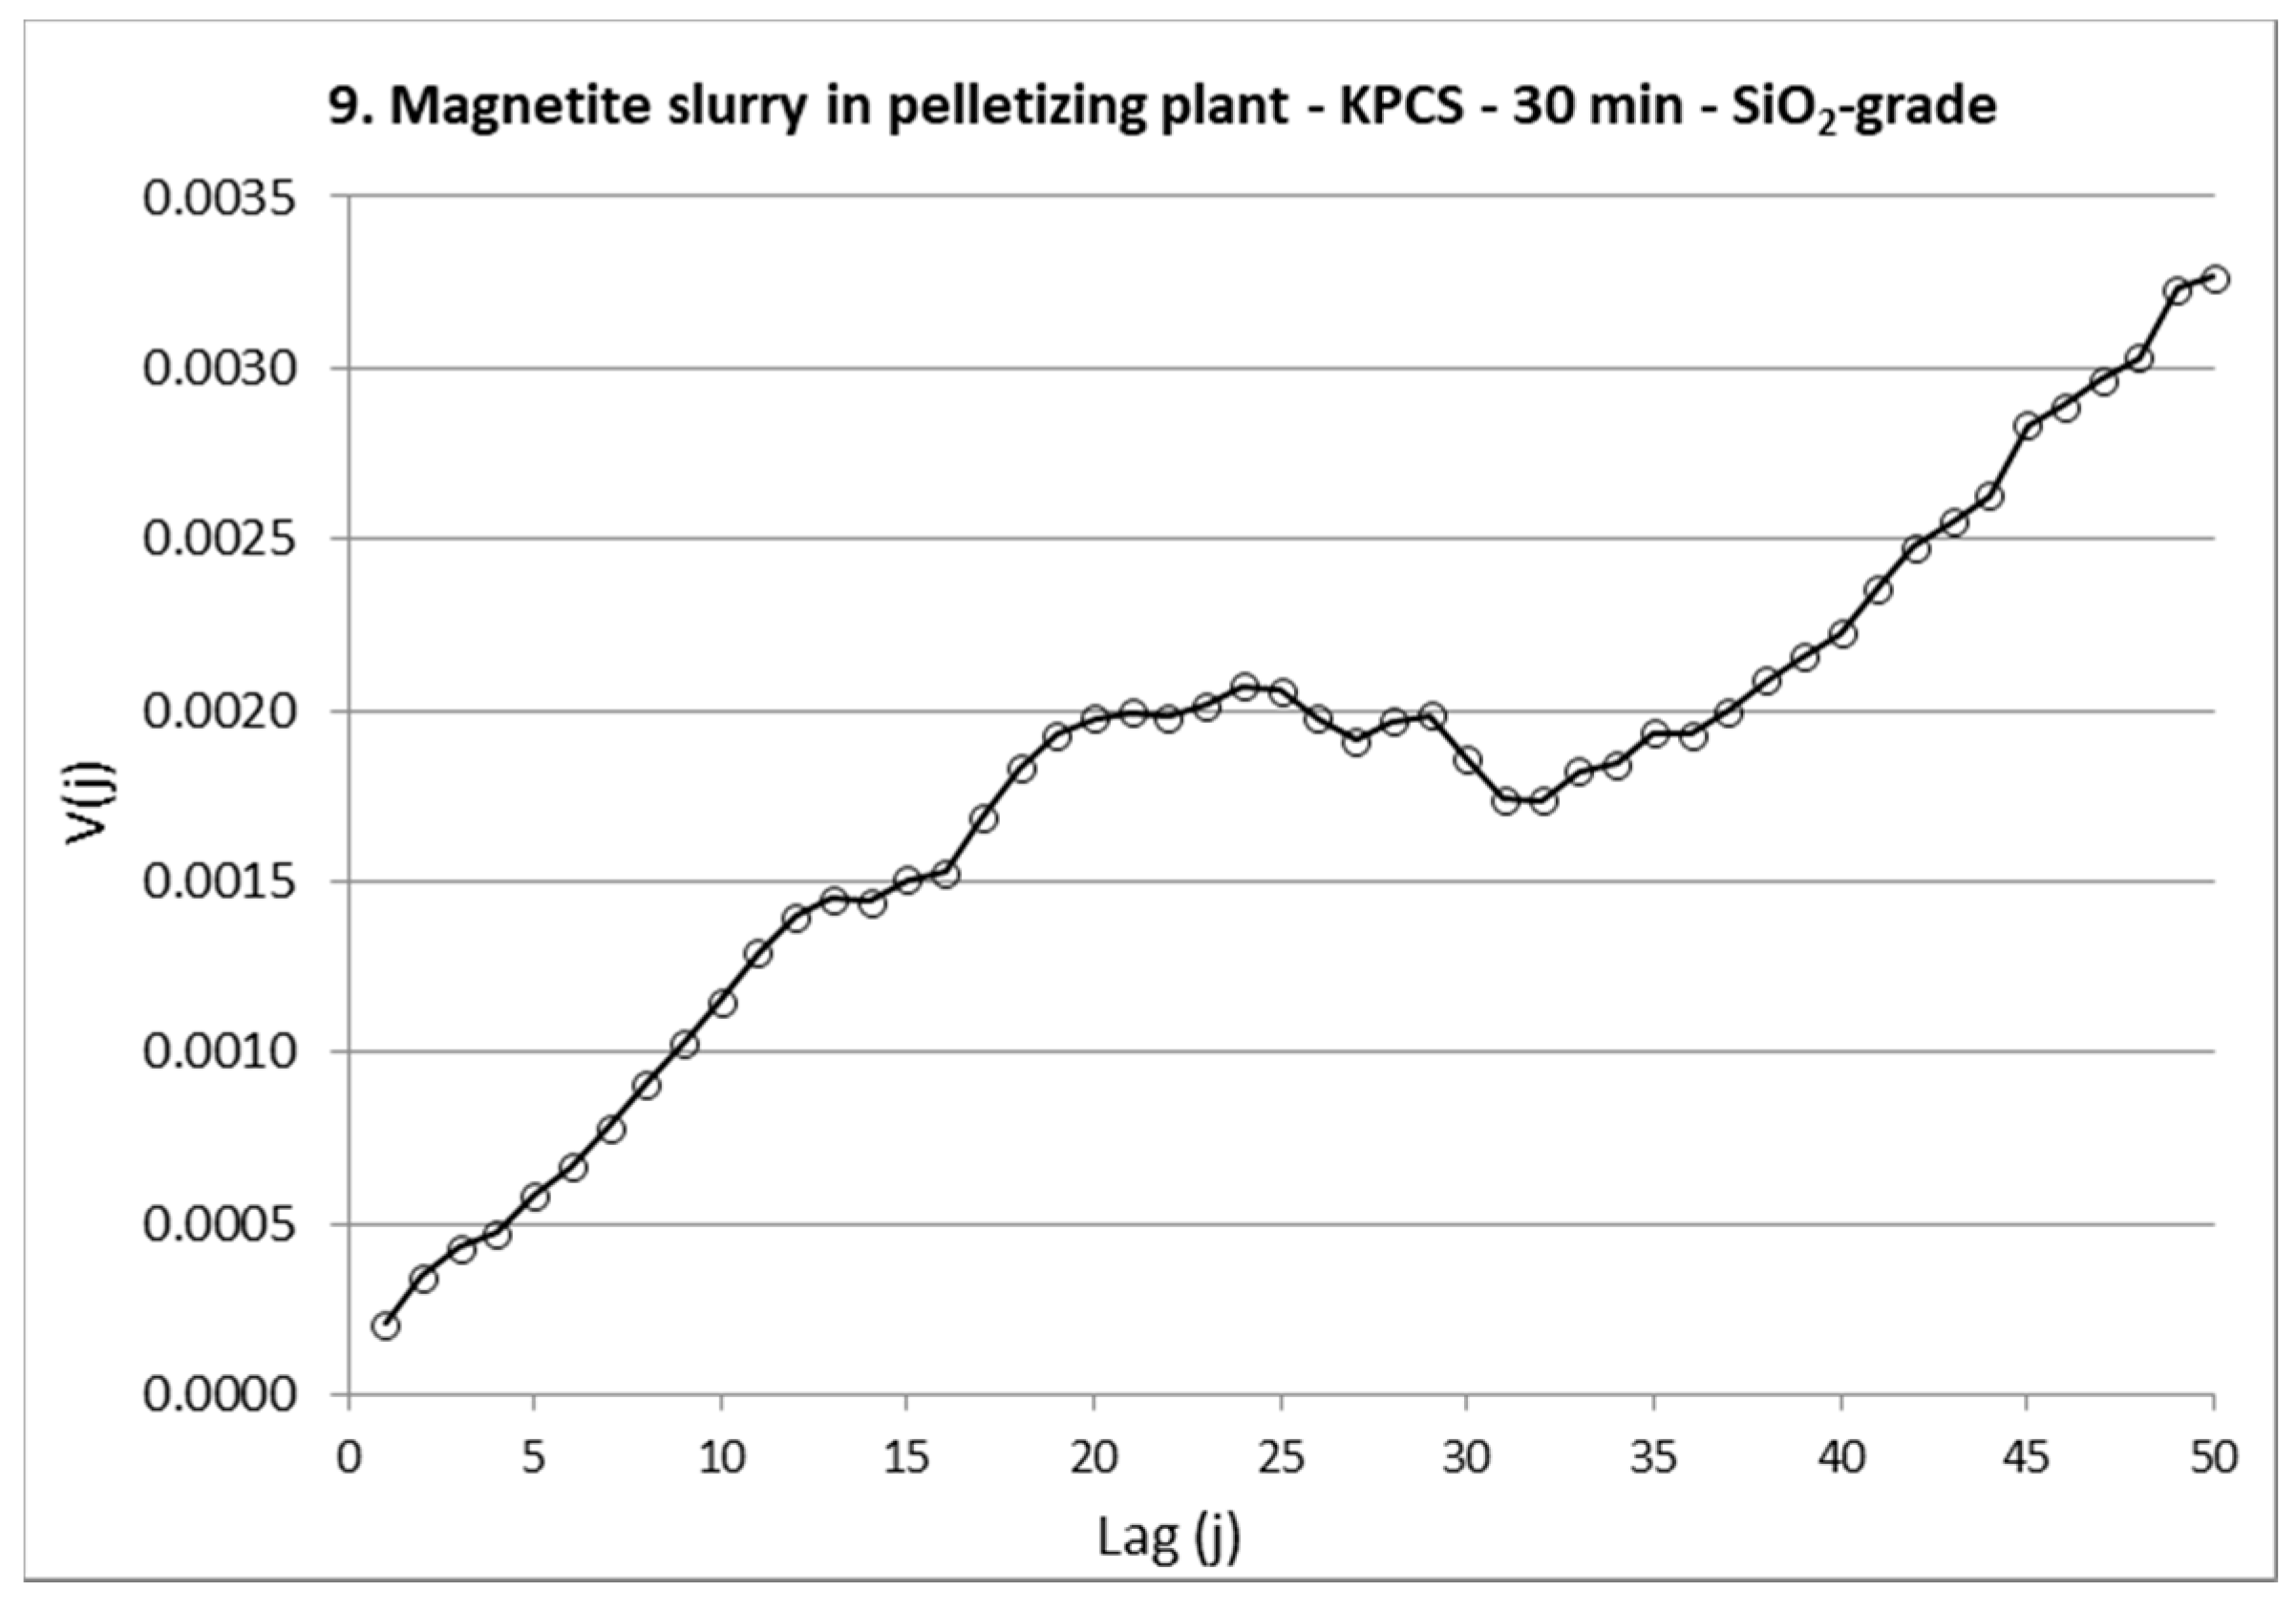
4.2.6. 13. Final Product Pelletizing Plant—KPBA—24 h—SiO2-Grade
The analysis of silica grade for the final product in the LKAB value chain, high quality iron ore pellets, stand out with a slightly higher sill (0.012) than most other presented variograms. However, the variogram is indicating a low nugget effect and therefore the measurement system can be deemed fit for its quality control purposes, with a nugget-to-sill ratio of under 10%. The main reason for the high sill is that the variograms are calculated based on relative heterogeneity contributions and as the silica grade is so low in the final product, the relative process variability for silica is higher than for iron grade.
4.2.7. 13. Final Product Pelletizing Plant—KPBA—1 h—Size Determination
For three of the presented size fractions, the relative variograms indicate a higher sill compared to most other measurement systems. The sill levels for <5 mm, 5–9 mm and 12.5–16 mm are approximately 0.05, 0.01 and 0.016 respectively. The nugget-to-sill ratios are however all under 30% and both <5 mm and 12.5–16 mm have ratios under 10%. This is indicating that even though the relative process variability is high at this sampling location, the measurement system is fit-for-purpose for accurate quality control. The highest relative process variability for <5mm is also largely due to the low mean value (0.8%) of this size fraction. As this measurement system is evaluating the final product in the pelletizing plant, the analysis is used for quality assessment rather than for process control. All size determinations of the final product are determined on the same samples with the same analytical method; the fact that the variogram range for all three parameters are identical (12 h) is consistent.
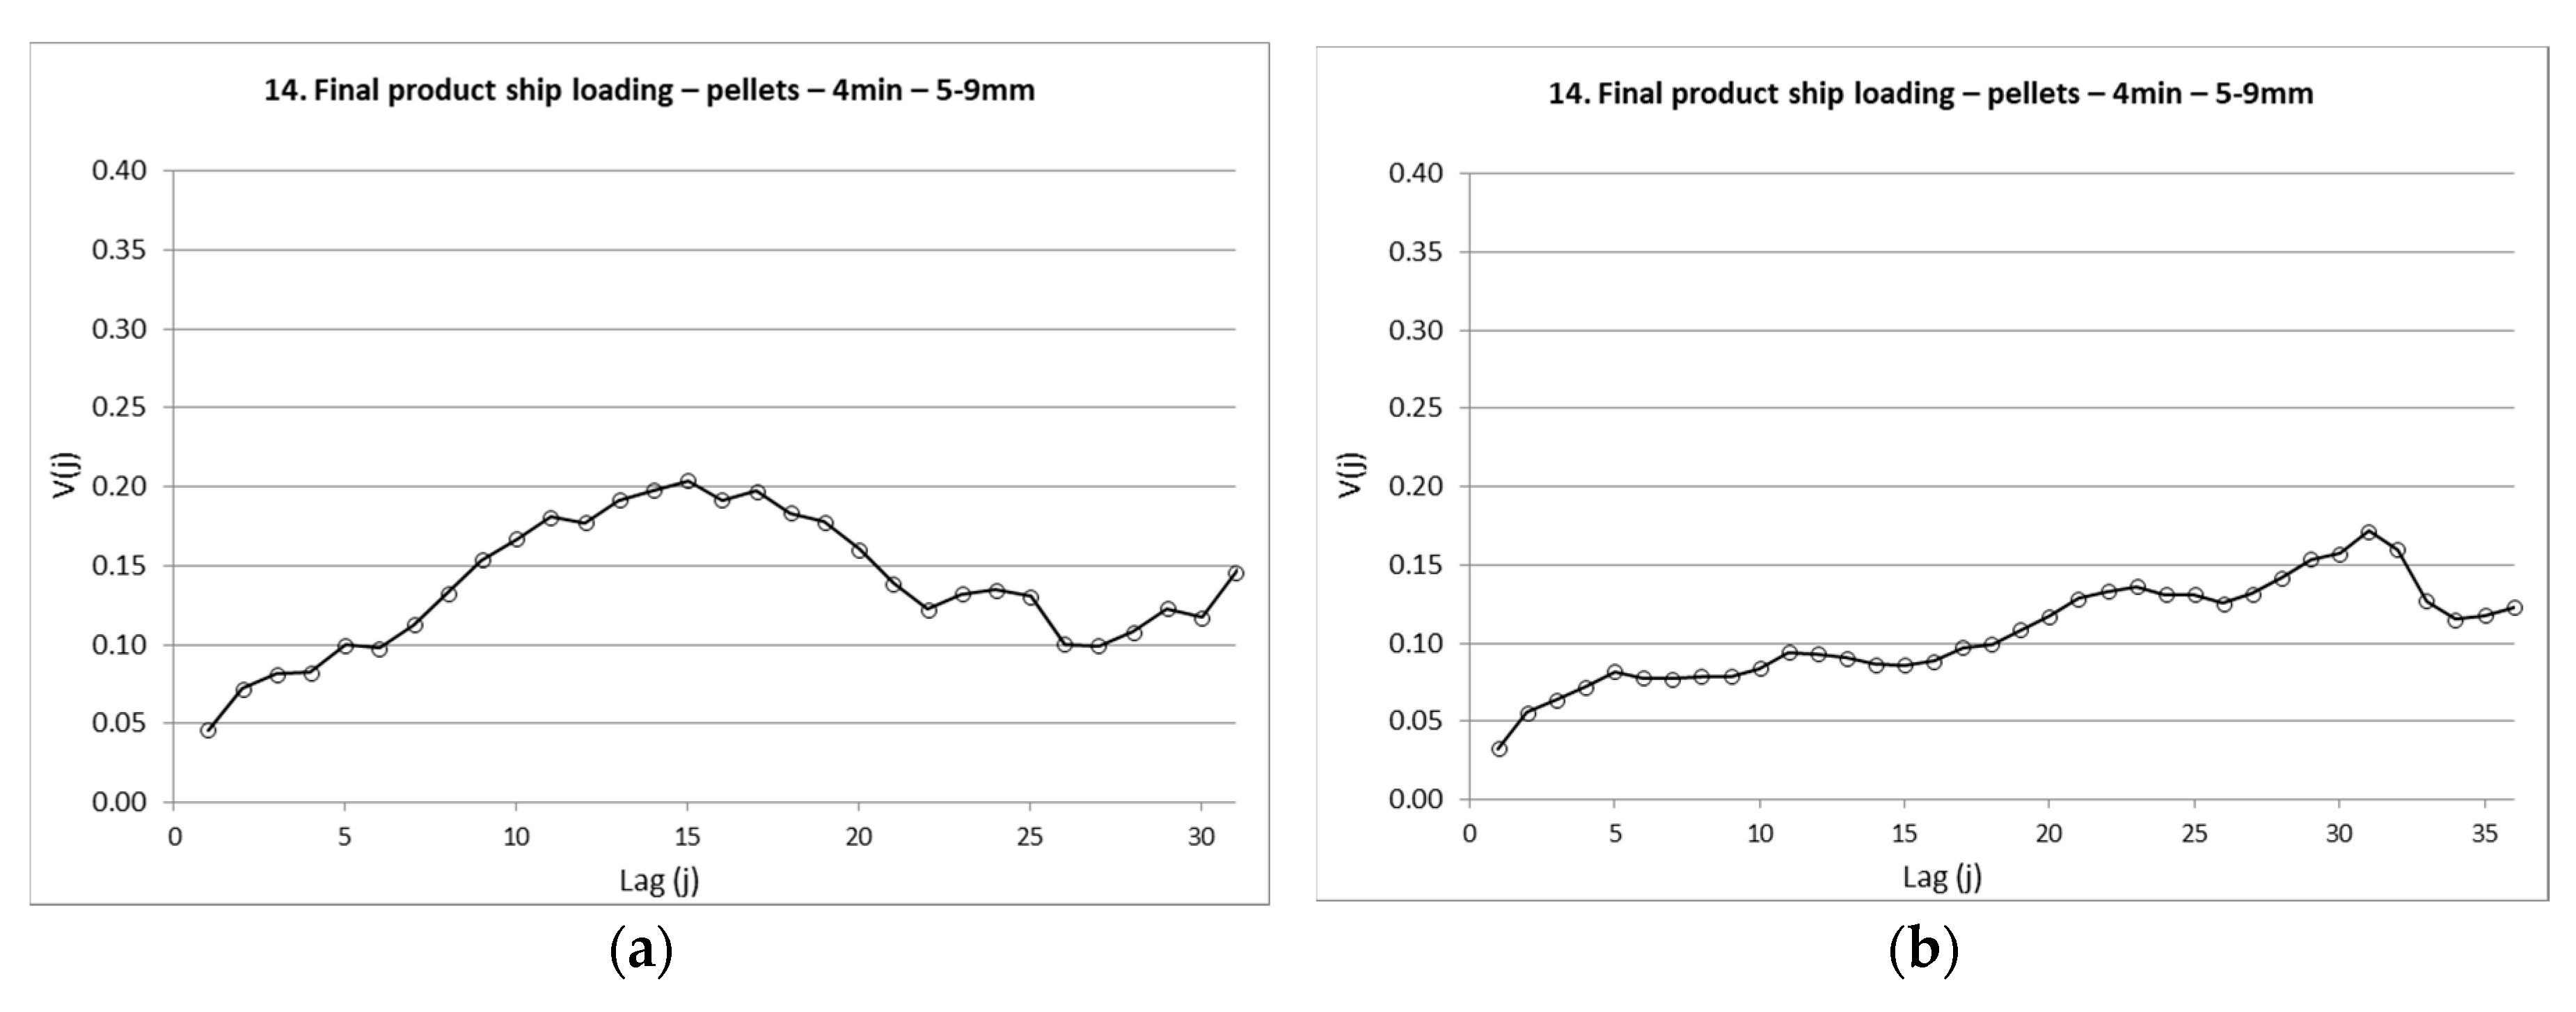
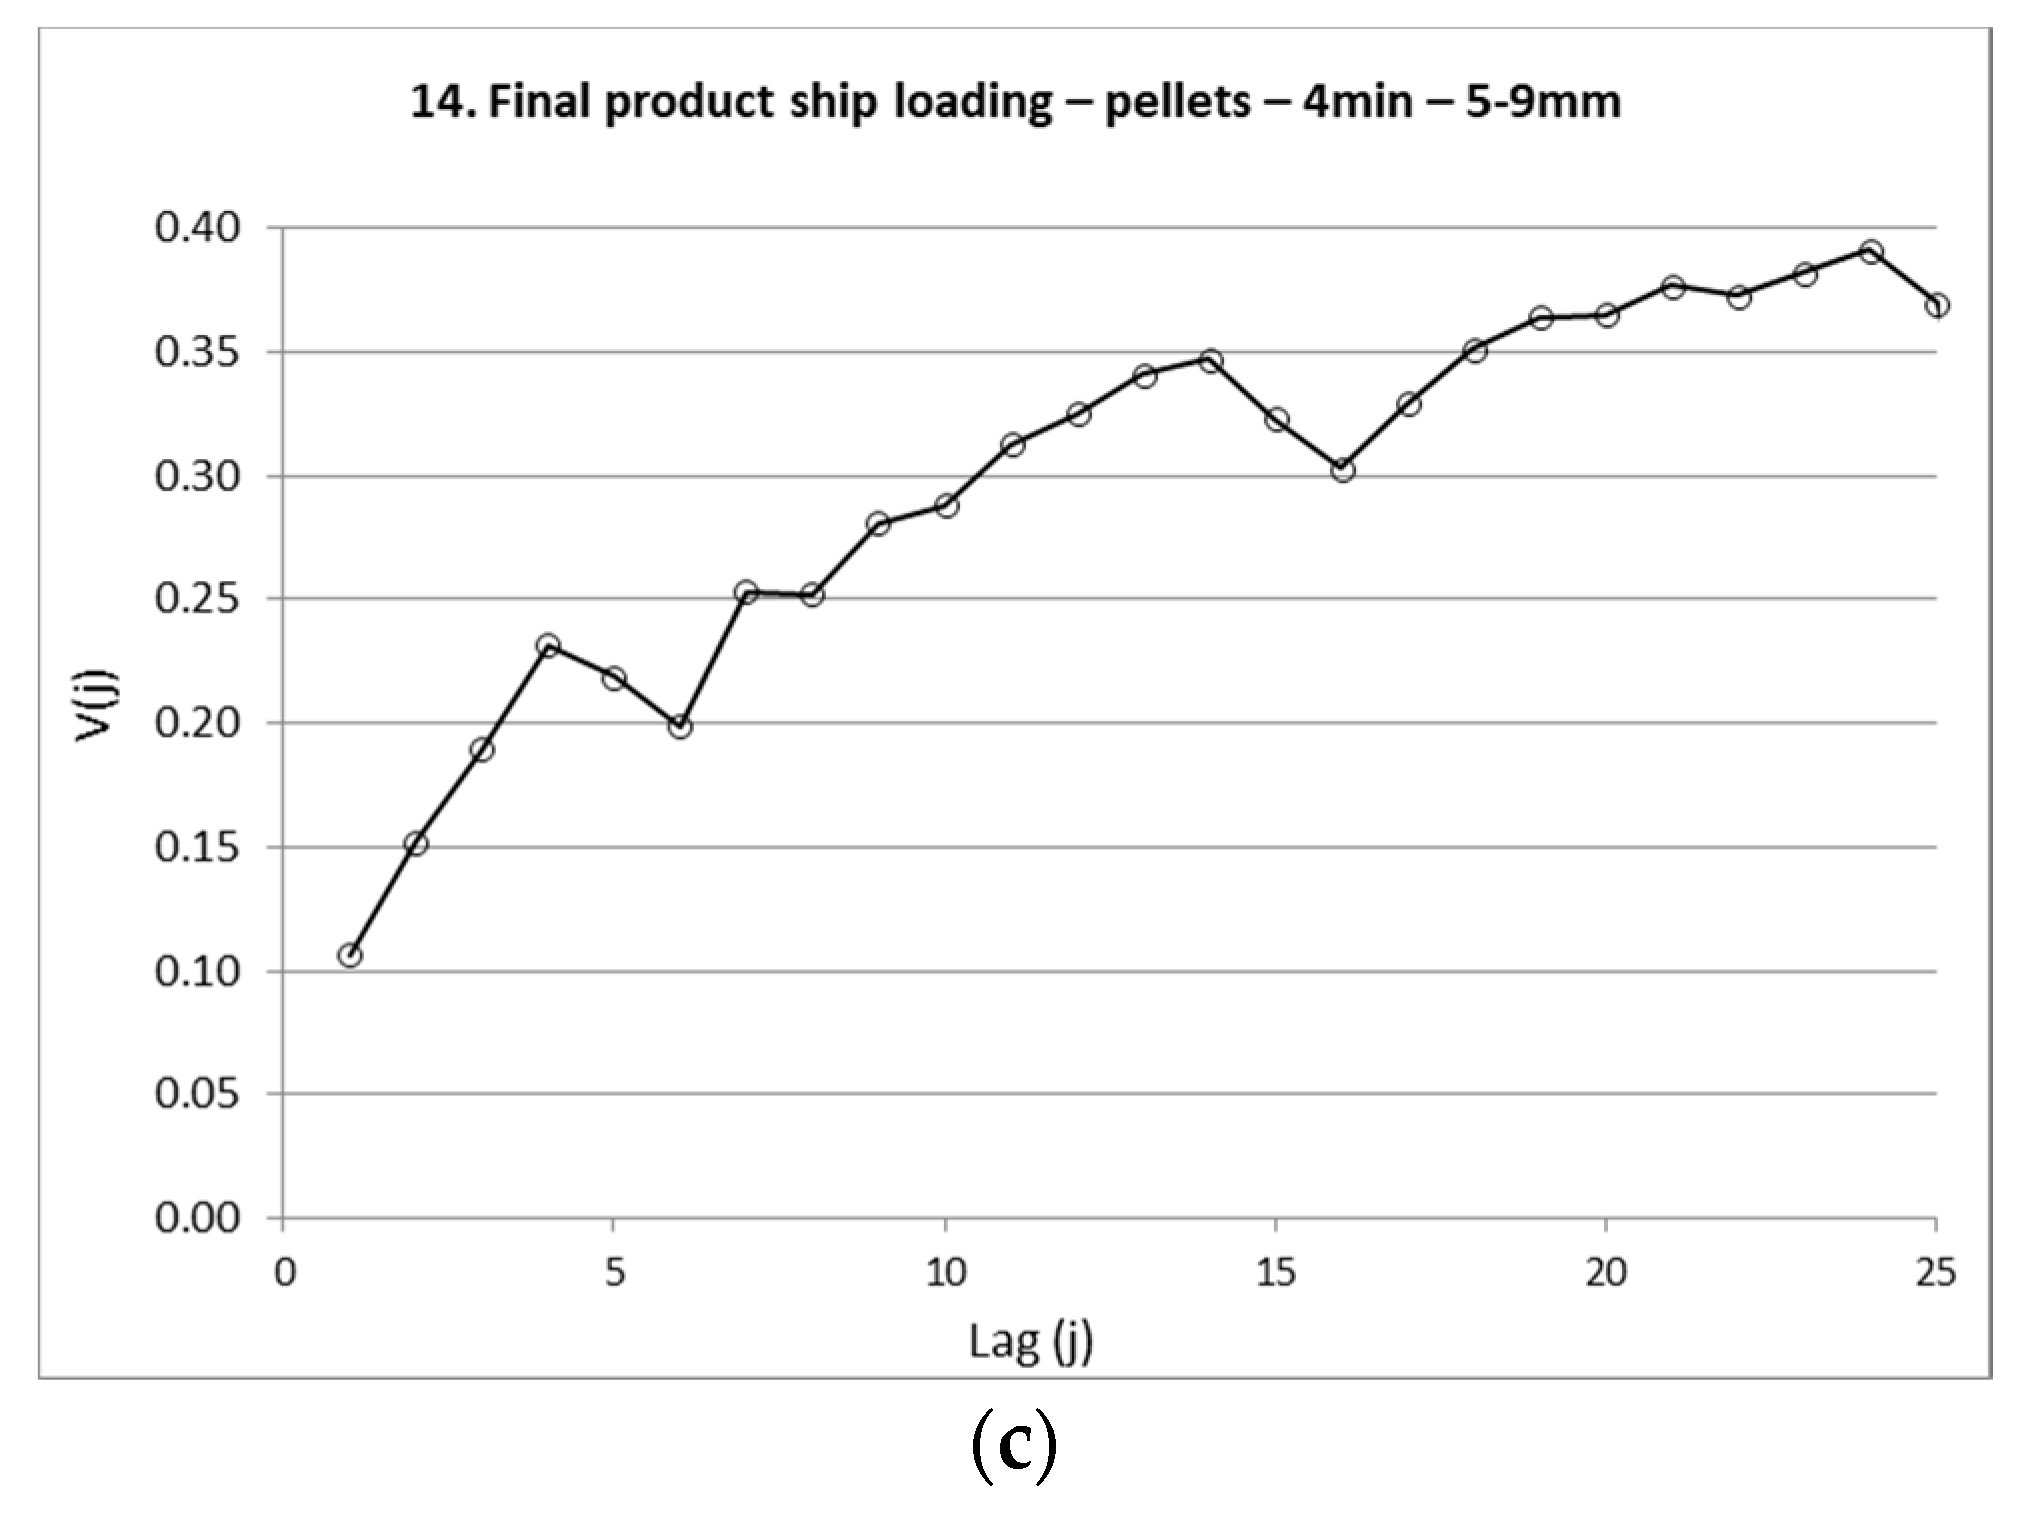
4.2.8. 14. Final Product Ship Loading—MPBO—4 min—Size Determination
Figure 8a–c shows three replicated high resolution variograms representing three separate ship loading operations for the 5–9 mm size fraction of BF pellets. The variogram for the ship loadings are based on a high-resolution study of the individual size determinations made on each primary increment extracted with four-minute intervals. The final analytical result used for product certification is based on composite averages of all 75–115 size determinations for a fully loaded ship, leading to a highly reliable product specification.
The high resolution variograms were prepared in order to characterize the loading measurement system specifically. At this high resolution, the variability (sill level) is necessarily high, due to individual increment analysis uncertainty, but these variograms are only used to characterize the nugget effect. Two of the replicates (Figure 8a,b) show similar variograms, while the third (Figure 8c) has a distinctly higher sill and nugget effect, reflecting minor differences in the heterogeneity of the loaded material, which is substantiated by slight differences in the mean values for the size fraction (proprietary information). The three nugget effects are broadly similar (0.03, 0.03, 0.05), indicating a measurement system fit-for-purpose, which is justified by the three nugget-to-sill ratios: 20%, 20%, 14%.
4.3. Slurry Sampling Issues
Slurry sampling is notoriously difficult, due to the limited possibility to access the material streams in long and/or pressurised pipelines. This study found interesting results related to the performance of TOS incorrect slurry shark-fin and spear sampling. Several measurement systems at LKAB uses these sampling approaches in slurry pipes and blender tanks. Conventional TOS wisdom claims that these are inferior sampling methods, but the present study revealed contradictory results, related to relative uniform materials.
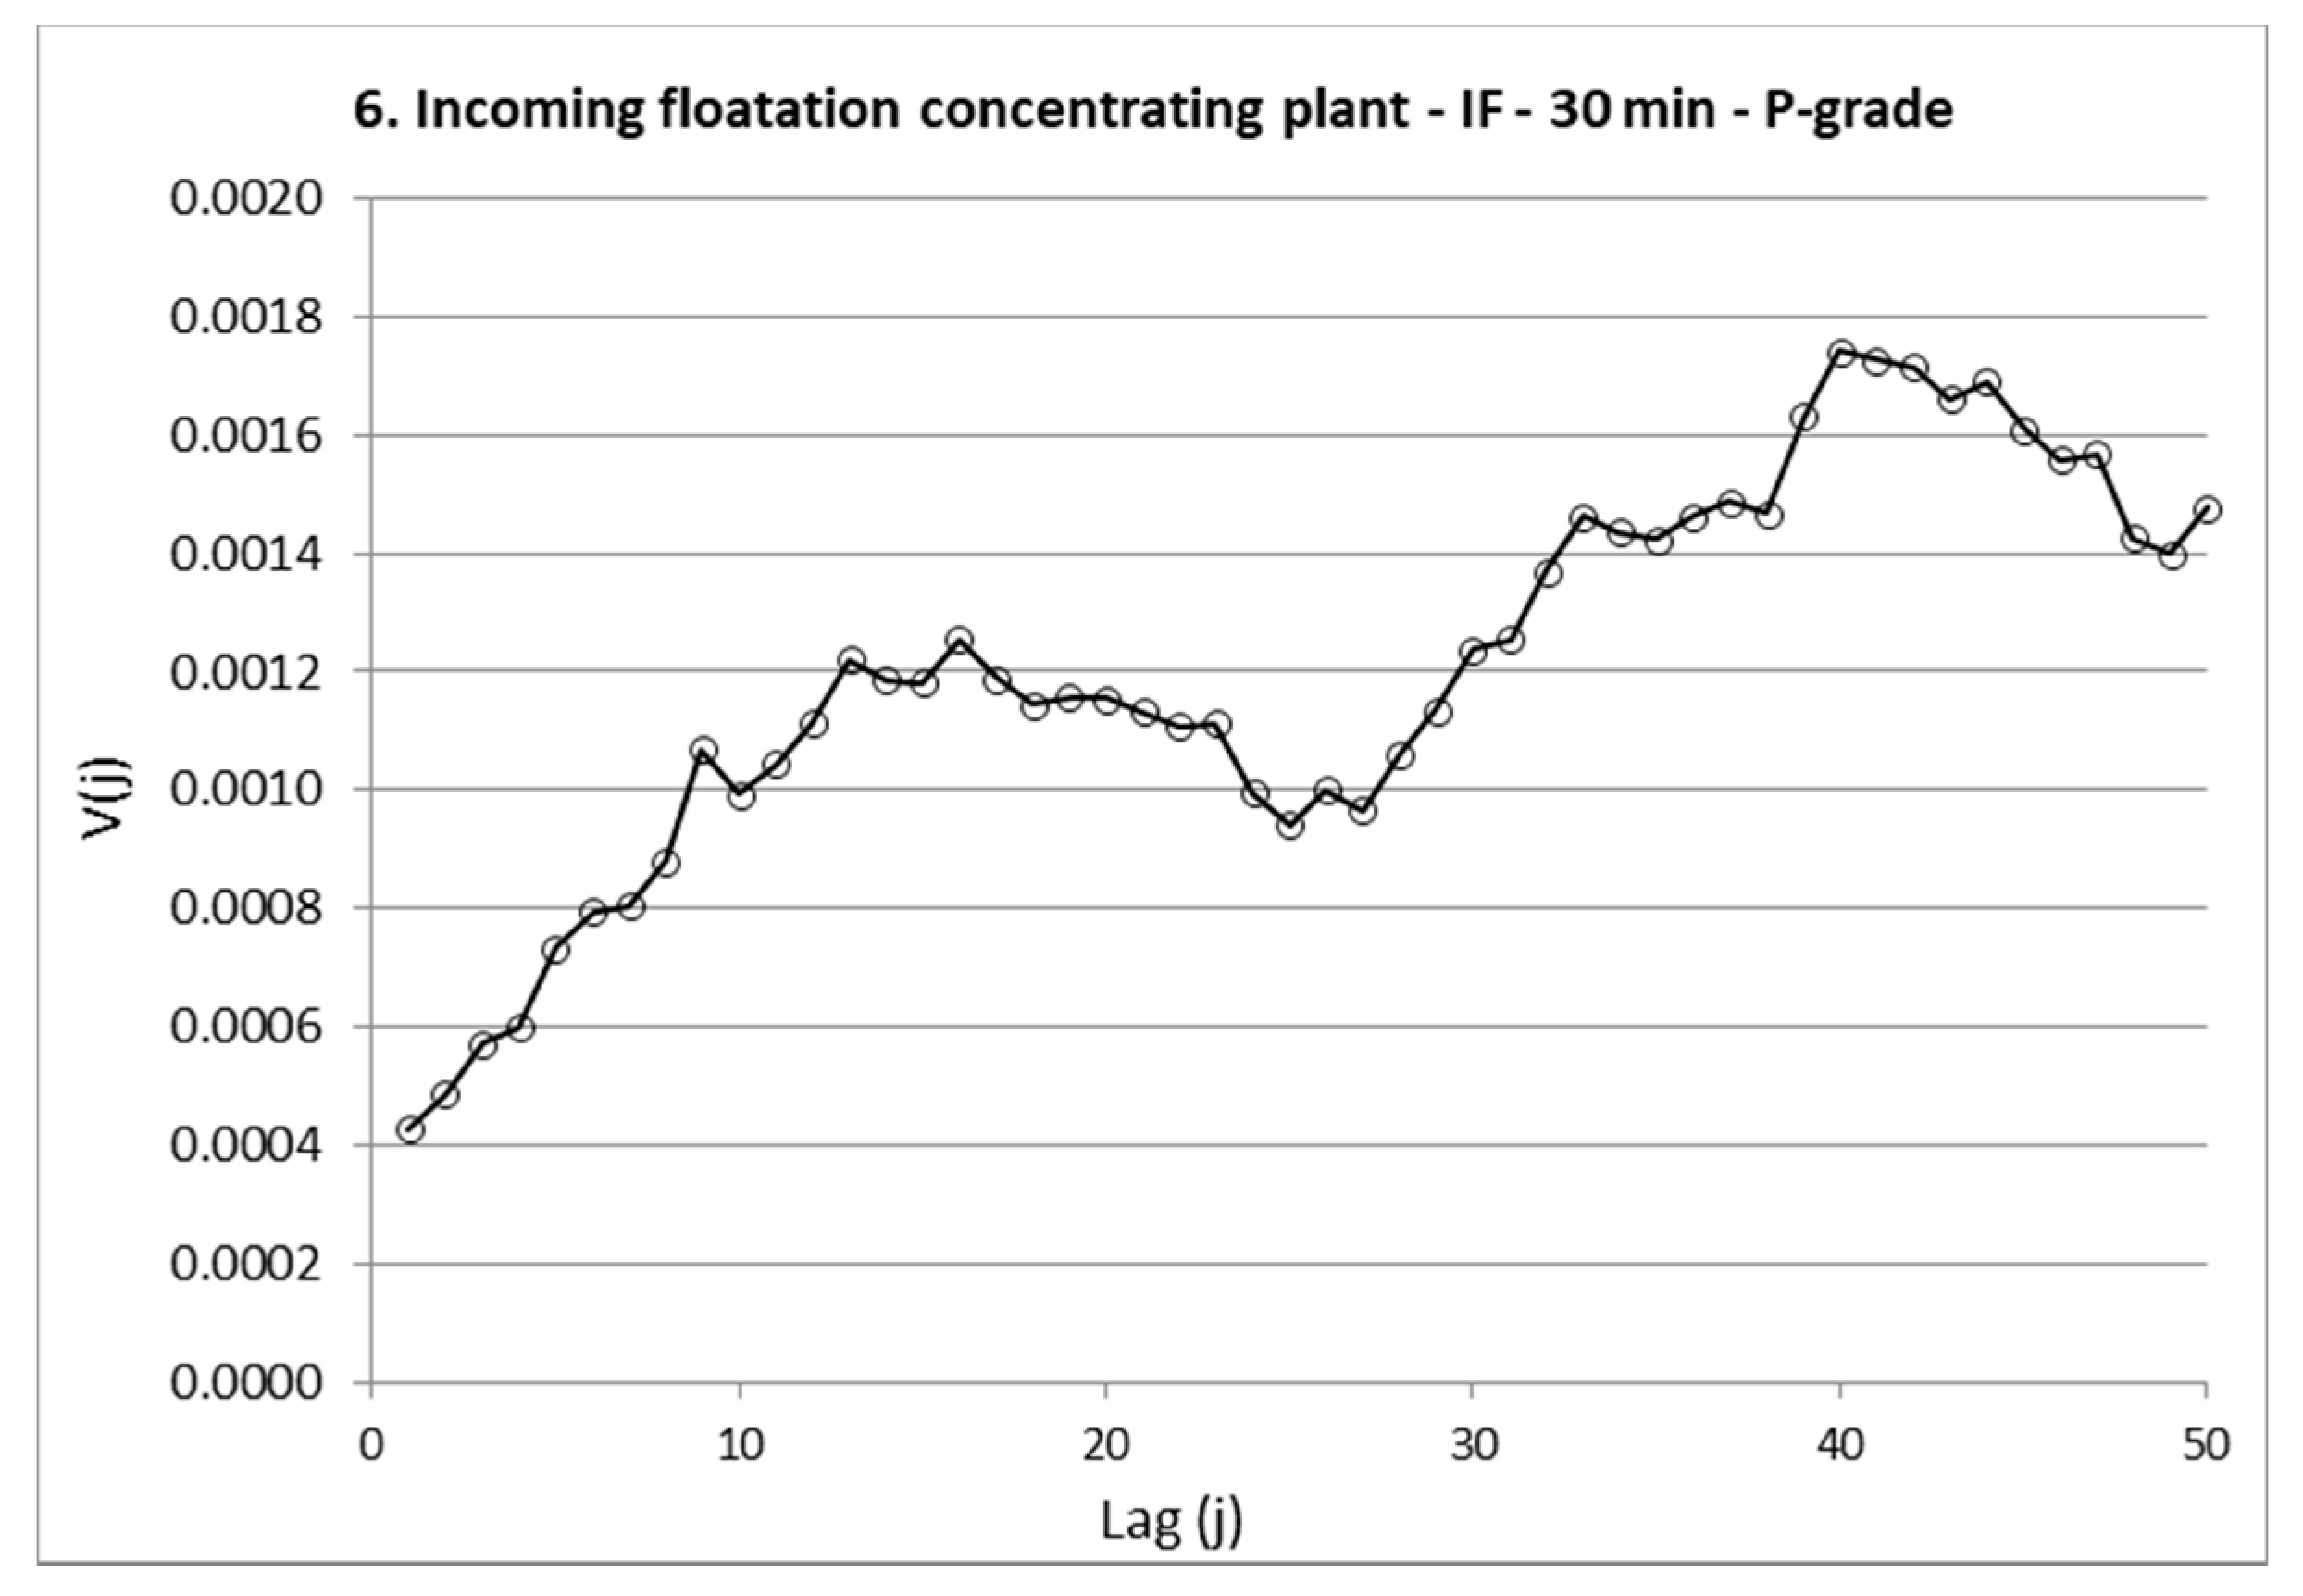
The primary sampling method for phosphorus grade of incoming floatation (IF) is a spear sampler applied to a pressurized slurry pipe. The primary sample is divided in several secondary sampling steps, milled and analysed by automated XRF analysis every 30 min. The variographic characterisation, Figure 9, show an increasing variogram with low nugget effect and a nugget-to-sill ratio of 25%. This is an acceptable level for the difficult case of slurry sampling of pressurized pipes.
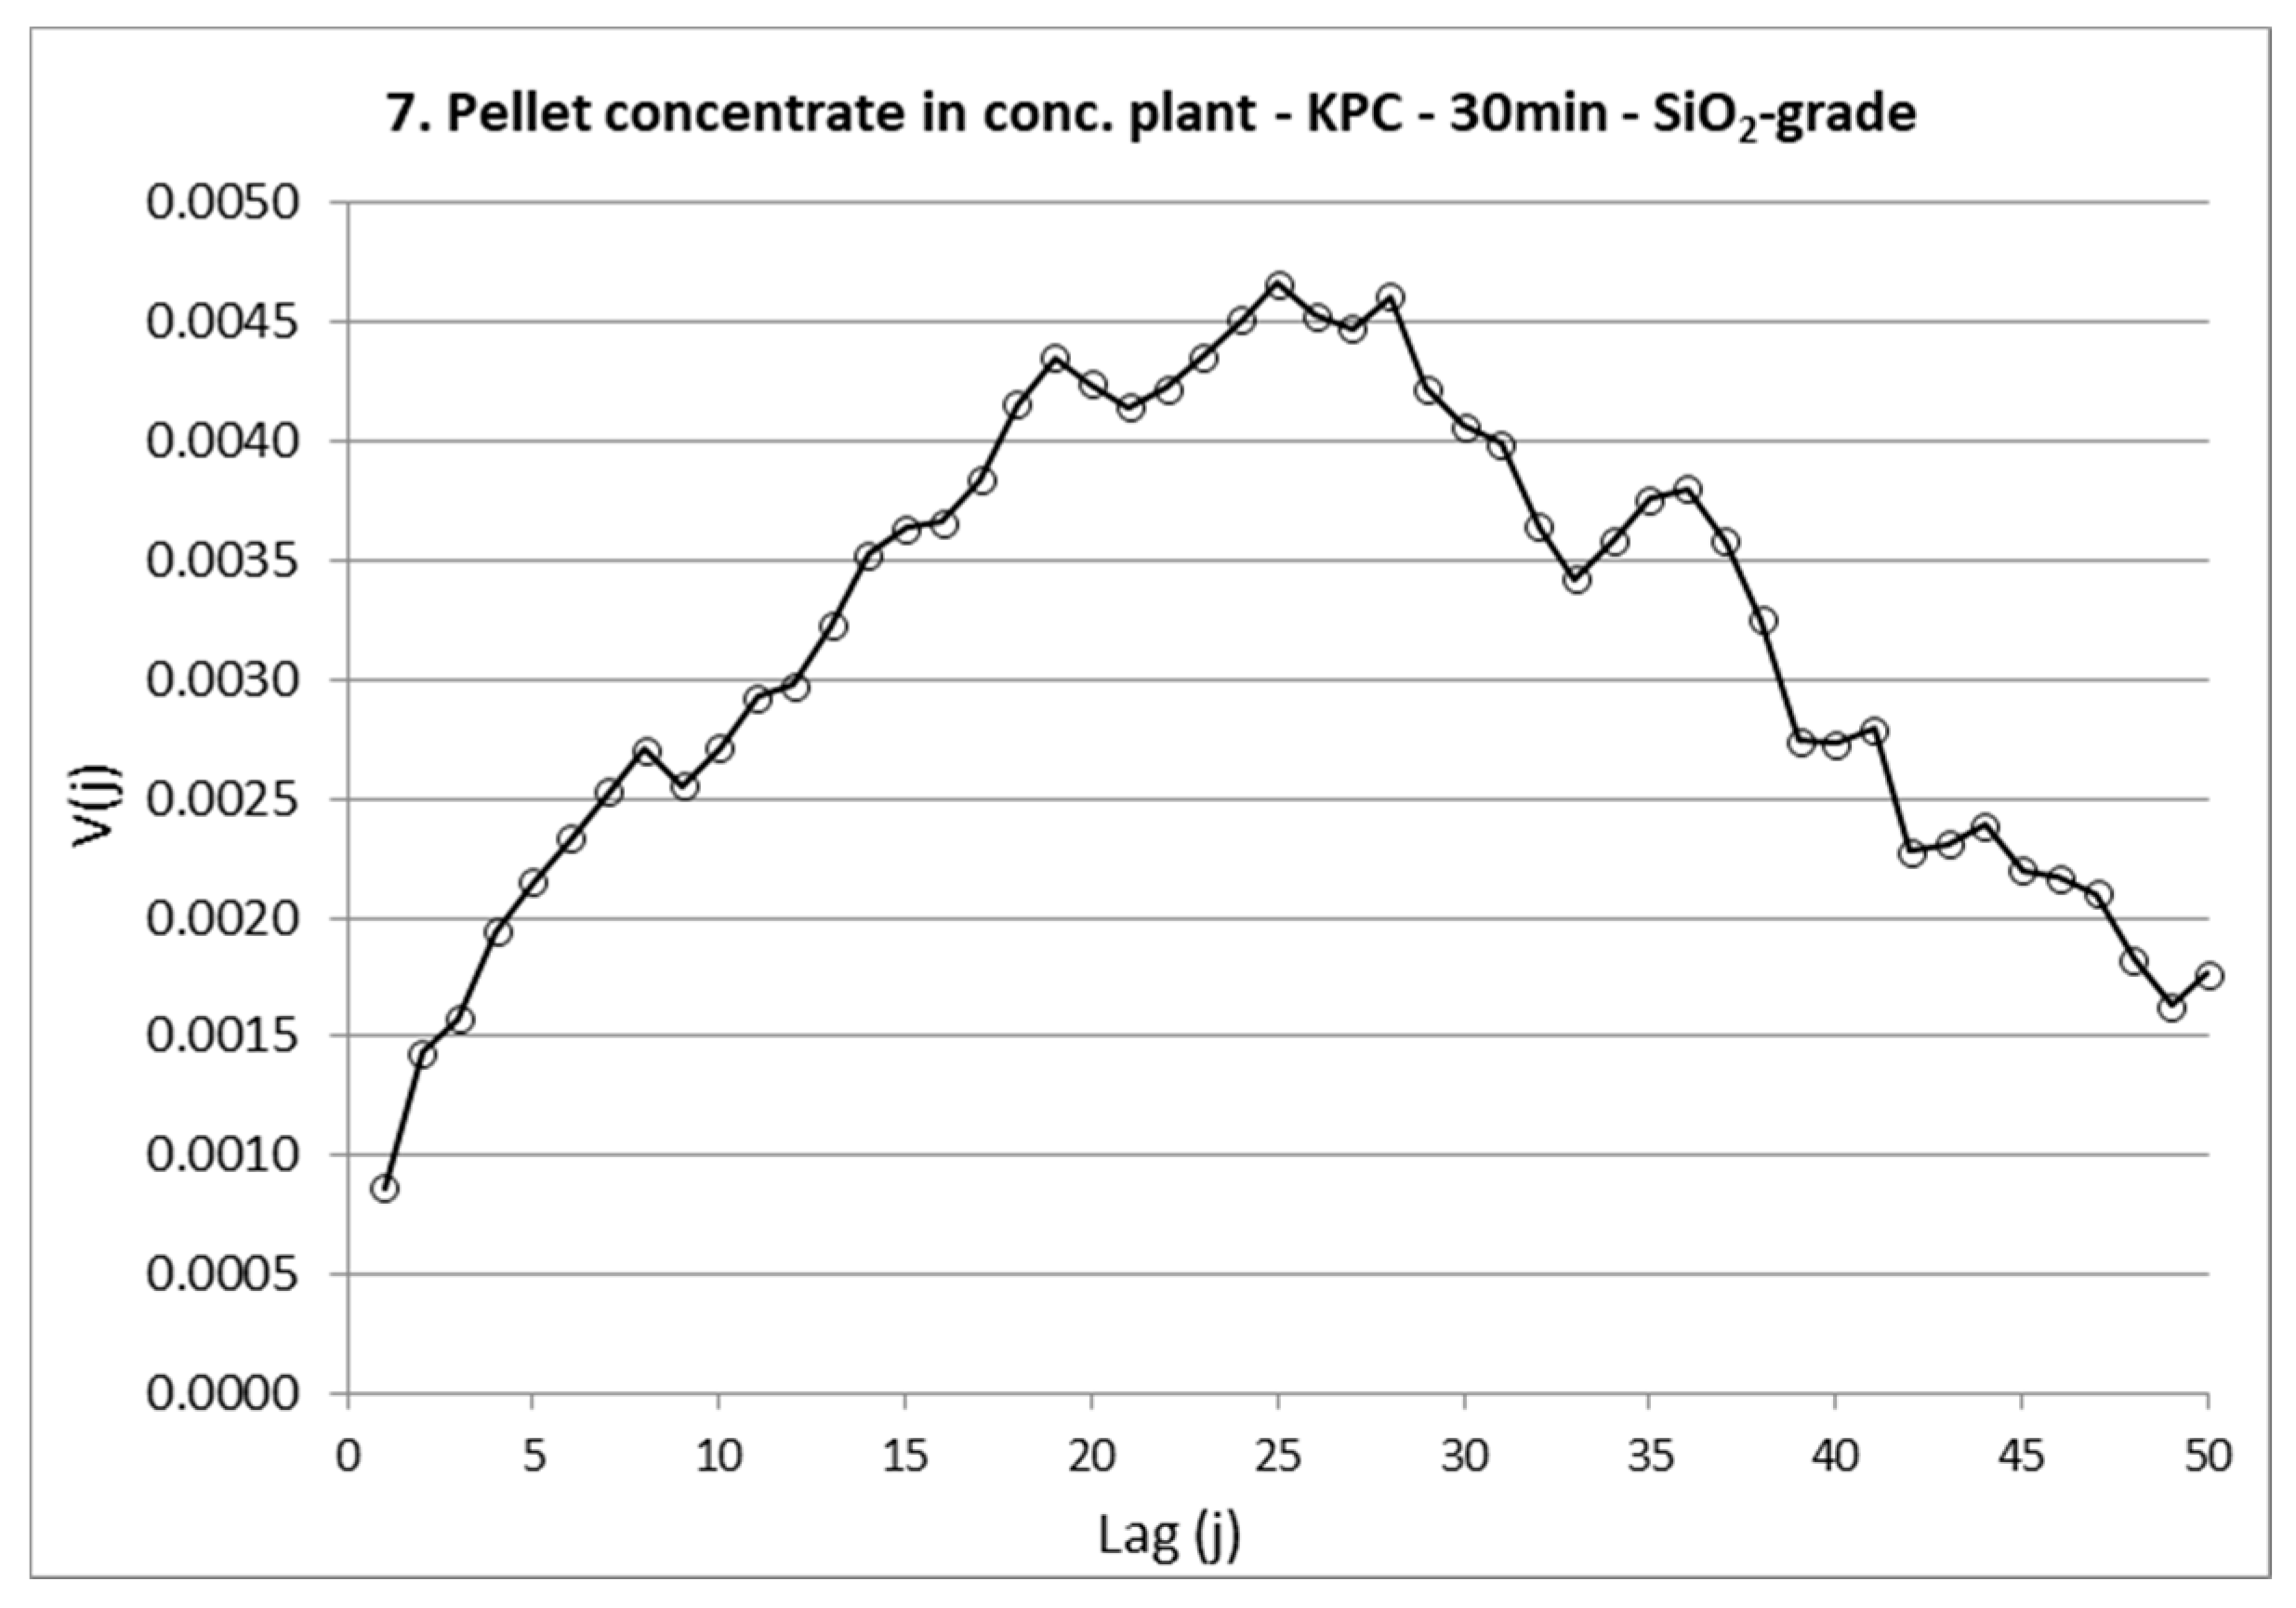
The measurement system for silica grade of pellet concentrate applies a shark-fin slurry sampler for primary sample extraction, followed by equivalent sample preparation and analysis as the phosphorus determination previously described. The variographic characterization, Figure 10, also shows a satisfactory nugget effect and a nugget-to-sill ratio of 20%, acceptable for the shark-fin case. The results in Figure 9 and Figure 10 are likely related to the relatively uniform material being sampled. This empirical study thereby validates the current slurry measurement systems used by LKAB, but the results cannot be readily applied to slurry samplers in general.
The measurement system for silica grade of magnetite slurry applies primary spear sample extraction from a blender tank. The measurement system is recirculating the extracted primary sample back to the blender tank, while it is sub-sampled in subsequent stages (using TOS correct cross stream secondary sampling) to reach the final analytical aliquot. The variogram shows a low nugget effect and a nugget-to-sill ratio of 10%. This is an indication that the slurry material in the blender tank is sufficiently well mixed when being subject to the primary sample extraction. This correspond to the experiences of process and research engineers, confirming that with correct slurry level in the tank, the slurry mixing is adequate and not subjected to segregation. The characterization of this measurement system shows an acceptable measurement system performance.
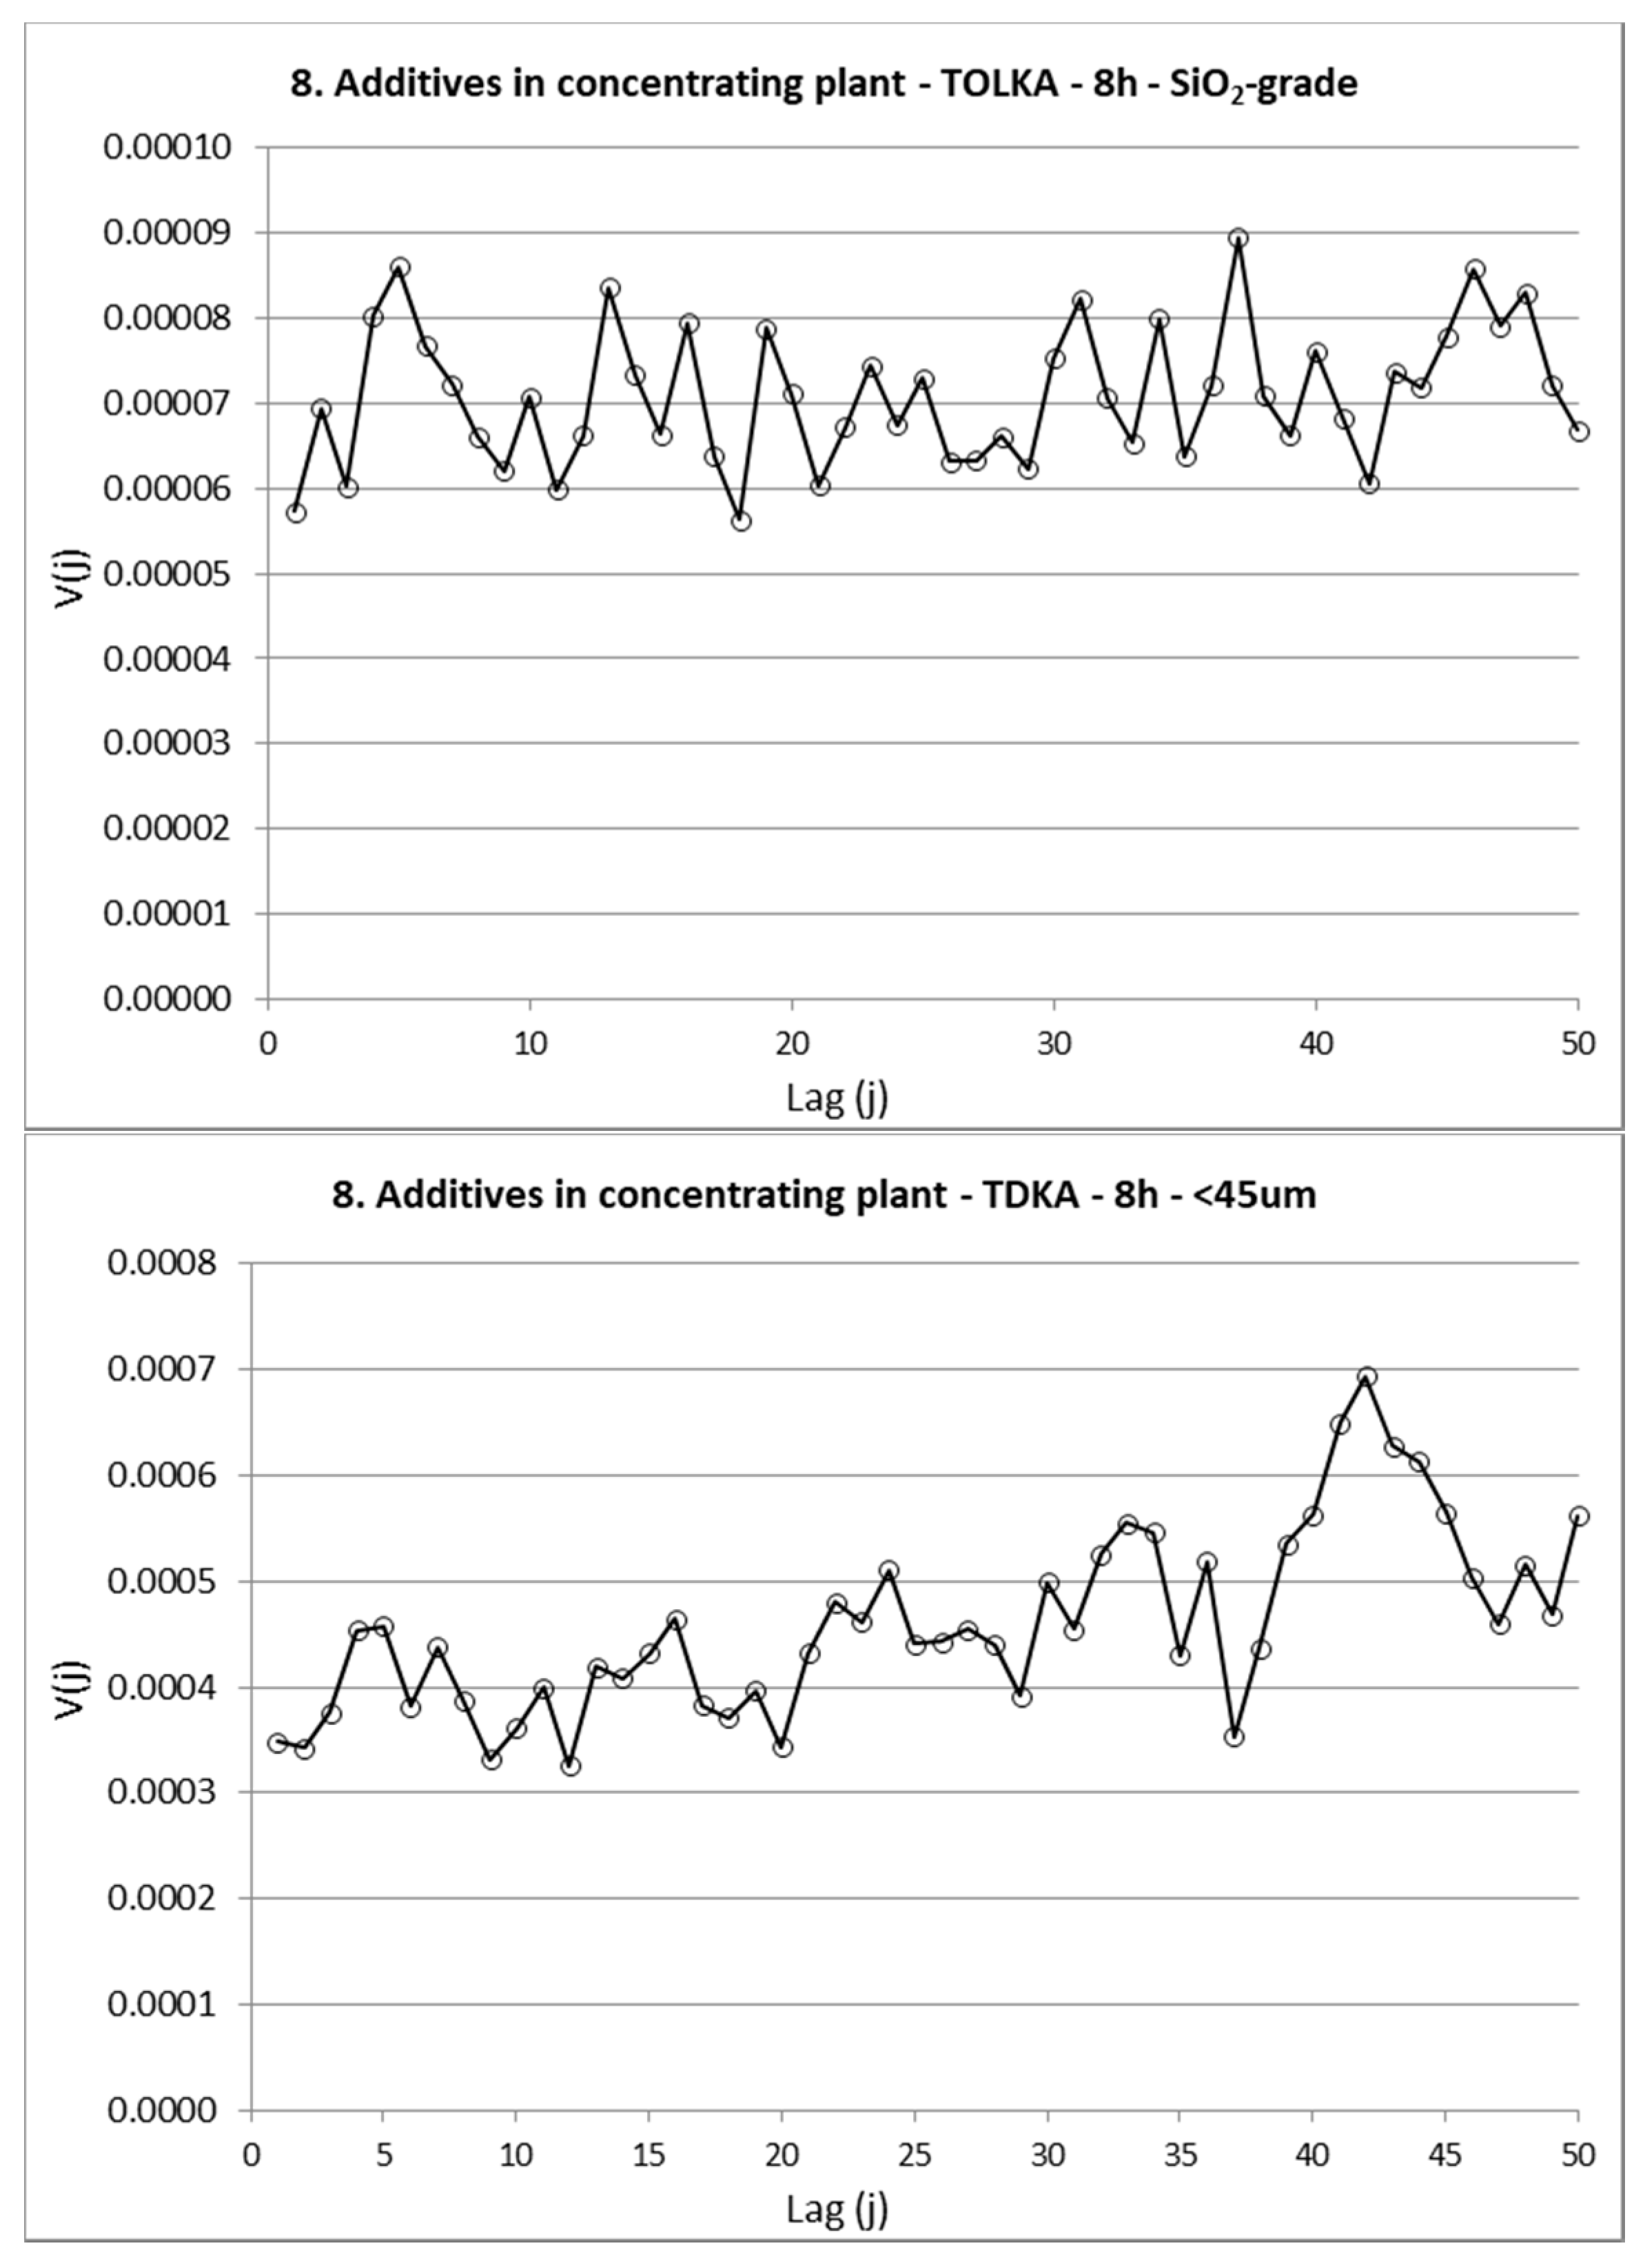
The three measurement systems characterized in Figure 9, Figure 10 and Figure 11 pertain to a 30 min lag interval, corresponding to automated sample preparation and XRF analysis of the divided primary samples. This allow for detailed characterization of the measurement systems in use. The measurement system for silica grade and <45 um of additives are in contrast based on 8h off-line laboratory XRF and sieving analysis respectively. Both these apply shark-fin primary sampling collecting a part of the slurry stream all of the time. The primary sample is aggregated to 8h composite samples brought to the laboratory for analysis.
The variographic characterisation of these two measurement systems, Figure 12, shows flat variograms with a nugget-to-sill ratio close to 100%. The reason for this is likely due to that the grinding process preceding the measurement systems is a ‘stop and go’ process. The grinding circuit is operated towards the filling level of the additive tank. When the tank is full, the grinding is halted, and only started again when material is needed. This results in large material variations when the grinding circuit is emptied and started, with large variations in starting and finishing phases. As this situation often occur within the 8 h sampling interval, the full variation in the process is found within one sampling interval, leading to the observed flat variograms. Periodic variographic characterisation, i.e., updating a variogram at process- and material dependent intervals, is a powerful on-line process/product quality control tool. Monitoring the process and providing an on-line performance grading (nugget effect-to-sill ratio) of the measurement system.
5. Conclusions
Variographic characterisation of 14 critical sampling locations, covering a total of 34 separate measurement systems, show significant disparity along the full processing value chain at LKAB, Sweden. A majority show low sill, i.e., low overall variability which means that many part processes are well controlled, and many variograms also show low nugget effect, indicating satisfactory measurement systems. The notable exceptions point to measurement systems in need of improvements. Where only some were previously known with certainty, variographic analysis now opens up for objective discussion between professions. This study substantiates the general TOS understanding that manual sampling and cross belt hammer samplers is leading to unacceptably large sampling errors and should be abandoned. However, it is also found that slurry shark-fin and spear sampling show acceptable variogram characteristics for these types of material, in contradiction to the general expectations within TOS. This is underlining the strength of comprehensive empirical studies.
The most important aspect of this study is the possibility to characterize process measurement systems statistically with the powerful variographic technique. The present comprehensive compilation of variographic results, covering a full processing value chain, represent a new approach at LKAB. On this basis, it is now possible to conduct rational enquiry of all measurement systems, enabling objective prioritization of where improvement efforts may have the largest cost-benefit effect. After this first base-line survey, more focused variographic studies will for example involve finer resolution details and alternative sampling methods. Variographic characterization can also provide a quality control tool for continuous evaluation of measurement system performance (periodic updating of on-line variograms). Furthermore, variographic characterization is superior for comparing before-and-after measurement system replacement, which will be a natural element in company improvement projects. Optimised process measurement systems will have a positive effect on the company bottom line, i.e., less wasted material, more effective processing, fewer hidden costs and improved decision making.
Author Contributions
Conceptualization, K.E. and K.H.E.; Data curation, K.E.; Formal analysis, K.E.; Methodology, K.E.; Supervision, K.H.E.; Visualization, K.E.; Writing–original draft, K.E.; Writing–review & editing, K.H.E.
Funding
This research is based on internal LKAB funding; Aalborg University (AAU) provided work resources in kind.
Acknowledgments
The authors wish to acknowledge LKAB for allowing publication of the results of this study.
Conflicts of Interest
The first author is a full-time employee of LKAB, where the present study was conducted. The study is a part of a LKAB funded industrial PhD project for the first author and supervised by the co-author.
References
- Esbensen, K.H.; Paasch-Mortensen, P. Process sampling: theory of sampling—the missing link in process analytical technologies (PAT). In Process Analytical Technology: Spectroscopic Tools and Implementation Strategies for the Chemical and Pharmaceutical Industries, 2nd ed.; Bakeev, K., Ed.; John Wiley & Sons: Chichester, UK, 2010; pp. 37–80. [Google Scholar]
- Gy, P. Sampling for Analytical Purposes; John Wiley & Sons Ltd.: West Sussex, UK, 1998. [Google Scholar]
- Pitard, F.F. Pierre Gy’s Sampling Theory and Sampling Practice: Heterogeneity, Sampling Correctness, and Statistical Process Control, 2nd ed.; CRC Press LLC: Boca Raton, FL, USA, 1993. [Google Scholar]
- Holmes, R.J. Sampling mineral commodities—The good, the bad, and the ugly. J. S. Afr. Inst. Min. Metall. 2010, 110, 269–276. [Google Scholar]
- Gy, P. Sampling of Particulate Materials, Theory and Practice, 1st ed.; Elsevier: Amsterdam, The Netherlands, 1979. [Google Scholar]
- Esbensen, K.H. DS 3077 Representative Sampling—Horizontal Standard; Danish Standards Foundation: Charlottenlund, Denmark, 2013. [Google Scholar]
- Minnitt, R.; Esbensen, K.H. Pierre Gy’s development of the Theory of Sampling: A retrospective summary with a didactic tutorial on quantitative sampling of one-dimensional lots. TOS Forum 2017, 7, 7–19. [Google Scholar] [CrossRef]
- Minnitt, R.; Pitard, F.F. Application of variography to the control of species in material process streams. J. S. Afr. Inst. Min. Metall. 2008, 108, 109–122. [Google Scholar]
- Engström, K.; Esbensen, K.H. Evaluation of sampling systems in iron ore concentrating and pelletizing processes—Quantification of Total Sampling Error (TSE) vs. process variation. Miner. Eng. 2017, 116, 203–208. [Google Scholar] [CrossRef]
- Engström, K.; Esbensen, K.H. Blasthole sampling (replicate and variographic experiments) in LKAB open pit iron ore mines: Fit-for-purpose representativity? In Proceedings of the 8th World Conference on Sampling and Blending, Perth, Australia, 9–11 May 2017; Dominy, S.C., Esbensen, K.H., Eds.; Australasian Institute of Mining and Metallurgy: Melbourne, Australia, 2017; pp. 85–95. [Google Scholar]
- Minkkinen, P. Properties of process variograms. In Proceedings of the 6th World Conference on Sampling and Blending, Lima, Peru, 19–22 November 2013; Beniscelli, J., Costa, J.F., Domínguez, O., Duggan, S., Esbensen, K.H., Lyman, G., Sanfurgo, B., Eds.; Gecamin: Santiago, Chile, 2013; pp. 241–248. [Google Scholar]
- Esbensen, K.H.; Román-Ospino, A.D.; Sanchez, A.; Romañach, R.J. Adequacy and verifiability of pharmaceutical mixtures and dose units by variographic analysis (Theory of Sampling)—A call for a regulatory paradigm shift. Int. J. Pharm. 2016, 499, 156–174. [Google Scholar] [CrossRef] [PubMed]
- Tellesbø, H.; Esbensen, K.H. Corporate Exclay process and product quality control–variographic analysis of kiln bulk density. In Proceedings of the 4th World Conference on Sampling and Blending, Cape Town, South Africa, 19–23 October 2009; The Southern African Institute of Mining and Metallurgy: Marshalltown, South Africa, 2009; pp. 259–267. [Google Scholar]
- Thisted, E.; Thisted, U.; Böckman, O.; Esbensen, K.H. Variographic case study for designing, monitoring and optimizing industrial measurement systems—The missing link in Lean and Six Sigma. In Proceedings of the 8th World Conference on Sampling and Blending, Perth, Australia, 9–11 May 2017; Dominy, S.C., Esbensen, K.H., Eds.; Perth. Australasian Institute of Mining and Metallurgy: Melbourne, Australia, 2017; pp. 359–366. [Google Scholar]
- Haughy, C.; Pitard, F.F. Use of variography to measure improvement of sampling practices for the quality control of graphite consistency in marble used for carbon-sensitive applications. In Proceedings of the 8th World Conference on Sampling and Blending, Perth, Australia, 9–11 May 2017; Dominy, S.C., Esbensen, K.H., Eds.; Australasian Institute of Mining and Metallurgy: Melbourne, Australia, 2017; pp. 255–259. [Google Scholar]
- Tellesbø, H.; Esbensen, K.H. Practical use of variography to find root causes to high variances in industrial production processes I. In Proceedings of the 6th World Conference on Sampling and Blending, Lima, Peru, 19–22 November 2013; Beniscelli, J., Costa, J.F., Domínguez, O., Duggan, S., Esbensen, K.H., Lyman, G., Sanfurgo, B., Eds.; Gecamin: Santiago, Chile, 2013; pp. 275–286. [Google Scholar]
- Tellesbø, H.; Esbensen, K.H. Practical use of variography to find root causes to high variances in industrial production processes II. In Proceedings of the 6th World Conference on Sampling and Blending, Lima, Peru, 19–22 November 2013; Beniscelli, J., Costa, J.F., Domínguez, O., Duggan, S., Esbensen, K.H., Lyman, G., Sanfurgo, B., Eds.; Gecamin: Santiago, Chile, 2013; pp. 287–294. [Google Scholar]
- Esbensen, K.H.; Wagner, C. Theory of Sampling (TOS) vs. Measurement Uncertainty (MU)—A call for integration. Trend Anal. Chem. 2014, 57, 93–106. [Google Scholar] [CrossRef]
- Petersen, L.; Minkkinen, P.; Esbensen, K.H. Representative sampling for reliable data analysis: Theory of sampling. Chemom. Intell. Lab. Syst. 2005, 77, 261–277. [Google Scholar] [CrossRef]
- International Organization for Standardization. ISO 3082: Iron Ores—Sampling and Sample Preparation Procedures (2017); International Organization for Standardization: Geneva, Switzerland, 2017. [Google Scholar]
- Wicks, M. Innovative sampling solutions for the mining industry. In Proceedings of the 7th World Conference on Sampling and Blending, Bordeaux, France, 10–12 June 2015; Esbensen, K.H., Wagner, C., Eds.; IMP Publications: Chichester, UK, 2015; pp. 105–110. [Google Scholar]
- Kelly, S.E.; Pitard, F.F. Review of a non-probabilistic sampler versus a Vezin sampler on low weight percent solids slurries. In Proceedings of the 7th World Conference on Sampling and Blending, Bordeaux, France, 10–12 June 2015; Esbensen, K.H., Wagner, C., Eds.; IMP Publications: Chichester, UK, 2015; pp. 129–136. [Google Scholar]
- Esbensen, K.H.; Romañach, R.J. Proper sampling, total measurement uncertainty, variographic analysis & fit-for-purpose acceptance levels for pharmaceutical mixing monitoring. In Proceedings of the 7th World Conference on Sampling and Blending, Bordeaux, France, 10–12 June 2015; Esbensen, K.H., Wagner, C., Eds.; IMP Publications: Chichester, UK, 2015; pp. 199–203. [Google Scholar]
- Engström, K.; Mickelsson, K-O.; Töyrä, S.; Esbensen, K.H. Improvement of sampling for moisture content analysis in iron ore pellet feed—Variographic characterization and on-line IR-analysis. In Proceedings of the 29th International Mineral Processing Congress, Moscow, Russia, 15–21 September 2018. [Google Scholar]
Figure 1.
Schematic overview of the processing value chain at LKAB, Kiruna. Numbers (in circles) indicate the 14 critical sampling locations where variographic characterization of measurement system performance have been applied.
Figure 1.
Schematic overview of the processing value chain at LKAB, Kiruna. Numbers (in circles) indicate the 14 critical sampling locations where variographic characterization of measurement system performance have been applied.

Figure 2.
36 relative variograms representing a total of 14 sampling locations and 34 measurement systems. Two specific variographic experiments are presented, one for a current measurement system (Fe-grade of tailings in the sorting plant) and one for an alternative measurement system (moisture content of filtered slurry in the pelletizing plant). The scale on the y-axis, v(j), is equal on all variograms (v(j) = 0–0.1) except one, marked with dashed black frame (v(j) = 0–0.2).


Figure 3.
(a) Semi variogram for initial process sampling and variographic experiment conducted on sampling location 3, Fe-grade of tailings in the sorting plant (note the different time scales for the 8 h process sampling variogram and the 5 min variographic experiment). (b) Enlarged variogram for the 5-minute variographic experiment, conducted for Fe-grade of tailings in the sorting plant. Note the different scales of the y-axis in (a,b).

Figure 4.
Relative variograms for the four measurement systems with sill levels of approximately 0.1–0.2%. (a) Variogram for measurement system 12:4 h KH45 analysis of green pellets, (b) Variogram for measurement system 13:24 h analysis of silica grade of DR pellets, (c) Variogram for measurement system 13:1 h analysis of size fraction 5–9 mm of BF pellets, (d) Variogram for measurement system 13:1 h analysis of the size fraction 12.5–16 mm of BF pellets.


Figure 5.
Semi variograms for the process sampling and three variographic experiments conducted on sampling location 12, moisture content of filtered magnetite slurry in the pelletizing plant (Variographic experiment results are previously presented in Engström et al. [24]. Note different time intervals for the separate variogram lags.

Figure 6.
Relative semi-variogram for the measurement system of iron grade of the incoming ore to the sorting plant.
Figure 6.
Relative semi-variogram for the measurement system of iron grade of the incoming ore to the sorting plant.

Figure 7.
Relative semi-variogram for the measurement system of iron grade of the fine fraction from the first milling in the concentrating plant.
Figure 7.
Relative semi-variogram for the measurement system of iron grade of the fine fraction from the first milling in the concentrating plant.

Figure 8.
Three replicated high resolution variograms for separate ship loadings, for individual increment determination of the size fraction 5–9 mm. The high resolution variograms were prepared in order to characterize the loading measurement system in full detail.
Figure 8.
Three replicated high resolution variograms for separate ship loadings, for individual increment determination of the size fraction 5–9 mm. The high resolution variograms were prepared in order to characterize the loading measurement system in full detail.


Figure 9.
Relative variogram for the phosphorus grade determination of incoming floatation, based on pressurized spear primary sampling.
Figure 9.
Relative variogram for the phosphorus grade determination of incoming floatation, based on pressurized spear primary sampling.

Figure 10.
Relative variogram for the silica grade determination of pellet concentrate, based on slurry shark-fin primary sampling.
Figure 10.
Relative variogram for the silica grade determination of pellet concentrate, based on slurry shark-fin primary sampling.

Figure 11.
Relative variogram for the silica grade determination of magnetite slurry, based on primary spear sampling from a blender tank.
Figure 11.
Relative variogram for the silica grade determination of magnetite slurry, based on primary spear sampling from a blender tank.

Figure 12.
Relative variograms for the measurement systems for silica grade and <45 um of additives, based on 8 h laboratory XRF and sieving analysis respectively. Both these systems use shark-fin samplers for primary sample extraction.
Figure 12.
Relative variograms for the measurement systems for silica grade and <45 um of additives, based on 8 h laboratory XRF and sieving analysis respectively. Both these systems use shark-fin samplers for primary sample extraction.


| Notation | Definition | Description |
|---|---|---|
| V(0)—Nugget effect | Extrapolated intersect of y-axis | Short range random variability stemming from the total measurement system, including sampling, sub-sampling, sample preparation and analytical measurement. The nugget effect is according to TOS the sum of all CSE and ISE, as well as the Total Analytical Error (TAE). |
| V(1) | Value at V(1) | The total variability occurring in the time between two samples, i.e., the total measurement system variability and the process variability that occurs between any two consecutive analyses. |
| V(Process) | V(1)–V(0) | Process variability for the time interval between two samples, not including the total measurement system variability. The relationship between V(process) and V(0) is an indication of the possibility to control the process with current sampling interval. |
| Sill | ‘Ceiling level’ of the variogram | Describes the highest variability, or the global heterogeneity, in the data series. Technically the sill is the average of all variogram point values. |
| Range | Where the variogram reaches the sill | For process variograms the range can be directly translated into a time interval where paired samples show auto-correlation. The range is where an increasing variogram has flattened out. |
| Nugget-to-sill ratio | Relative measurement system variability | The nugget divided by the sill describe the variability stemming from the measurement system, relative to the overall variability. This ratio is an effective quality grading for any measurement system, also allowing distinct comparison between systems. |
© 2018 by the authors. Licensee MDPI, Basel, Switzerland. This article is an open access article distributed under the terms and conditions of the Creative Commons Attribution (CC BY) license (http://creativecommons.org/licenses/by/4.0/).
Share and Cite
MDPI and ACS Style
Engström, K.; Esbensen, K.H. Variographic Assessment of Total Process Measurement System Performance for a Complete Ore-to-Shipping Value Chain. Minerals 2018, 8, 310. https://doi.org/10.3390/min8070310
AMA Style
Engström K, Esbensen KH. Variographic Assessment of Total Process Measurement System Performance for a Complete Ore-to-Shipping Value Chain. Minerals. 2018; 8(7):310. https://doi.org/10.3390/min8070310
Chicago/Turabian StyleEngström, Karin, and Kim H. Esbensen. 2018. "Variographic Assessment of Total Process Measurement System Performance for a Complete Ore-to-Shipping Value Chain" Minerals 8, no. 7: 310. https://doi.org/10.3390/min8070310
Note that from the first issue of 2016, this journal uses article numbers instead of page numbers. See further details here.