Communication

A Method for Negotiating Various Customer Requirements for Public Service Design

1
Department of System Design, Tokyo Metropolitan University, Asahigaoka 6-6, Hino-shi, Tokyo 191-0053, Japan
2
Department of System Design, Tokyo Metropolitan University, Asahigaoka 6-6, Hino-shi, Tokyo 191-0053, Japan
*
Author to whom correspondence should be addressed.
Axioms 2014, 3(1), 1-9; https://doi.org/10.3390/axioms3010001
Submission received: 4 November 2013 / Revised: 16 December 2013 / Accepted: 17 December 2013 / Published: 20 December 2013
(This article belongs to the Special Issue Axioms of Decision Support System)

Abstract

:
A method for public service design, which enables designers to realize high-value added service design by considering plural different customer groups in parallel, is proposed. In General, service designs focus on specific customers. However, because of the diversity of customer requirements, it is difficult to design a public service that addresses the requirements of all customers. To achieve higher customer satisfaction, it is imperative to summarize the requirements of various customers and design a service by considering customers belonging to different categories. In this article, we propose a method that enables highly public service development by considering groups of various customers and minimizing customer dissatisfaction by adopting a group-decision-making approach. As a consequence, improvement of effectiveness of highly public service development can be expected.

1. Introduction

Environmental problems have grown in importance over the last couple of decades. Consequently, society should reduce its production and consumption volumes of artifacts to an adequate, manageable size without decreasing the current quality of life. To this end, it would be effective to pursue qualitative satisfaction rather than quantitative sufficiency and thus decouple economic growth from material and energy consumption [1]. For this purpose, manufacturing companies are starting to recognize that services and knowledge provided through a product are more important than the product itself [2]. As a result, “Product-Service System (PSS),” [3,4] which create value by coupling a physical product and a service, have been attracting attention. From the viewpoint of offering products in combination with services, value is always determined by customers [2]. Designers, therefore, need to focus more on customers to understand the objectives of their tasks, that is, the context in which the product/service will be used, and the type of user.
The authors of this paper have conducted conceptual research on service design from an engineering viewpoint. This field of research is called Service Engineering (e.g., [5]). Its objective is to provide a fundamental understanding of services as well as concrete engineering methodologies that can be used to design and evaluate services. Service Engineering differs from conventional engineering. Conventional engineering focuses on achieving product functionality. As a result, analysis of customer requirements is excluded in the process. In the design methodology proposed by Service Engineering, however, the design target represents what the customer values. Therefore, the design process includes procedures to understand the target customer and to extract his/her requirements. However, difficulties remain with deciding which requirements should be investigated, particularly in public services [6,7].
This is due to public services having non-excludability as their central feature; no one can be effectively excluded from receiving the service [6,7]. In public services, various types of customer categories must be included, and requirements vary from customer to customer. In order to achieve high value-added services with limited resources, it is necessary to analyze various customer requirements and prioritize them in an effective manner.
According to this background, the paper proposes a method to prioritize customer categories and their requirements by adopting the approach of group decision-making [8]. In addition, the proposed method includes the portfolio analysis that compares the priority of customer categories and their requirements.
The effectiveness of this method is demonstrated by its application to the example of an elevator renewal service.

2. Representation of Customer Requirements

2.1. Customer Requirements

In Service Engineering, a service is defined as an activity undertaken by a service provider to change the state of a service receiver [5]. Note that the term “service” is used in a broad sense, and thus the design target includes not only intangible human activities but also tangible products in a manner similar to PSS.
According to the definition, a receiver is satisfied when his/her state changes to a new desirable state. Since the value of a service is determined by the receiver, service design should be based on the resulting state change of the receiver. For design purposes, it is necessary to find a method to express the state changes of the receiver. The target receiver’s state in service design is represented as a set of parameters called receiver state parameters (RSPs) [5].
In the same manner as Service Engineering, in this study, requirements of customer categories can be represented by a set of RSPs.

2.2. Customer Categories

In the process of Service Engineering’s extraction of RSPs, the concept of “persona” [9] is adopted to describe a representative customer in the form of personal information. The concept of persona is frequently used in the practical design of software interfaces. The persona is a tool to give a simplified description of a customer, and it works as a compass in a design process. In Service Engineering, the first step toward realizing a service design is expressing a persona. Then, designers identify and extract customer requirements (i.e., RSPs) from the personas.
In this study, a persona is described as a representative person in each customer category, and then the extraction of RSPs is conducted on the basis of each persona.

3. A Method for Negotiating Various Customer Requirements

3.1. Prioritizing Customer Categories

As mentioned above, in order to achieve high value-added public services with limited resources, it is necessary to prioritize various customer requirements. However, a service aiming to satisfy the requirements of particular customer categories may preclude achieving the requirements of the others. To solve this problem, this study adopts the group decision-making stress method [8].
The group decision-making stress method proposes a service plan that minimizes the overall dissatisfaction (group decision-making stress) of all group members on the basis of the original evaluation of the decision-makers and their priority. In this study, a decision-maker corresponds to a customer category, i.e., a persona. In addition, the original evaluation is represented as importance for extracted RSPs rated by each persona. According to the group decision-making stress method, the overall dissatisfaction for a service plan (S) is defined as the sum of the distances between individual opinions and the group opinion. The value of S is calculated with Equations (1)–(3).
i = 1 n w i = 1
e j = 1 n i = 1 n w i x i j
S = j = 1 m i = 1 n ( w i x i j e j ) 2
  • i: a customer category (a persona) (i = 1, 2, 3, …, n)
  • j: items of RSPs (j = 1, 2, 3, …, m)
  • xij: importance of RSPj for customer categoryi
  • wi: priority of customer categoryi
  • ej: ensemble mean of RSPj
Since xij expresses the requirement of each customer category, this variable is considered a fixed value. As such, in Equations (1)–(3), wi is the only adaptable variable. This study assumes that wi which minimizes S (hereinafter referred to as wi*) is the rational priority to be obtained. Concretely, wi* can be derived by using the method of Lagrange multipliers which is an optimization method to find the local maxima and minima of a function subject to equality constraints. In this study, Equation (3) is the target function of optimization and Equation (1) is the constraint. λ is assumed to be Lagrange multiplier. As a result, the rational priority wi* is calculated with Equations (4)–(6).
X i =   ( x i 1 x i j x i m )
w * =   ( w 1 * w i * w n * )
( w * λ )   = ( ( n 1 ) | X 1 | 2 ,   ( X 1 , X 2 ) ,   ,   ( X 1 , X n ) ,   1   ( X 2 , X 1 ) ,   ( n 1 ) | X 2 | 2 ,   ,   ( X 2 , X n ) ,   1   ,   ,   ,   ,   1   ( X n , X 1 ) ,   ( X n , X 2 ) ,   ,   ( n 1 )   | X n | 2 ,   1     1 ,   1 ,   1 ,   1 ,   0   ) 1   ( 0 0 0 1 )
In addition, by substituting the calculated wi* into Equation (2), service designers obtain the importance of RSPs in consideration of the priority of each customer category.

3.2. Quantifying Requirements of Each Customer Category

In order to understand the difference between the requirements of each customer category, this study proposes the opinion score. The opinion scores provide a summary of customer requirements, i.e., the importance of RSPs. For the calculation of the opinion score, the “Quantification Theory, type three” [10] is adopted. This is one of the methods used for multidimensional data analysis and is adopted when the analysis element cannot be expressed quantitatively. The opinion score is determined by a certain axis that has the highest correlation with the importance of RSPs. If the opinion scores for different customer categories are close, it implies that the opinions of these customers are similar in some aspects.

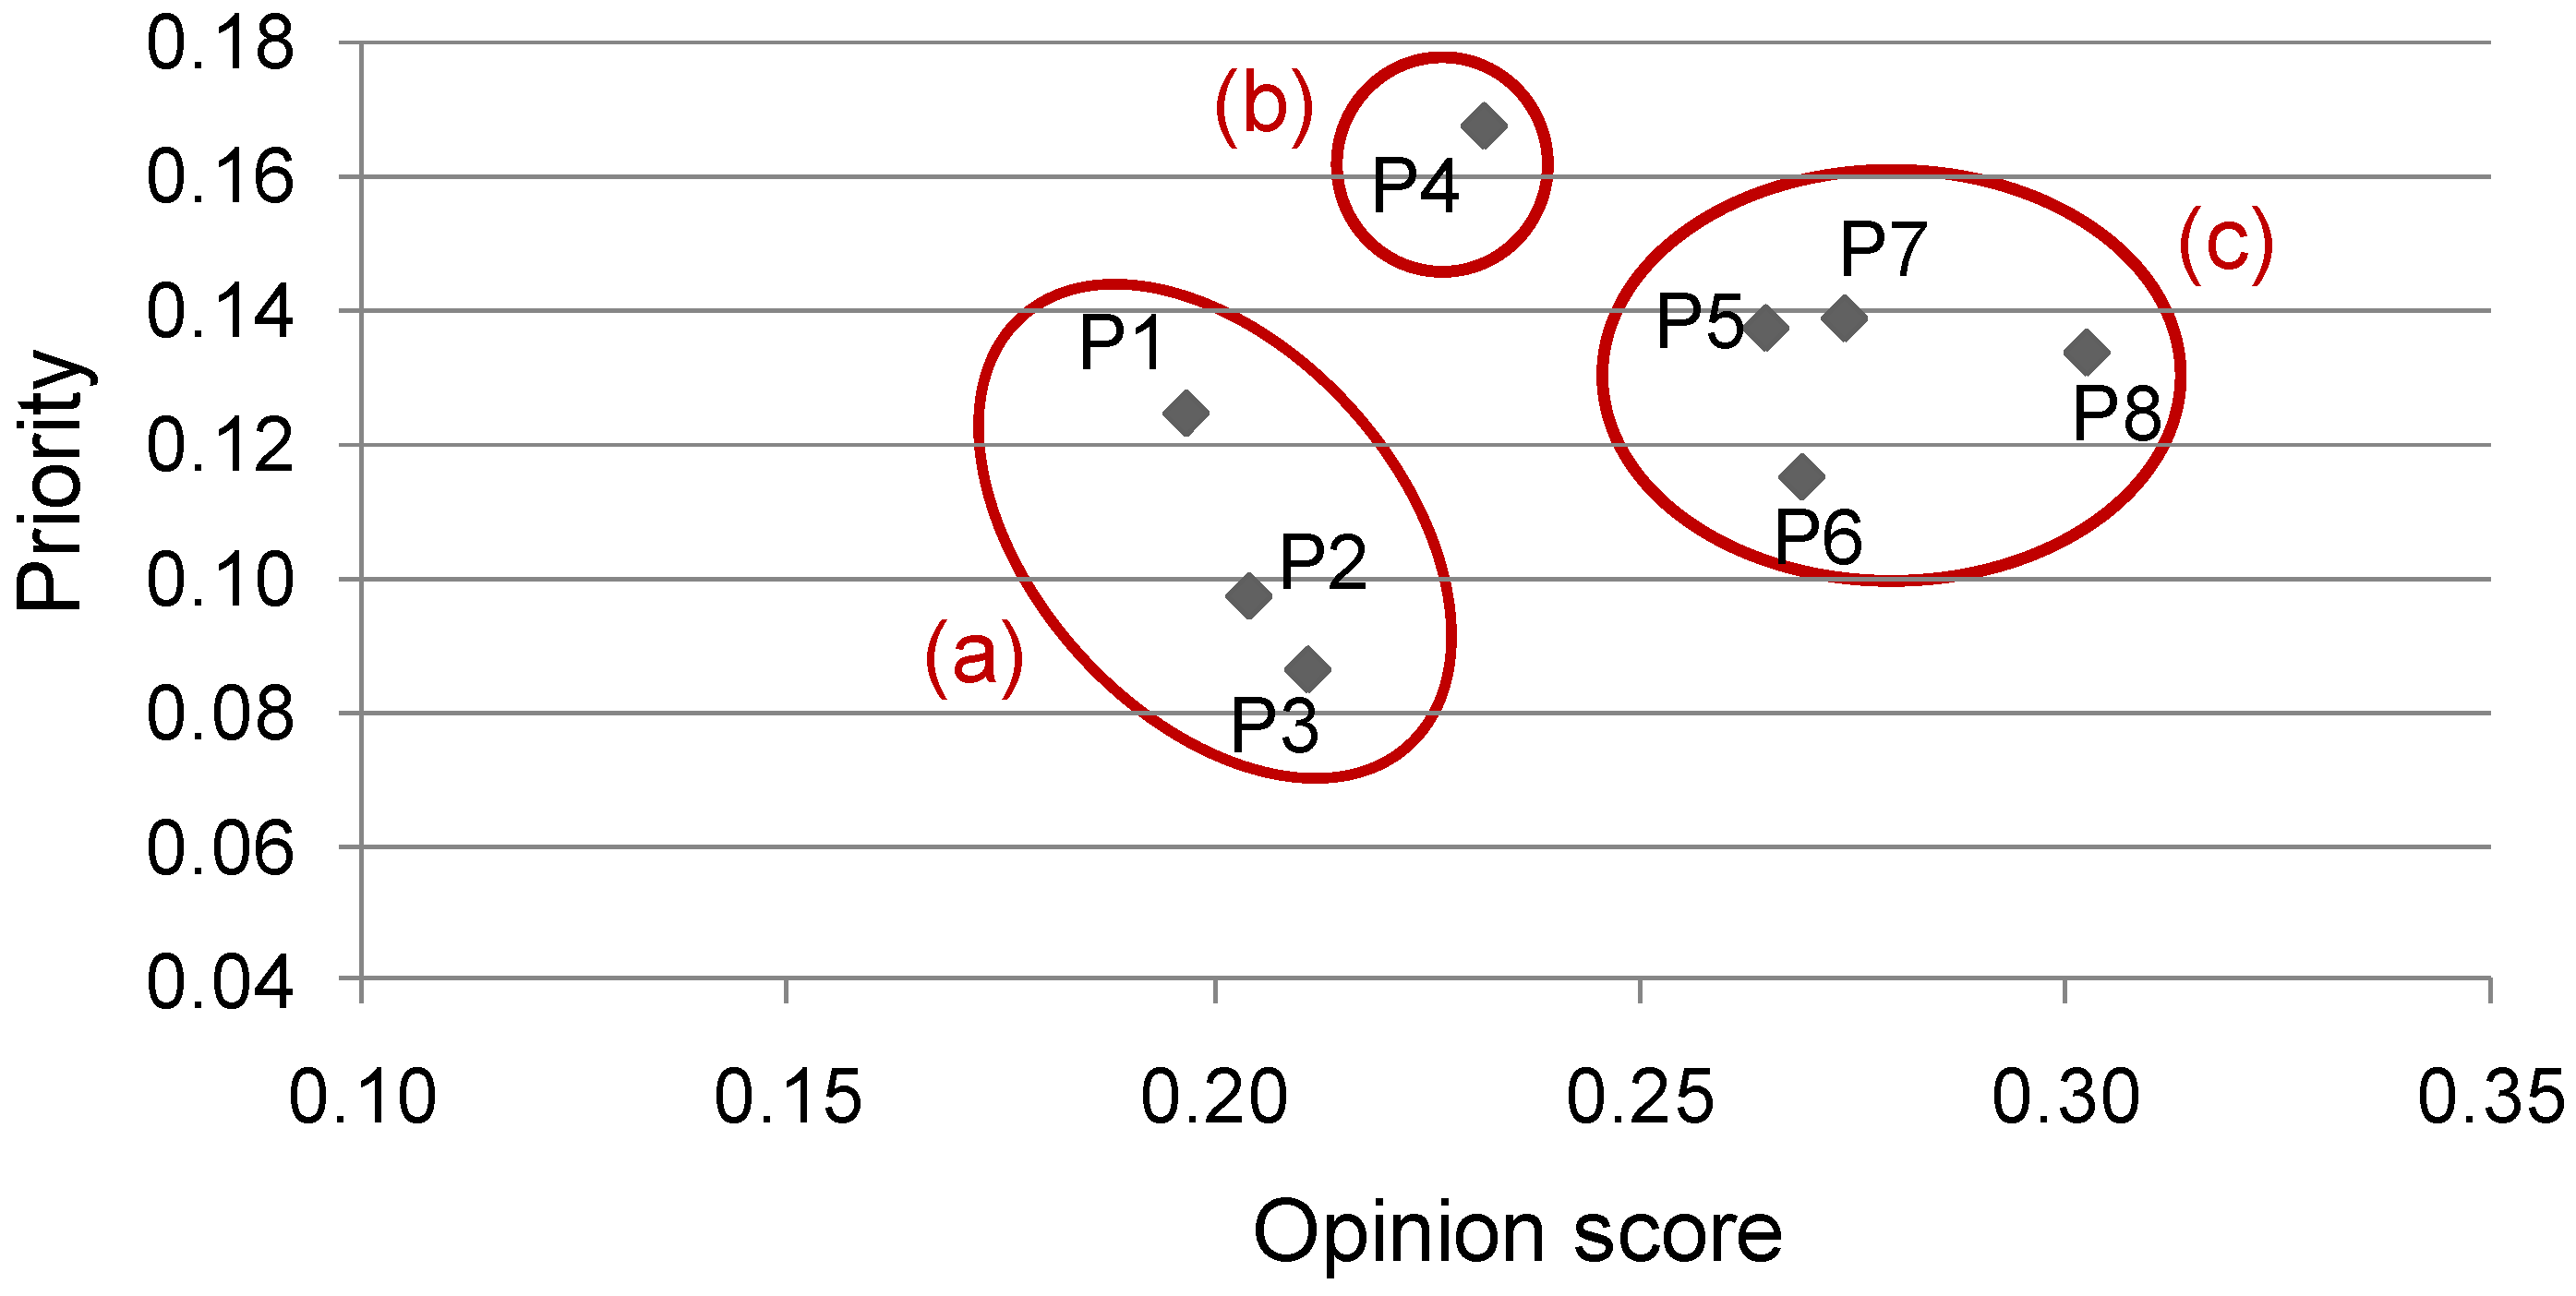
3.3. Portfolio Analysis

Finally, according to the results of quantification of the priority for each customer category and their opinion score, portfolio analysis is conducted. The distribution of the customer categories is displayed using their opinion scores as horizontal axes and priority as vertical axes.
The results of portfolio analysis enable service designers to understand the distribution of customer categories. This information is useful to determine the target requirements that should be investigated in the service, as well as achieve consensus of various customer categories by using visualized representations of their position.

4. Application

In this section, the proposed method is applied to an elevator renewal service for a condominium building where its residents correspond to customers. Since all residents use an elevator, its renewal service needs to consider their requirements and propose new elevator functions and a maintenance plan appropriate for a limited budget. In this sense, an elevator renewal service can be regarded as a kind of a public service. The condition of the condominium building is shown in Table 1.
Table 1. Information about the condominium building.
-
The building has two elevators.
-
The environment around the building is peaceful.
-
The building has a self-locking gate, but a low fence.
-
Safety is comparatively good, but a suspicious person was seen recently.
-
The residents are mostly close-knit families.
-
There are some elderly couples and single occupants.
-
The building is a 10-min walking distance from the nearest train station.
The purpose of this application is to analyze resident requirements and prioritize and quantify them. Additionally, this application shows the distribution of the residents’ requirements visually.
To begin, in this application, eight personas corresponding to resident categories were determined. Table 2 shows the demographic and psychological data pertaining to each persona. Next, requirement
Table 2. Demographic and psychological data of each persona.
Persona numberNameAge, genderFamilyCareerPersonality
P1Ichiro Tanaka75, maleWifeNo OccupationProud
P2Hideki Nakamura31, maleNoneEmployeeHot-tempered, Introvert
P3Hidetoshi Kurosawa34, maleNoneEmployeeNervous, Earnest
P4Anna Kimura75, femaleHusbandHomemakerDoes things at her own pace
P5Ai Kikuchi17, femaleBoth parentsStudentGregarious, Alarmist
P6Akira Watanabe51, maleFatherEmployeeSedate, Aggregative
P7Rinko Takahashi24, femaleBoth parents and a sisterEmployeeIntrovert, Alarmist
P8Chiaki Asada35, femaleHusband and two childrenHomemakerStrong sense of responsibility
Table 3. The extracted receiver state parameters (RSP) items and relevant personas.
RSPsPersonas
R1:Interpersonal safety (i.e., customer requirement for not permitting a suspicious individual to enter the elevator)P1, P2, P3, P4, P5, P6, P7, P8
R2:System safetyP1, P2, P3, P4, P5, P6, P7, P8
R3:Comfort in the elevatorP1, P2, P3, P4, P5, P6, P7, P8
R4:Convenience inside the elevator (i.e., customer requirement for setting the maximum load the elevator can carry)P1, P2, P3, P4, P5, P6, P7, P8
R5:Convenience outside the elevator (i.e., customer requirement for the elevator to come immediately to the desired floor when the user presses the button)P1, P2, P3, P4, P5, P6, P7, P8
R6:Elevator designP4, P5, P7
R7:Communication around the elevatorP1, P4, P5, P6
analysis [5] was conducted, and then seven types of requirements were extracted as RSPs. The extracted RSP items and relevant personas are shown in Table 3. The importance of the RSP for each persona was obtained by pair comparison, i.e., comparison of each RSP with the other six RSPs. The consistency ratio of the comparison results was calculated and checked. Table 4 shows the importance of each RSP in a given persona. The importance of the RSPs that are not owned by the persona is assumed to be 0, and these RSPs were not considered in the pair comparison. Therefore, only the RSPs owned by a given persona were used for pair comparison.
Table 4. Importance of the RSPs for each persona.
Persona numberRSP number and its importance
R1R2R3R4R5R6R7
P10.1410.0370.0680.3820.16900.203
P20.0680.0650.4240.1190.32400
P30.0490.0410.2400.1550.51500
P40.1880.3250.0350.1190.0950.1110.128
P50.2660.3910.1220.0460.0410.1040.031
P60.4580.0360.0490.1100.12700.220
P70.3530.3060.0570.0560.0660.1620
P80.3760.3070.0670.1760.07400
Next, the priority of each persona and their opinion score were calculated. In addition to the opinion scores of each persona, Table 5 shows the priorities and the degree of deviation of each score from the mean (12.5%). Table 6 compares two types of importance for each RSP. The upper row in Table 6 shows importance for each RSP calculated without the priority by using the arithmetic mean. The lower row shows importance for each RSP weighted by the priority.
Table 7 compares two values: the overall dissatisfaction (S) of personas calculated without the priority, and dissatisfaction in consideration of the priority of each persona.
Table 5. Priority of each persona and their opinion score.
Persona numberPriorityDegree of deviation from the meanOpinion score
P112.5%0.0%0.197
P29.7%–2.8%0.204
P38.6%–3.9%0.211
P416.7%+4.2%0.232
P513.7%+1.2%0.265
P611.5%–1.0%0.269
P713.9%+1.40.274
P813.4%+0.9%0.303
Table 6. Comparison between two types of importance for each RSP.
RSPs
R1R2R3R4R5R6R7
Arithmetic average0.2370.1880.1330.1450.1760.0470.073
After prioritizing0.2480.2100.1160.1430.1520.0550.076
Table 7. Comparison between two types of overall dissatisfaction.
Overall dissatisfaction without the priorityOverall dissatisfaction in consideration of the priorities
0.01280.0117
Finally, portfolio analysis was carried out. In Figure 1, the distribution of eight personas is shown along with the priority (vertical axis) and the opinion score (horizontal axis).
Figure 1. Distribution of the personas.
Axioms 03 00001 g001

5. Discussion

In this application, the residents were analyzed to extract their requirements and prioritize and quantify them. Additionally, this application shows the distribution of the residents’ requirements visually. From the data shown in Table 5, we can see that P4, P5, and P7 have high priorities (16.7%, 13.7%, and 13.9%, respectively). On the other hand, the scores for P2 and P3 are very low, 9.7% and 8.6%, respectively. Therefore, for the calculation of importance of RSPs for all the residents, the importance of RSPs for P4, P5, and P7 are given high priority, and those of P2 and P3 are given low priority in this application. This is due to the opinions of P4, P5, and P7 being closer to the group opinion than are the opinions of P2 and P3.
From Table 6, which compares the importance of RSPs calculated without the priorities with that weighted by the priorities, it is clear that the importance of all RSPs is changed. However, the rank order of the importance of the RSPs does not change. Therefore, service designers should first consider the safety of the system. As shown in Table 7, overall resident dissatisfaction obtained by considering the priorities (0.0117) is approximately 8.2% lower than that obtained without considering the priorities (0.0128). This indicates that our method can be used to more reasonably decide the importance of RSPs for all residents by prioritizing them.
With regard to the distribution of the personas shown in Figure 1, the eight personas are divided into three groups: P1–P3 (Figure 1a), P4 (Figure 1b), and P5–P8 (Figure 1c). The importance of R2 (system safety) is low in group P1–P3. On the other hand, in the P5–P8 group, the importance of R1 (interpersonal safety) is high. This indicates that our method can extract common features of the groups.
This application revealed that the result of portfolio analysis enables service designers to determine the target requirements that should be investigated in the service. This method can extract the features of an actual customer by reflecting the actual customer requirements. Furthermore, by showing the customer distribution and grading scores to the customers, differences between the requirements of various customers can be eliminated. In other words, this method can be used to obtain a consensus among the customers and to decrease customer dissatisfaction.

6. Conclusions

In this paper, we proposed a customer requirements summarizing method that focuses on minimizing the dissatisfaction between customers belonging to various categories. The application results indicated the rationality of this method.

Acknowledgments

We express our appreciation to Satoshi Yamamoto, who collaborated in this study. In addition, we obtained important information on actual services through a discussion at the Service Engineering Forum [11].

Conflicts of Interest

The authors declare no conflict of interest.

References

  1. Tomiyama, T. A manufacturing paradigm toward the 21st century. Integr. Comput. Aid. Eng. 1997, 4, 159–178. [Google Scholar]
  2. Vargo, S.L.; Lusch, R.F. Evolving to a new dominant logic for marketing. J. Market. 2004, 68, 1–17. [Google Scholar] [CrossRef]
  3. Meier, H.; Roy, R.; Seliger, G. Industrial product-service-systems–IPS2 providing. Ann. CIRP 2010, 59, 607–627. [Google Scholar] [CrossRef]
  4. Janthong, N.; Brissaud, D.; Butdee, S. Knowledge-Based Adaptable Design to Support Customer-oriented Production System of Industrial Equipments. In Proceedings of the 42nd CIRP Conference on Manufacturing Systems, Grenoble, France, 3rd-5th June 2009. CD-ROM.
  5. Shimomura, Y.; Hara, T.; Arai, T. A service evaluation method using mathematical methodologies. Ann. CIRP 2008, 57, 437–440. [Google Scholar] [CrossRef]
  6. Peña, S.; Córdova, G. Public participation and water supply: The case of two communities on the USA-Mexico border. Water Int. 2001, 26, 390–399. [Google Scholar] [CrossRef]
  7. Ravi, K.; Jukka, P.; Matti, T. Non-welfarist optimal taxation and behavioral public economics. J. Econ. Surv. 2006, 20, 849–868. [Google Scholar]
  8. Kinoshita, E.; Nakanishi, M. Proposal of new AHP model in light of dominant relationship among alternatives. J. Oper. Res. Soc. Jpn. 1999, 42, 180–197. [Google Scholar] [CrossRef]
  9. Cooper, A. The Inmates Are Running the Asylum: Why High. Tech. Products Drive Us Crazy and How to Restore the Sanity; Sams: Indianapolis, United States, 1999. [Google Scholar]
  10. Hayashi, C. On the prediction of phenomena from qualitative data and the quantification of qualitative data from the mathematico-statistical point of view. Ann. Inst. Stat. Math. 1951, 3, 69–98. [Google Scholar] [CrossRef]
  11. Service Engineering Forum. Available online: http://www.service-eng.org/index-e.html (accessed on 8 September 2013).

