An Ensemble-Boosting Algorithm for Classifying Partial Discharge Defects in Electrical Assets
by
 , , and
Abdullahi Abubakar Mas’ud
1,* ,
,
Jorge Alfredo Ardila-Rey
2 ,
,
Ricardo Albarracín
3 and
Firdaus Muhammad-Sukki
4
1
Department of Electrical and Electronics Engineering, Jubail Industrial College, P.O. Box 10099, Jubail Industrial City 31261, Saudi Arabia
2
Department of Electrical Engineering, Universidad Técnica Federico Santa María, Santiago 8940000, Chile
3
Departamento de Ingeniería Eléctrica, Electrónica, Automática y Física Aplicada, Escuela Técnica Superior de Ingeniería y Diseño Industrial, Universidad Politécnica de Madrid, Ronda de Valencia 3, Madrid 28012, Spain
4
School of Engineering, Robert Gordon University, Aberdeen AB10 7GJ, Scotland, UK
*
Author to whom correspondence should be addressed.
Machines 2017, 5(3), 18; https://doi.org/10.3390/machines5030018
Submission received: 18 July 2017
/
Revised: 3 August 2017
/
Accepted: 4 August 2017
/
Published: 8 August 2017
(This article belongs to the Special Issue Machinery Condition Monitoring and Industrial Analytics)
Abstract
:This paper presents an ensemble-boosting algorithm (EBA) for classifying partial discharge (PD) patterns in the condition monitoring of insulation diagnosis applied for electrical assets. This approach presents an optimization technique for creating a sequence of artificial neural network (ANNs), where the training data for each constituent of the sequence is selected based on the performance of previous ANNs. Four different PD faults scenarios were manufactured in the high-voltage (HV) laboratory to simulate the PD faults of cylindrical voids in methacrylate, point-air-plane configuration, ceramic bushing with contaminated surface and a transformer affected by the internal PD. A PD dataset was collected, pre-processed and prepared for its use in the improved boosting algorithm using statistical techniques. In this paper, the EBA is extensively compared with the widely used single artificial neural network (SNN). Results show that the proposed approach can effectively improve the generalization capability of the PD patterns. The application of the proposed technique for both online and offline practical PD recognition is examined.
1. Introduction
High-voltage (HV) equipment maintenance is an important aspect of the power industry. As a result, the reliability and continuity of service of this equipment are of utmost importance to the industry. To prevent damage to equipment and ensure minimal shutdowns, it is important to establish and follow appropriate criteria for insulation selection [1] and then test and monitor HV apparatuses and analyze them to prevent potential faults. Some of the effects that can lead to premature aging of the HV insulation systems (i.e., polymers) used in electrical machines (such as motors or transformers) are electrical stress, thermal stress, environmental stress and mechanical stress [2]. Most of these negative effects can provoke serious degradation of the insulation of the equipment and, as a result, an effective condition-monitoring (CM), condition-based maintenance (CBM) and preventive maintenance actions are required [3,4]. One well-known CM technique is partial discharge (PD) testing. PD refers to electrical discharges commonly happening in the HV apparatus whose continuous activity can cause a total breakdown of the electrical insulation system of the machinery/asset. Thus, it is essential to detect PD faults at an early stage before it can lead to disastrous and expensive failures of electrical apparatus.
It is known that PDs are ionization effects that can be classified as three main classes of sources, namely, internal, surface, and corona [5,6]. Internal PD can occurs in voids filled with gas or liquid. These sources are the most dangerous ones for the insulation systems and CM of electrical machines based on PD measurements. For the most part, the goal is to try to identify this kind of source and its evolution over time, that is, in solid insulation systems [3,4,5,6,7], both for rotating machines such as motors [8,9] and transformers [10]. Surface PD occurs between two dielectrics, commonly between the air and the insulation system, that is, due to pollution or moisture in insulators of transformers [11]. Therefore, it is of utmost importance to detect this type of source to allow the correct operation of power transformers. Corona discharges occur in gases or liquids subjected to highly divergent electric fields near sharp metallic points [5].
PDs are commonly represented superimposed with an AC cycle of the voltage reference. This representation is known as a phase-resolved PD (PRPD) pattern due to the fact that each kind of PD source follows a typical form. In this way, internal PD has a cluster spanning from zero crossings, 0° or 180°, of the AC signal whose pulses have different peak amplitudes. In a surface PD, the PRPD pattern accumulates around the maximum and minimum of the AC voltage; signals also have different peak amplitudes depending on the semi-cycle. Finally, corona PDs commonly have PDs around 90° and 270°, with all the pulses having similar peak amplitudes.
The first step in PD CM is capturing the PD data as either PRPD 2D or phase-amplitude number (phi-q-n) 3D patterns. Based on the literature, the phi-q-n was the most widely used [12,13]. They are pre-processed and converted to 2D-derived in order to extract certain statistical features that can be applied as input to any pattern recognition tool. However, the PRPD represented as 2D plots have not been well investigated as the input for PD pattern recognition by artificial intelligence techniques such as artificial neural networks (ANN) [14,15]. It is the aim of this paper to extract suitable PD fingerprints from the PRPD without having to carry out any statistical feature extraction.
This manuscript investigates the robustness of the ensemble-boosting algorithm (EBA) in recognizing different PD fault sources within different HV insulation systems. The results are then compared with the widely applied single neural network (SNN). Several pattern recognition techniques have been applied for PD classification [16,17,18], and among them the SNN has been the most successful. EBA has been considered in this paper because research shows that it has high-recognition capability when applied to datasets of other disciplines [19,20]. PD faults sources identification was firstly tested in the laboratory with two test objects; in cylindrical vacuoles in methacrylate and with a point-plane arrangement in air. Moreover, two additional PD sources, which can take place in typical electrical elements in an industrial environment, such as a ceramic bushing with a contaminated surface and internal defects in a power transformer, have been analyzed to study the robustness of the EBA.
This paper is organized as follows: Section 1 is the introduction; Section 2 describes the experimental setup; Section 3 provides the description of the EBA algorithm; Section 4 explains the SNN algorithm; Section 5 clarifies the PD input parameters for the EBA algorithm; Section 6 presents the strategies for training the EBA; Section 7 presents the results and discussions, while; Section 8 is the conclusions.
2. Experimental Setup
In order to generate a stable activity of PD that correctly evaluates the aging of each of the test objects used in this paper, a classical indirect detection circuit has been implemented together with a pre-programmed acquisition system. The aforementioned circuit and acquisition system are configured to acquire each PD pulse without the presence of external sources or disturbances associated with electrical noise. According to the requirements of the IEC 60270 standard [21], the measuring circuit used must consist of a HV variable source up to 100 kV and a capacitive voltage divider, which acts as a low impedance path for high-frequency currents from the PD pulses (see Figure 1). For this circuit, the synchronization with the grid frequency was done through an impedance Zm. This setup enables two things: (1) obtaining the reference signal, and; (2) plotting each one of the PD sources in conventional PRPD patterns to be used later for the evaluation of the state of the insulation.
The PD signals were captured by using a high-frequency current transformer (HFCT) with a bandwidth of up to 80 MHz, which was coupled to the branch of the voltage divider just after the Zm. These transients were stored and processed by an acquisition system formed by a NI-PXIe-1082 chassis, a NI-PXI-5124 acquisition board with a sampling frequency of 200 MS/s, and a NI-PXIe-8115 controller. For all test objects, PD were acquired by establishing a voltage level where PD activity was stable. Additionally, the trigger level of the acquisition system was placed above the laboratory background noise, in order to obtain only associated signals with PD from each test object.
The measurement procedure started once the PD activity was held stable at a certain voltage level depending on the type of test object being investigated. Then, by maintaining the initial voltage level for 7 h, the PD activity was recorded every 20 min. In each measurement, the number of pulses captured was 2000. This was carried out to obtain a statistically significant sample and a clear PRPD in terms of the number of pulses. In total, for each test object, 20 measurements composed by 2000 PD signals were performed. This indicates that the total number of PD pulses stored and processed in each test object was 40,000.
In each result obtained experimentally, four test objects were used to create different types of PDs:
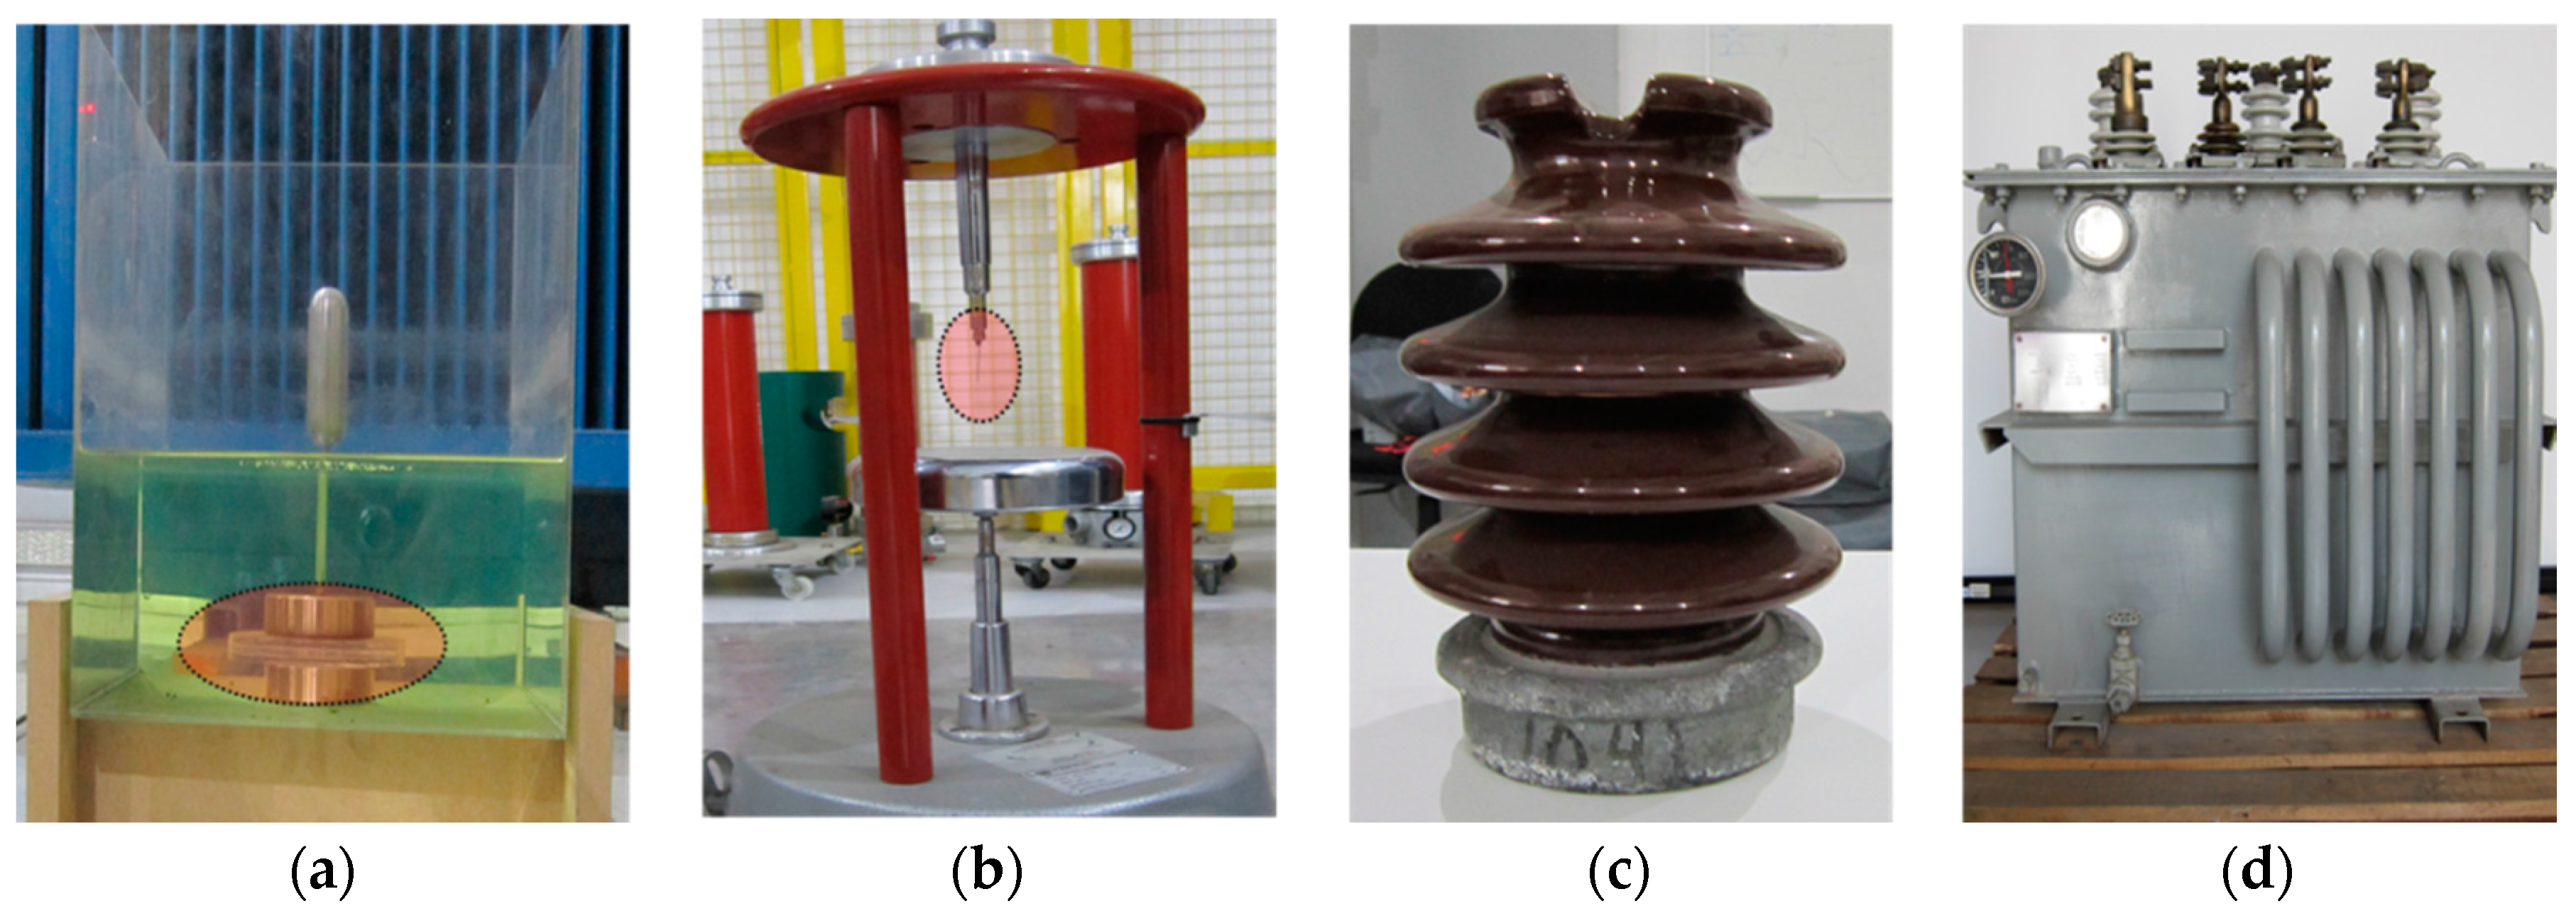
- Cylindrical vacuoles in methacrylate: For the generation of internal PD, three pieces of methacrylate with two perforations in the centerpiece (to obtain two artificial cylindrical vacuoles of 3 mm of height in each one) were used, as illustrated in Figure 2a. The test object was placed between two electrodes that will be subjected to HV before being immersed in mineral oil to avoid surface discharges.
- Point-air-plane configuration: To obtain a stable corona PD activity, a thin metal tip (connected to the HV source) was placed at 3 cm above a metallic ground, as presented in Figure 2b. To avoid undesired arcing the supporting frame is made with insulating material.
In order to use the technique proposed in electrical assets resemble closely to a typical real environment, the next two specimens were used, and they are described as follows:
- Ceramic bushing with contaminated surface: This test object is a ceramic bushing contaminated with saline solution to favor the ionization paths for surface discharges, see Figure 2c. HV was placed at its ends through two electrodes.
- Transformer affected by internal PD: A power transformer, 150 kVA, 12 kV/400 V, using oil-paper as an insulating system, was tested, as indicated in Figure 2d. The rated voltage was applied between the primary winding and ground (with the secondary grounded).
3. Description of EBA
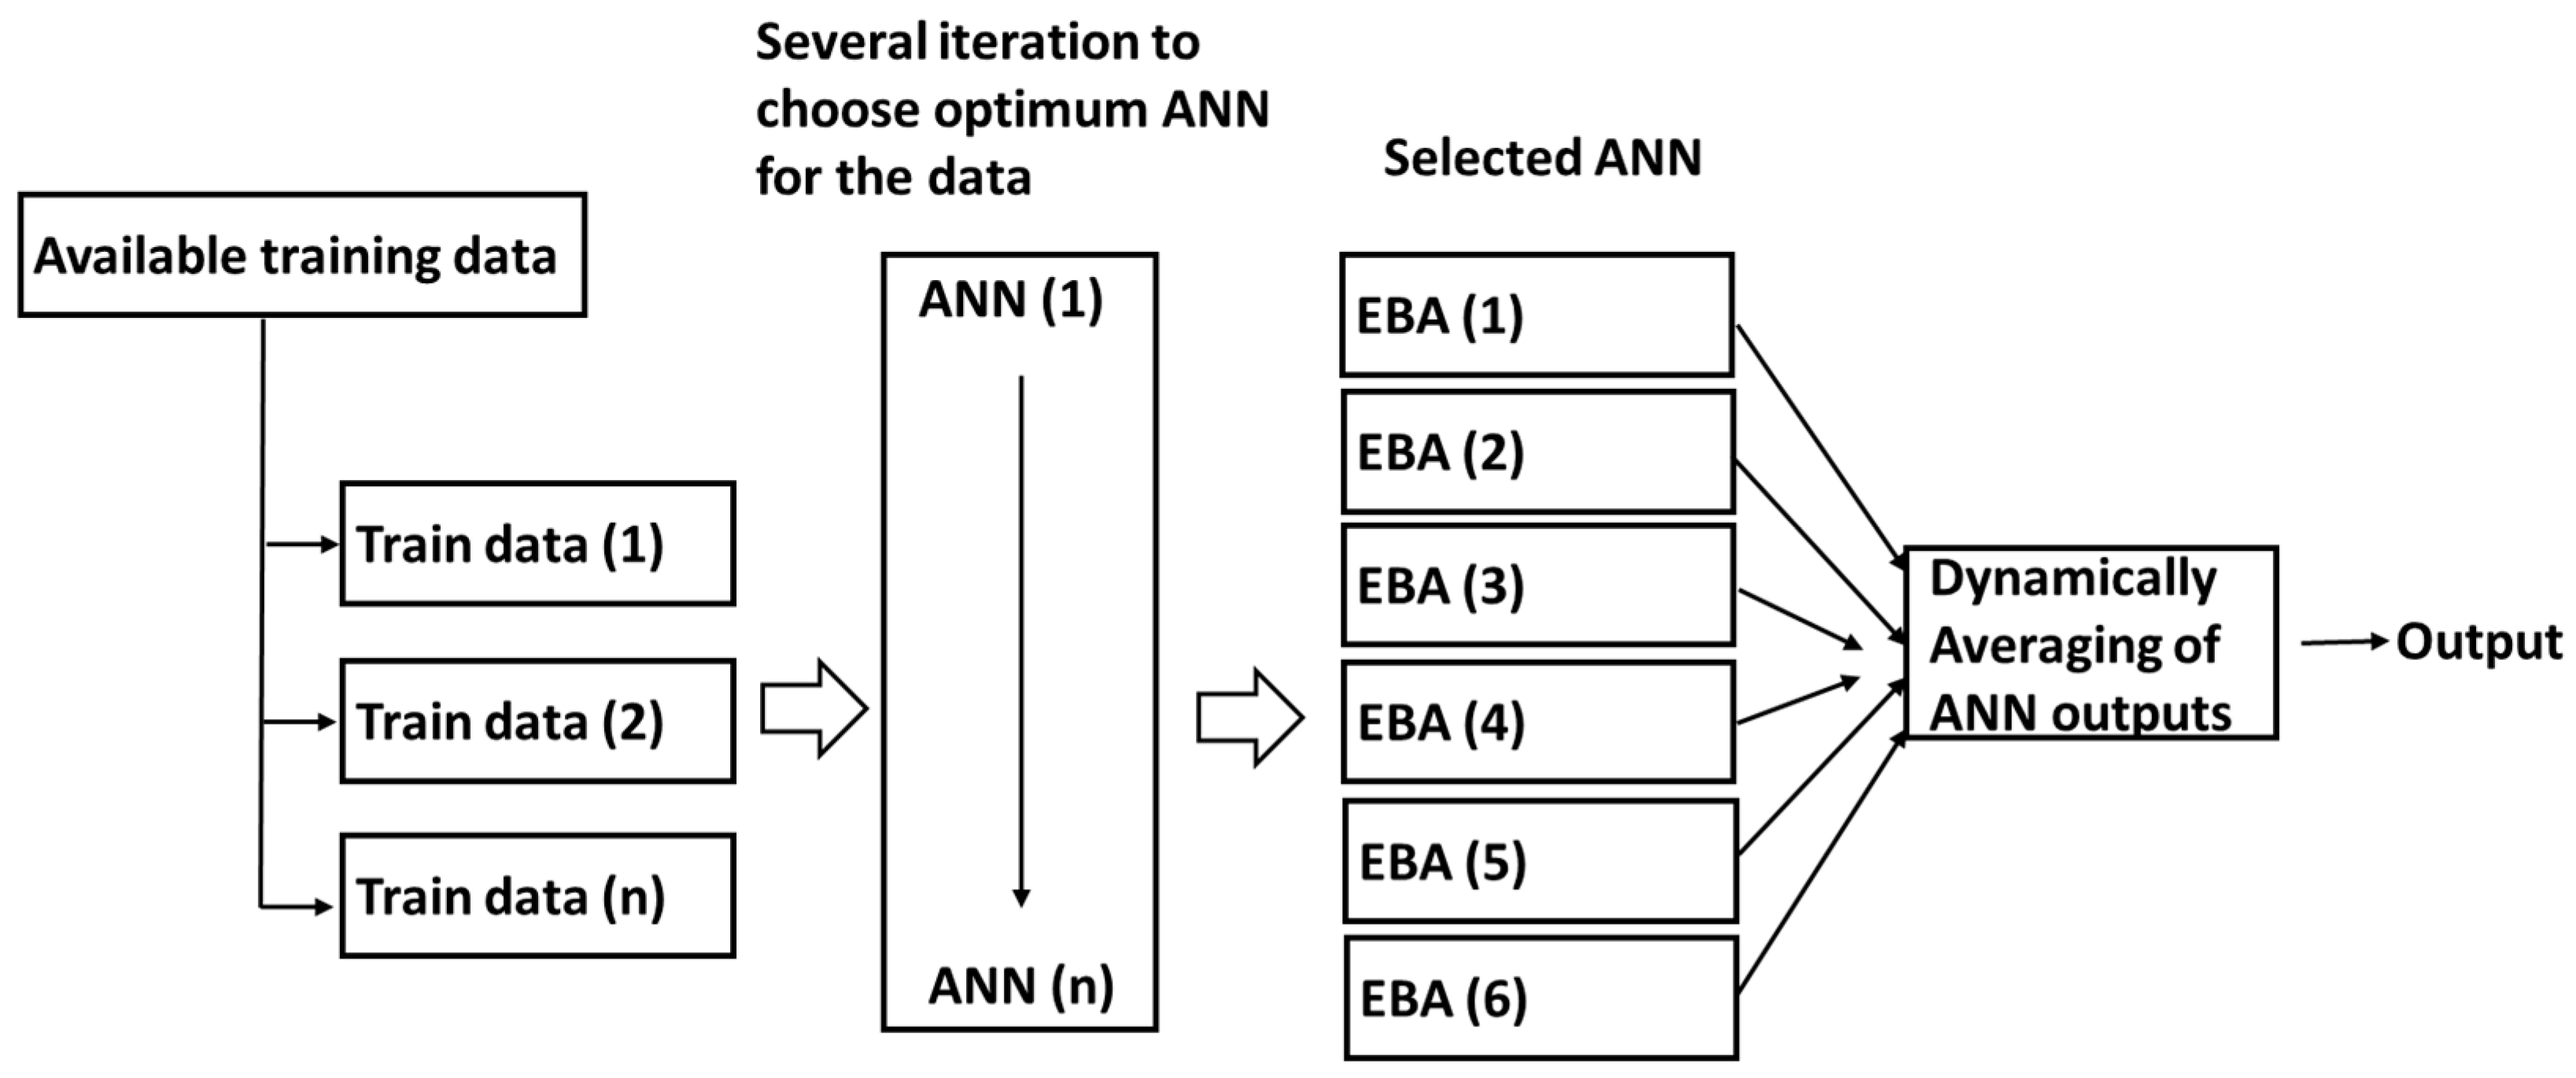
Boosting involves the creation of a sequence of ANNs, where the training data for each constituent of the sequence is selected based on the performance of the previous ANNs. Boosting works in such a way that the testing data wrongly predicted by preceding ANNs have higher selection probability than the testing data that was accurately predicted. In essence, boosting always tries new ANN members for the ensemble that are more capable of predicting the testing set that current ensembles cannot predict well. The two fundamental forms of boosting that exist in practice are arcing and AdaBoost [22]. The arcing technique is analogous to bagging, where training fingerprints of size m are selected for a number of ANNs by randomly chosen (with replacement) training vectors from original m input examples. Unlike bagging, the likelihood of choosing an example is not the same across the training examples. This probability depends on how regular that example was misclassified by previous ANNs forming the ensembles. The arcing technique initially sets the probability of selecting the training examples to (1/M), where M is the size of the training samples. The arcing technique applies a simple mechanism to obtain probability of including examples in the training fingerprints. For any i-th example in the training data, assuming a value ni represents a period where that instance was misclassified by previous ANNs, then the probability Pj for choosing an example j to be among the next ANN training fingerprints is determined as follows:
Breiman [22] determines the value of the power “4” numerically after trial and error with different parameters. AdaBoost is another ensemble technique that applies any of the following procedures of choosing training fingerprints for the ensemble [23]:
- (a)
- Choosing the training example based on the probability of each example.
- (b)
- Using all of the examples and weighting the error of each training example by its probability (i.e., instances having higher probability demonstrate more effect on the error).
AdaBoost has the advantage that each training example forms at least part of the training fingerprints. Similar to arcing, the AdaBoost technique also initially sets the probability of selecting training example to 1/M, where M is the size of the training samples. It is assumed that εr represents the sum of probabilities of misclassified examples for the presently trained ANN classifier Cr. Then for subsequent ANNs, these probabilities are generated by multiplying the probability of Cr wrongly misclassified examples by a factor βr = (1 − εr)/εr, and all probabilities are then normalized to sum up to 1. The AdaBoost aggregates all ANN predictions using a weighted voting criterion, where Cr weights the term log (βr). These weights make AdaBoost disregard outputs of ANNs that appear inaccurate compared to other predictions. In this work, the arcing technique will be applied because of its wide application.
4. The Single Neural Network (SNN)
Over the years, the SNN have been extensively being applied for recognizing PD patterns with great success [9,12,14]. ANNs are artificial intelligence models that imitate the way humans categorize patterns [24]. The arrangement of the ANN comprises the input layer, the hidden layer and the output layer. The size of the output layer is related to the classes to be classified. In each layer of the ANN, there are one or more neurons, which calculate the sum of the incoming signals and move it to a non-linear squashing function, for example, a sigmoid function to produce an output of the signal. These neurons in the ANN are related to each other by synapses commonly known as weights. A learning process of the ANN is shown in Figure 3 below.
In most of the ANNs, the training begins by randomly chosen weights normally within −0.1 to 0.1. These weights are continuously adjusted based on the distinction between the target value and the output value according to a certain algorithm. The back-propagation (BP) algorithm is the widely used algorithm for the ANN and has been very successful in recognizing PD patterns [12,14]. The BP algorithm is a kind of supervised learning, comprising the forward and backward learning [14,24]. In the BP algorithm, the input and output pattern data are continuously fed to the ANN and at each instant the error is backpropagated and the weights are updated until certain minimum error is accomplished.
5. PD Input Fingerprints for the EBA and the SNN
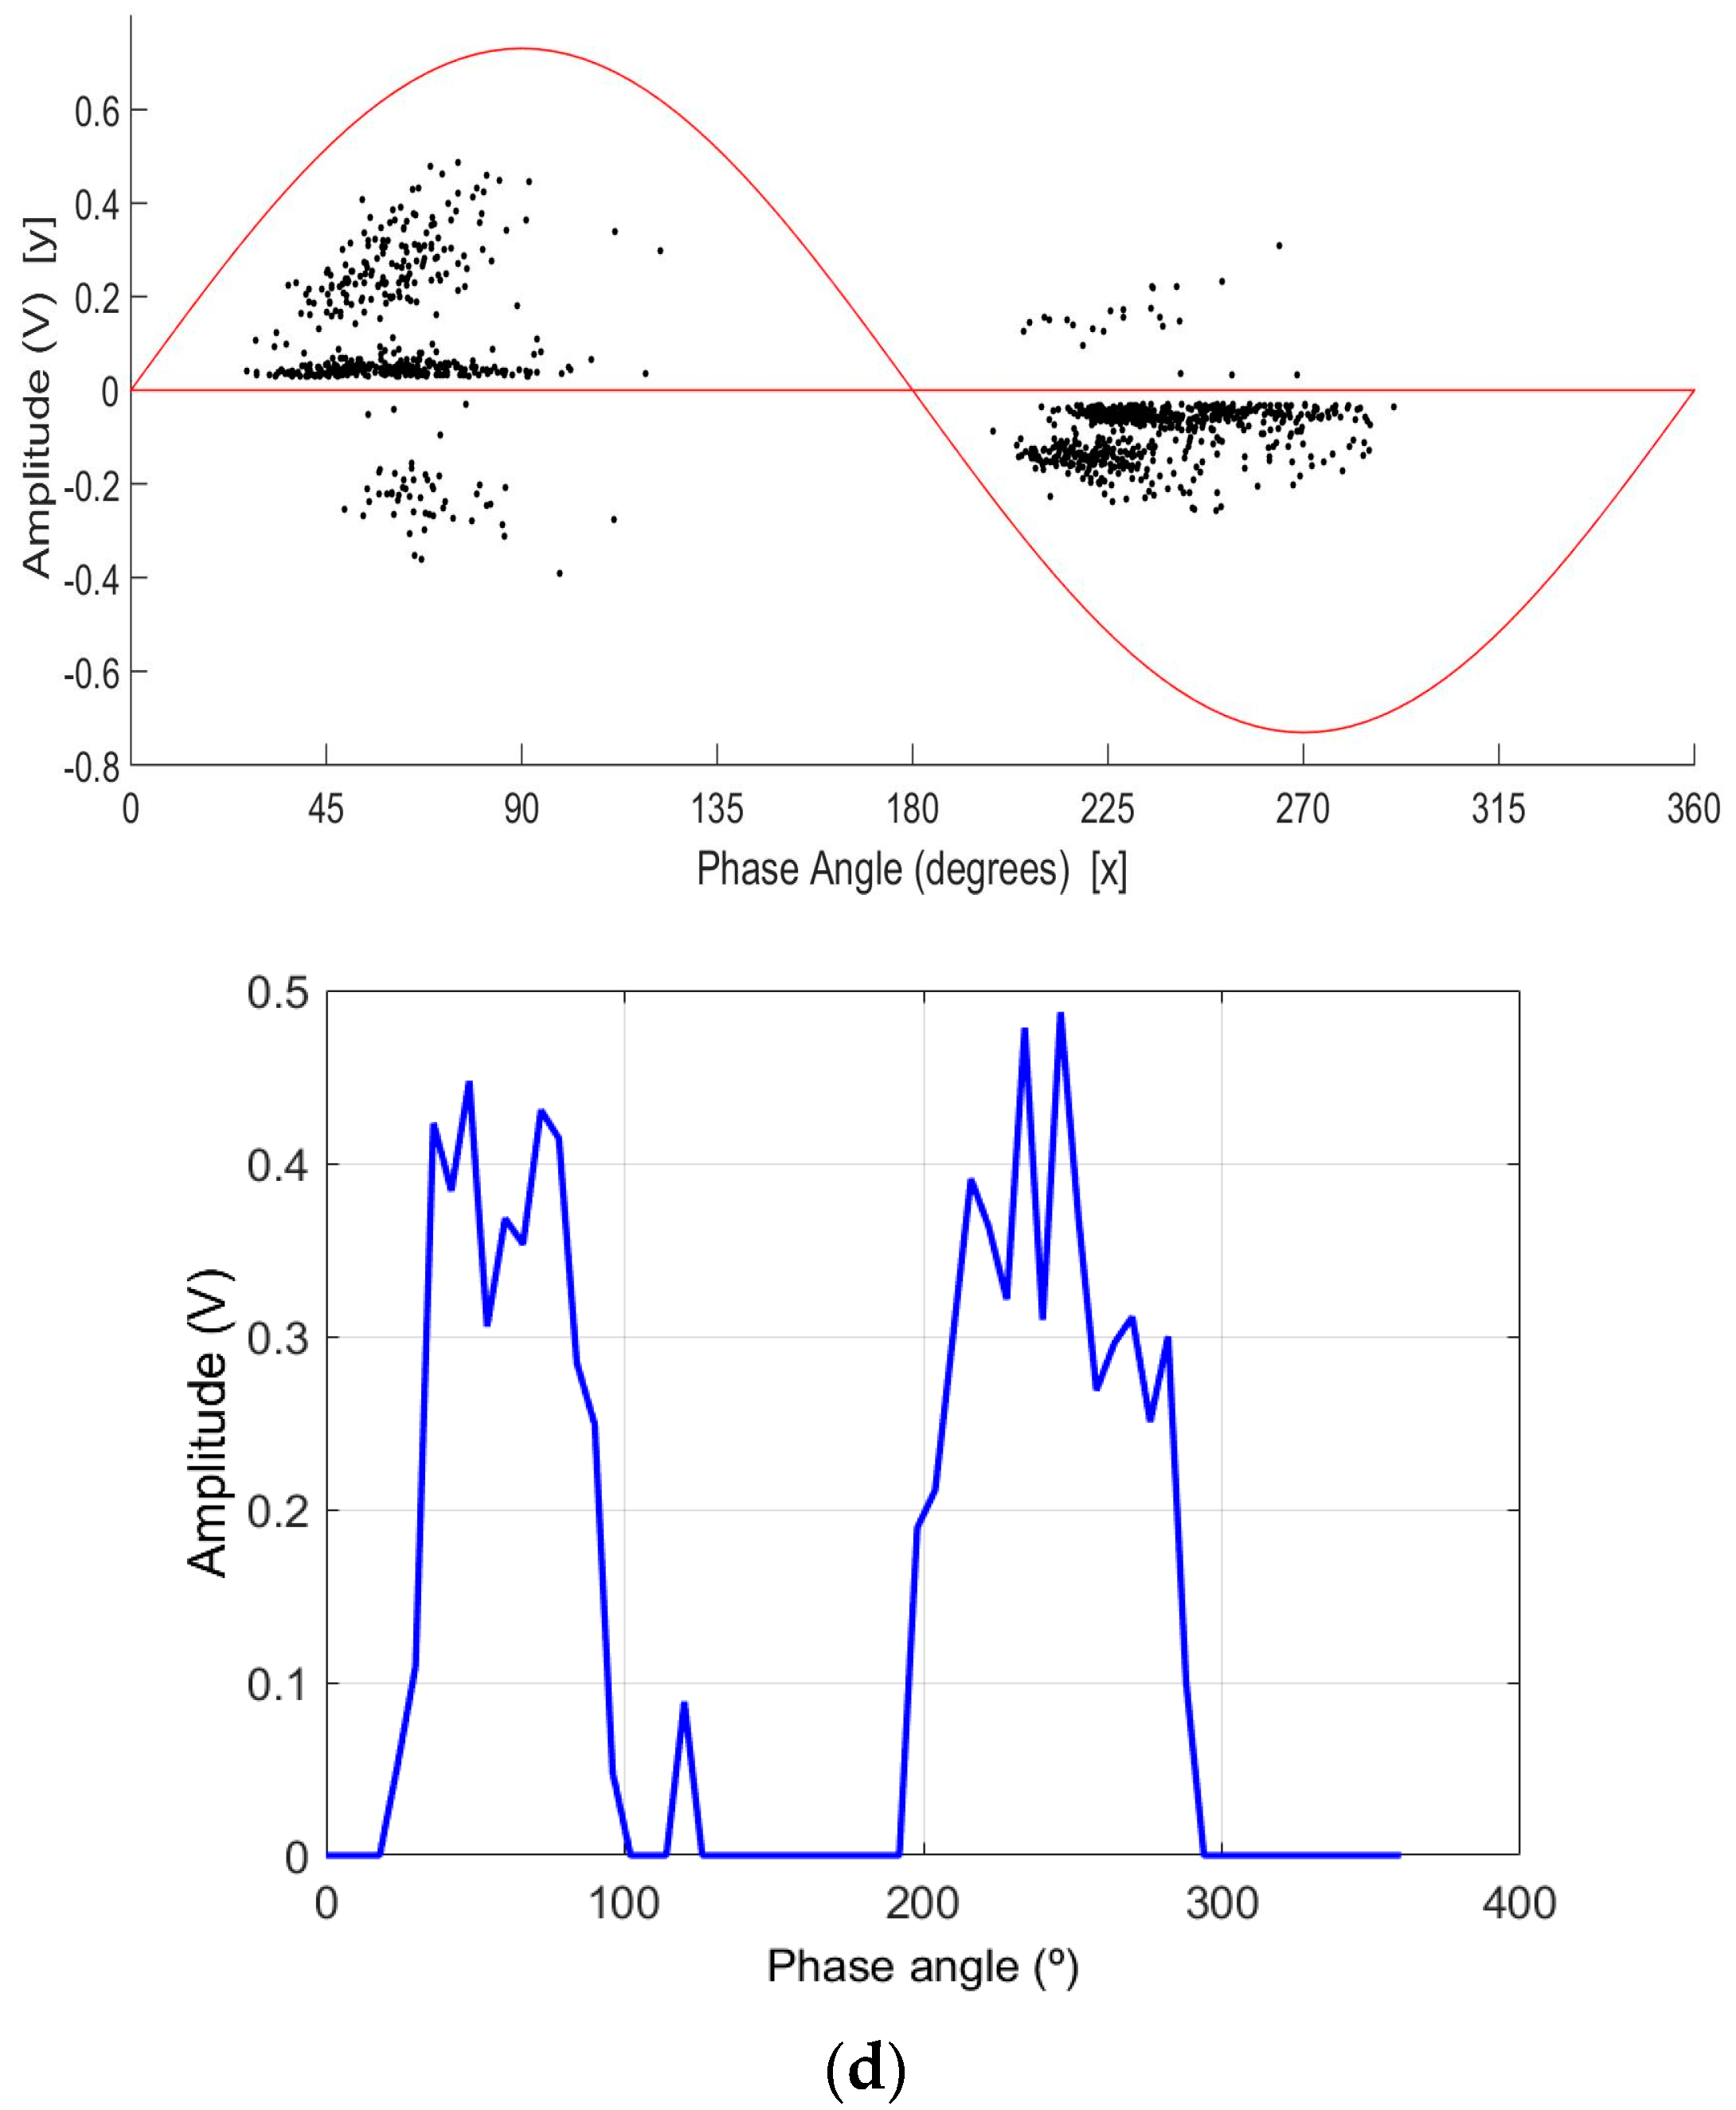
Initially, the PD data is captured as PRPD patterns showing the PD magnitude (in V) and the corresponding phase angle. The PRPD plot is cumulatively acquired by continuously capturing data over a number of power cycles. This comprises the PD amplitude (in V) at different phase angles of the half power cycle. Based on this, the PRPD is then processed into a different plot showing the maximum amplitude versus phase angle that will serve as the input for training and testing the developed EBA.
A tremendous amount of simulation time is required for the EBA to learn the original PRPD patterns of the four PD defects. However, in order to reduce this time, the PRPD data is further reduced. Initially, the PRPD is captured as a vector of amplitude and phase angle each of size (2594 × 1). The vector of phase angle is further rearranged in ascending order from 0° to 360°, and then the amplitude vector is properly matched. To reduce the PRPD, the phase vectors are grouped into 6° resolution each, and in each resolution the maximum amplitude is taken as the data. Therefore, each PRPD pattern is now represented as a (1 × 60) vector. Figure 4 shows the PRPD patterns and their corresponding reduced patterns of amplitude versus phase angle for application to the ANN and the EBA. The PRPD patterns of vacuoles in methacrylate (Figure 4a), shows that the discharges are centered around 20°~120° in the positive half power cycle, and 180°~320° in the negative power half cycle with the uncalibrated PD amplitude of 0.6 V. It can be observed that the PD patterns are wider in phase and amplitude because of the large surface area and volume for the discharges to occur and, consequently, leads to larger deposition of conducting particles within the vacuole surface. Figure 4b shows the corona discharge pattern from a point-plane arrangement. There is practically a smaller number of discharges in the positive half power cycle and a large number of discharges in the negative half power cycle concentrating within 15 mV amplitude. The small number of discharges in the positive half power cycle are indication of positive onset streamers [25]. These positive streamers represent current pulses of short duration, low repetition rate and high amplitude created due to huge number of ionic development during the streamer development around the anode. The large number of discharges around the negative half power cycle are indication of Trichel pulses, which are negative discharges of small amplitude and short duration succeeding each other [25]. Figure 4c are PD faults of a ceramic bushing with a contaminated surface, where the discharges are found to be centered around 20°~140° in the positive half power cycle, and 200°~300° in the negative half power cycle. This is indication of surface discharges due to ionization paths created on the ceramic bushing. This kind of PD can deteriorate the insulation through trapped gases and possibly the formation of chemicals [13]. Figure 4d are surface PD in power transformer insulation where the discharge distribution is similar to that of a contaminated bushing in Figure 4c. These types of discharges are triggered by high electric field stress along paper-oil transformer insulation and in the long term can lead to tracking damage.
6. Strategies for Training and Testing the SNN and EBA
The training and testing parameters for the SNN and EBA consist of PRPD raw data in both the positive and negative half power cycle of cylindrical vacuoles, point-air-plane configuration, ceramic bushings and power transformers. Their reduced PRPD are applied as input into the SNN and EBA. In the development of the SNN and EBA for PD recognition, certain procedures were considered to obtain optimum results. The procedures are as follow:
- Use the PRPD data as inputs for training and testing both the SNN and EBA.
- An EBA consisting of six SNNs were constructed. Each of the SNN is a multilayer perceptron networks (MLPNs). MLPNs are chosen because of its performance and overall success rate over the ANN models [24]. A number of MLPNs were selected for this investigation in order to have a practical size of diverse models to improve the generalization capability of the EBA. In determining the input fingerprints for the EBA, the training fingerprints are selected for a number of ANNs by randomly chosen (with replacement) certain training vectors from original input examples. For every training session of the EBA with certain PD defects, six EBA members that best predict the PD fingerprints are chosen after up to 10 iterations, as shown in Figure 5. The output of the EBA is obtained by dynamically weighting of the ensemble members’ output [26]. In deciding the EBA, the hidden layer and the learning rate are continuously varied, though the momentum rate remains the same. The aim of the momentum rate is to hasten the training session and offering strong resistance to irregular weight changes. The learning rate is normally chosen to be between 0 and 1. After trial and error with several layers, 10 hidden layers are decided to be the optimal ones. In this investigation, the learning rate of 0.05 is chosen while momentum rate of 0.6 is adopted as the momentum rate for all instances. No validation samples were applied in this work due limited data samples. For each training session of the neural network, training is said to be completed when the mean square error target of 10−3 is reached.
- The backpropagation is applied to train each of the ANN member in the ensemble. The BP algorithm is a kind of supervised learning [25].
- In this work the “newff” function in the Matlab toolbox was used for training the SNN and EBA. “Tansig” is used as the hidden layer function for the neural network while the “logsig” is applied as the output layer function. The training algorithm of the neural network is “traingdm”.
- The time needed for the SNN and EBA to learn the PRPD patterns must be short enough.
- Since the ANN is sensitive to different initial weights and biases, results must be obtained over a number of iterations.
- In a comparison of the SNN and EBA, the same network parameters are chosen for both cases.
The training and testing strategies for the both the SNN and EBA are as follows. Firstly, training both the SNN and EBA with any of the four PD defects (cylindrical vacuoles, point-air-plane configuration, ceramic bushings and power transformers) and testing is carried out with the same PD defects. This is important in order to understand and compare the capabilities of the SNN and EBA in recognizing certain PD defects from PRPD raw data. The training fingerprints comprise (20 × 60) raw PRPD data of a certain defect. For each PD defect, the testing fingerprints comprises eight rows of matrix of each defect, that is, (8 × 60) are chosen.
7. Results and Discussion
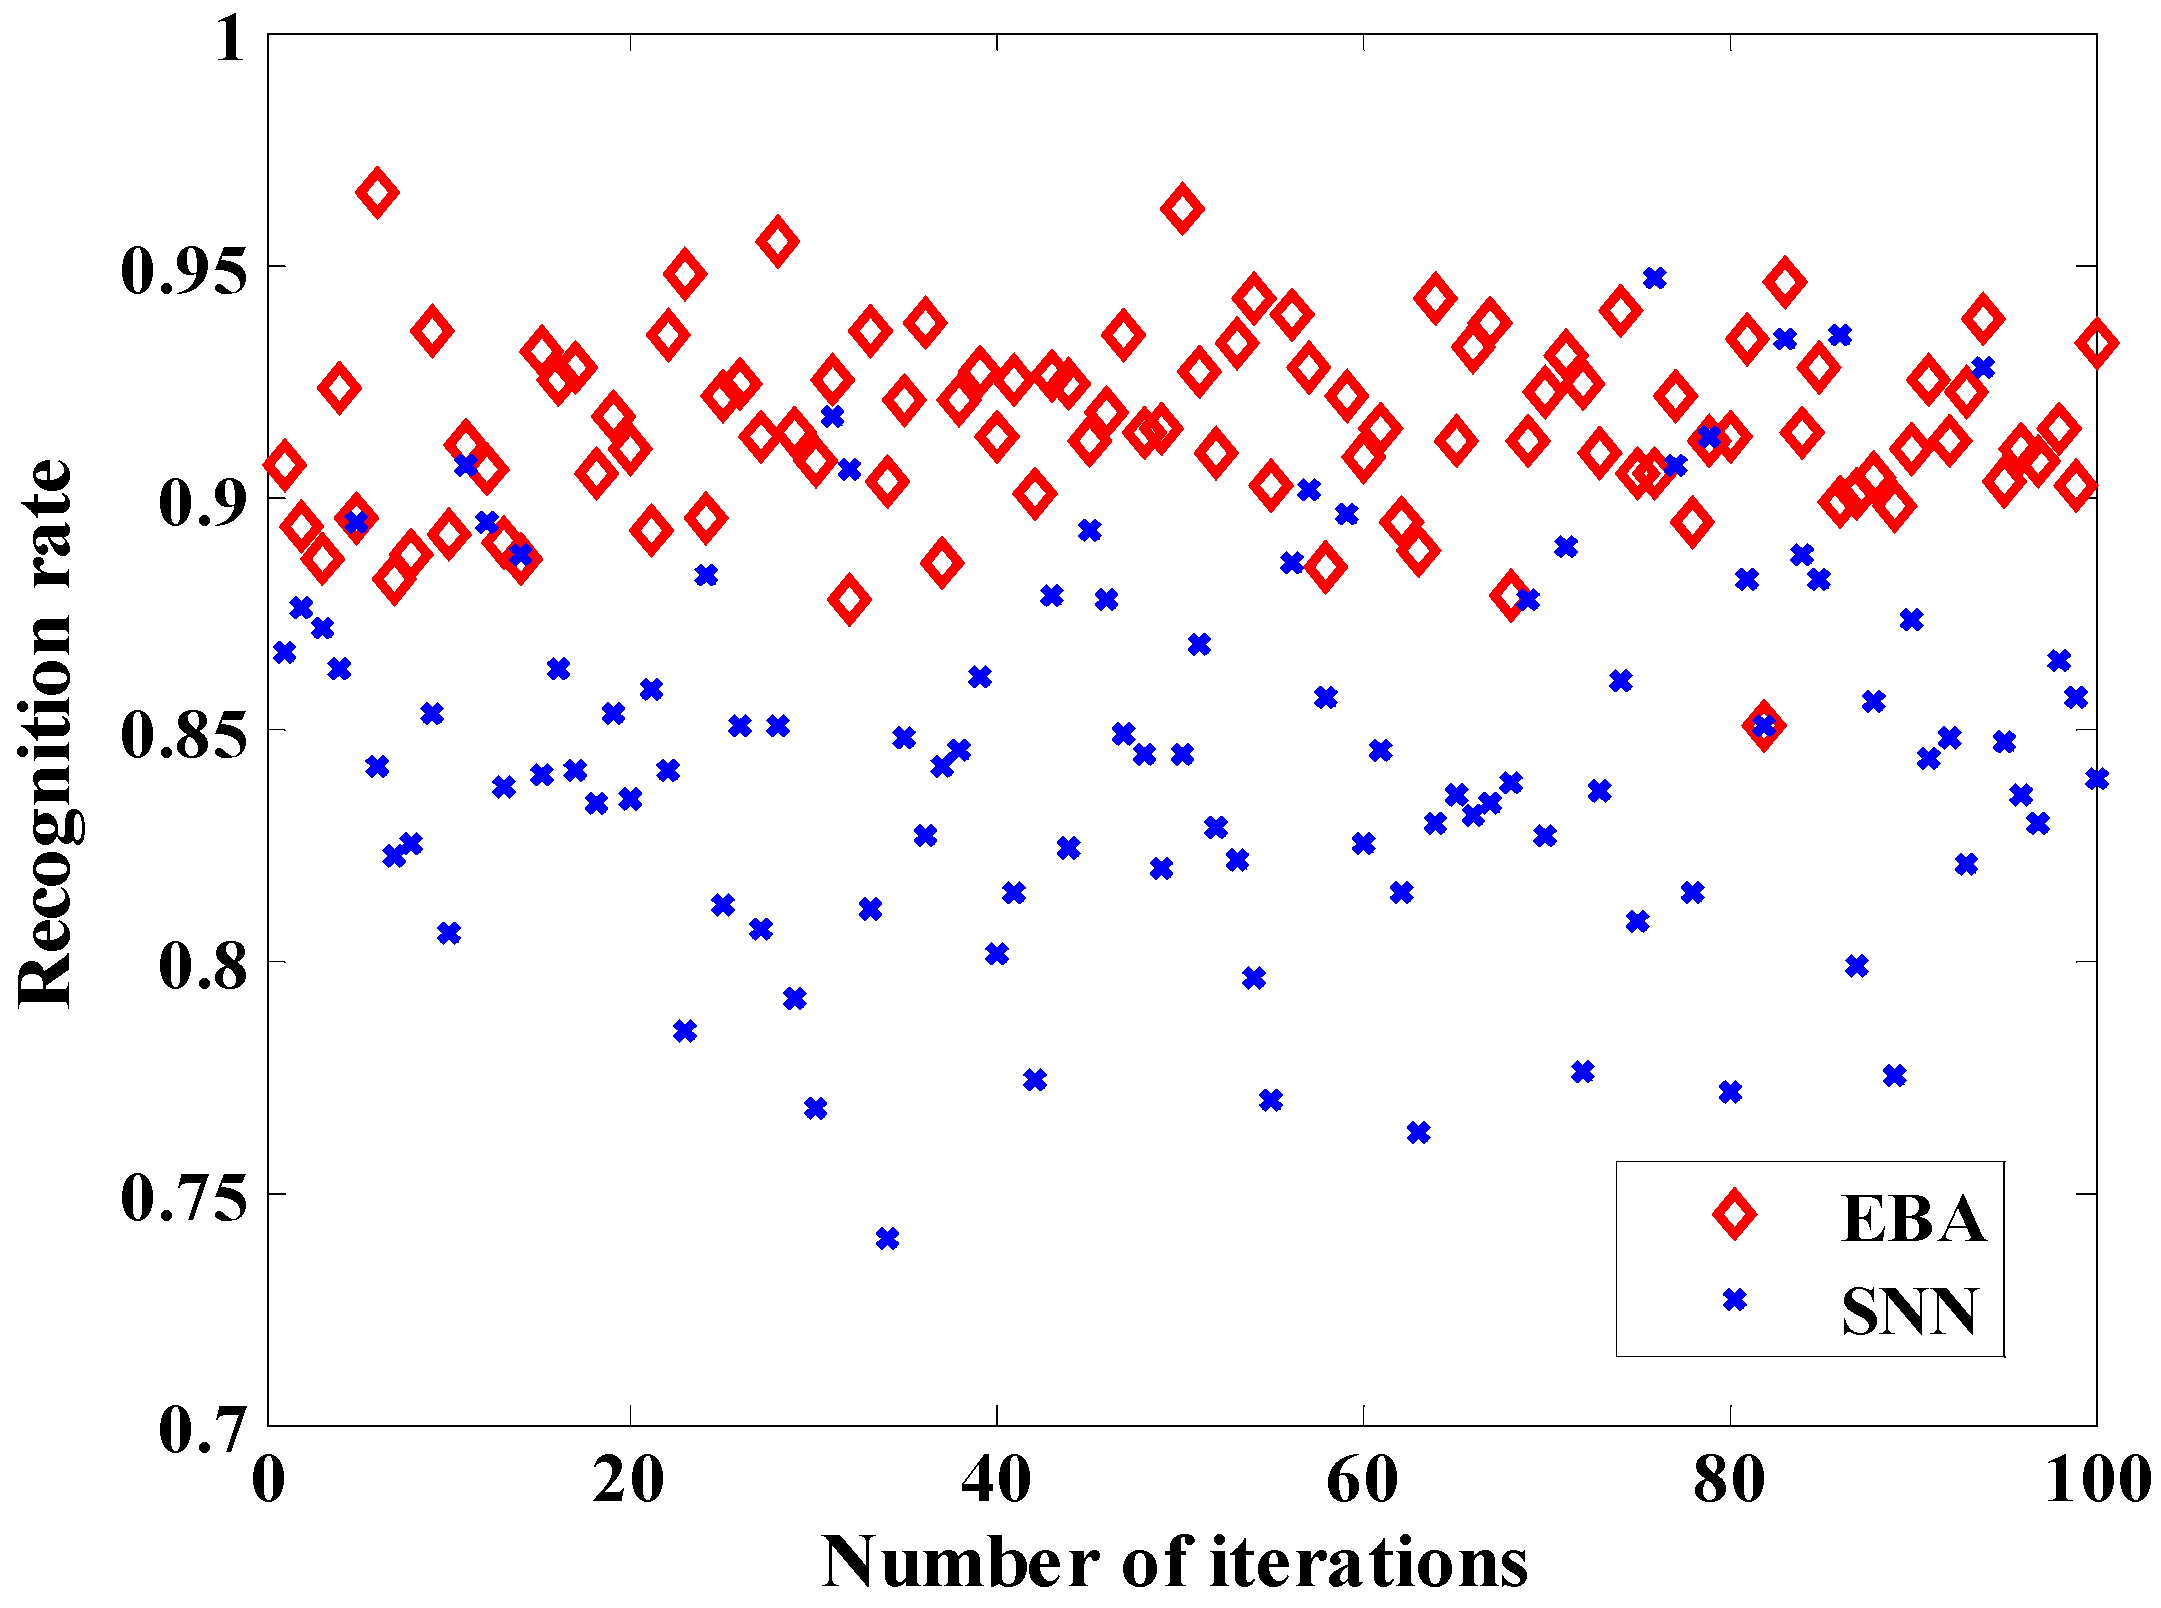
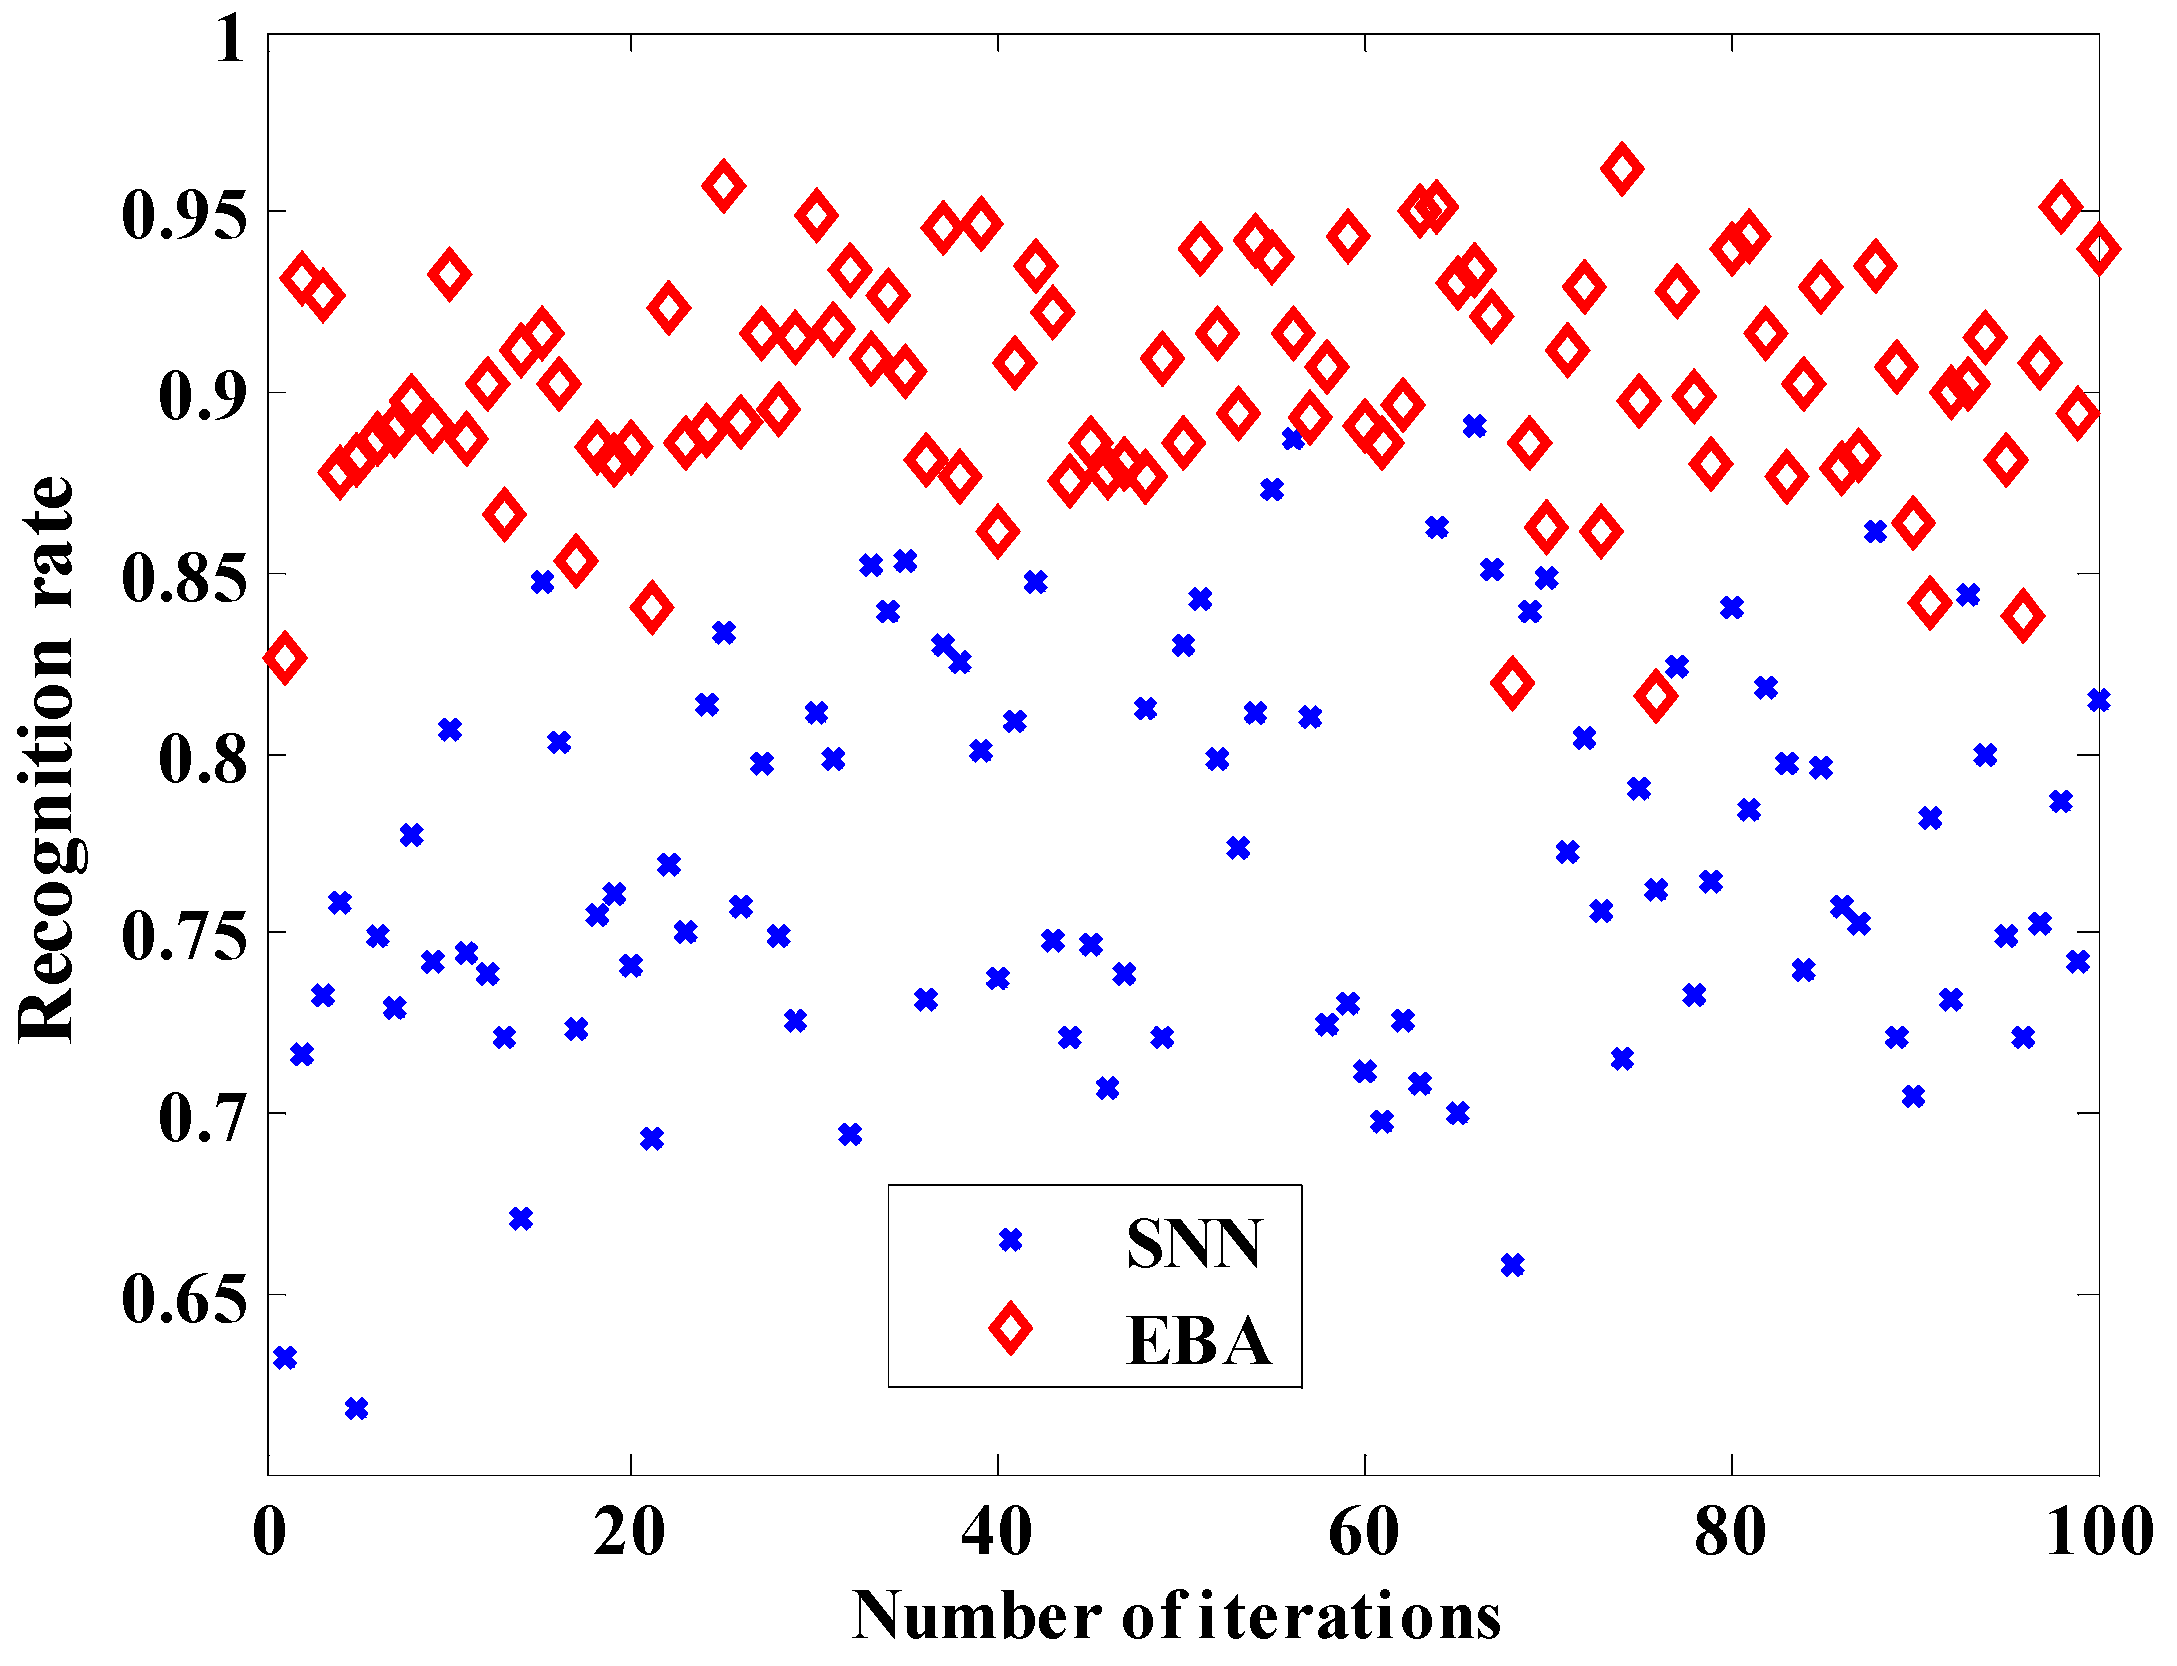
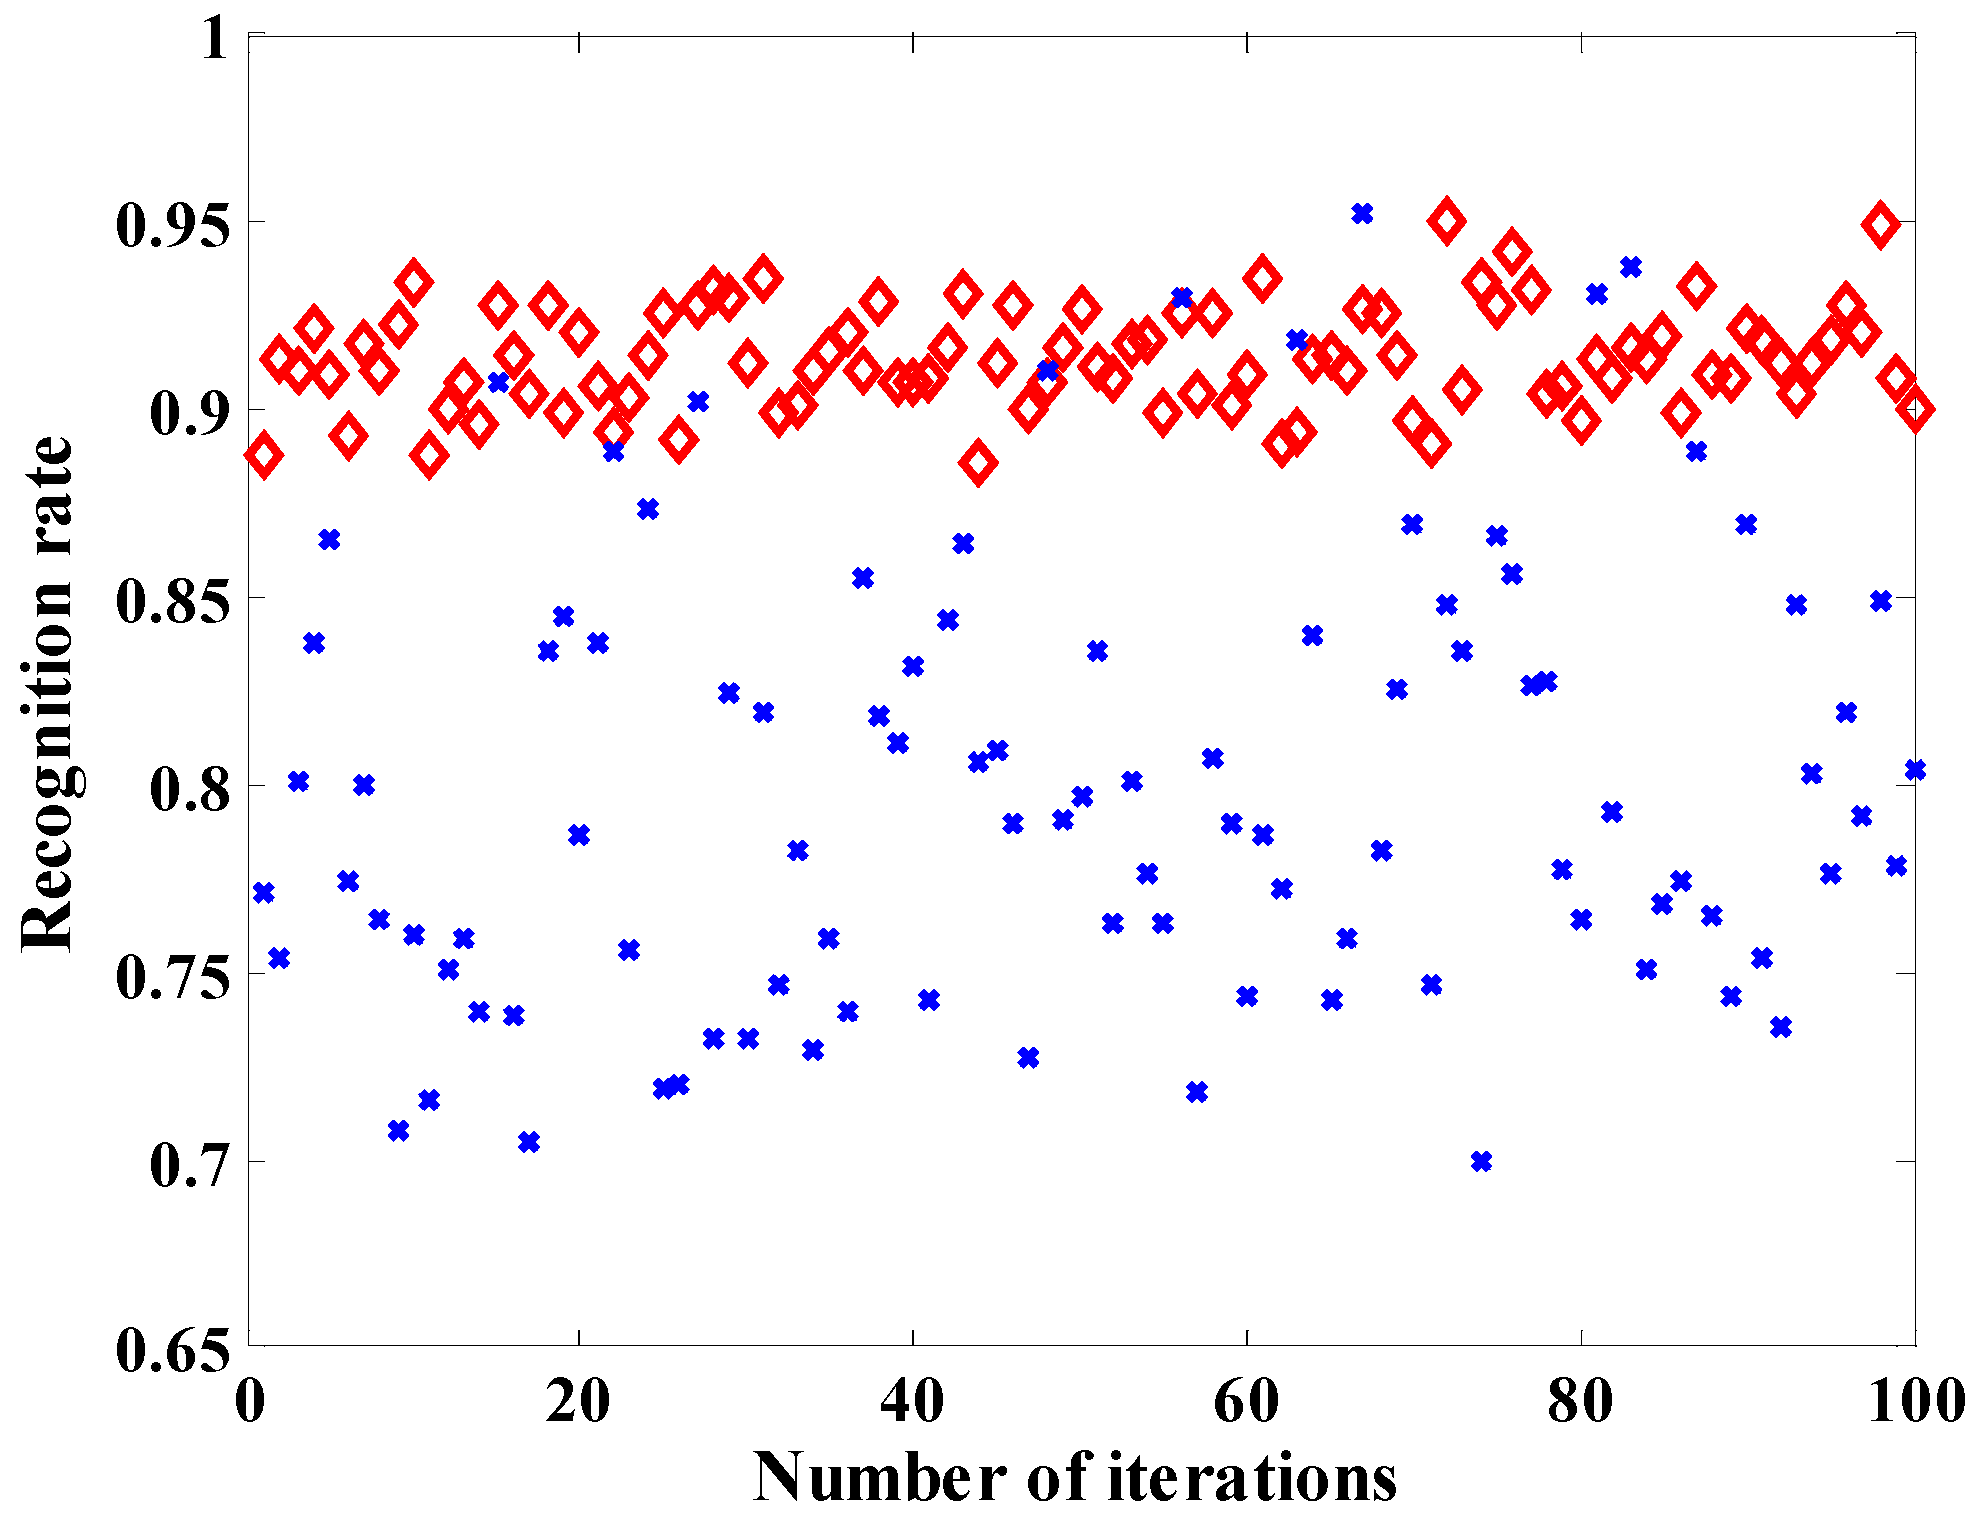
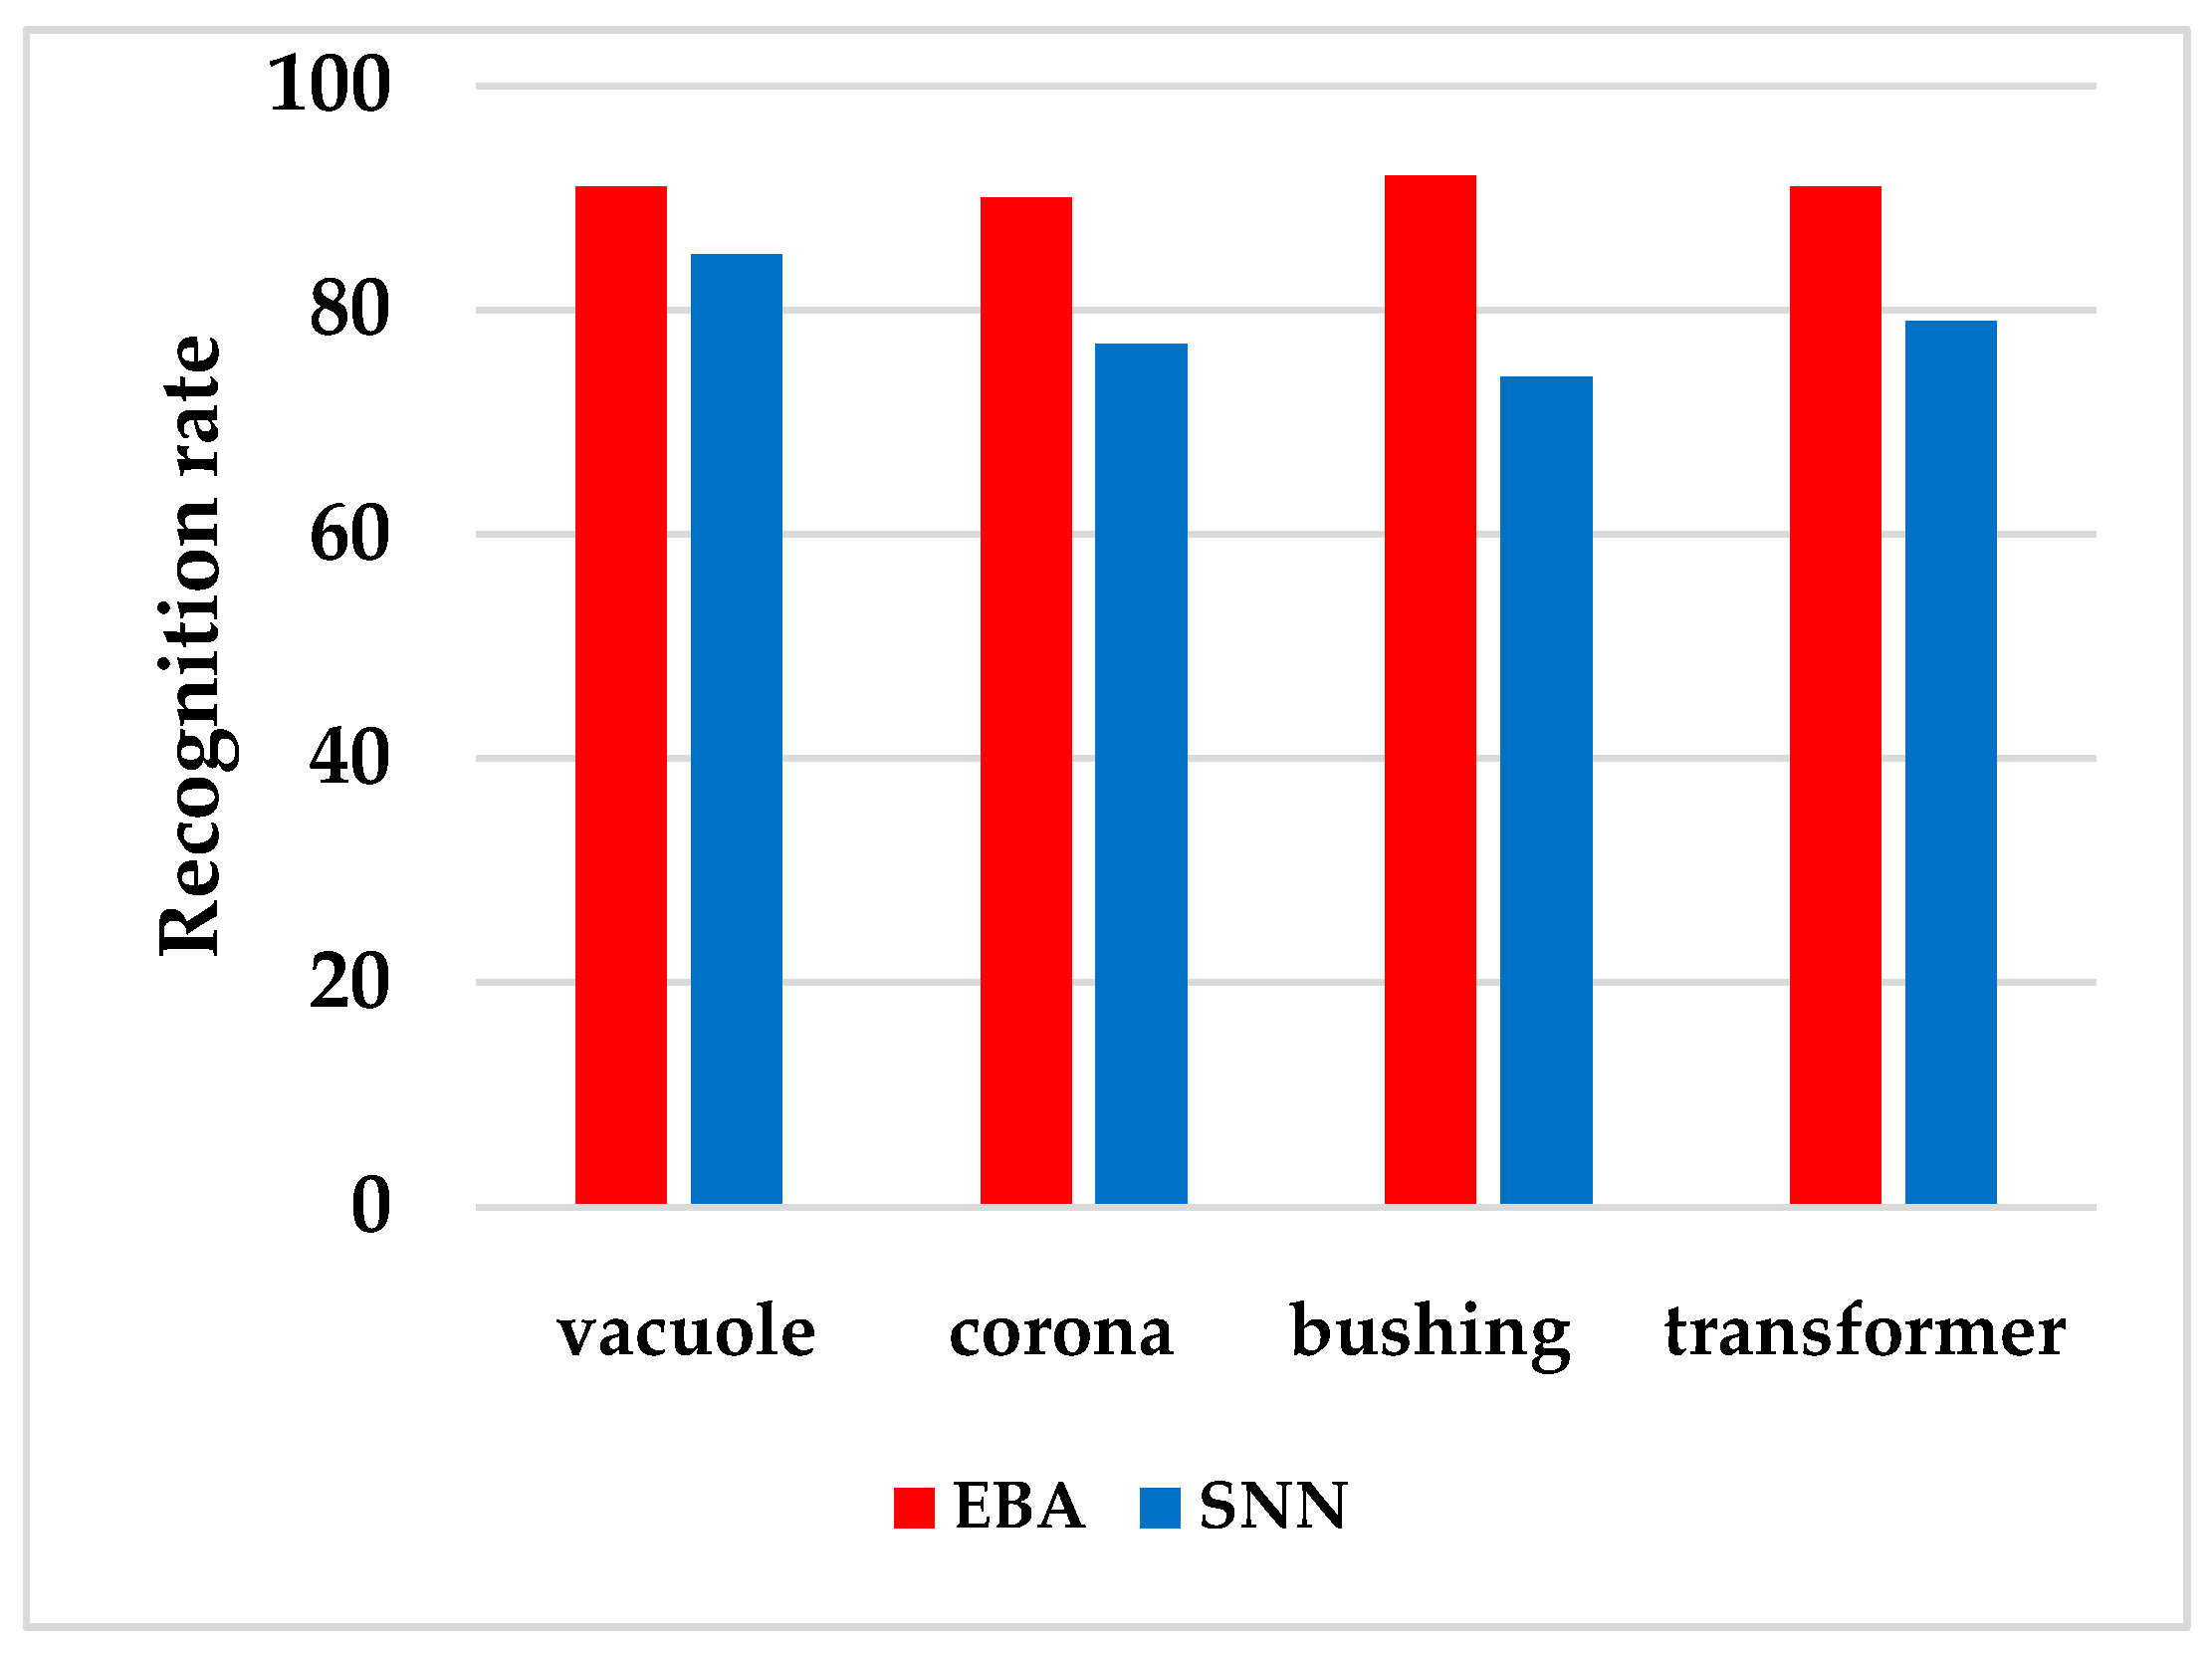
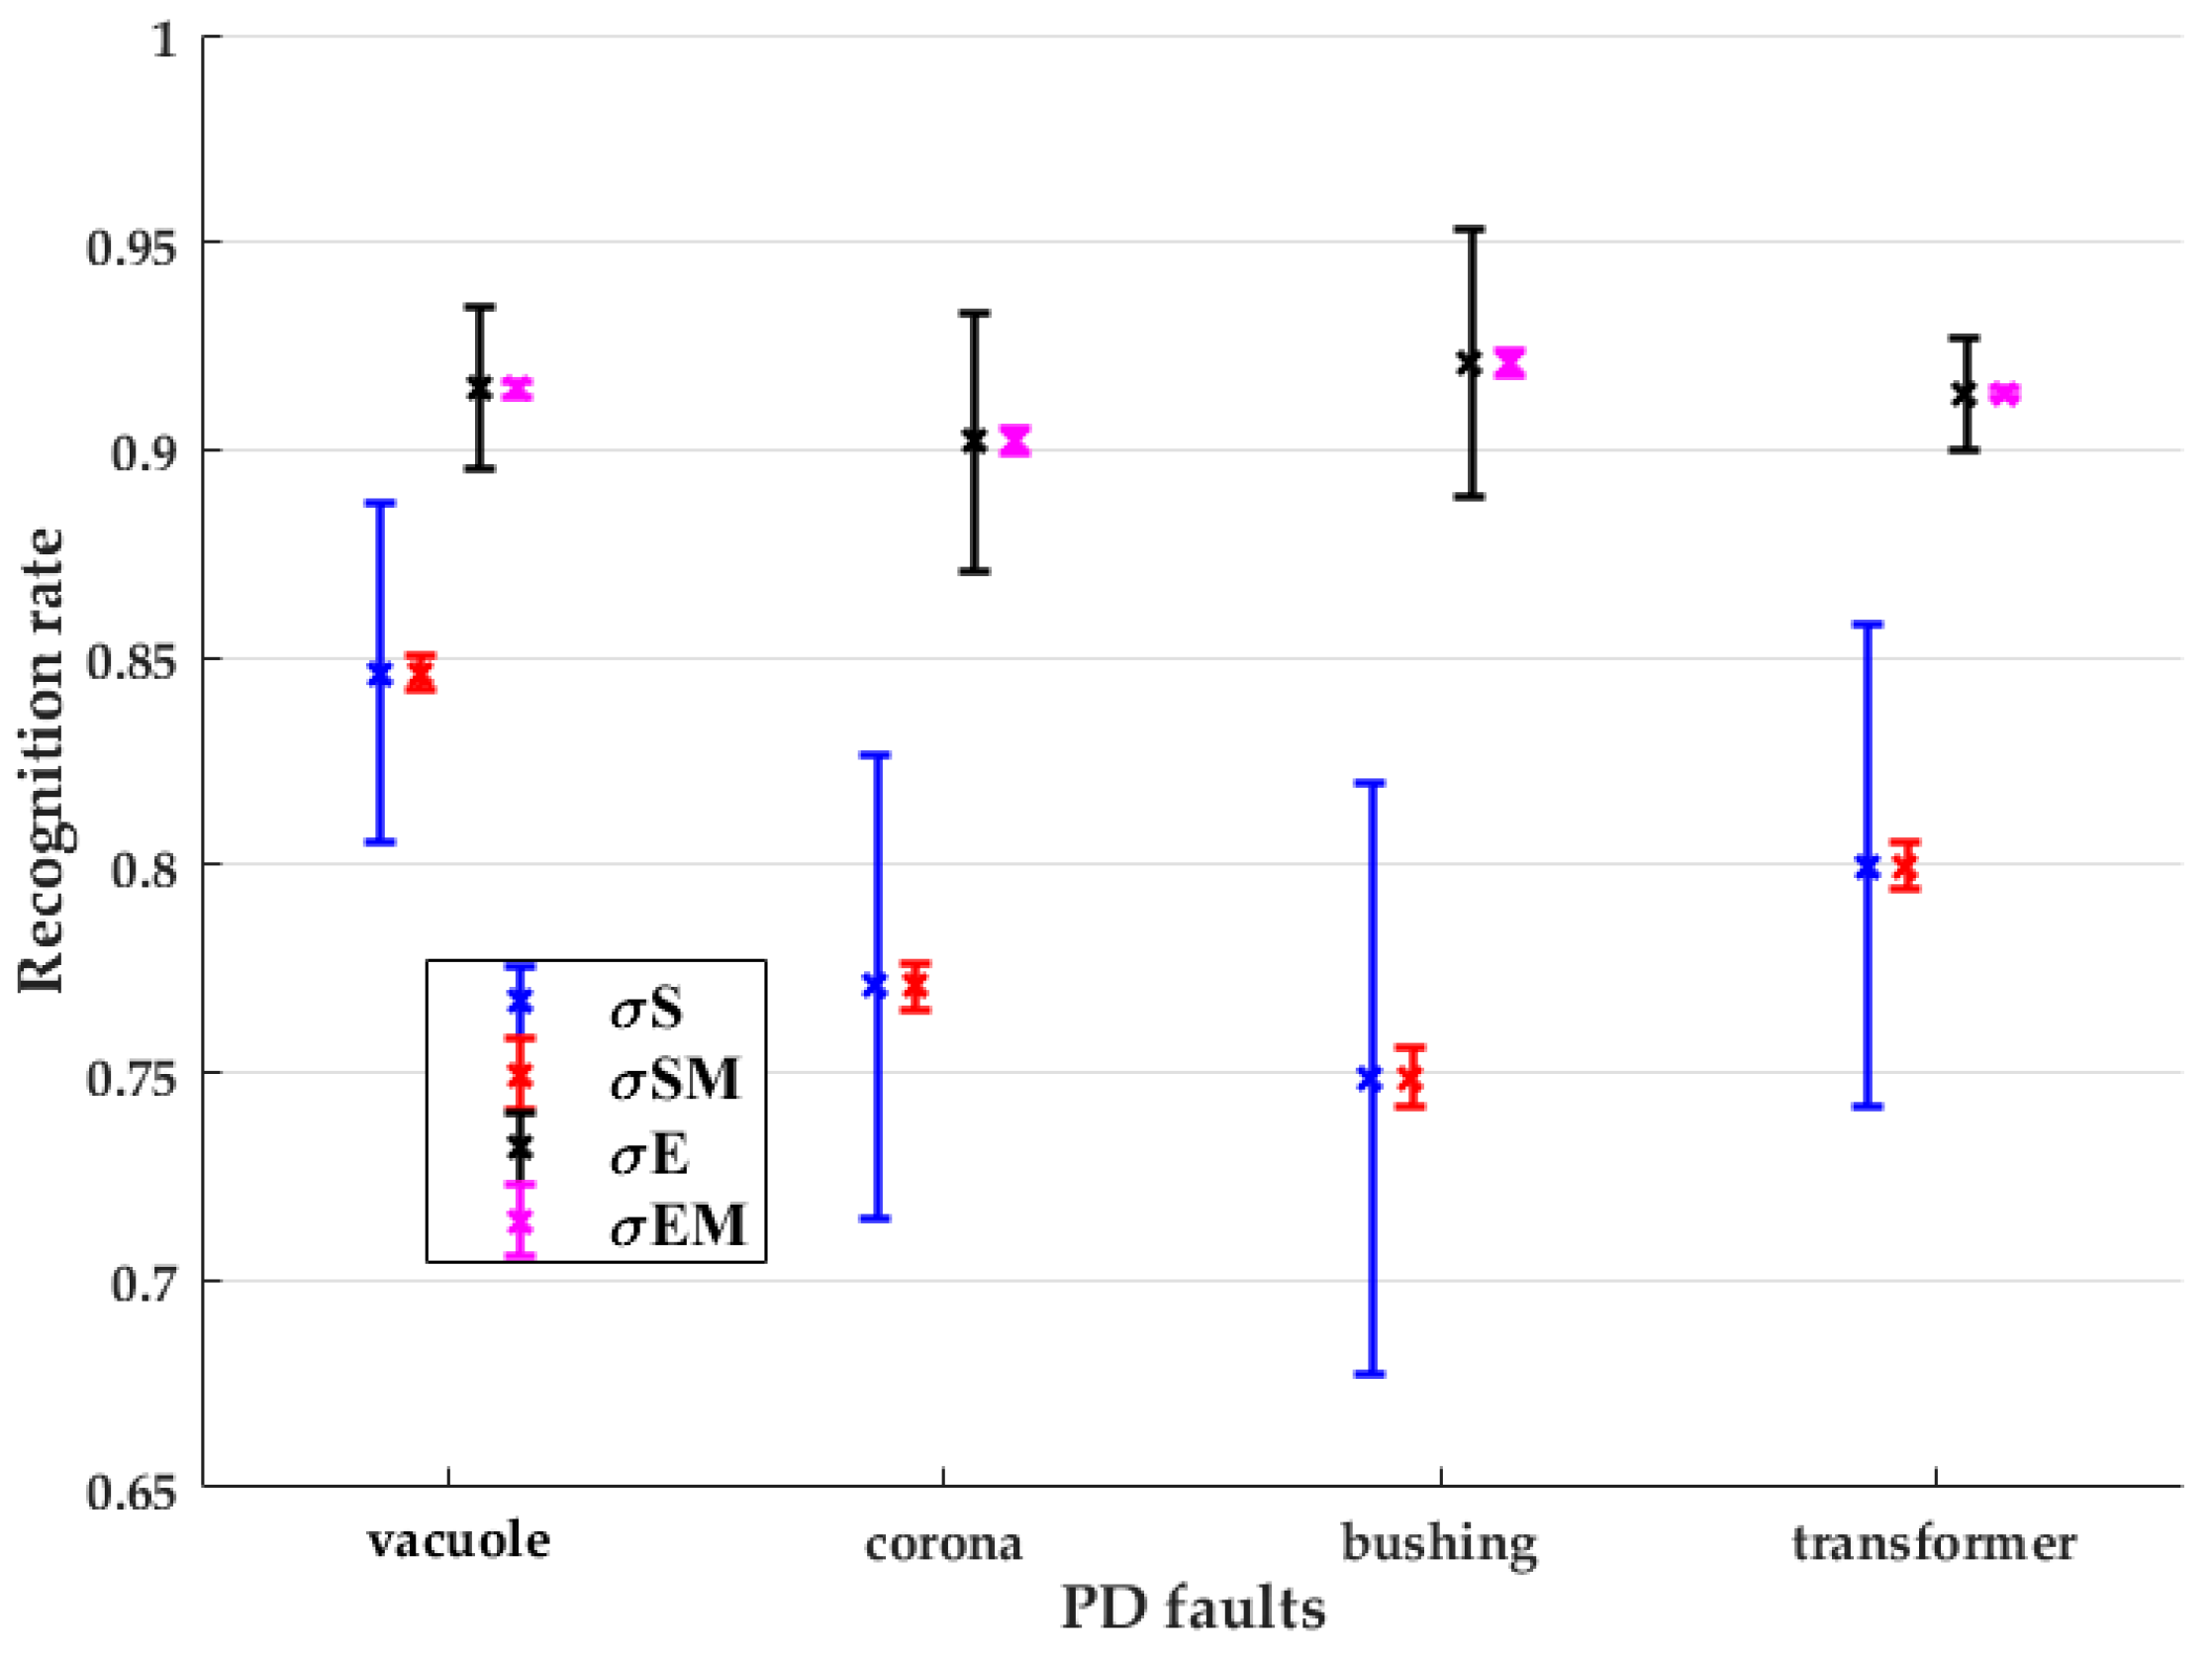
In this section, results showing the performance capabilities of the SNN and EBA are presented. Figure 6, Figure 7, Figure 8 and Figure 9 show the recognition rate when both the SNN and EBA are trained with one PD defect and testing is carried out with the same PD defect. For each figure, results were obtained over 100 iterations of weights and biases of the neural network. The average result for both the SNN and EBA trained and tested, with one PD defect shown in Figure 10. It is interesting to note that for the EBA, a higher recognition rate of up to 97% is obtained for each PD defect for the SNN and EBA trained and tested with vacuole. However, for the SNN trained and tested with transformer PD fault, a recognition rate of 95% can be seen. However, on average for each PD defect, the EBA algorithm provides 90% recognition efficiency, while the SNN provides around 80%. The result clearly implies that for both the SNN and EBA trained and tested with a similar PRPD pattern, there is consistently greater average recognition probability of the EBA over the SNN. The EBA consistently shows lower variance and standard mean square error over the SNN, as shown in Figure 11. However, the variance and standard error of the mean recognition rates for the EBA appear to be lower in vacuoles and transformer PD faults as compared to others. These might be due to the fact that PD faults of vacuole and transformer are unique and do not vary considerably even with prolonged degradation, unlike corona and bushing PD faults that have a complex mechanism and degradation. The overall result indicates an improved performance of the EBA algorithm over the widely applied SNN for PD defects.
A presumption regarding the effectiveness of the EBA and SNN leading to rigorous experimental investigation revealed that the EBA is efficient in recognizing PD patterns, is capable of learning from exemplars, and produces a better generalization than the SNN. This was demonstrated in Figure 6, Figure 7, Figure 8 and Figure 9, when with just 20 training exemplars and eight testing sets, a classification probability of up to 90% for some input classes was found. In addition, no misclassifications were recorded when all the fingerprints are tested against each other to see the resemblance. Additionally, noticeable development in the classification potential for the measures based on PRPD raw data has been presented. The results imply that the EBA can be considered as a potential algorithm for online PD detection problems.
8. Conclusions
In this paper, an EBA algorithm was proposed for recognizing PD defects from PRPD raw data captured for four PD fault classes, namely, cylindrical vacuoles, point-air-plane configurations, ceramic bushings and power transformers. The results of the EBA were extensively compared with the widely applied SNN. In this work, raw data from PRPD were applied as input parameters for the SNN and the EBA without having to carry out the widely used statistical feature extraction. The results clearly show that the EBA generally outperforms the SNN in recognizing these defects. It is a clear indication that the application of the EBA algorithm can improve the generalization capability and accuracy of the SNN in the pattern classification of PD faults. The results further imply that it is possible to integrate the EBA for PD-based condition monitoring of transformers, underground cables and electrical machines.
As part of further research, it will be necessary to investigate the robustness of the EBA for complex PD faults and other faults mixed with noise. It will also be necessary to test the EBA algorithm with field measurements to verify that the lab-based PD data recognition can be successfully applied for practical investigations. To further verify the effectiveness of the EBA, it is necessary to compare its performance with other ensemble techniques such as random forest and XGBoost.
Acknowledgments
The authors hereby acknowledge the support given by the High-Voltage research laboratories of Universidad Técnica Federico Santa María in conducting the experiments presented in this paper. The authors acknowledge the support of the Chilean Research Council (CONICYT), under the project Fondecyt 11160115.
Author Contributions
Abdullahi Abubakar Mas’ud wrote the paper. Jorge Alfredo Ardila-Rey carried out the experimental measurements. Ricardo Albarracín contributed with the introduction, proposed improvements for the analysis of the results and for the manuscript. Firdaus Muhammad-Sukki carried out a proofreading on the article and provided suggestions for improvement.
Conflicts of Interest
The authors declare no conflict of interest.
References
- Barré, O.; Napame, B. The Insulation for Machines Having a High Lifespan Expectancy, Design, Tests and Acceptance Criteria Issures. Machines 2017, 5, 7. [Google Scholar] [CrossRef]
- Haque, S.M.; Ardila-Rey, J.A.; Masud, A.A.; Umar, Y.; Albarracín, R. Electrical Properties of Different Polymeric Materials and their Applications: The Influence of Electric Field. In Properties and Applications of Polymer Dielectrics; Boxue, D., Ed.; InTech: Rijeka, Croatia, 2017; Chapter 3. [Google Scholar]
- Jardine, A.K.; Lin, D.; Banjevic, D. A review on machinery diagnostics and prognostics implementing condition-based maintenance. Mech. Syst. Signal Process. 2006, 20, 1483–1510. [Google Scholar] [CrossRef]
- Gill, P. Electrical Power Equipment Maintenance and Testing, 2nd ed.; CRC Press: Boca Raton, FL, USA, 2008. [Google Scholar]
- Kreuger, F.H. Partial Discharge Detection in High-Voltage Equipment; Butterworths: London, UK, 1989. [Google Scholar]
- Boggs, S. Partial discharge. III. Cavity-induced PD in solid dielectrics. IEEE Electr. Insul. Mag. 1990, 6, 11–16. [Google Scholar] [CrossRef]
- Cavallini, A.; Montanari, G.C.; Contin, A.; Pulletti, F. A new approach to the diagnosis of solid insulation systems based on PD signal inference. IEEE Electr. Insul. Mag. 2003, 19, 23–30. [Google Scholar] [CrossRef]
- Stone, G.C.; Sedding, H.G.; Costello, M.J. Application of partial discharge testing to motor and generator stator winding maintenance. IEEE Trans. Ind. Appl. 1996, 32, 459–464. [Google Scholar] [CrossRef]
- Asiri, Y.; Vouk, A.; Renforth, L.; Clark, D.; NeuralWare, J.C. Neural network based classification of partial discharge in HV motors. In Proceedings of the 2011 Electrical Insulation Conference (EIC), Annapolis, MD, USA, 5–8 June 2011; pp. 333–339. [Google Scholar]
- Markalous, S.M.; Tenbohlen, S.; Feser, K. Detection and location of partial discharges in power transformers using acoustic and electromagnetic signals. IEEE Trans. Dielectr. Electr. Insul. 2008, 15, 1576–1583. [Google Scholar] [CrossRef]
- Albarracín, R.; Ardila-Rey, J.A.; Masud, A.A. On the Use of Monopole Antennas for Determining the Effect of the Enclosure of a Power Transformer Tank in Partial Discharges Electromagnetic Propagation. Sensors 2016, 16, 148. [Google Scholar] [CrossRef] [PubMed]
- Gulski, E.; Krivda, A. Neural networks as a tool for recognition of partial discharges. IEEE Trans. Electr. Insul. 1993, 28, 984–1001. [Google Scholar] [CrossRef]
- Gulski, E. Computer-Aided Recognition of Partial Discharges Using Statistical Tools; Delft University: Delft, The Netherlands, 1991. [Google Scholar]
- Masud, A.A.; Albarracín, R.; Ardila-Rey, J.A.; Muhammad-Sukki, F.; Illias, H.A.; Bani, N.A.; Munir, A.B. Artificial Neural Network Application for Partial Discharge Recognition: Survey and Future Directions. Energies 2016, 9, 574. [Google Scholar] [CrossRef]
- Lai, K.X.; Phung, B.T.; Blackburn, T.R. Application of data mining on partial discharge Part I: Predictive modelling classification. IEEE Trans. Dielectr. Electr. Insul. 2010, 17, 846–854. [Google Scholar] [CrossRef]
- Hao, L.; Lewin, P.L. Partial discharge source discrimination using a support vector machine. IEEE Trans. Dielectr. Electr. Insul. 2010, 17, 189–197. [Google Scholar] [CrossRef]
- Ma, H.; Chan, J.C.; Saha, T.K.; Ekanayake, C. Pattern recognition techniques and their applications for automatic classification of artificial partial discharge sources. IEEE Trans. Dielectr. Electr. Insul. 2013, 20, 468–478. [Google Scholar] [CrossRef]
- Günter, S.; Bunke, H. New Boosting Algorithms for Classification Problems with Large Number of Classes Applied to a Handwritten Word Recognition Task; International Workshop on Multiple Classifier Systems; Springer: Berlin/Heidelberg, Germany, 2003; pp. 326–335. [Google Scholar]
- Ivanov, Y.; Hamid, R. Weighted ensemble boosting for robust activity recognition in video. Mach. Graph. Vis. 2006, 15, 415. [Google Scholar]
- IEC-60270. High-Voltage Test Techniques—Partial Discharge Measurements, 3rd ed.; International Electrotechnical Commission (IEC): New Delhi, India, 2000. [Google Scholar]
- Opitz, D.; Maclin, R. Popular ensemble methods: An Empirical study. J. Artif. Intell. Res. 1999, 11, 169–198. [Google Scholar]
- Brieman, L. Bagging Predictors. Mach. Learn. 1996, 24, 123–124. [Google Scholar] [CrossRef]
- Schapire, R.E. The Strength of Weak Learnability. Mach. Learn. 1990, 5, 197–227. [Google Scholar] [CrossRef]
- Haykin, S.S. Neural Networks: A Comprehensive Foundation; Prentice Hall: Upper Saddle River, NJ, USA, 1998. [Google Scholar]
- Giao, T.N. Partial discharge XIX: Discharge in air part I: Physical mechanisms. IEEE Electr. Insul. Mag. 1995, 11, 23–29. [Google Scholar]
- Masud, A.A.; Stewart, B.G.; McMeekin, S.G. Application of an ensemble neural network classifying partial discharge patterns. Electr. Power Syst. Res. 2014, 110, 154–162. [Google Scholar]
Figure 1.
Experimental setup used according to the IEC 60270 standard.
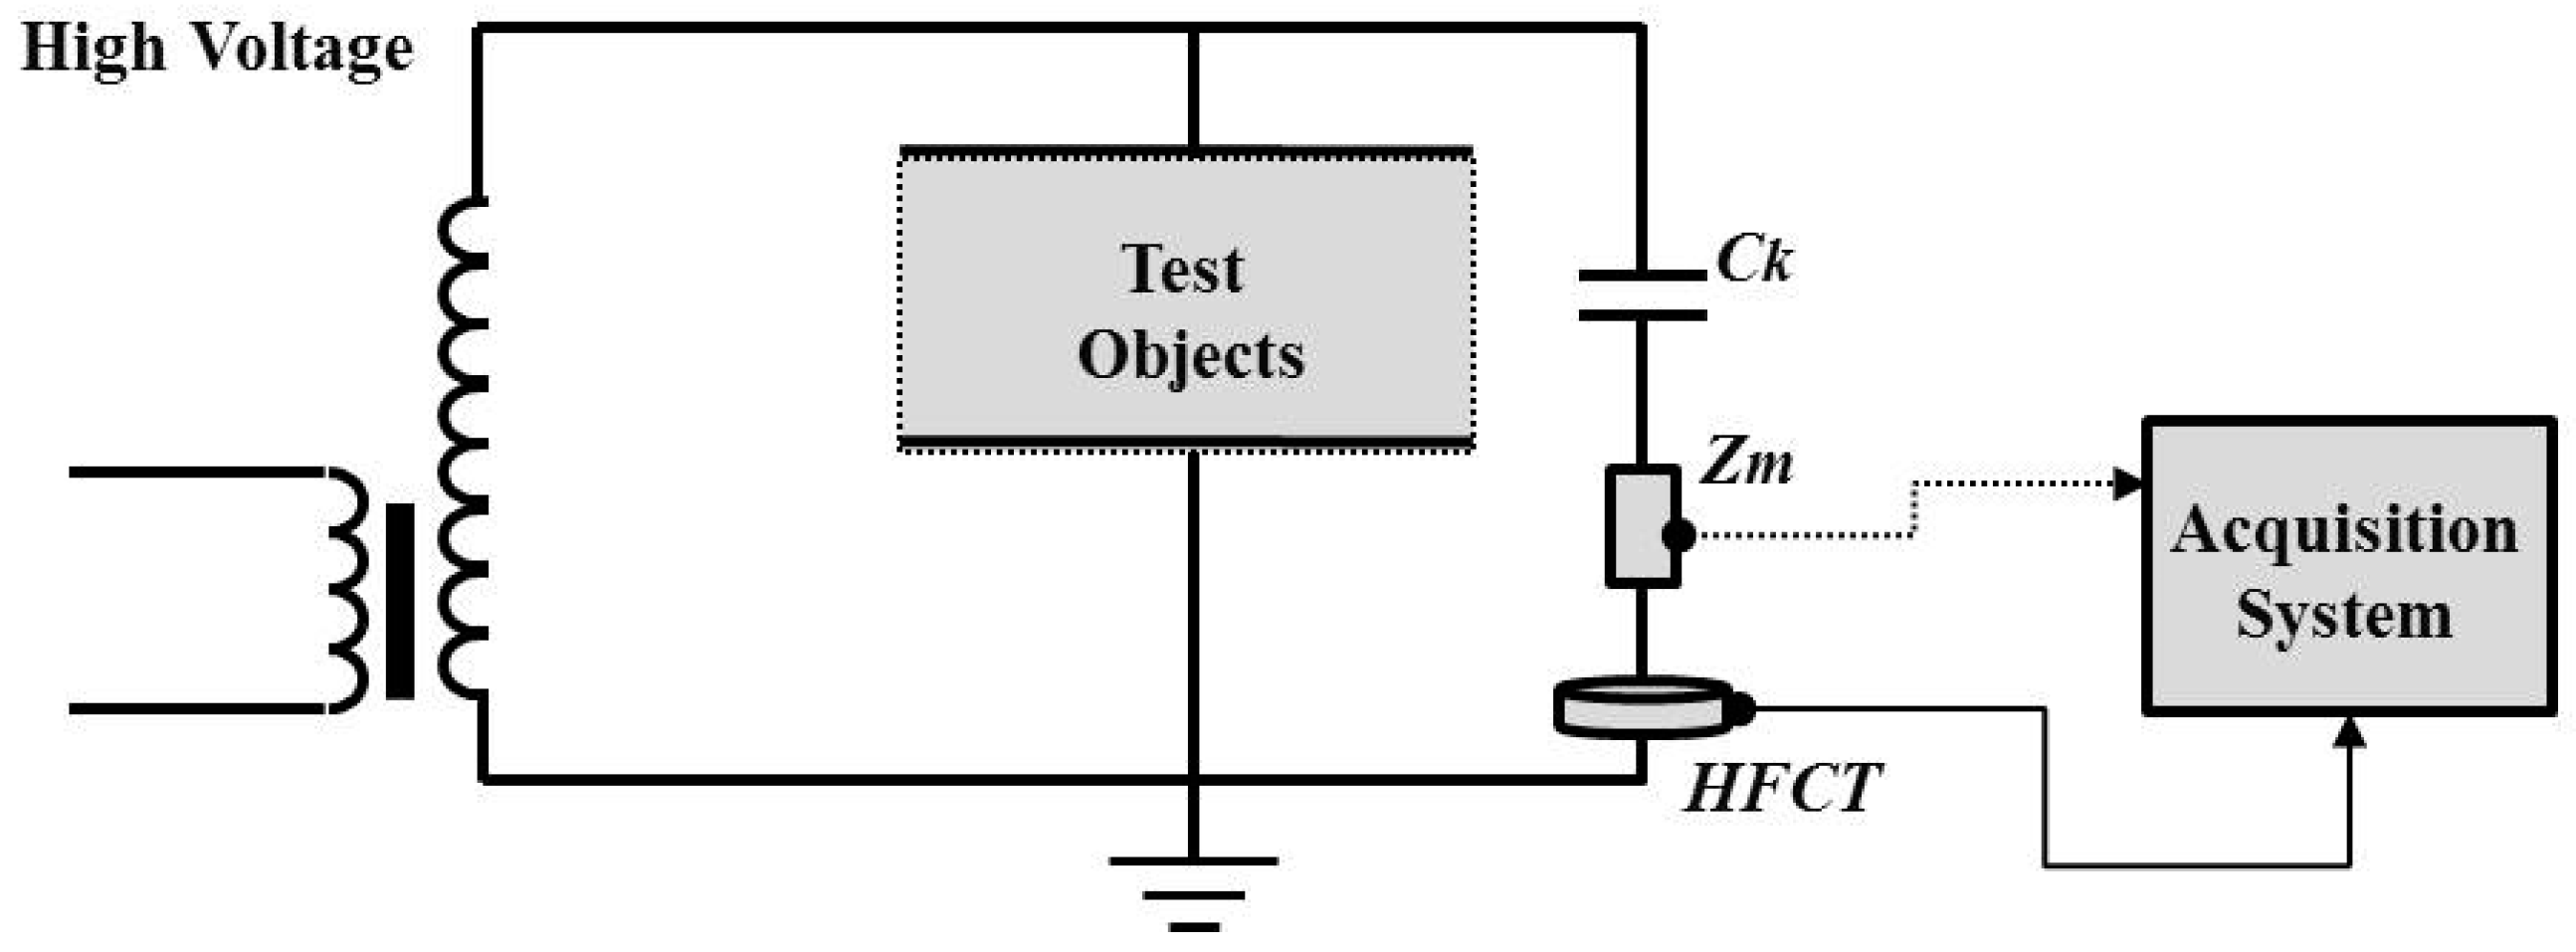
Figure 2.
Test objects: (a) Cylindrical vacuoles; (b) Point-plane experimental specimen; (c) Contaminated ceramic bushing, and; (d) Power Transformers (150 kVA).
Figure 2.
Test objects: (a) Cylindrical vacuoles; (b) Point-plane experimental specimen; (c) Contaminated ceramic bushing, and; (d) Power Transformers (150 kVA).

Figure 3.
A learning cycle of the artificial neural network (ANN).
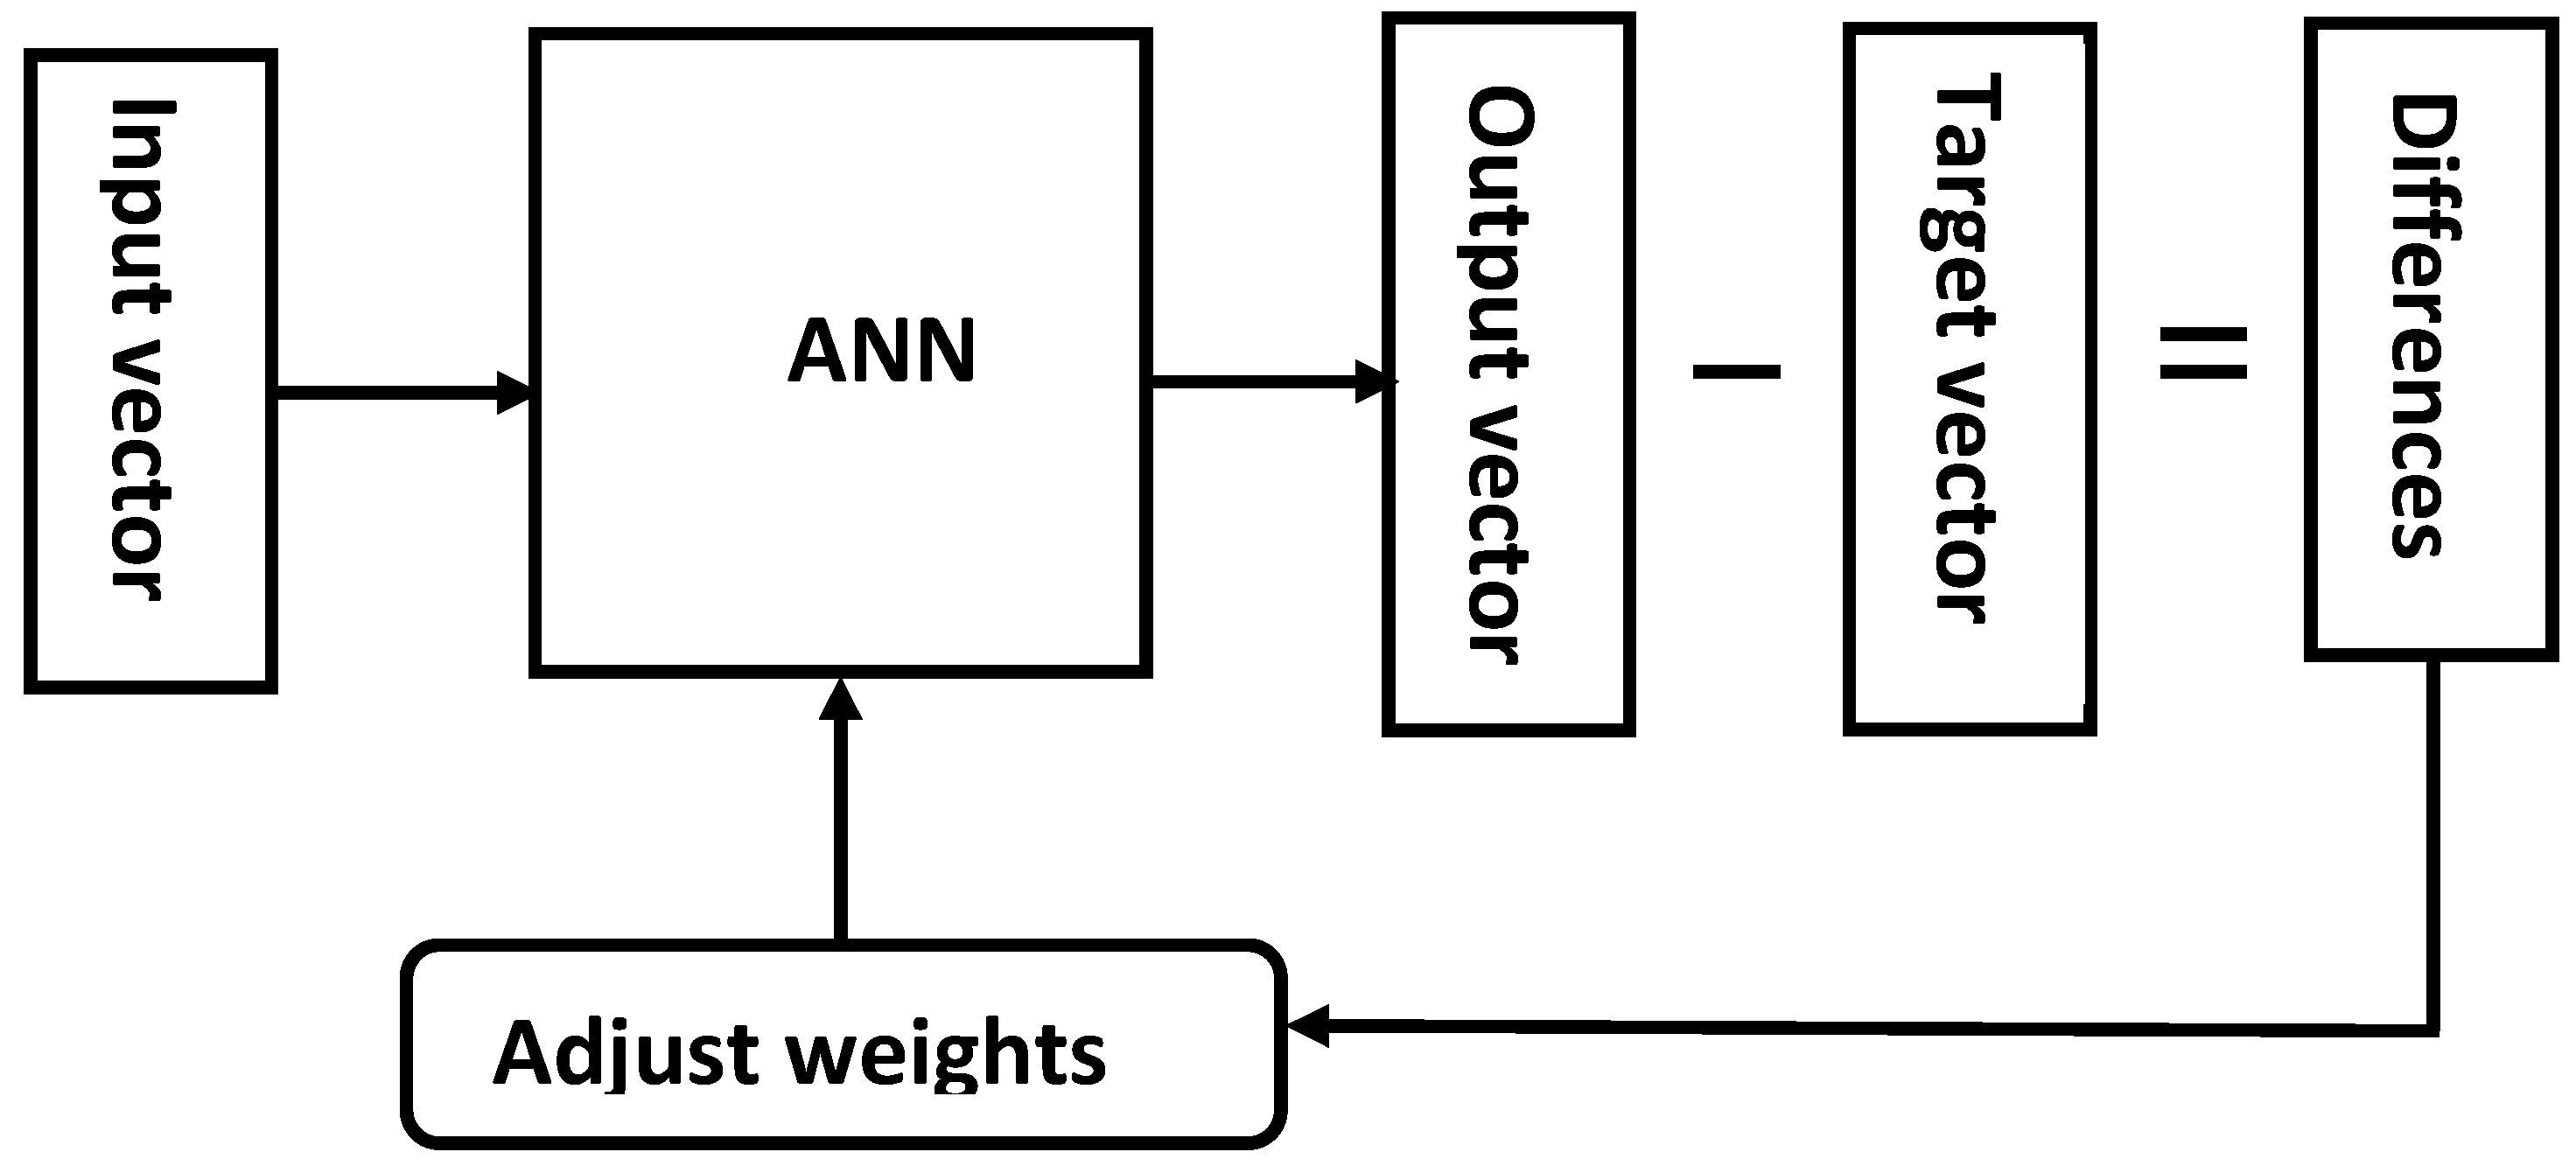
Figure 4.
Phase-resolved partial discharge (PRPD) patterns and their corresponding reduced patterns for the single artificial neural network (SNN) and the ensemble-boosting algorithm (EBA) for: (a) Cylindrical vacuoles in methacrylate; (b) Point-air-plane configuration; (c) Ceramic bushing with contaminated surface, and; (d) Power Transformers (150 kVA).
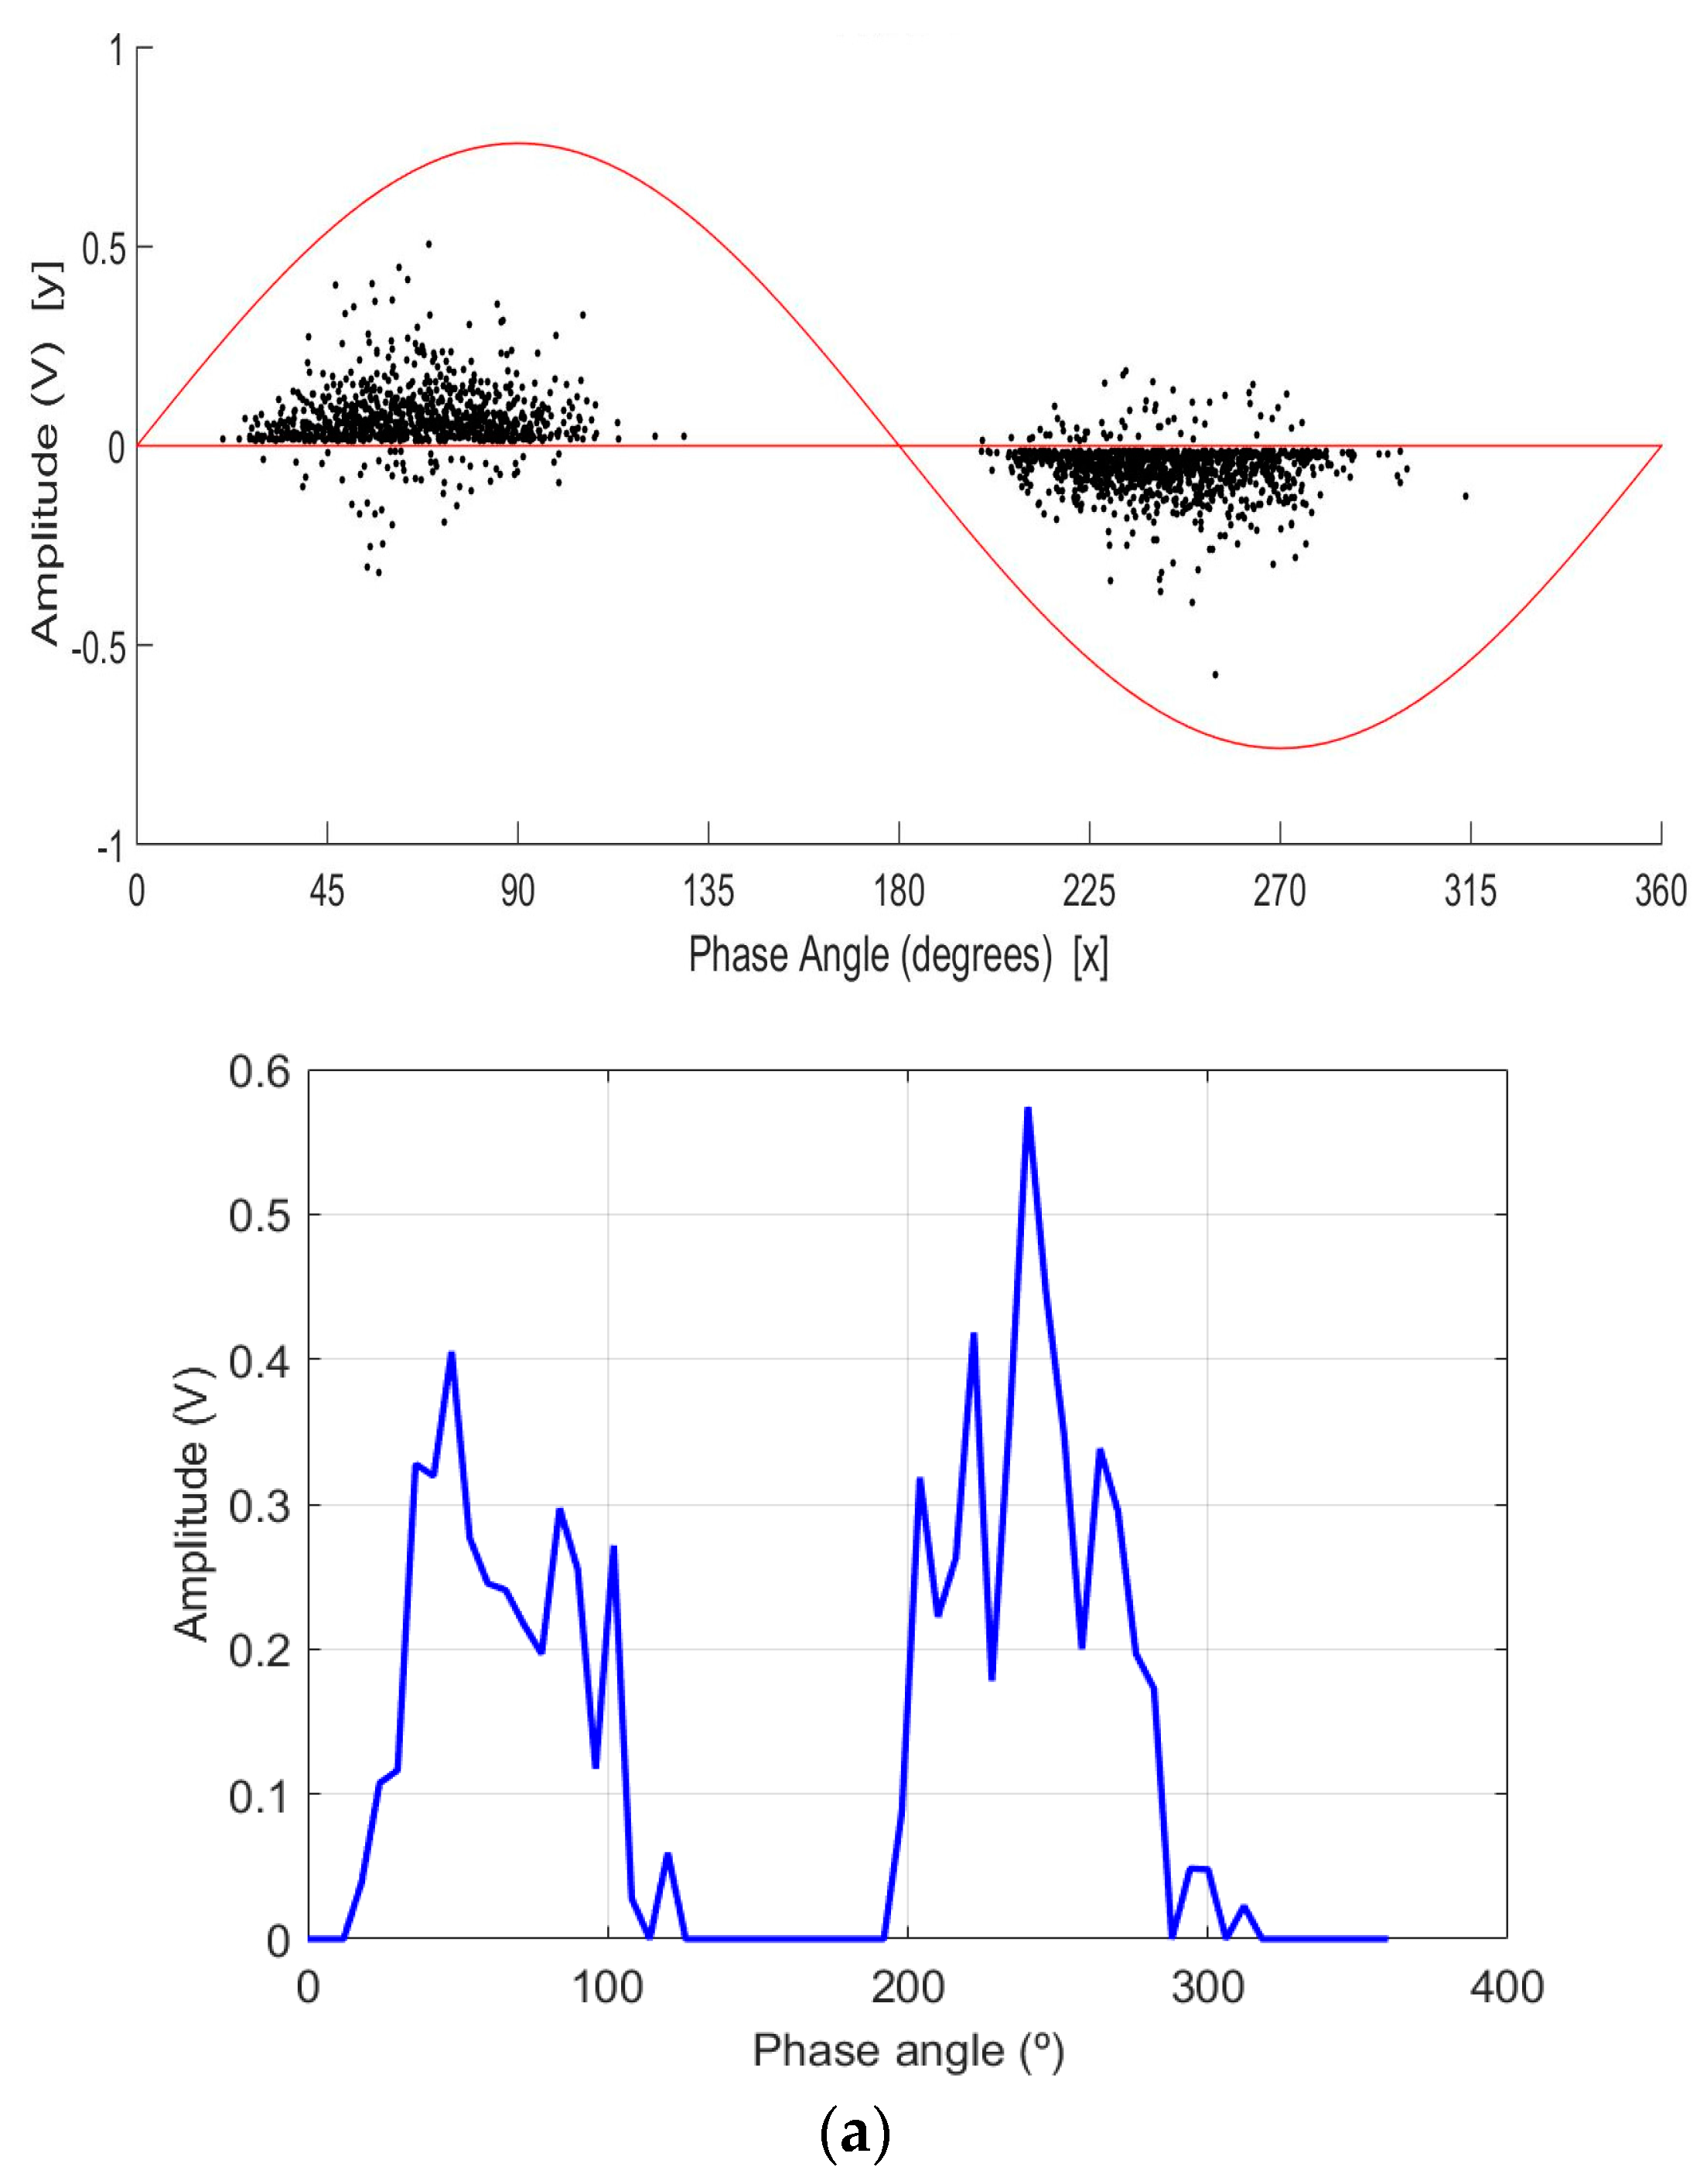
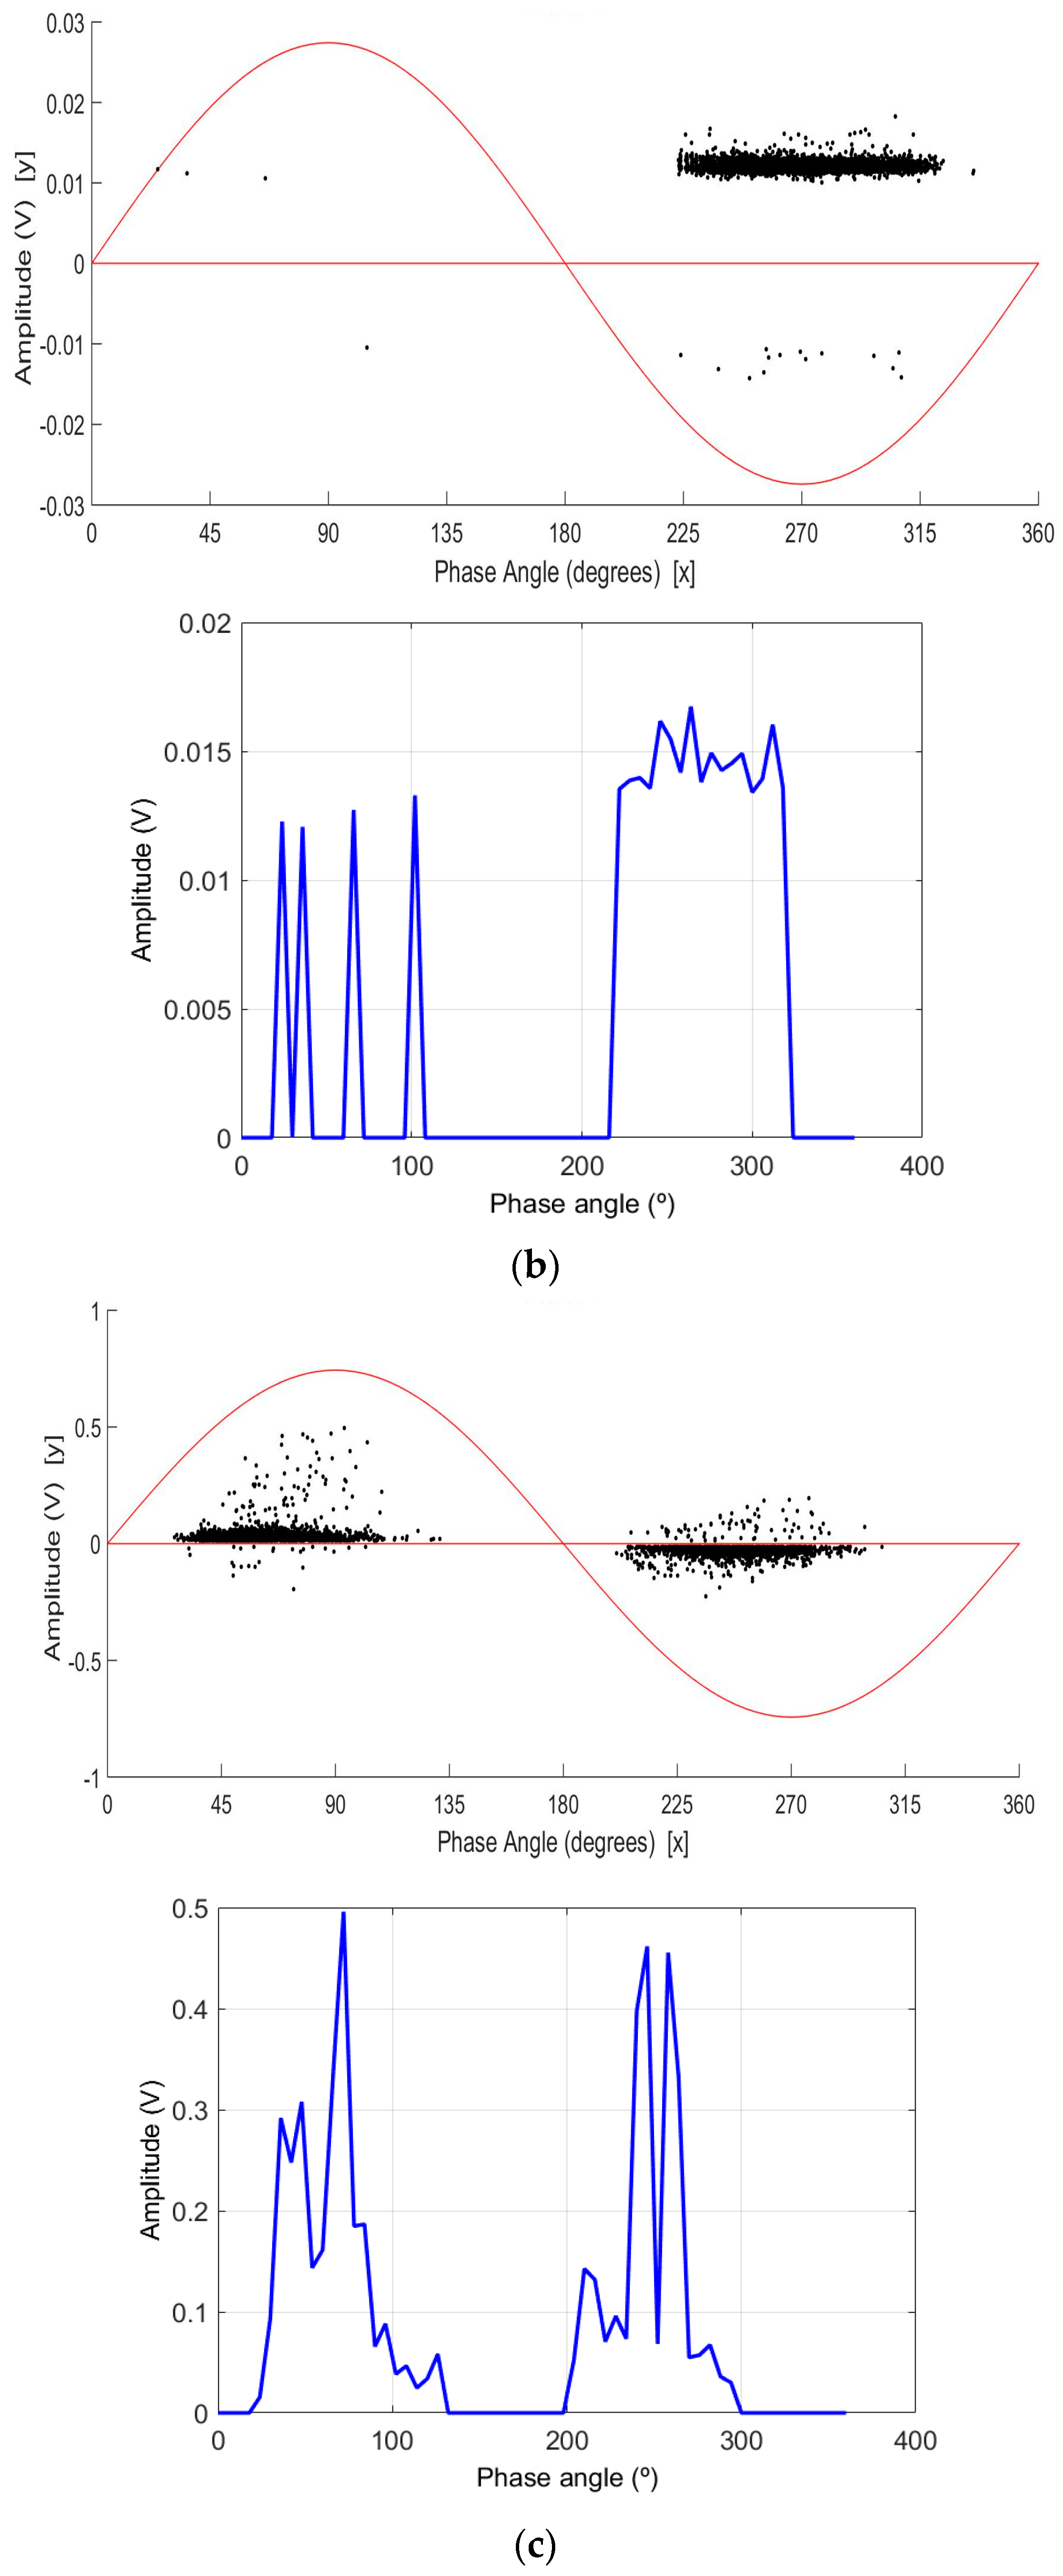

Figure 5.
An EBA learning process for the EBA.

Figure 6.
Training and testing both the SNN and EBA with vacuole defect.

Figure 7.
Training and testing both the SNN and EBA with corona defect.

Figure 8.
Training and testing both the SNN and EBA with defect on bushing surface.
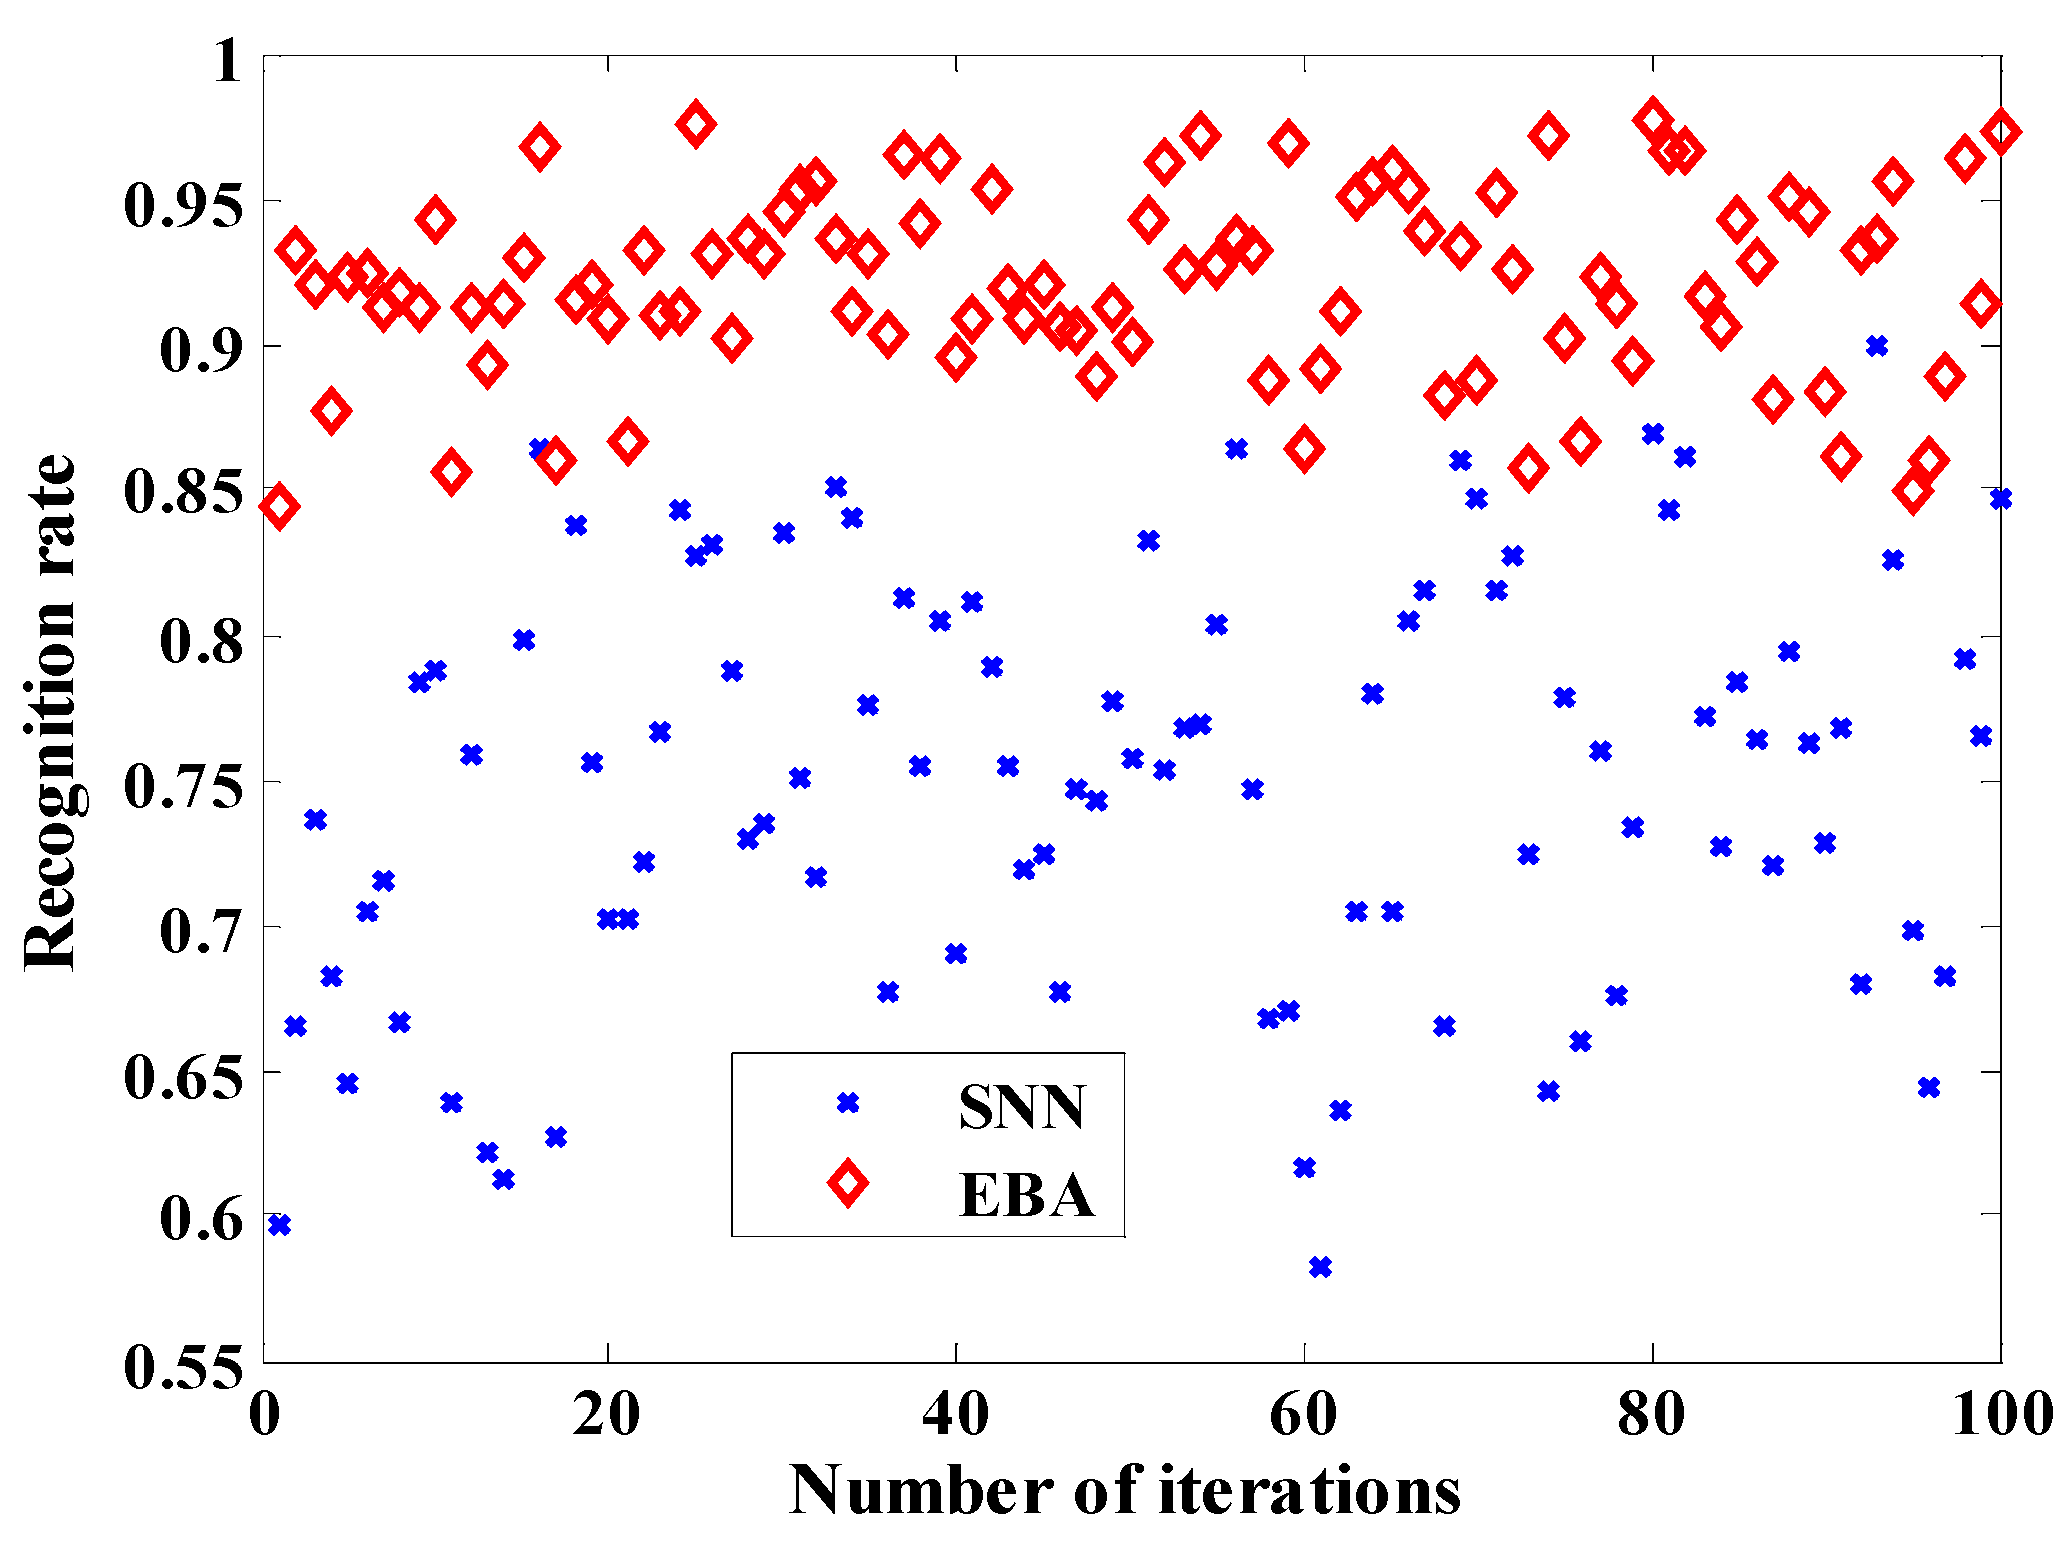
Figure 9.
Training and testing both the SNN and EBA with defect in a transformer.

Figure 10.
Recognition efficiencies of training and testing with each of the PD defects.

Figure 11.
Variance and standard error of the mean recognition efficiencies of SNN and EBA for each defect (σS = variance of the SNN, σSM = standard error of the mean of the SNN, σE = variance of the EBA, σEM = standard error of the mean of the EBA).
Figure 11.
Variance and standard error of the mean recognition efficiencies of SNN and EBA for each defect (σS = variance of the SNN, σSM = standard error of the mean of the SNN, σE = variance of the EBA, σEM = standard error of the mean of the EBA).
© 2017 by the authors. Licensee MDPI, Basel, Switzerland. This article is an open access article distributed under the terms and conditions of the Creative Commons Attribution (CC BY) license (http://creativecommons.org/licenses/by/4.0/).
Share and Cite
MDPI and ACS Style
Mas’ud, A.A.; Ardila-Rey, J.A.; Albarracín, R.; Muhammad-Sukki, F. An Ensemble-Boosting Algorithm for Classifying Partial Discharge Defects in Electrical Assets. Machines 2017, 5, 18. https://doi.org/10.3390/machines5030018
AMA Style
Mas’ud AA, Ardila-Rey JA, Albarracín R, Muhammad-Sukki F. An Ensemble-Boosting Algorithm for Classifying Partial Discharge Defects in Electrical Assets. Machines. 2017; 5(3):18. https://doi.org/10.3390/machines5030018
Chicago/Turabian StyleMas’ud, Abdullahi Abubakar, Jorge Alfredo Ardila-Rey, Ricardo Albarracín, and Firdaus Muhammad-Sukki. 2017. "An Ensemble-Boosting Algorithm for Classifying Partial Discharge Defects in Electrical Assets" Machines 5, no. 3: 18. https://doi.org/10.3390/machines5030018
Note that from the first issue of 2016, this journal uses article numbers instead of page numbers. See further details here.