Development of a Methodology for Condition-Based Maintenance in a Large-Scale Application Field


1
Department of Sciences and Methods for Engineering, University of Modena and Reggio Emilia, Reggio Emilia 42122, Italy
2
Tetra Pak Packaging Solutions SpA, Modena 41123, Italy
*
Author to whom correspondence should be addressed.
Machines 2018, 6(2), 17; https://doi.org/10.3390/machines6020017
Submission received: 27 February 2018
/
Revised: 9 April 2018
/
Accepted: 10 April 2018
/
Published: 16 April 2018
(This article belongs to the Special Issue Machinery Condition Monitoring and Industrial Analytics)
Abstract
:This paper describes a methodology, developed by the authors, for condition monitoring and diagnostics of several critical components in the large-scale applications with machines. For industry, the main target of condition monitoring is to prevent the machine stopping suddenly and thus avoid economic losses due to lack of production. Once the target is reached at a local level, usually through an R&D project, the extension to a large-scale market gives rise to new goals, such as low computational costs for analysis, easily interpretable results by local technicians, collection of data from worldwide machine installations, and the development of historical datasets to improve methodology, etc. This paper details an approach to condition monitoring, developed together with a multinational corporation, that covers all the critical points mentioned above.
1. Introduction
The increasing demand for more complex automation machines endowed with high efficiency, reliability, safety, and product quality requires automation companies to develop and improve cyber-physical systems (CPS) and Internet of Things (IoT) systems. These technologies manage interconnected physical systems such as actuators and sensors with cyber-computational capabilities, for example in the case of computer networks, intelligent data management for Big Data, and analytical proficiency [1]. The increasing importance of machine reliability involves the use of more efficient methods for equipment maintenance [2]. As a matter of fact, time-based maintenance (TBM) is flanked by condition-based maintenance (CBM) [3]. The TBM method consists of scheduled preventive maintenance with an estimation of the mean time between failures (MTBF). This method is very conservative because maintenance is periodically executed without the certainty of preventing incipient and random failures. The CBM method allows for real-time diagnosis of machine health. With the CBM approach, it is possible to predict critical failures of the machines several weeks in advance and achieve zero-downtime performance [4,5]. In this way the machine uptime increases, the waste cost caused by unplanned stoppages is minimized, and the warehouse for the spare parts is optimized. In the industrial field, this approach also transforms human service work by improving the collaborative human–machine skills for decision-making with respect to maintenance. The collaborative actions between condition-monitoring systems and human service operation involve a socio-cyber-physical system (SCPS) [6]. These systems are linked in a global production network where the interaction of global and individual decision-makers acts in a different way for each sub-system [7]. The new decision architecture needs a high training level from the base (i.e., service engineers, stakeholders) to the top (i.e., management) and a very efficient communication network. Without one of these two elements there is a high probability of the creation of idiosyncrasies in the SCPS that will decrease the sustainability and competitiveness of the production system [8]. In the last decades, the scientific community has developed new technologies and methodologies for condition monitoring, in accordance with the hardware available and adopted by the industry. In addition, cloud computing has become the symbol of the so-called 4.0 technology. The direct result is big-data analysis or data-driven analysis, which refer to the capability to analyze large datasets collected on the cloud, often through the use of expert systems. Diez-Olivan et al. [9] study an anomaly detection system by characterizing and modeling operational behaviors. The learning framework is performed on the basis of a machine learning approach that combines constrained k-means clustering for outlier detection with fuzzy modeling of distances to normality. The proposed solution is deployed in a CBM platform for the on-line monitoring of assets. Zhang et al. [10] propose an adaptive discrete-state model to estimate the remaining lifetime of the system based on Bayesian belief network (BBN) theory, to be used in data-driven diagnostics. Boškoski et al. [11] focus on the features trend modeling in the on-line remaining useful life (RUL) of bearings. They propose an approach for bearing fault prognostics that employs Rényi entropy-based features. This exploits the idea that the progressing fault results in an increasing dissimilarity in the distribution of energies across the vibrational spectral band which is sensitive to the bearing faults. Youree et al. [12] propose a data-driven generalized multivariate statistical analysis technique for prediction of impending failures in electronic and electromechanical equipment. Statistical analysis algorithms, integrated into a predictive fault detection statistical analysis engine, operate on heterogeneous streams of data from sensors that monitor selected equipment structural and functional parameters. The statistical analysis engine applies the trending results to determine the most probable trend, which is related to the requirements for scheduling of equipment maintenance actions. Kruger et al. [13] propose an effective and easy adaptable multivariate data-driven method for wind turbine monitoring and fault diagnosis, which consists of three parts: (1) an off-line training process; (2) an on-line monitoring phase; and (3) an on-line diagnosis phase. Langone et al. [14] effectively use least squares support vector machines (LS-SVMs) for early fault detection in an on-line fashion. In particular, they are able to distinguish between normal operating condition and abnormal situations in a vertical form fill and seal (VFFS) machine, and accurately predict the evolution of dirt accumulation in the sealing jaws. Yan and Lee [15] present a hybrid method for on-line assessment and performance prediction of remaining tool life in drilling operations based on the vibration signals. Logistic regression analysis combined with maximum likelihood technique is employed to evaluate tool wear conditions based on features extracted from vibration signals using the wavelet packet decomposition technique. The auto-regressive moving average model is then applied to predict remaining useful life based on tool wear assessment results. Alpay et al. [16] propose an on-line anomaly detection technique using a hybrid method which combines first-principles (physical) models with data-driven (empirical) models. The model output variance estimation technique is used in a statistical test to determine whether observed output measurements are statistically too far from expected output values (for given inputs) to declare that an anomaly has occurred. Park et al. [17] proposed a conceptual paper on the use of IoT for condition-based monitoring of rolling stocks. It integrates reliability, availability, maintainability, and safety (RAMS)-based maintenance methods, and IoT. RAMS-centered maintenance provides powerful rules for deciding a failure management policy, based on the estimation of probability distribution function for the real-time condition monitoring of components.
This paper presents a methodology of a modular CMS developed and used in real smart factories. The architecture defines a line guide for future implementation and enhancement in a large-scale market, taking into account the challenges of big data volume, data analysis, and collaborative work in a SCPS. This paper is organized as follows. In Section 2 the architecture of a CMS of a real industrial plant is explained. Section 3 is dedicated to the measuring and data acquisition, and Section 4 is focused on the data processing methods. Section 5 concludes the paper.
2. Condition-Monitoring Architecture
The purpose of the condition-monitoring application in the packaging machine is to reduce its unexpected breakdowns in order to, in turn, increase machine up-time (avoiding unplanned stoppages by predicting failures), reduce waste (for the same reason), and optimize operational costs (with optimal maintenance tactics based on prediction). This is achieved through a constant monitoring of critical functions to predict failures with the possibility of initiating maintenance, before the failure occurs, through regular alerts and insights. With predictive maintenance, the commitment to reliability is taken to the next level by predicting failures before they occur. Real-time monitoring of critical areas of the equipment is used to find deviations in machine functions that could lead to pauses in machine activity or breakdowns. In this process, knowledge of critical functions, expert analysis, alerts, and skilled staff to execute the event are instrumental and fundamental. The design of a CMS directly depends on the plant and the functions of each system because failure causes and effects are different. Nevertheless, the high-level architecture of the condition-monitoring system presented in this paper can be extended to any manufacturing company.
At the basis of an effective condition-based monitoring system there is an initial failure mode, effects, and criticality analysis (FMECA). FMECA analysis is a critical and powerful tool, developed by reliability engineers in the late 1950s, to highlight failure modes with relatively high probability and severity of consequences, allowing remedial efforts to be directed to the point where they will produce the greatest benefits. These benefits are precisely quantified in terms of saved costs and they are the best incentive to introduce condition-monitoring systems in industry. This paper does not cover FMECA analysis, since it should already have been performed in order to identify the most critical components. The aim of this paper is to give hints to the reader in order to build the condition monitoring system. This process ideally starts after the FMECA analysis. All the mechanical components shown in the rest of the paper are the results of an in-depth FMECA analysis that took more than one year to complete. Several books on reliability cover the foundations of FMECA analysis. The interested reader could start, for example, with the work of Birolini [18].
At the end of the condition-monitoring process, every industrial plant must have a performance management center, i.e., a team of data-scientists, managers, reliability engineers, and skilled service technicians, constantly updated on the status of the fleet of monitored components. The team schedules the interventions on the basis of a preventive maintenance policy, building a database of all the service actions, and computing statistics on the reliability of the components. The team is ready to intervene in the event of an alarm by the monitoring system and condition-monitoring algorithms based on the new data from the field are constantly updated. The performance management center implements all that is necessary for the correct management of the reliability of the system. As an example, the uncertainty quantification is fundamental for properly planning (preventive) maintenance policies. A list of these actions is out of the scope of the present paper. The interested reader could find details, for example, in the work of O’Connor and Kleyner [19].
This paper takes a packaging filling machine into account in order to prove the feasibility of the methodology. In particular, the industrial plant consists of one or more core functions (e.g., filler machines), infrastructure functions (e.g., packaging buffers and conveyors), accessory functions (e.g., cap and straw applicators), output functions (e.g., card board packers) and supervision functions (e.g., the packaging line monitoring system).
The processing of the collected data is divided into three parts: pre-processing that is carried out in the customer’s factory, cloud-processing that is performed in the cloud, and post-processing for the management of the critical states.
The flowchart of data and information throughout the process is outlined in Figure 1.
2.1. Data Acquisition
The data acquisition (DAQ) step involves the setup of the sensors on the machine, the acquisition device, and a central unit that manages the data logging. The sampling of the data can be implemented in two ways:
- Continuous Condition Monitoring; Sensors are recorded continuously. This sampling policy is recommended for those critical components with a high impact on the costs and a short time-to-failure.
- Periodic Condition Monitoring; Sensors are recorded at scheduled time intervals. This policy is particularly suitable for components with a medium–high time-to-failure.
In a condition-monitoring system with a large-scale applications there are inevitable delays related to information management: the acquisition of the data, the local pre-processing, the transfer on the cloud, the subsequent post-processing, the feedback from the data analysts, and the service support in fixing the problem. As a consequence, a robust condition-monitoring project should work mainly on periodic sampled data, keeping a time margin for the task processing. Nevertheless, critical components can be taken into account reserving computational slots, priorities, or managing the data collection on the spot for the prompt feedback of the service engineer. The periodic condition monitoring gives a margin of time to collect data from a fleet of sensors, one-by-one, limiting the stream of data and the computational resources. This architecture of the sampling policy allows us to easily update the extension of the number of sensors. The acquisition setup—i.e., the sampling frequency and the acquisition time—depends on the specific sensor and must be determined on the basis of the specific processing defined in the development stage of the condition-monitoring system. For example, the temperature changes within intervals of minutes, while vibrations need to be acquired thousands of times per second.
The data can be divided into two main classes: on-line data and off-line data as detailed below.
2.1.1. On-Line Data
In this paper, the term “on-line data” refers to informative data acquired in the working conditions of the machine. This is in contrast “off-line data”, which is collected during event independent of the working conditions. For our purposes, the “on-line data” is data collected by specific sensors in order to measure the state variables of the system. The choice of the type of the sensors, their placement, and the schedule of the data collection require the knowledge of the process, a bibliographic survey, and an analysis of the impact of sensor costs on the process. Generally, the sensors can be divided into three main classes:
- Multi-purpose external sensors; They are the most used sensors for condition monitoring. They can be applied to different components (multi-purpose), measuring the effects of impacts or events in time domain and include for example accelerometers or external temperature sensors. These sensors are not usually present in the machine and represent an extra cost for maintenance.
- Specific external sensors; They are used for a specific measurements in specific parts of the machine. Sometimes multi-purpose sensors cannot be used because of the impossibility of installation, such as environmental conditions or some possible mechanical interference with moving parts during the process. Sometimes a specific measurement is needed in a very limited but critical part of the plant, for example chemical analysis. These sensors are not usually present in the machine and represent an extra cost for maintenance. Moreover, the specificity of the measurement implies a higher cost of the sensor with respect to a multi-purpose sensor.
- Embedded sensors; They are already present in specific components of the machine, since they are used by control logics for the correct operation of the machinery. They do not represent an extra cost for maintenance. For example, in the modern servomotors there is always an encoder for position measurement, an embedded amperometer (often by means of two simple Hall sensors) for the measurement of the current absorbed by the mains, and a temperature sensor (often embedded in the encoder) for the measurement of the heat inside the motor (or at least a positive temperature coefficient (PTC) thermistor in the coils for detection of over temperature).
The main sensors used in the real case example are listed below:
- Accelerometers; These measure the vibrations of the mechanical components (e.g., rotating shafts), giving a picture of the inner health of the machine. Every month hundreds of scientific papers on the use of accelerometers for diagnostics purposes are published (multi-purpose external sensors) [20,21,22,23].
- Encoders; These measure the position of rotating parts (e.g., shafts), providing a flag at each complete rotation. In particular, encoders are increasingly present in electric motors, embedded in any servomotor with a high angular resolution (e.g., 4096 ticks per revolution). Together with accelerometers, they allow the diagnostics of the components in the angle-domain, that is, a reconstruction of the vibration signal based on the actual rotation of the component, providing immunity to speed fluctuation which can make the noise-to-signal ratio worse [24,25,26] (embedded sensors).
- Current/torque sensors; These are embedded sensors necessary for the correct operation of an electric motor. The current absorbed by the motor is proportional to the torque load applied to the motor shaft. It is straightforward that any change in the working conditions of the motor (e.g., an increase of the wear) increases the torque load and consequently the current requested (embedded sensors).
- Pressure sensors; In order to avoid any possible interference between the moving parts of the package forming line and the cables of the sensors, it is necessary to introduce pressure sensors for the indirect measurement of the wear on cutting knives (specific external sensors).
- Temperature sensors; These measure the temperature of specific components. In particular, servomotors can have an embedded temperature sensor to measure the heat inside the motor (embedded sensors).
The total number of the sensors depends on the size of the machine under control, the critical key points, and the budget available for the condition-monitoring area.
2.1.2. Off-Line Data
In this paper, the term “off-line data” refers to informative data asynchronous to the working conditions of the machine. This is the opposite of “on-line data” which is collected during events synchronous to the working conditions. For our purposes the “off-line data” is event data, i.e., the list of all technical interventions performed by service engineers. These events cover scheduled service interventions, unexpected service interventions, and production conditions of the machine. Examples of scheduled service interventions are firmware and software updating, and preventive maintenance of specific components. Examples of unexpected service interventions are breakdowns of mechanical or electronic components. De facto, the minimization of this type of interventions is the target of every condition-monitoring system. Examples of production condition events are the starting and the stopping of production and the substitution of consumables. Some off-line data can be acquired and stored automatically, for example the stopping or starting up of the machine, but most of the off-line data is manually inserted by the service engineers that perform the technical interventions or by the after-sales department which defines the scheduled operations. Off-line data is essential for condition-based maintenance and much more in the development step of the data-driven processing, showing the difference between supervised and unsupervised methods (for more details see [27,28]). The collection of the off-line data can be hardly demanded for an automated system. Consequently, proper training of the service engineers is fundamental for all the companies that want to do maintenance. By experience, not all events are declared for different reasons (the periodicity of an event may not be of concern, or is not recorded), although greater awareness of the consequences of one’s work can minimize the missing events.
2.2. Data Pre-Processing
The data collected from a single machine must be pre-processed locally, before data is sent to a high-level storage structure that will be described in the Section 2.4. The main reasons are to reduce the amount of data to be sent to the cloud platform and to decrease the latency in the decision-making process. The cloud platform costs depend on the amount of data processed, therefore aggregated data is preferable for cost reduction. Moreover, quick pre-processing can give fast alarms, since it is possible to detect the problem before the entire row of data is logged in the cloud, and send the alert to the machine promptly.
The local architecture of the condition-monitoring system is made up of:
- An industrial PC (iPC) for data manipulation;
- Data logger hardware for the acquisition of external sensors;
- Fieldbus (IEC 61158) network for data communication between the iPC and motor drives (or other embedded sensors).
The main functions of the pre-processing step are the following:
- Removal of empty or incomplete files; The condition-monitoring system records data regularly. Only a few sensors at a time collect data so as to reduce computational efforts. It could be that specific parts of the system are not working during the time frame when the corresponding sensor is acquired, generating empty or incomplete files. These files must be removed to free memory space on the storage device.
- Checking of the sensors; The measurement files are checked for inconsistency of data. Especially in manufacturing machines, processes are repeated cyclically and the expected data from sensors must contain cyclic components too (e.g., at the productivity frequency of the machine). If the data recorded by a given sensor does not show cyclic components in the spectrum, it is due to a problem on the measurement chain: the sensor, the cable, or the acquisition system. The inconsistency of the data must generate an alarm to the service engineer that will schedule a check of the sensor.
- Calculation of statistics; The computational capacity of the modern industrial personal computers allows statistical analysis on the acquired data, such as the root mean square (RMS) value, variance, kurtosis, quartiles, etc. The main advantage is data reduction; each statistic is a single scalar value compared to the thousands of points acquired by each sensor. Statistics are the features that the data-driven diagnostic method uses to make the post-processing analysis.
- Selection of specific data; If the post-processing based on data-driven analysis reports an incipient fault, a more detailed model-based analysis is performed. The performance management center can ask the local unit for specific data useful for a targeted analysis. The local unit sends those specific raw data to the cloud.
- Storage of data; The data is locally stored for a limited period of time with a backup policy (when the storage space ends the new file overwrites the oldest one). The storage is needed to provide selected raw data if asked.
- Sending of the data to the cloud; All relevant data, i.e., the statistics and the off-line data, is sent to the cloud for the post-processing step.
2.3. Data Cloud Processing
The data cloud processing mainly consists of cloud-computing data management. The statistics and off-line data for different machines are collected on the cloud and plotted with respect to time to monitor the evolution of the data constantly. Today, cloud-computation providers assure sufficient computational power to run complex algorithms and most of them already implement a Python or R-language console. De facto, these free programming languages are common languages of data scientists for statistical computing. More recently, some cloud providers have offered integration with well-known commercial software for mathematical computing. The main functions of the cloud-processing step are as follows:
- Data-driven analysis; Statistics data from every monitored subsystem of the machine are analyzed by means of data-driven machine learning techniques, such as neural-networks, support vector machines, and clustering. The machine learning system generates alarms to the performance management center, i.e., the data-scientists, who can query the local system for a more detailed analysis on specific data.
- Data transfer; The off-line data does not need further processing. In this case, the cloud acts as a simple storage device; the analysts pick up the off-line data collected from different machines for the off-line development of condition-monitoring techniques.
It must be noted that the development and the training of the machine learning techniques are not performed on the cloud, but at the performance management center. The software implemented in the data cloud-processing must be ready-to-run in order to avoid interruptions of the servers.
2.4. Data Post-Processing
The data post-processing mainly consists of reporting, decision support and detailed analysis of the data. In particular, the main functions of the post-processing step are as follows:
- Reporting; The condition-monitoring outputs are divided into several reports on the state of the sub-system components. The stakeholders of condition-monitoring reports are varied: service engineers, managers, consultants, and external service providers etc., and each of them needs different pieces of information.
- Decision support; The reports are used by the performance management center, i.e., a structured support service, in order to update historical data for modeling upgrade development, analyze criticality, query advance failure analysis of specific components, and manage the technical service.
- Model-based analysis; Once an alarm is received by the cloud-processing, more advanced signal processing tools can be used to assess more details on the fault, for example, if there is a fault in the inner or outer ring of a bearing.
- Service; If some problems are identified, a report of the situation is sent to the service engineers through a IoT device. In this way the service engineers can monitor the state of the plant at any time and in case of alarm they are warned promptly. Thanks to the analysis service, the service engineers are not only warned about an incipient failure but they are also informed about the procedure necessary for the maintenance, whether it is necessary to order the broken part, and whether it is available in the warehouse.
A web platform with a custom-driven application programming interface (API) must be developed as an infrastructure in order to satisfy different requirements of both data scientists and service engineers. They can retrieve data by using query methods or read reports through PCs or smart-phones.
3. Condition-Monitoring Algorithms
Condition-monitoring algorithms are the foundations of the maintenance policy, since they allow a reliable and fast response to incipient faults. They can create, in the customer, a feeling of confidence in condition monitoring or destroy it completely in the case of missing or false alarms. The definition of a proper algorithm requires a lot of time and its value cannot be underestimated.
Several algorithms are suggested in the scientific literature every day. Each component under test has its own fault modes, i.e., a characteristic type of fault is one due to wear and based on its geometry and dynamic conditions. For example, ball bearings are one of the most common components in mechanical design and their fault modes are related to the working conditions. In particular, the bearing is made up of an outer ring, an inner ring, rolling elements, and a cage. Each part of the bearing can be subject to damage, which can differ in the periodicities of impacts. These differences allow the recognition of the damaged components. Despite the number of possible customized components, the most common components in mechanical design are standard ones, such as bearings, gears, shafts, and electric motors, regardless of the specific industrial field. As a consequence, an initial bibliographic survey on scientific journals is the starting point for the development of a proper condition-monitoring algorithm for the data processing.
The data flow starts from the raw data acquired by sensors to the final output, usually in limited dimensionality such as binary output or low-dimensional output. The data flow can be divided into three main classes:
- Data cleaning; This includes all the procedures activated to remove inconsistent data, for example, empty measurement files, corrupted files, disconnected sensors, and broken cables, etc. This is not a proper condition-monitoring technique but it is a preparation process.
- Fault detection; This includes all the procedures suitable to recognize a fault in the system. It does not usually return the specific causes of the fault, only its presence. In most cases, anomaly detection techniques are sufficient for industrial purposes. If there is a faulty bearing in an electric motor, the motor must be completely replaced regardless of whether the fault is in the outer ring rather than in the inner one.
- Fault diagnostics; This includes all the procedures suitable to characterize the fault of a specific component and the level of the damage of the component. It is also the starting point for the estimation of the residual life of the component (prognostics) [29]. Fault diagnostics techniques are useful for redesigning a component: the detailed knowledge of the fault can suggest a better design to reduce the loads in working conditions, extending the expected life of the component.
Focusing on the fault detection and fault diagnostics techniques, the scientific literature can be divided into two main classes as well:
- Data-driven techniques; For the purposes of this paper, data-driven techniques are only used for fault detection.
- Model-based techniques; For the purposes of this paper, model-based techniques are used only for fault diagnostics.
3.1. Data-Driven Techniques
Data-driven techniques are not related to the physical system they model, but only to the input data, independent of the type of sensor. These techniques basically provide a metric of similarity among data. Common metrics are the Euclidean and the Mahalanobis distances. Machine learning techniques are an example of data-driven techniques. They require a training step and a testing step. The training step defines the expected dataset for faulty and healthy components. In this step, the off-line data defined in Section 2.1.2 has great importance since it locates time instants corresponding to the breakage of a component. Data before and after that time instant can provide a good example of faulty and healthy conditions to be used in training. The testing step is the application of the machine learning techniques to the new input data. A greater similarity between the recorded data and the faulty or healthy datasets determines the actual health status of the component. The machine learning techniques that need a training step are also known as “supervised” learning techniques. Conversely, “unsupervised” learning techniques may not need a training step, depending on the method that is used: for instance, one-class SVM needs a training phase [30], while artificial immune systems do not [31]. These techniques try to describe the data distribution of a healthy state (or a faulty one) in a complete way, so that any metric variation is an indicator of a faulty state (or a healthy one). It must be noted that machine learning techniques need a sufficient amount of historical data for training, but they also need training datasets that cover all possible fault events.
Hundreds of data-driven techniques have been developed in the literature and an exhaustive list is out of the scope of this paper. Relevant review papers have already been reported so far [32,33,34,35], demonstrating the capability of these techniques in different fields of application. Based on the direct experience of the authors, three machine learning techniques are presented below:
- Artificial neural networks (ANNs); This technique tries to mimic the biological neural networks and the way in which the pieces information are managed by the human brain. It builds a weight matrix trying to reward or penalize input features based on the error output in the training step. One or more layers, i.e., weighting matrices, can be chosen. The key component of the ANN is the backpropagation algorithm that distributes the error term back up through the layers by modifying the weights at each node. The ANN technique has been used in several research fields [36,37,38,39,40,41].
- Support vector machines (SVMs); The SVM technique [42] computes a hyperplane that divides faulty and healthy data by maximizing the distance of the hyperplane to the datasets. The dimension of the hyperplane depends on the dimension of the input data features. The key component of the SVM is the choice of kernel function, the purpose of which is to project data in a high-dimensional space where the data can be separated by the hyperplane. Once defined, the hyperplane acts as a threshold, classifying new input data into the two classes . Examples of the application of SVMs to condition monitoring can be found in [23,43,44,45,46,47].
- Autoassociative kernel regression (AAKR); This technique predicts the health status of a component thanks to the historical data deriving from a healthy dataset. New inputs are compared to the prediction of the healthy state. The difference between the two signals, i.e., the residual, is used as a metric to assess the health status of the component. Examples of AAKR applications to condition monitoring can be found in [48,49,50,51,52].
All the machine learning techniques need, as input, a subset of the acquired data. Since sampling frequencies of some sensors could exceed 10 kHz for more than 10 s, it is unthinkable to work with weighting matrices of 100,000 × 100,000 in size. Statistics are usually computed on the input data, reducing the weighting matrices to a 10 × 10 size (as an order of magnitude). The type of statistics and their number are the results of a trial-and-error process, depending also on the specific system under testing. Nevertheless, basic statistics, which describe the probability density function of a variable, are good attempt values, and include:
- RMS; This is defined as the square root of mean square;
- Variance; This is the second central moment of a real-valued random variable;
- Skewness; This is the third central moment of a real-valued random variable;
- Kurtosis; This is the fourth central moment of a real-valued random variable;
- Quartiles; These are the 25th, 50th and 75th percentiles of the input variable.
In some cases, even parameters linked to the dynamics of the machine are relevant, for example the hourly capacity of the machine during the acquisition of the sensors.
Once trained, machine learning techniques do not require high computational efforts and return a fast classification of the new input data. For these reasons, they are particularly suitable for cloud computing and can be used for the cloud-processing described in Section 2.3.
3.2. Model-Based Techniques
In the introduction of their three-part papers on process fault detection and diagnosis, Venkatasubramanian et al. [53] give a clear and exhaustive description of model-based approaches. Model-based techniques require a priori knowledge of the set of failures and the relationship between experimental data (observations) and failures (causes). This relationship is developed by using frequency-response models or dynamic models. Venkatasubramanian et al. divide the model-based methods into two classes: qualitative or quantitative. “The model is usually developed based on some fundamental understanding of the physics of the process. In quantitative models this understanding is expressed in terms of mathematical functional relationships between the inputs and outputs of the system. In contrast, in qualitative model equations these relationships are expressed in terms of qualitative functions centered around different units in a process [53]”. In automatic control, the quantitative modeling of physical system is the core part of the so-called system identification. This research field uses statistical methods to build mathematical models of dynamical systems from measured data. De facto, the system identification determines the transfer function between input and output. By abstraction, the model of the system can be represented as a box connecting inputs (working conditions) and outputs (measured data). This box can be classified into three main classes:
- White-box model; This is a model based on first principles, e.g., the Newton–Lagrange equations. It requires a deep knowledge of the system: the geometry, external loads and torques, characteristics of the materials, the type of interactions among components (e.g., friction, or impacts), masses, etc. In many cases such models will be overly complex due to the complex nature of many systems and processes. It must be noted that the development of a white-box model is not a one-shot activity but it must be continuously developed, adding more details if necessary. Examples of white-box modeling can be found in [54,55,56,57,58].
- Black-box model; No a priori model is available. The input/output relation of the system is statistically computed not considering the physics of the process at all. Most system identification algorithms focus on this type. The black-box model is similar to data-driven approaches, which are not further considered in this paper.
- Gray-box model; This model is in between the white-box and the black-box models. Although the peculiarities of what is going on inside the system are not entirely known, a certain model based on both insight into the system and experimental data is constructed [59]. The resulting model still has a number of unknown free parameters which can be estimated using system identification. An example of a gray-box is the modeling of the expected signal produced by a faulty system (i.e., the output signal of the system). In this particular case the gray-box model has been studied in depth in the literature (e.g., a ball-bearing) and it is used to simulate the expected output signal in different working conditions. The condition-monitoring analyst can use the simulated signal to develop and validate signal processing techniques. Examples of fault modeling can be found in [60,61,62,63,64,65,66,67].
Based on the level of detail required, the development of a model-based technique requires more time than a data-driven model. The model of a physical system depends on the characteristics of the system itself. Consequently, it is not possible to indicate a common development methodology that could be extended to a general physical system. Analysis of the scientific literature is the first step to modeling. Further assistance could come from specific commercial software for the modeling of physical systems, but the analysis of the physical process that takes place is unavoidable. Due to complexity and the demanding computational time, model-based techniques are particularly suitable for off-line computing of specific subsets of data. Results are generally better than those obtained by means of data-driven techniques, since the description of the fault cause is identified better. As mentioned in Section 2.4, analysis of data in advance is useful for the technical development of the redesign of components, in order to optimize geometry and to maximize the expected life of the component.
4. Results
The condition-monitoring system described in Section 2 is the result of the experience of the authors, who applied it to a fleet of industrial food packaging machines in the last decade.
Aseptic packaging machines are complex systems, with several electric motors, complex dynamics, and specific processes that guarantee the packaging of solid or liquid food in a sterilized chamber with high standards of safety for the customer. The condition-monitoring system is a further service offered to the customer in order to increase productivity and reliability. When applied to the packaging machines, the advantage of the proposed condition-monitoring framework is in terms of a strengthened relationship with the customer through mutual trust, thanks to win–win situation where the client saves days of unplanned stoppages and the supplier delivers a digital service. The customer also obtains more reliable production planning.
Following the process steps detailed in Section 2, the results for the real case application are reported below. For the sake of clarity, only pertinent results are reported to better highlight the potentiality of the methodology.
4.1. Data Acquisition
Several parts of the machine have been sensorized by means of external sensors, while other pieces of information are recorded directly by the programmable logic controllers (PLCs) and drivers controlling the electric motors. The numbers and types of on-line sensors used are listed in Table 1. Off-line data refers to the list of services performed in the machine, and the timing of power-on and power-off for each subsystem of the machine. Data is acquired daily with the acquisition setup that depends on the specific sensor used.
4.2. Data Pre-Processing
An iPC is responsible for the data acquisition, data manipulation, and logging of the data to the cloud. The functions managed in this step are detailed in Section 2.2: removal of empty or incomplete files, checking of the sensors, calculation of statistics, selection of specific data, storage of data, and sending of the data to the cloud.
Figure 2 shows an example of sensor checking. The figure compares the signals acquired by an accelerometer mounted correctly (Figure 2a) and an accelerometer mounted incorrectly (Figure 2b).
The checking of the sensors is an easy task but is very useful in order to reduce the processing time, save money, schedule technical services, and improve the reliability of the system. For example, for periodical interventions for sensors disconnected because of vibration, the use of thread-lock in the setup of accelerometers was suggested. Thanks to this simple solution, the number of disconnected sensors was dramatically reduced.
4.3. Data Cloud Processing
The statistics of the on-line data and the raw off-line data are stored in the cloud servers. Data-driven techniques elaborate input data and monitor the health status of the components.
Among the statistics listed in Section 3.1, two parameters proved to be good indicators of the healthy status of different components:
- Root mean square (RMS); This returns a measure of the mechanical and environmental noise affecting the sensor in healthy conditions. A high level of RMS may not be necessarily related to a fault, but it could be the consequence of environmental conditions. The evolution of the RMS, rather than its absolute value, is an important indicator for condition monitoring;
The trends of RMS–kurtosis in the time-domain are generated as reports in the cloud-processing step. Moreover, a support vector machine based on these two parameters has been developed for the anomaly detection of ball bearings [43]. In particular, the system under observation was a machine for the packaging of liquid products, the brushless AC motors MPL-B680B by Rockwell Automation, mounting a NSK 6309 single-raw bearing. Thirteen bearings were available; 7 of them were healthy and 6 were faulty at different levels of severity. The faulty bearings came from the field and were opened lastly, verifying the presence of a fault. Eleven bearings were tested at three different hourly capacities. Two bearings, one faulty and one healthy, were put aside for a further test of the SVM on never-seen-before bearings. Due to the cyclic motion of the motor, the acquired vibration signal was split into single machine cycles providing 1584 data-array samples: 1109 samples (70%) were used for training of the SVM, and (30%) for the testing (Table 2a), showing the confusion matrix for the resulting SVM using both RMS and kurtosis values of the data as inputs. All the samples are correctly recognized. Indeed, the anomaly detection, i.e., the classification between a healthy case and a faulty one, is a simpler task than the classification of the faulty case into subclasses (e.g., fault in the outer rather than in the inner ring of the bearing). Nevertheless, the choice of the input parameters is crucial, requiring a trial-and-error approach during the development of the data-driven technique. As an example, Table 2b shows the confusion matrix of the resulting SVM, if the RMS value only is used as input.
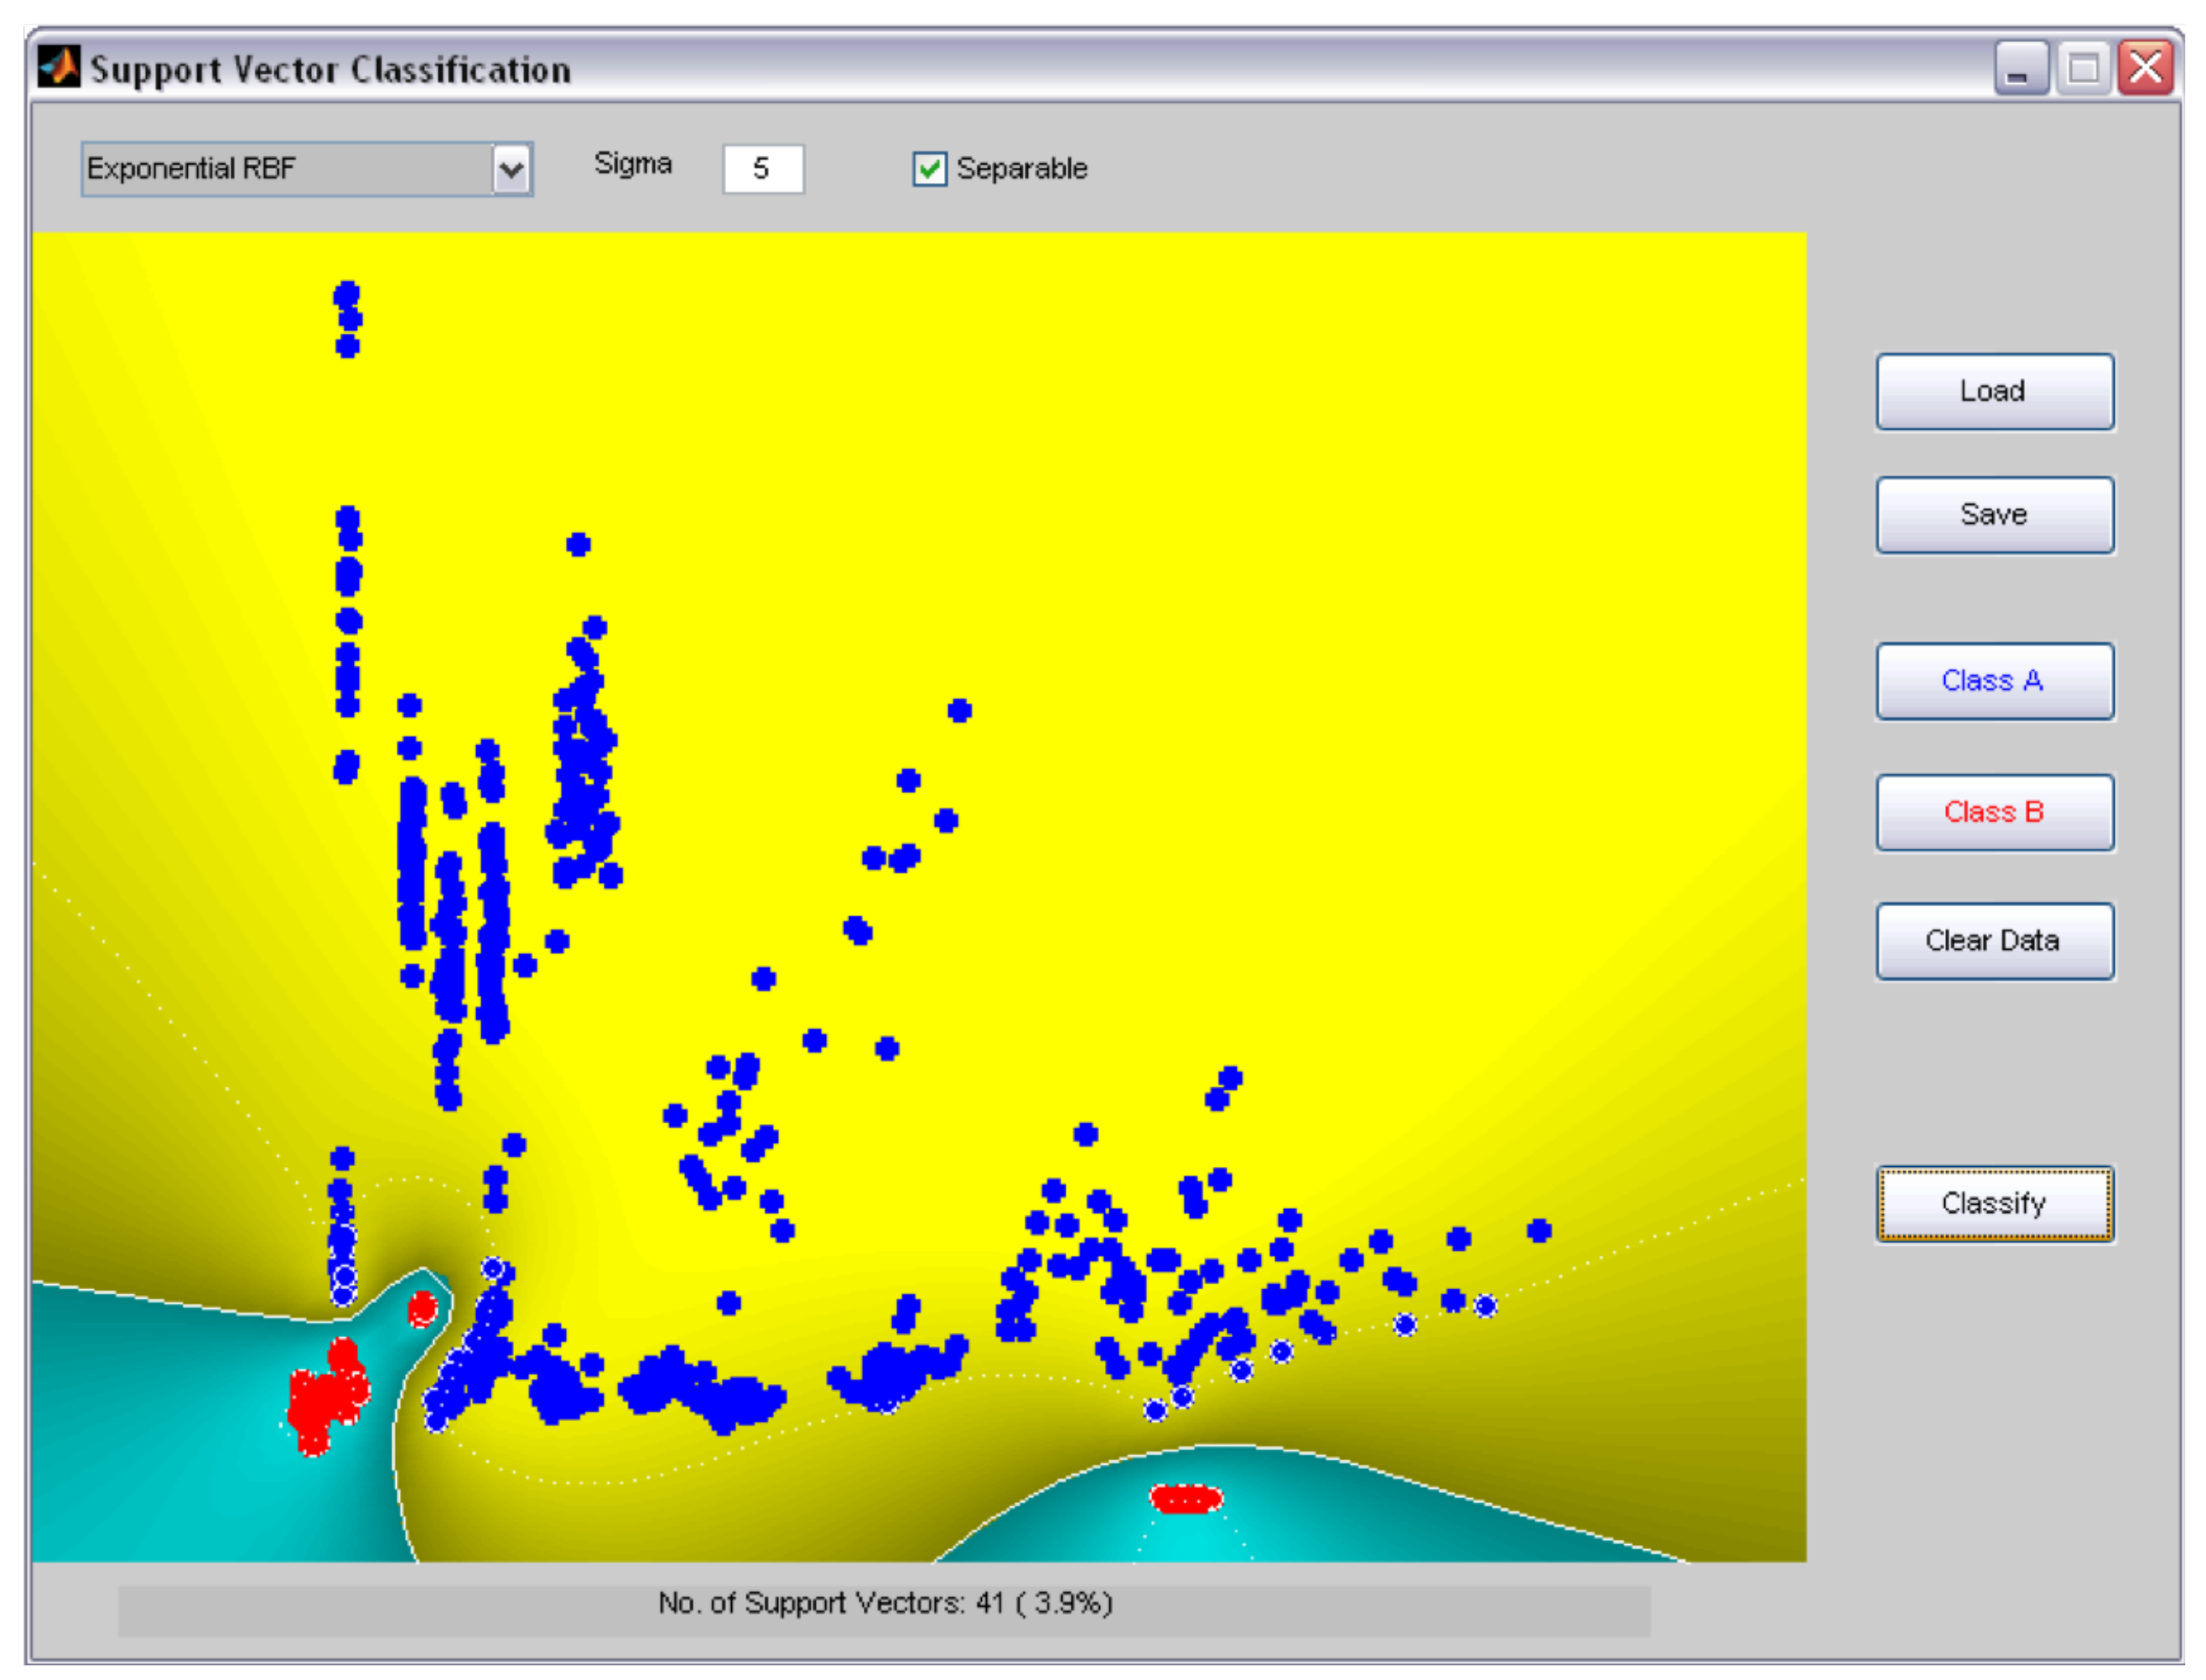
Figure 3 shows the RMS–kurtosis map with the projection of the hyperplane that divides healthy and faulty training datasets.
The developed SVM was also tested on two bearings never used during the training and testing of the SVM. One bearing was healthy, while the other was faulty. The SVM correctly classified both the bearings.
RMS and kurtosis have been successfully used for the data-driven condition monitoring of other components in the packaging machine. For example, they have been able to detect anomalies in the following cases:
- Loosening of a belt; For this type of failure mode, the system is able to detect a variation in the working conditions of the machine. This generally will end with nonstandard wear of the component due to the changing of the working conditions and a failure of the applications. The time between the detection and the functional failure can be weeks, depending on the application itself and the working conditions;
- Faulty ball bearing; This is strictly dependent on the application, motion profiles, and load condition of the bearing, but it is generally detected several weeks before catastrophic failure. This is sufficiently early to schedule the replacement intervention and avoid the unplanned stoppage of the machine;
- Poor lubrication; This depends on environmental conditions (e.g., humidity and temperature). In the case of complete missing lubrication, the degradation of mechanical components is much faster than a general wear and detection is less effective. Detection is done as soon as the point of interest is deviated from the standard working conditions and in general this is sufficient to prevent the damage of the component;
- Wear of surfaces; This is strictly dependent on the application, the motion profiles, the load condition, and environmental conditions. In particular, the monitoring system detected the loosening between a bearing and its seat. The mean time between the detection and failure is quantifiable as two months, but statistical evidence is still missing.
- Loosening of an elastic coupling; The detection depends greatly on all the kinematic chain and stress conditions of the component. The mean time between the detection and failure is quantifiable as a few days but statistical evidence is still missing.
In case of an alarm from the data-driven algorithm, the performance management center can send a service engineer to fix the problem or query the cloud infrastructure for specific raw data, providing an advanced analysis.
4.4. Data Post-Processing
The performance management center (PMC), i.e., a centralized service department, analyses the recorded data continuously , checks the status of the fleet of machines, manages technical services and develops a future release of the condition-monitoring system. The functions managed in this step are those detailed in Section 2.4: reporting, decision supporting, model-based analysis, and service management.
The ball-bearing diagnostics of servo-drive-motors show the potentiality of a model-based condition-monitoring system. Even if ball-bearings are commercial components, the working non-stationary conditions make the diagnostics challenging and non-trivial. All the related literature is based on constant speed applications. Only in the last years has the scientific community moved the focus to variable speed applications. As a consequence, ball-bearing diagnostics have been studied both modeling the physical system [70,71,72] and the expected vibration signal [61,73,74].
5. Conclusions
This paper presents a condition-monitoring methodology used in order to develop a condition-based maintenance program in a real industrial plant that could be easily scaled by both small companies and multinational corporations with a fleet of installations. It defines the guidelines for a solid CMS architecture, suggesting a hybrid approach between the classical model-based maintenance used so far and the modern data-driven approach made available as an output of big-data technologies. The proposed methodology complies with the dictates of Industry 4.0, including the advantages of the IOT, cloud computing, and cognitive computing, while linking them with solid foundations of physical modeling. The architecture of the condition-monitoring system is divided into four steps:
- Data-acquisition setup, i.e., the hardware infrastructure;
- Data pre-processing, responsible for data cleaning and quick alarm monitoring;
- Data cloud processing, responsible for data-driven analysis and high-level condition monitoring;
- Data post-processing, responsible for model-based analysis and decision support to the maintenance policy.
The resulting procedure can cope with various problems and different troubleshooting times. In particular, the second step allows a quick feedback for local problems (e.g., disconnected sensors) or condition monitoring of critical components that need a short time to be fixed. The third step requires a low computational effort (for a single query) and it can be extended to a large range of data, giving a wide-ranging vision of condition monitoring and multi-sensor fusion. The fourth step involves advanced signal processing techniques. This can require a high-computational effort but it can be applied to a limited set of key components. The suggested methodology is the result of the experience of the authors, who developed a condition-monitoring system for packaging machines. The methodology allows a scalable number of points of interest and a scalable number of components of the fleet. The procedure is validated on real industrial applications, reporting few but significant results for all the steps.
At the moment, the sensors used are not combined together, except in the monitoring of specific components. For example, the encoder signals are used to re-sample the accelerometer data from the motors in order to perform computed order tracking. In some cases, more sensors are checked in parallel in order to provide a confirmation of an abnormal operating condition of the machine. As a future development step, “data fusion” approaches will be addressed to obtain a reduction in uncertainty and more robust pieces of information from the sensors.
Acknowledgments
This study has been sponsored by Tetra Pak Packaging Solutions as part of a research fund given to the University of Modena and Reggio Emilia. Authors want to thank the anonymous reviewers who provided highly valuable comments that significantly improved the paper.
Author Contributions
Marco Cocconcelli conceived and designed the experiments; Luca Capelli performed the experiments; Marco Cocconcelli, Luca Capelli and Davide Borghi analyzed the data; Davide Borghi contributed materials/analysis tools; Marco Cocconcelli and Jacopo Cavalaglio Camargo Molano wrote the paper. Luca Capelli and Davide Borghi carried out a proofreading on the paper and provided suggestions for improvement.
Conflicts of Interest
The authors declare no conflict of interest. The founding sponsor had no role in the design of the study, in analyses, or interpretation of data and in the decision to publish the results. The founding sponsor provided the data collection and checked that no sensitive data are shared in the writing of the manuscript.
References
- Lee, J.; Bagheri, B.; Kao, H.A. A Cyber-Physical Systems architecture for Industry 4.0-based manufacturing systems. Manuf. Lett. 2015, 3, 18–23. [Google Scholar] [CrossRef]
- Peng, Y.; Dong, M.; Zuo, M. Current status of machine prognostics in condition-based maintenance: A review. Int. J. Adv. Manuf. Technol. 2010, 50, 297–313. [Google Scholar] [CrossRef]
- Durocher, D.; Feldmeier, G. Predictive versus preventive maintenance. IEEE Ind. Appl. Mag. 2004, 10, 12–21. [Google Scholar] [CrossRef]
- Goyal, D.; Pabla, B. Condition based maintenance of machine tools-A review. CIRP J. Manuf. Sci. Technol. 2015, 10, 24–35. [Google Scholar] [CrossRef]
- Hassan, A.; Gani, A.; Ab Aziz, S. An overview on condition based monitoring by vibration analysis. Def. S T Tech. Bull. 2009, 2, 42–46. [Google Scholar]
- Fleischmann, H.; Kohl, J.; Franke, J. A Modular Architecture for the Design of Condition Monitoring Processes. Procedia CIRP 2016, 57, 410–415. [Google Scholar] [CrossRef]
- Morosini Frazzona, E.; Hartmann, J.; Makuschewitz, T.; Scholz-Reiter, B. Towards Socio-Cyber-Physical Systems in Production Networks. Procedia CIRP 2013, 7, 49–54. [Google Scholar] [CrossRef]
- Smirnov, A.; Sandkuhl, K. Context-Oriented Knowledge Management for Decision Support in Business Socio-Cyber-Physical Networks: Conceptual and Methodical Foundations. In Proceedings of the 20th Conference of Open Innovations Association FRUCT, Saint-Petersburg, Russia, 3–7 April 2017. [Google Scholar]
- Diez-Olivan, A.; Pagan, J.; Sanz, R.; Sierra, B. Data-driven prognostics using a combination of constrained K-means clustering, fuzzy modeling and LOF-based score. Neurocomputing 2017, 241, 97–107. [Google Scholar] [CrossRef]
- Zhang, X.; Kang, J.; Jin, T. Degradation modeling and maintenance decisions based on bayesian belief networks. IEEE Trans. Reliab. 2014, 63, 620–633. [Google Scholar] [CrossRef]
- Boškoski, P.; Gašperin, M.; Petelin, D.; Juričić, D. Bearing fault prognostics using Rényi entropy based features and Gaussian process models. Mech. Syst. Signal Process. 2015, 52–53, 327–337. [Google Scholar] [CrossRef]
- Youree, R.; Yalowitz, J.; Corder, A.; Ooi, T. A multivariate statistical analysis technique for on-line fault prediction. In Proceedings of the International Conference on Prognostics and Health Management, Denver, CO, USA, 6–9 October 2008. [Google Scholar] [CrossRef]
- Kruger, M.; Ding, S.; Haghani, A.; Engel, P.; Jeinsch, T. A data-driven approach for sensor fault diagnosis in gearbox of wind energy conversion system. In Proceedings of the 2013 10th IEEE International Conference on Control and Automation (ICCA), Hangzhou, China, 12–14 June 2013; pp. 227–232. [Google Scholar] [CrossRef]
- Langone, R.; Alzate, C.; Ketelaere, B.D.; Vlasselaer, J.; Meert, W.; Suykens, J.A. LS-SVM based spectral clustering and regression for predicting maintenance of industrial machines. Eng. Appl. Artif. Intell. 2015, 37, 268–278. [Google Scholar] [CrossRef]
- Yan, J.; Lee, J. A hybrid method for on-line performance assessment and life prediction in drilling operations. In Proceedings of the 2007 IEEE International Conference on Automation and Logistics, Jinan, China, 18–21 August 2007; pp. 2500–2505. [Google Scholar] [CrossRef]
- Alpay, B.; Garcia, H.; Yoo, T.S. A Hybrid Model Combining First-Principles and Data-Driven Models for On-Line Condition Monitoring; American Nuclear Society: La Grange Park, IL, USA, 2006; Volume 2006, pp. 822–827. [Google Scholar]
- Park, S.; Kim, Y.; Won, J. Application of IoT for the maintaining rolling stocks. Qual. Innov. Prosper. 2017, 21, 71–83. [Google Scholar] [CrossRef]
- Birolini, A. Reliability Engineering, 8th ed.; Springer: Berlin/Heidelberg, Germany, 2017. [Google Scholar]
- O’Connor, P.; Kleyner, A. Practical Reliability Engineering; Wiley & Sons: Hoboken, NY, USA, 2012. [Google Scholar]
- Heng, A.; Zhang, S.; Tan, A.C.C.; Mathew, J. Rotating machinery prognostics: State of the art, challenges and opportunities. Mech. Syst. Signal Process. 2009, 23, 724–739. [Google Scholar] [CrossRef]
- Hameed, Z.; Hong, Y.S.; Cho, Y.; Ahn, S.; Song, C. Condition monitoring and fault detection of wind turbines and related algorithms: A review. Renew. Sustain. Energy Rev. 2009, 13, 1–39. [Google Scholar] [CrossRef]
- Carden, E.P.; Fanning, P. Vibration based condition monitoring: A review. Struct. Health Monit. 2004, 3, 355–377. [Google Scholar] [CrossRef]
- Ruiz-Gonzalez, R.; Gomez-Gil, J.; Gomez-Gil, F.J.; Martínez-Martínez, V. An SVM-Based Classifier for Estimating the State of Various Rotating Components in Agro-Industrial Machinery with a Vibration Signal Acquired from a Single Point on the Machine Chassis. Sensors 2014, 14, 20713–20735. [Google Scholar] [CrossRef] [PubMed]
- Potter, R. A new order tracking method for rotating machinery. Sound Vib. 1990, 24, 30–34. [Google Scholar]
- Fyfe, K.; Munck, E. Analysis of computed order tracking. Mech. Syst. Signal Process. 1997, 11, 187–202. [Google Scholar] [CrossRef]
- Bossley, K.; McKendrick, R.; Harris, C.; Mercer, C. Hybrid computed order tracking. Mech. Syst. Signal Process. 1999, 13, 627–641. [Google Scholar] [CrossRef]
- Hastie, T.; Tibshirani, R.; Friedman, J. The Elements of Statistical Learning: Data Mining, Inference, and Prediction; Springer: Berlin, Germany, 2009. [Google Scholar]
- Albalate, A.; Minker, W. Semi-Supervised and Unsupervised Machine Learning: Novel Strategies; Iste/Hermes Science Pub.: London, UK, 2010. [Google Scholar]
- Randall, R. Vibration-Based Condition Monitoring: Industrial, Aerospace and Automotive Applications; John Wiley & Sons: Hoboken, NJ, USA, 2010. [Google Scholar] [CrossRef]
- Shin, H.; Eom, D.H.; Kim, S.S. One-class support vector machines—An application in machine fault detection and classification. Comput. Ind. Eng. 2005, 48, 395–408. [Google Scholar] [CrossRef]
- Dasgupta, D.; Forrest, S. Artificial immune systems in industrial applications. In Proceedings of the Second International Conference on Intelligent Processing and Manufacturing of Materials, Honolulu, HI, USA, 10–15 July 1999; Volume 1, pp. 257–267. [Google Scholar] [CrossRef]
- Yin, S.; Ding, S.; Xie, X.; Luo, H. A review on basic data-driven approaches for industrial process monitoring. IEEE Trans. Ind. Electron. 2014, 61, 6414–6428. [Google Scholar] [CrossRef]
- Ge, Z. Review on data-driven modeling and monitoring for plant-wide industrial processes. Chemom. Intell. Lab. Syst. 2017, 171, 16–25. [Google Scholar] [CrossRef]
- Cerrada, M.; Sánchez, R.V.; Li, C.; Pacheco, F.; Cabrera, D.; Valente de Oliveira, J.; Vásquez, R. A review on data-driven fault severity assessment in rolling bearings. Mech. Syst. Signal Process. 2018, 99, 169–196. [Google Scholar] [CrossRef]
- Liu, R.; Yang, B.; Zio, E.; Chen, X. Artificial intelligence for fault diagnosis of rotating machinery: A review. Mech. Syst. Signal Process. 2018, 108, 33–47. [Google Scholar] [CrossRef]
- Samanta, B.; Al-Balushi, K. Artificial neural network based fault diagnostics of rolling element bearings using time-domain features. Mech. Syst. Signal Process. 2003, 17, 317–328. [Google Scholar] [CrossRef]
- Paya, B.; Esat, I.; Badi, M. Artificial neural network based fault diagnostics of rotating machinery using wavelet transforms as a preprocessor. Mech. Syst. Signal Process. 1997, 11, 751–765. [Google Scholar] [CrossRef]
- Moosavian, A.; Ahmadi, H.; Tabatabaeefar, A.; Khazaee, M. Comparison of two classifiers; K-nearest neighbor and artificial neural network, for fault diagnosis on a main engine journal-bearing. Shock Vib. 2013, 20, 263–272. [Google Scholar] [CrossRef]
- Li, N.; Mechefske, C. Induction motor fault detection and diagnosis using artificial neural networks. Int. J. COMADEM 2006, 9, 15–23. [Google Scholar]
- Patel, J.; Upadhyay, S. Comparison between Artificial Neural Network and Support Vector Method for a Fault Diagnostics in Rolling Element Bearings. Procedia Eng. 2016, 144, 390–397. [Google Scholar] [CrossRef]
- Cocconcelli, M.; Rubini, R.; Zimroz, R.; Bartelmus, W. Diagnostics of ball bearings in varying-speed motors by means of Artificial Neural Networks. In Proceedings of the Eight International Conference on Condition Monitoring and Machinery Failure Prevention Technologies, Cardiff, UK, 20–22 June 2011; Volume 2, pp. 760–771. [Google Scholar]
- Widodo, A.; Yang, B.S. Support vector machine in machine condition monitoring and fault diagnosis. Mech. Syst. Signal Process. 2007, 21, 2560–2574. [Google Scholar] [CrossRef]
- Cocconcelli, M.; Rubini, R. Support Vector Machines for condition monitoring of bearings in a varying-speed machinery. In Proceedings of the 8th International Conference on Condition Monitoring, Cardiff, UK, 20–22 June 2011. [Google Scholar]
- Sugumaran, V.; Muralidharan, V.; Ramachandran, K. Feature selection using Decision Tree and classification through Proximal Support Vector Machine for fault diagnostics of roller bearing. Mech. Syst. Signal Process. 2007, 21, 930–942. [Google Scholar] [CrossRef]
- Sugumaran, V.; Sabareesh, G.; Ramachandran, K. Fault diagnostics of roller bearing using kernel based neighborhood score multi-class support vector machine. Expert Syst. Appl. 2008, 34, 3090–3098. [Google Scholar] [CrossRef]
- Guo, L.; Chen, J.; Li, X. Rolling bearing fault classification based on envelope spectrum and support vector machine. J. Vib. Control 2009, 15, 1349–1363. [Google Scholar] [CrossRef]
- Jiang, L.L.; Yin, H.K.; Li, X.J.; Tang, S.W. Fault diagnosis of rotating machinery based on multisensor information fusion using SVM and time-domain features. Shock Vib. 2014, 2014. [Google Scholar] [CrossRef]
- Di Maio, F.; Baraldi, P.; Zio, E.; Seraoui, R. Fault detection in nuclear power plants components by a combination of statistical methods. IEEE Trans. Reliab. 2013, 62, 833–845. [Google Scholar] [CrossRef] [Green Version]
- Niu, G.; Zhao, Y.; Defoort, M.; Pecht, M. Fault diagnosis of locomotive electro-pneumatic brake through uncertain bond graph modeling and robust online monitoring. Mech. Syst. Signal Process. 2015, 50–51, 676–691. [Google Scholar] [CrossRef]
- Baraldi, P.; Di Maio, F.; Genini, D.; Zio, E. Comparison of Data-Driven Reconstruction Methods for Fault Detection. IEEE Trans. Reliab. 2015, 64, 852–860. [Google Scholar] [CrossRef]
- Baraldi, P.; Di Maio, F.; Turati, P.; Zio, E. Robust signal reconstruction for condition monitoring of industrial components via a modified Auto Associative Kernel Regression method. Mech. Syst. Signal Process. 2015, 60, 29–44. [Google Scholar] [CrossRef] [Green Version]
- Baraldi, P.; Bonfanti, G.; Zio, E. Differential evolution-based multi-objective optimization for the definition of a health indicator for fault diagnostics and prognostics. Mech. Syst. Signal Process. 2018, 102, 382–400. [Google Scholar] [CrossRef]
- Venkatasubramanian, V.; Rengaswamy, R.; Yin, K.; Kavuri, S.N. A review of process fault detection and diagnosis: Part I: Quantitative model-based methods. Comput. Chem. Eng. 2003, 27, 293–311. [Google Scholar] [CrossRef]
- Kerst, S.; Shyrokau, B.; Holweg, E. A semi-analytical bearing model considering outer race flexibility for model based bearing load monitoring. Mech. Syst. Signal Process. 2018, 104, 384–397. [Google Scholar] [CrossRef]
- Heikkinen, J.; Ghalamchi, B.; Viitala, R.; Sopanen, J.; Juhanko, J.; Mikkola, A.; Kuosmanen, P. Vibration analysis of paper machine’s asymmetric tube roll supported by spherical roller bearings. Mech. Syst. Signal Process. 2018, 104, 688–704. [Google Scholar] [CrossRef]
- Cao, H.; Niu, L.; Xi, S.; Chen, X. Mechanical model development of rolling bearing-rotor systems: A review. Mech. Syst. Signal Process. 2018, 102, 37–58. [Google Scholar] [CrossRef]
- Xi, S.; Cao, H.; Chen, X.; Niu, L. A Dynamic Modeling Approach for Spindle Bearing System Supported by Both Angular Contact Ball Bearing and Floating Displacement Bearing. J. Manuf. Sci. Eng. Trans. ASME 2018, 140. [Google Scholar] [CrossRef]
- Moshrefzadeh, A.; Fasana, A. Planetary gearbox with localised bearings and gears faults: Simulation and time/frequency analysis. Meccanica 2017, 52, 3759–3779. [Google Scholar] [CrossRef]
- Silva Souza, V.E.; Lapouchnian, A.; Mylopoulos, J. System Identification for Adaptive Software Systems: A Requirements Engineering Perspective. In International Conference on Conceptual Modeling; Jeusfeld, M., Delcambre, L., Ling, T.W., Eds.; Springer: Berlin/Heidelberg, Germany, 2011; pp. 346–361. [Google Scholar]
- Shahriar, M.; Borghesani, P.; Tan, A. Electrical Signature Analysis-based Detection of External Bearing Fault in Electromechanical Drivetrains. IEEE Trans. Ind. Electron. 2017. [Google Scholar] [CrossRef]
- Abboud, D.; Elbadaoui, M.; Becquerelle, S.; Lalmi, M. The application of the cyclic coherence for distributed planet fault detection in planetary gears. In Proceedings of the 1st World Congress on Condition Monitoring (WCCM 2017), London, UK, 13–16 June 2017. [Google Scholar]
- Feng, Z.; Ma, H.; Zuo, M. Vibration signal models for fault diagnosis of planet bearings. J. Sound Vib. 2016, 370, 372–393. [Google Scholar] [CrossRef]
- Delvecchio, S.; D’Elia, G.; Dalpiaz, G. On the use of cyclostationary indicators in IC engine quality control by cold tests. Mech. Syst. Signal Process. 2015, 60, 208–228. [Google Scholar] [CrossRef]
- Cong, F.; Chen, J.; Dong, G.; Pecht, M. Vibration model of rolling element bearings in a rotor-bearing system for fault diagnosis. J. Sound Vib. 2013, 332, 2081–2097. [Google Scholar] [CrossRef]
- Tóth, L.; Tóth, T. Construction of a realistic signal model of transients for a ball bearing with inner race fault. Acta Polytech. Hung. 2013, 10, 63–80. [Google Scholar]
- Stack, J.; Habetler, T.; Harley, R. Fault-signature modeling and detection of inner-race bearing faults. IEEE Trans. Ind. Appl. 2006, 42, 61–68. [Google Scholar] [CrossRef]
- Ericsson, S.; Grip, N.; Johansson, E.; Persson, L.E.; Sjöberg, R.; Strömberg, J.O. Towards automatic detection of local bearing defects in rotating machines. Mech. Syst. Signal Process. 2005, 19, 509–535. [Google Scholar] [CrossRef]
- Antoni, J. The spectral kurtosis: A useful tool for characterising non-stationary signals. Mech. Syst. Signal Process. 2006, 20, 282–307. [Google Scholar] [CrossRef]
- Antoni, J.; Randall, R. The Spectral Kurtosis: application to the vibratory surveillance and diagnostics of rotating machines. Mech. Syst. Signal Process. 2006, 20, 308–331. [Google Scholar] [CrossRef]
- Zimroz, R.; Bartelmus, W.; Barszcz, T.; Urbanek, J. Diagnostics of bearings in presence of strong operating conditions non-stationarity—A procedure of load-dependent features processing with application to wind turbine bearings. Mech. Syst. Signal Process. 2014, 46, 16–27. [Google Scholar] [CrossRef]
- Cotogno, M.; Pedrazzi, E.; Cocconcelli, M.; Rubini, R. Non-linear elasto-dynamic model of faulty rolling elements bearing. Mech. Mach. Sci. 2015, 21, 443–454. [Google Scholar] [CrossRef]
- Bartelmus, W.; Chaari, F.; Zimroz, R.; Haddar, M. Modelling of gearbox dynamics under time-varying nonstationary load for distributed fault detection and diagnosis. Eur. J. Mech. A/Solids 2010, 29, 637–646. [Google Scholar] [CrossRef]
- Gryllias, K.; Moschini, S.; Antoni, J. Application of Cyclo-Nonstationary Indicators for Bearing Monitoring under Varying Operating Conditions. J. Eng. Gas Turbines Power 2018, 140. [Google Scholar] [CrossRef]
- D’Elia, G.; Cocconcelli, M.; Mucchi, E. An algorithm for the simulation of faulted bearings in non-stationary conditions. Meccanica 2018, 53, 1147–1166. [Google Scholar] [CrossRef]
- Cocconcelli, M.; Bassi, L.; Secchi, C.; Fantuzzi, C.; Rubini, R. An algorithm to diagnose ball bearing faults in servomotors running arbitrary motion profiles. Mech. Syst. Signal Process. 2012, 27, 667–682. [Google Scholar] [CrossRef]
Figure 1.
Outline of condition-monitoring architecture.

Figure 2.
Comparison of the vibration signal acquired by an accelerometer mounted correctly (a) and an accelerometer mounted incorrectly (b).
Figure 2.
Comparison of the vibration signal acquired by an accelerometer mounted correctly (a) and an accelerometer mounted incorrectly (b).
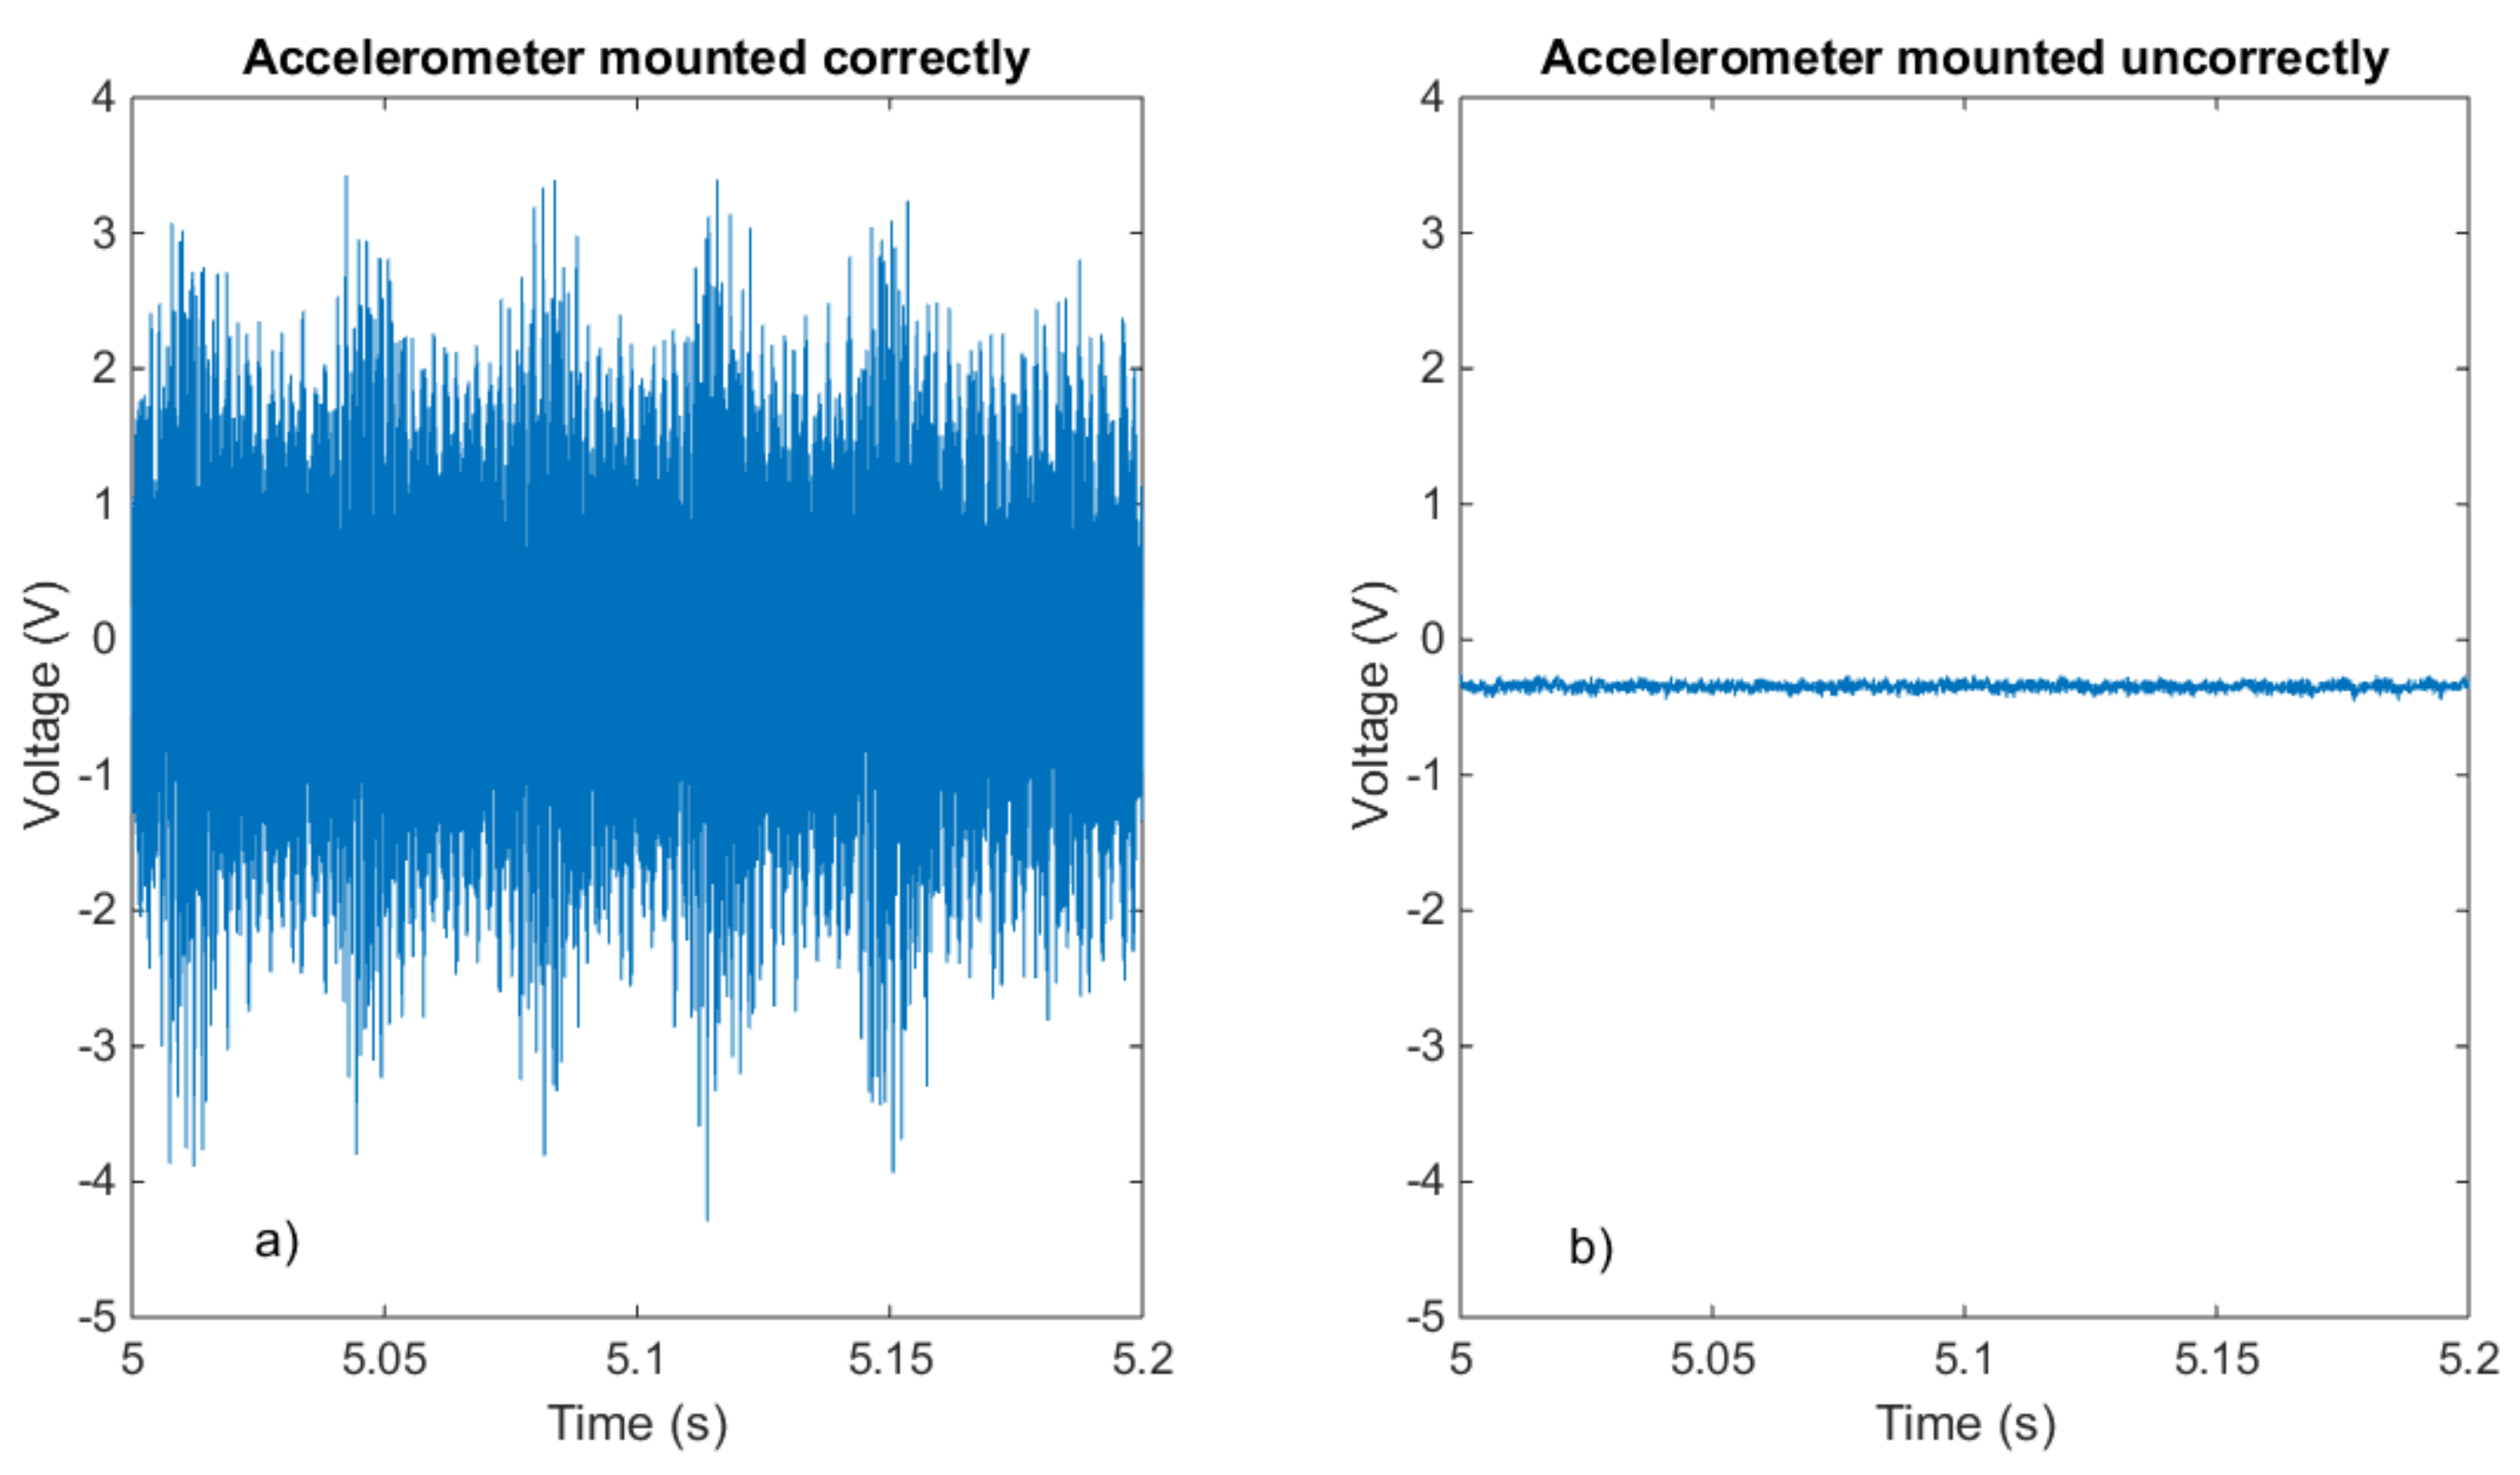
Figure 3.
RMS–kurtosis map with the projection of the hyperplane that divides healthy (red dots) and faulty (blue dots) training datasets. Toolbox developed by Prof. S.R. Gunn, University of Southampton.
Figure 3.
RMS–kurtosis map with the projection of the hyperplane that divides healthy (red dots) and faulty (blue dots) training datasets. Toolbox developed by Prof. S.R. Gunn, University of Southampton.

Figure 4.
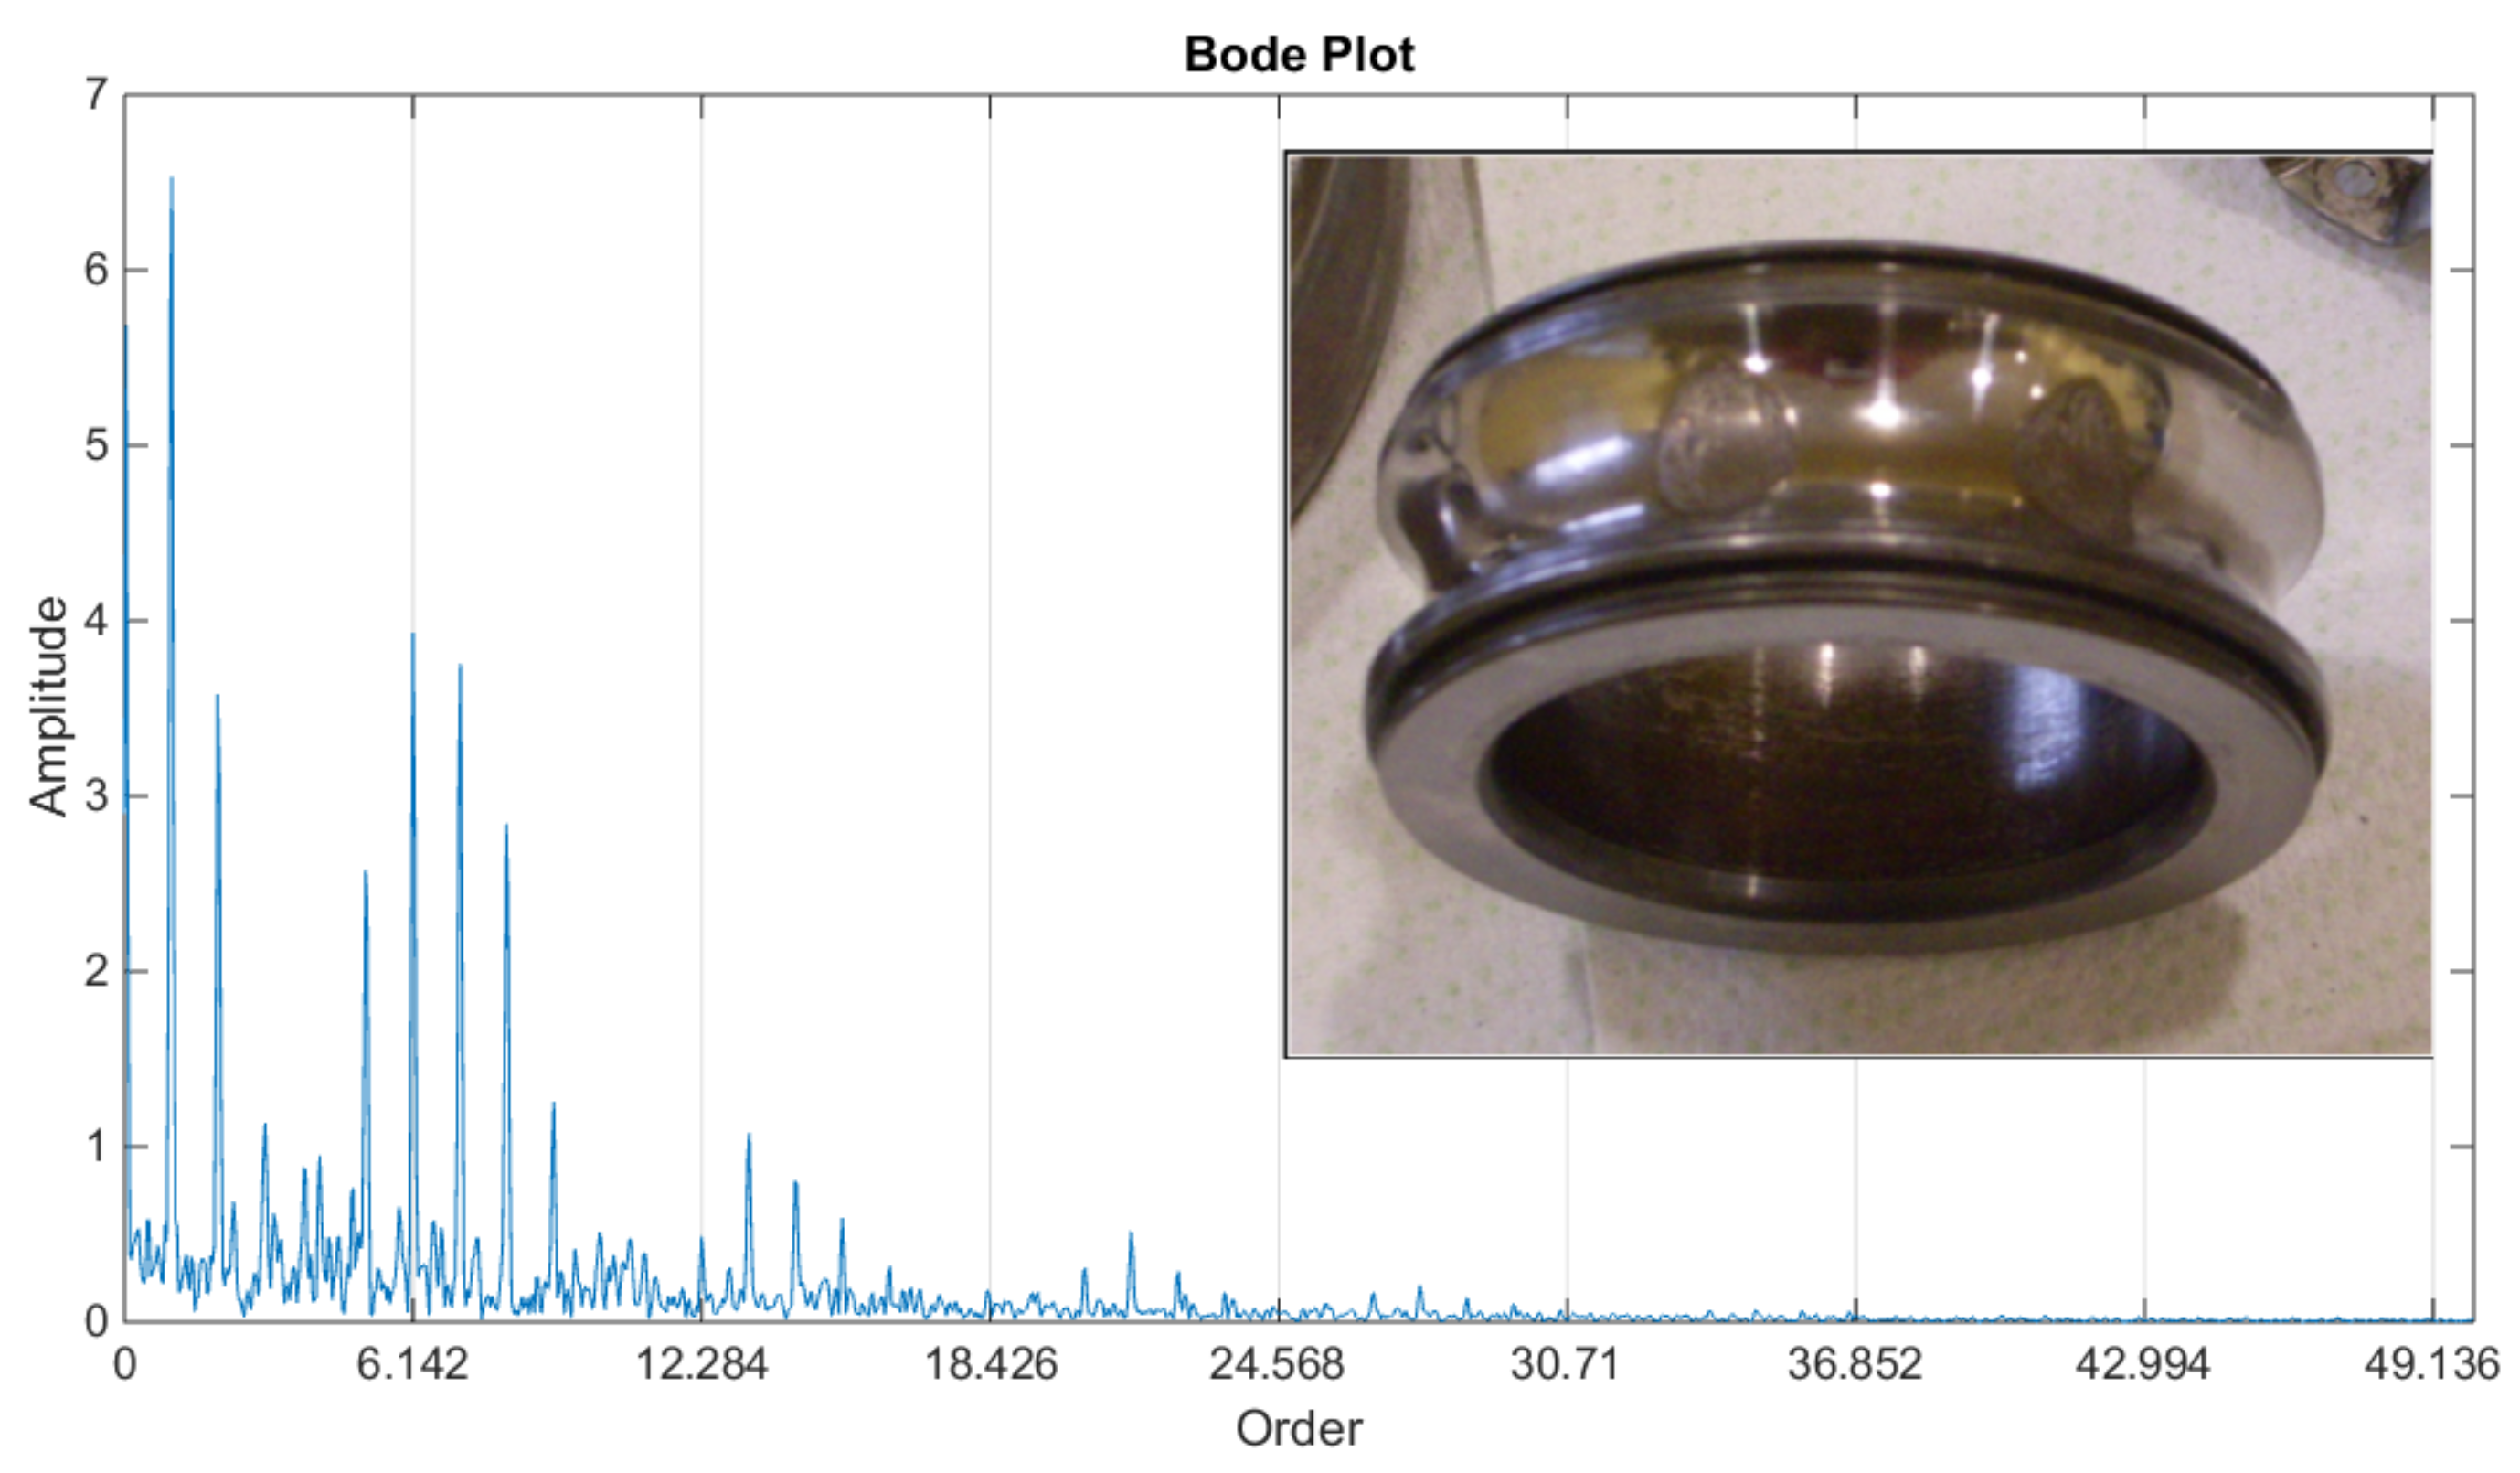
Example of the model-based technique output for condition monitoring. Order tracking and demodulation of the vibration signal reveal the presence of a fault in the inner ring of the bearing.
Figure 4.
Example of the model-based technique output for condition monitoring. Order tracking and demodulation of the vibration signal reveal the presence of a fault in the inner ring of the bearing.


Table 1.
On-line data acquired in a single packaging machine.
| Type of Sensor | Number of Sensors | Classification |
|---|---|---|
| Accelerometer | 20 | Multi-purpose external sensor |
| Encoder | 18 | Embedded sensor |
| Current sensor | 25 | Embedded sensor |
| Pressure sensor | 2 | Specific external sensor |
| Temperature sensor | 27 | Embedded sensor |
| Position sensor | 2 | Specific external sensor |
| Digital sensor | 49 | Embedded sensor |
Table 2.
Support vector machine (SVM) confusion matrices: (a) using both root mean square (RMS) and kurtosis as inputs; and (b) using only the RMS.
Table 2.
Support vector machine (SVM) confusion matrices: (a) using both root mean square (RMS) and kurtosis as inputs; and (b) using only the RMS.
| Actual | ||||
|---|---|---|---|---|
| Healthy | Faulty | |||
| (a) | Predicted | Healthy | 864 | 0 |
| Faulty | 0 | 720 | ||
| (b) | Predicted | Healthy | 729 | 0 |
| Faulty | 135 | 720 | ||
© 2018 by the authors. Licensee MDPI, Basel, Switzerland. This article is an open access article distributed under the terms and conditions of the Creative Commons Attribution (CC BY) license (http://creativecommons.org/licenses/by/4.0/).
Share and Cite
MDPI and ACS Style
Cocconcelli, M.; Capelli, L.; Cavalaglio Camargo Molano, J.; Borghi, D. Development of a Methodology for Condition-Based Maintenance in a Large-Scale Application Field. Machines 2018, 6, 17. https://doi.org/10.3390/machines6020017
AMA Style
Cocconcelli M, Capelli L, Cavalaglio Camargo Molano J, Borghi D. Development of a Methodology for Condition-Based Maintenance in a Large-Scale Application Field. Machines. 2018; 6(2):17. https://doi.org/10.3390/machines6020017
Chicago/Turabian StyleCocconcelli, Marco, Luca Capelli, Jacopo Cavalaglio Camargo Molano, and Davide Borghi. 2018. "Development of a Methodology for Condition-Based Maintenance in a Large-Scale Application Field" Machines 6, no. 2: 17. https://doi.org/10.3390/machines6020017
Note that from the first issue of 2016, this journal uses article numbers instead of page numbers. See further details here.