phylotaR: An Automated Pipeline for Retrieving Orthologous DNA Sequences from GenBank in R

 , and
, and
Abstract
:1. Introduction
2. Implementation
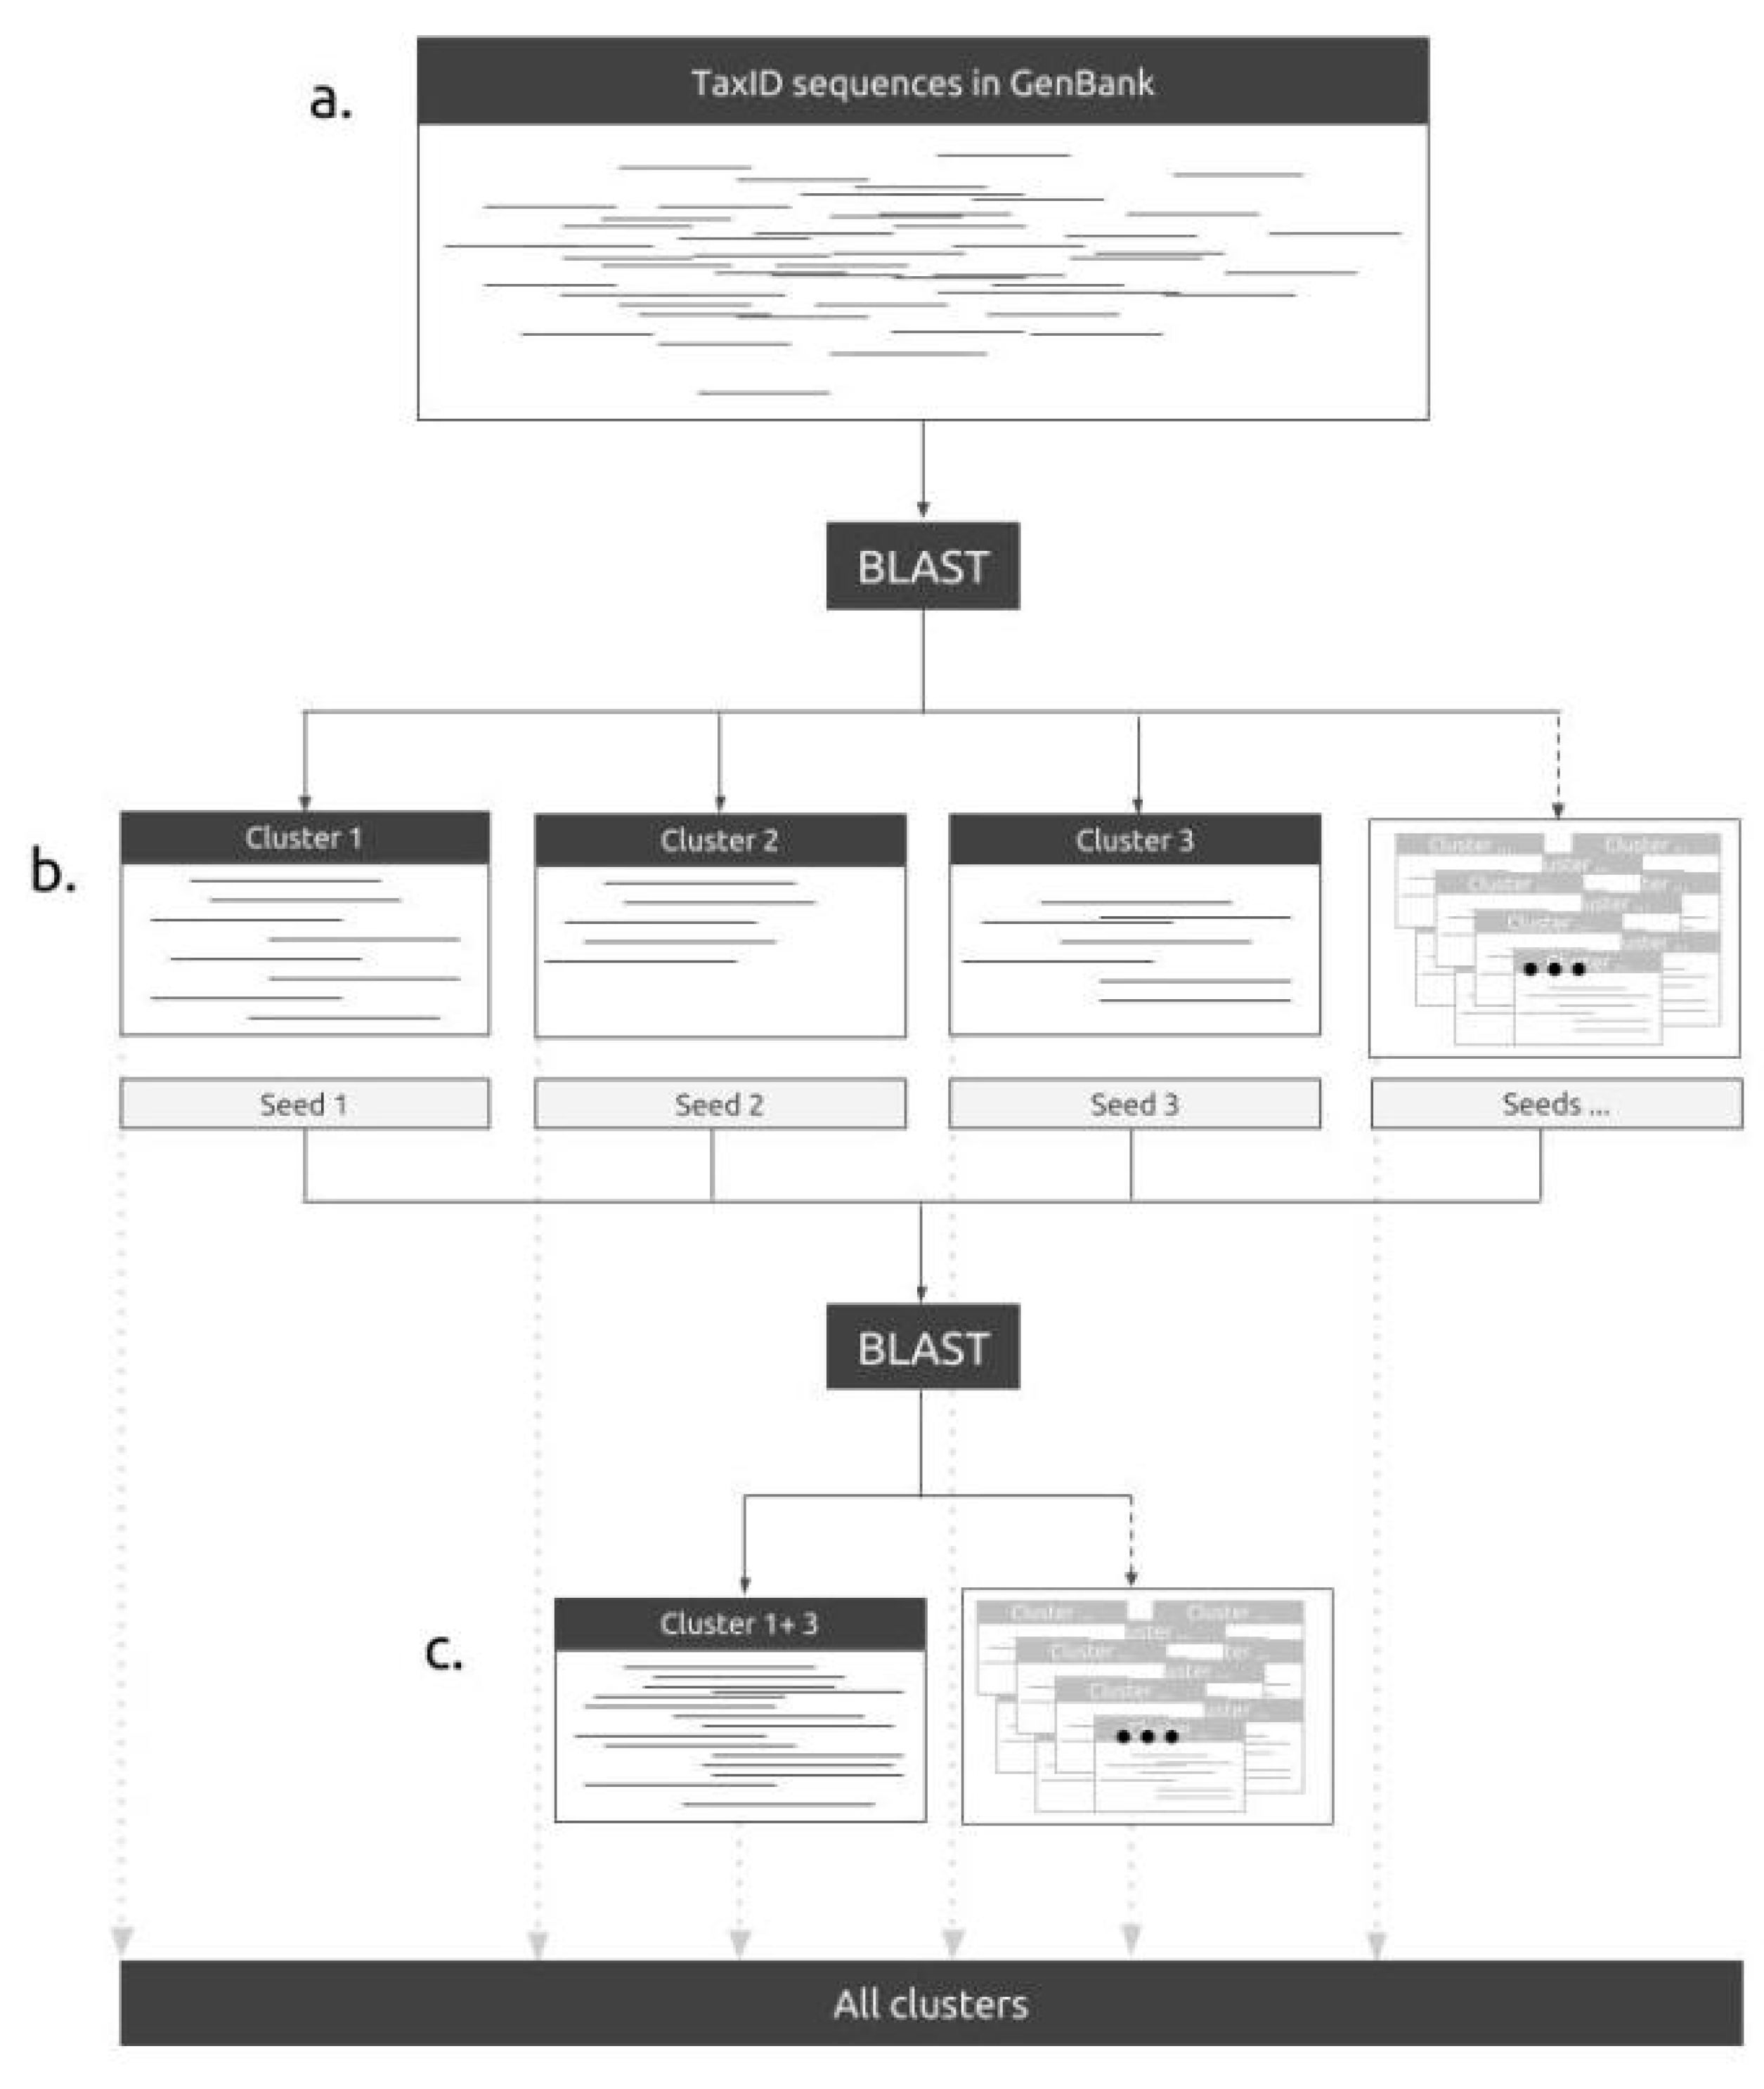
2.1. The Pipeline
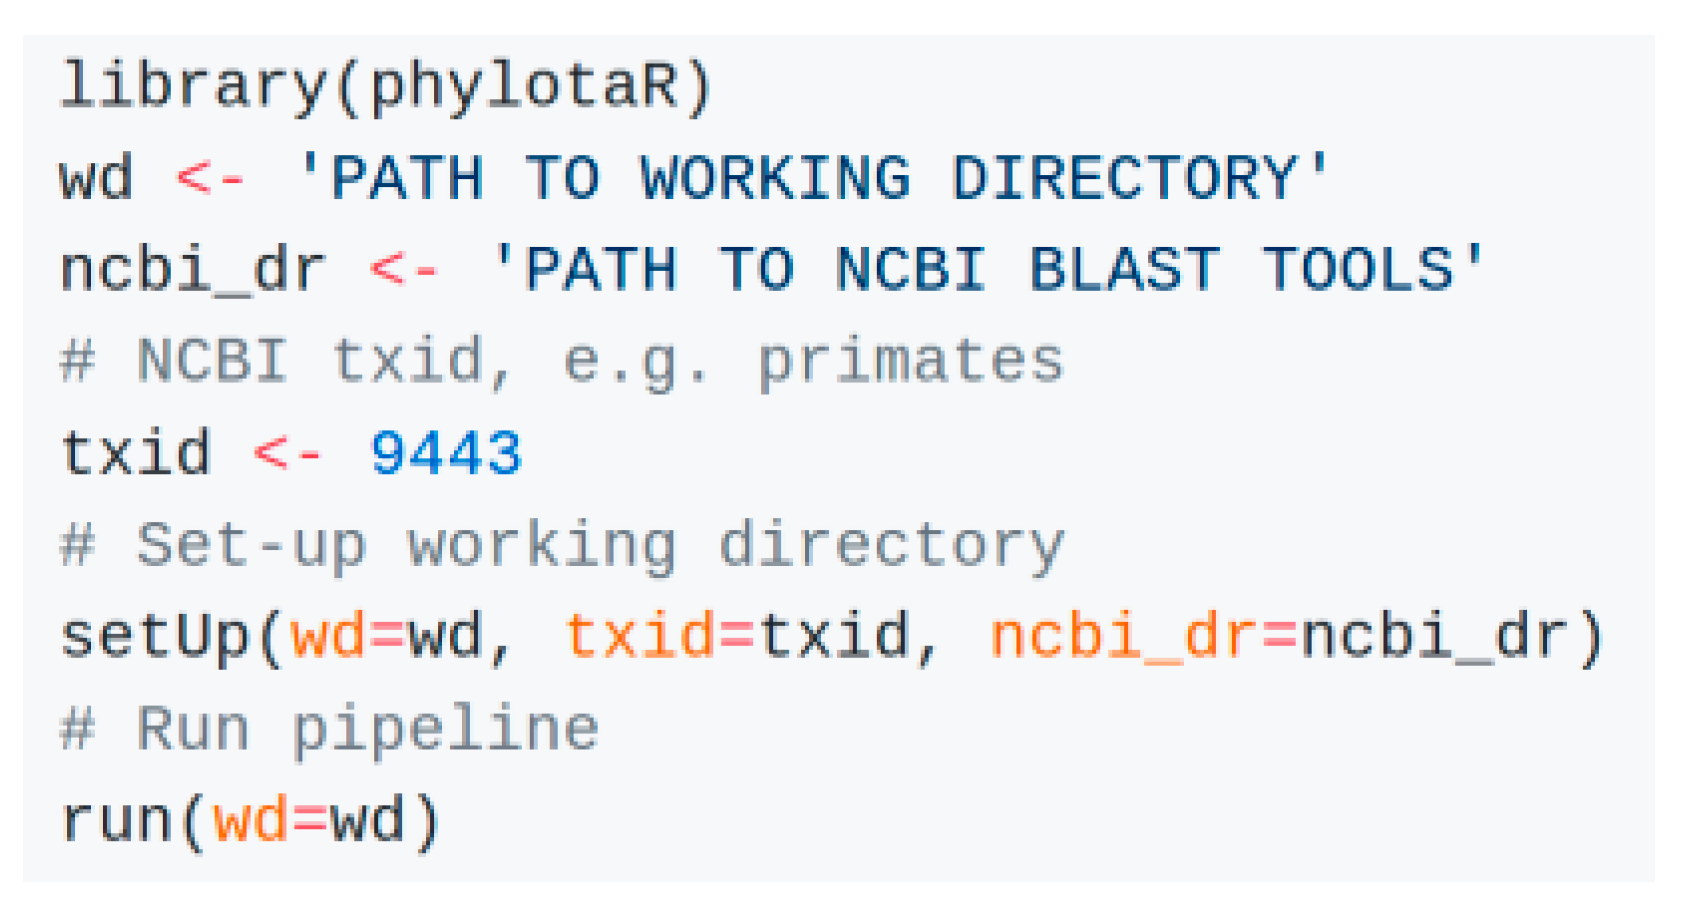
2.2. Installation, Features and Future Developments
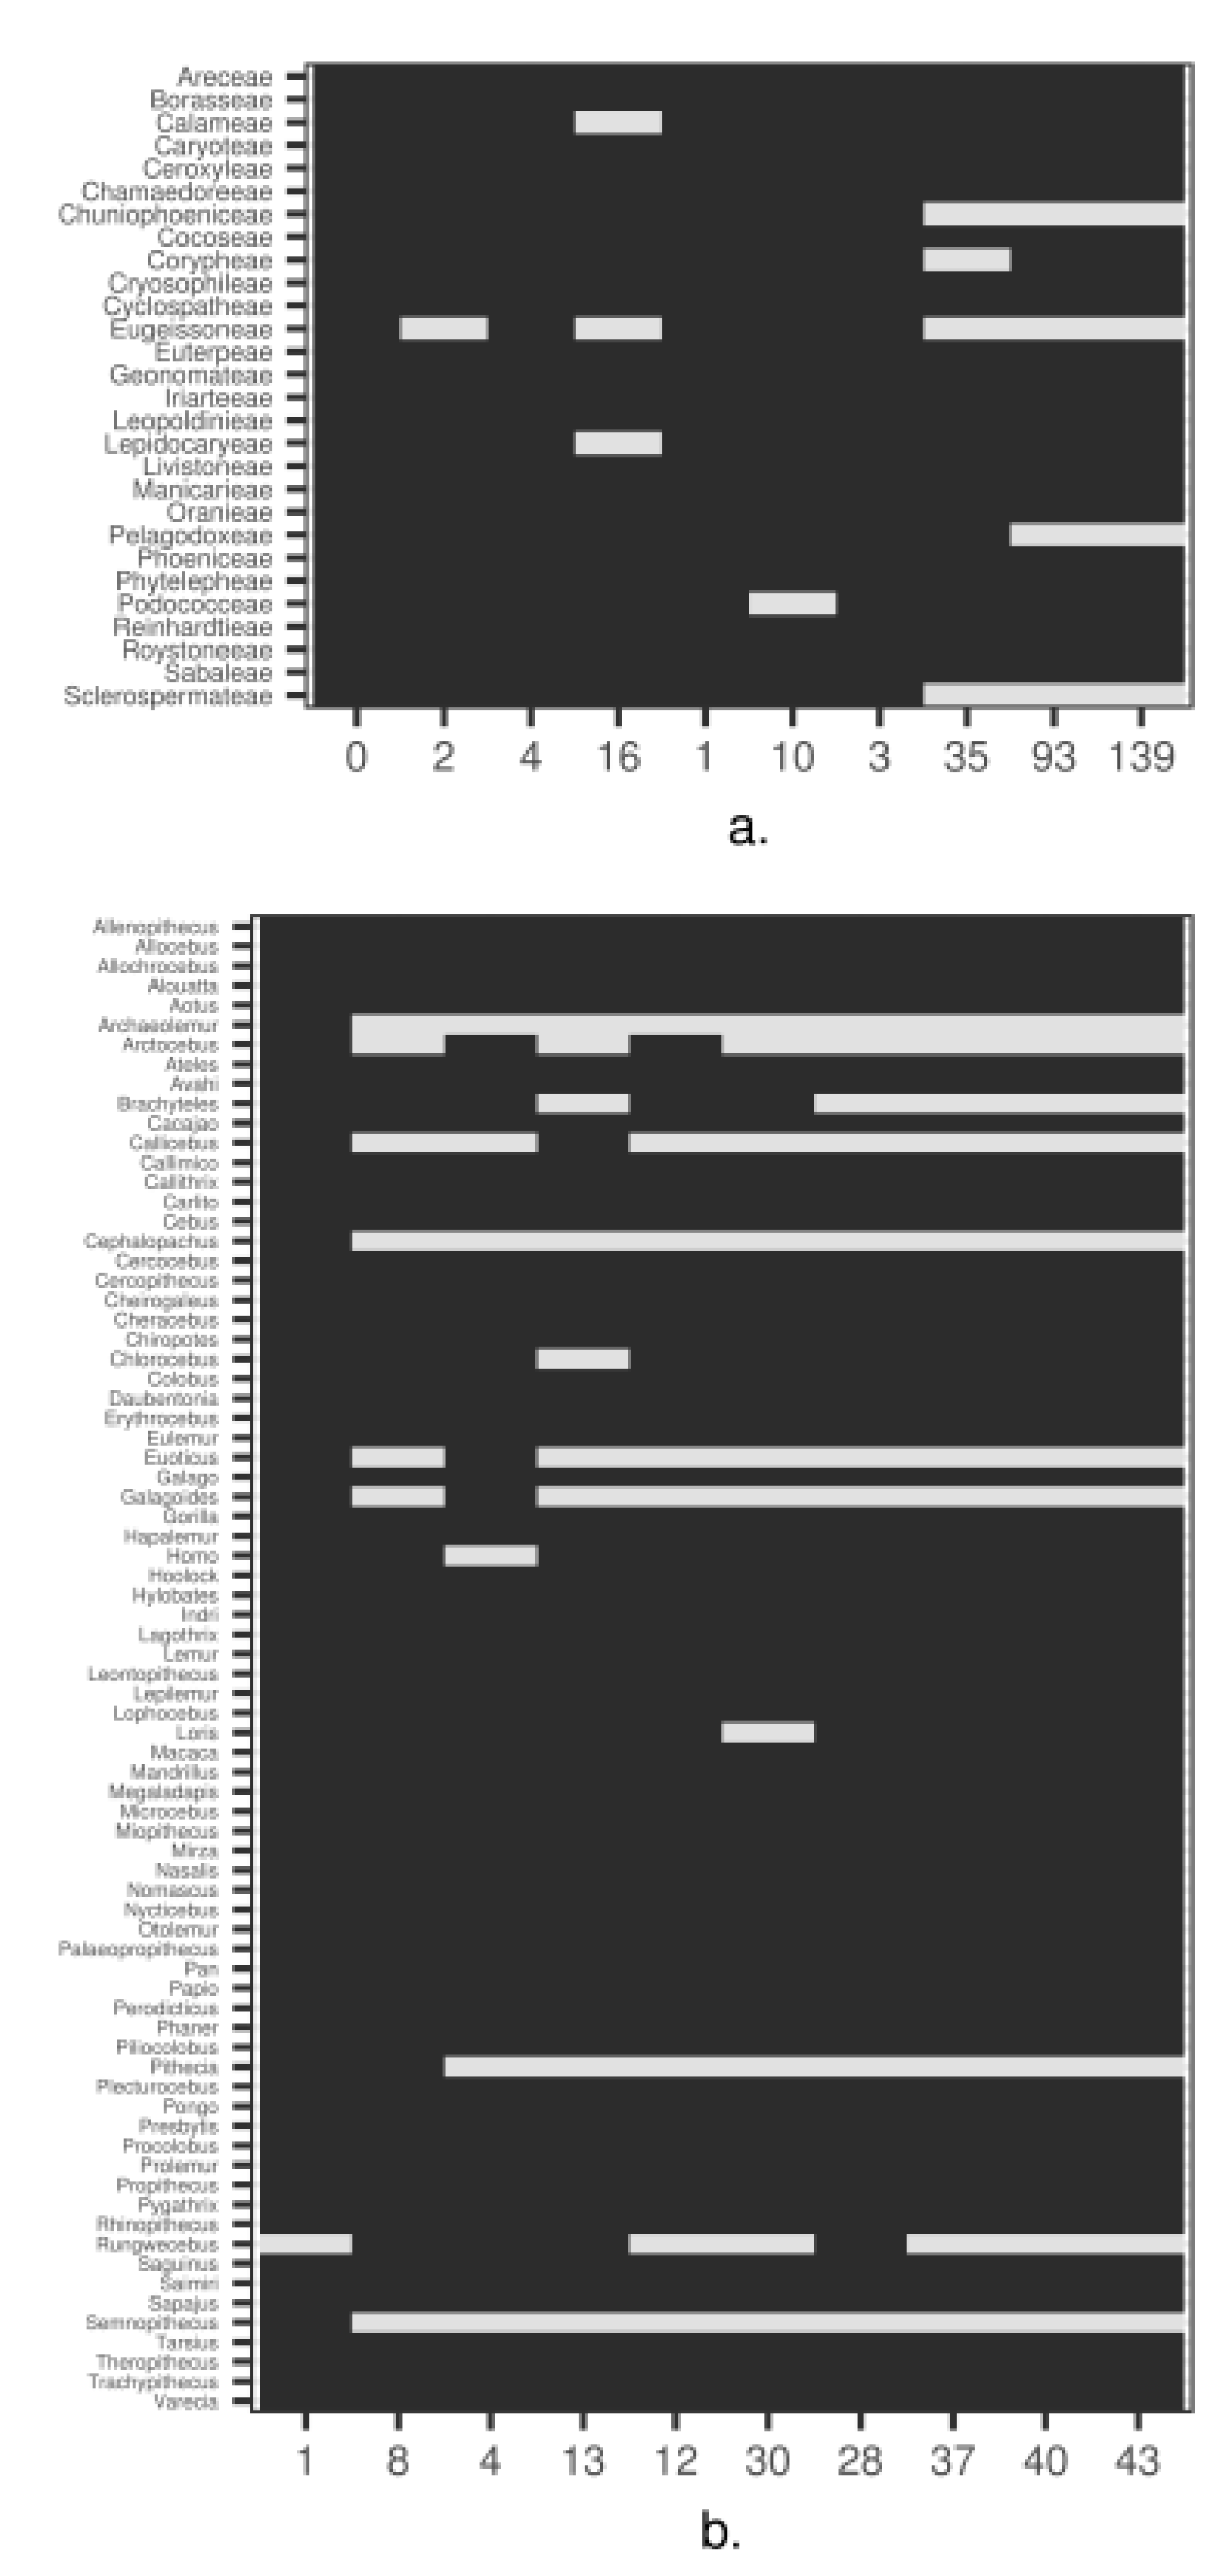
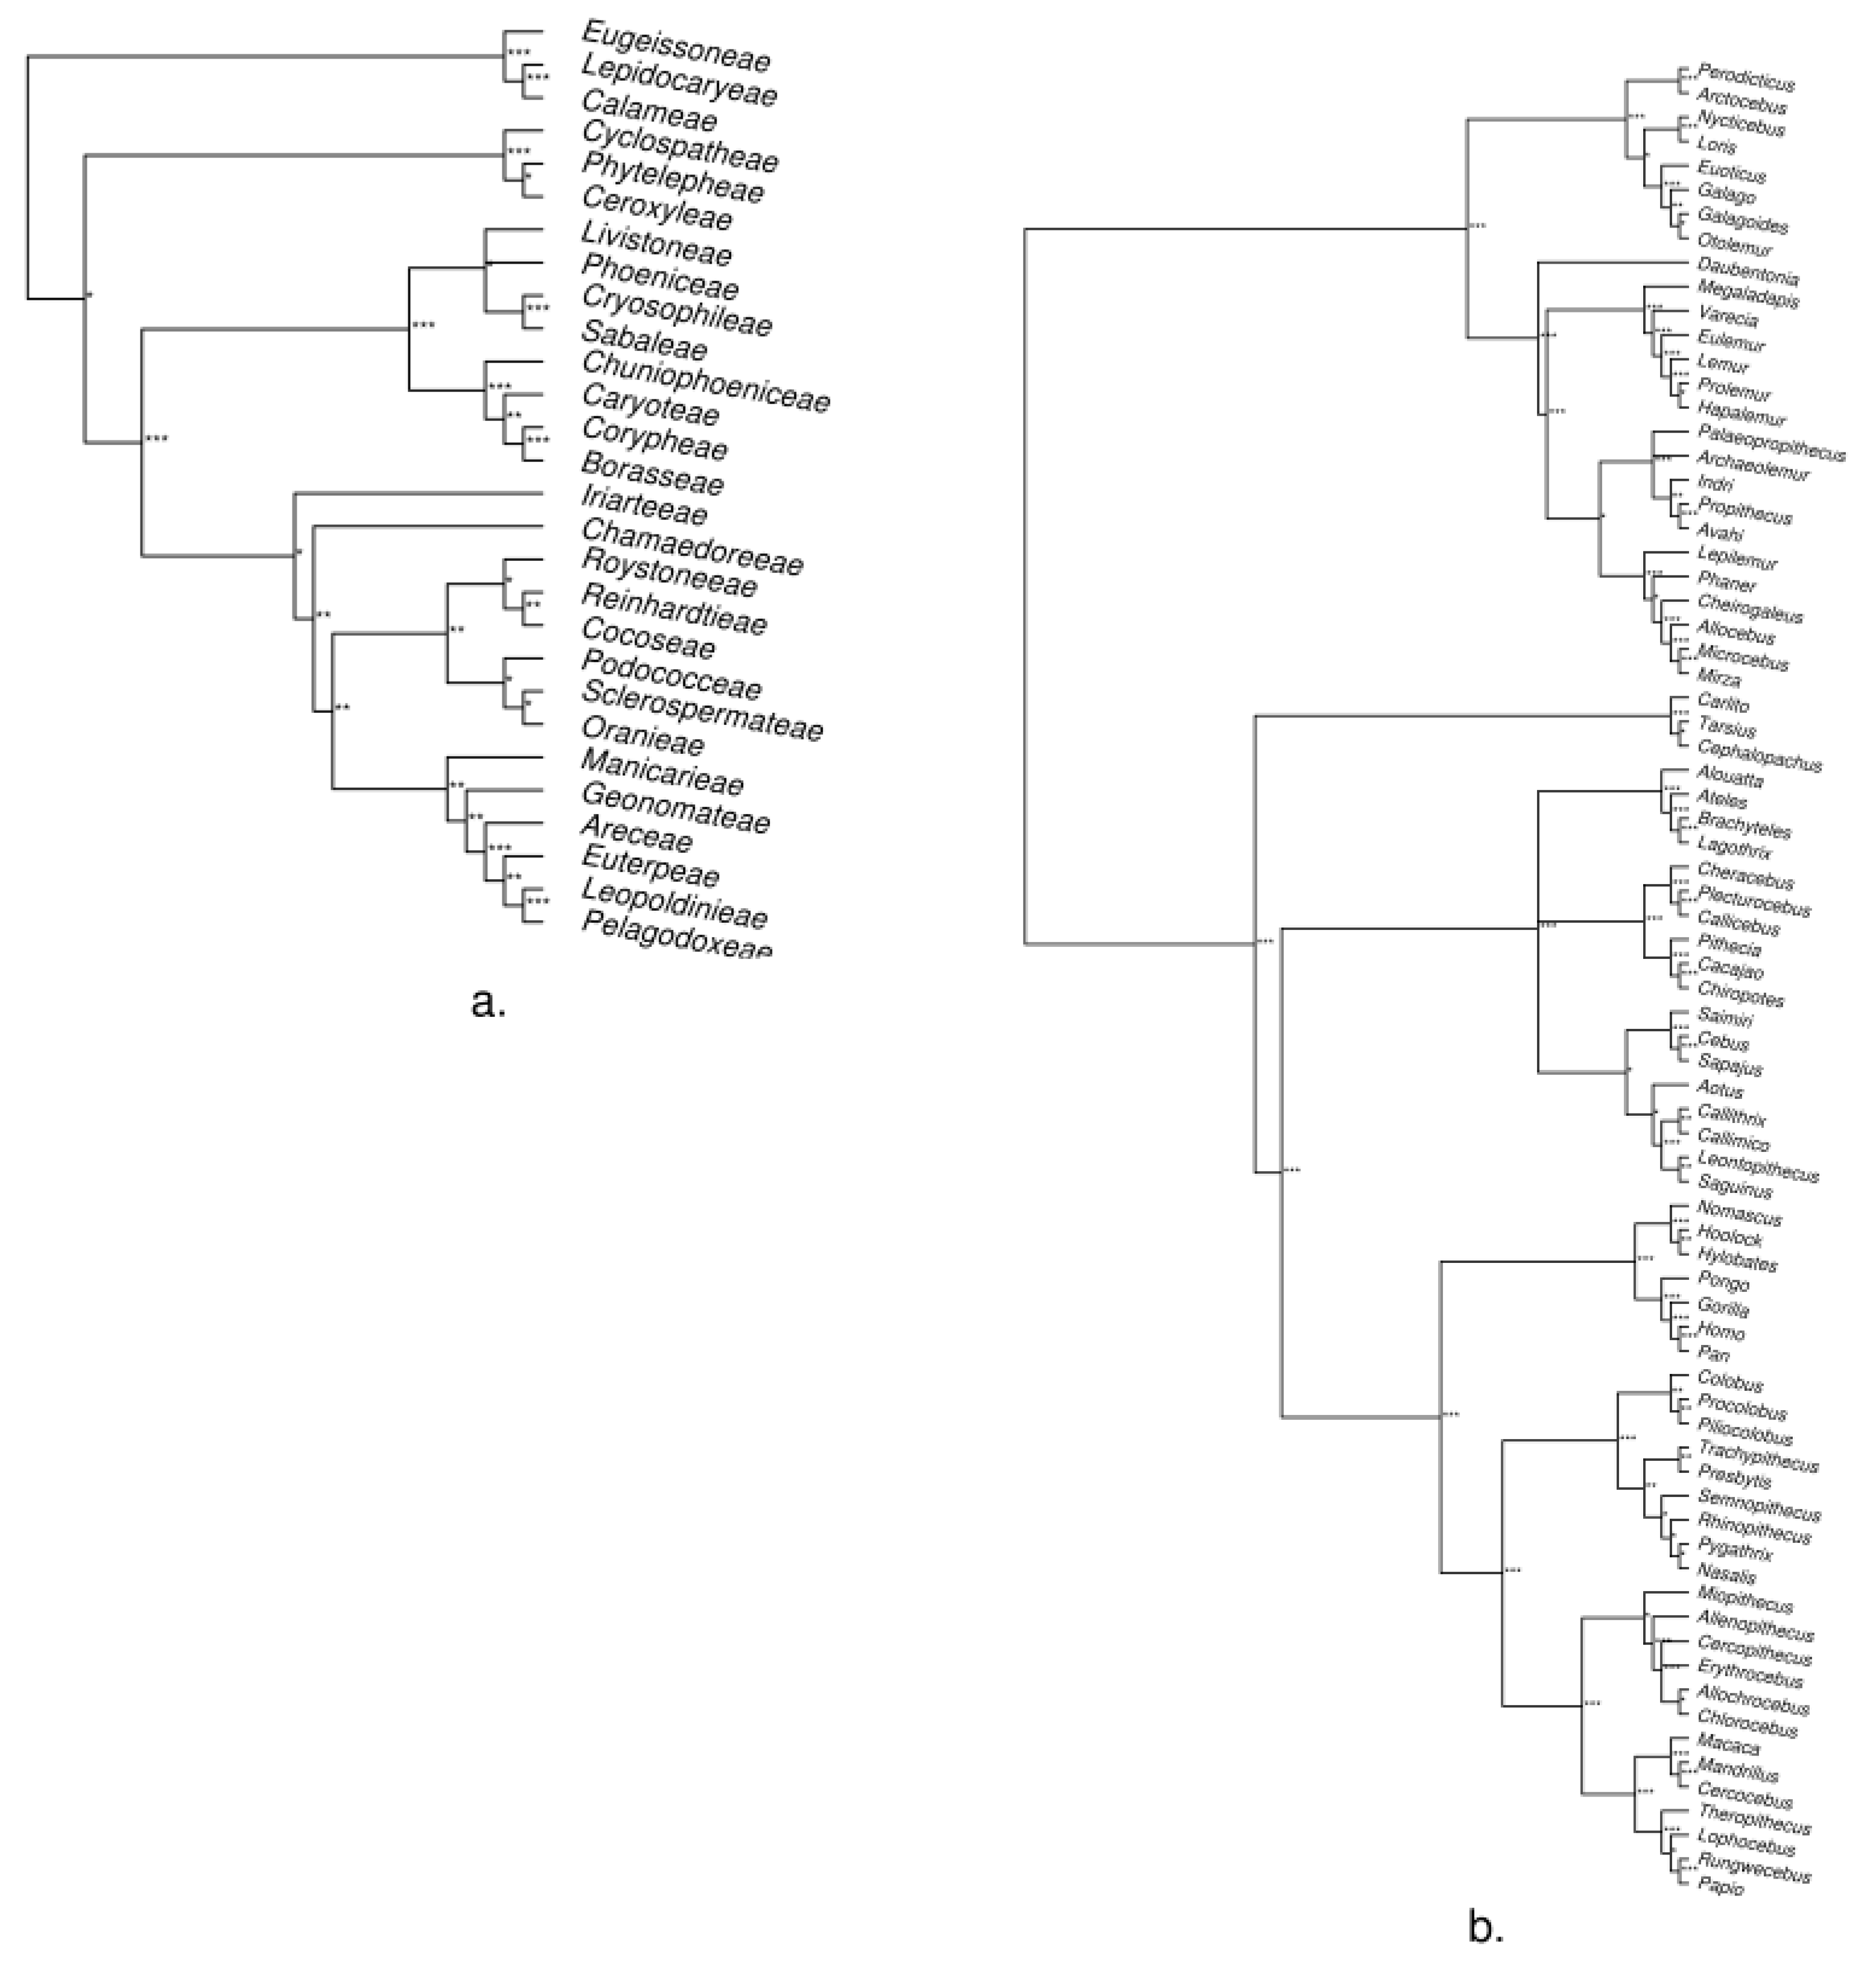
3. Empirical Demonstration: Palms and Primates
4. Conclusions
Supplementary Materials
Author Contributions
Acknowledgments
Conflicts of Interest
Appendix A. Further Pipeline Details
Appendix B. Methods and Results for Tree Assessment
References
- De Pinna, M.C.C. Concepts and tests of homoloogy in the cladistics paradigm. Cladistics 1991, 7, 367–394. [Google Scholar] [CrossRef]
- Salemi, M.; Vandamme, A.-M.; Lemey, P. The Phylogenetic Handbook: A Practical Approach to Phylogenetic Analysis and Hypothesis Testing; Cambridge University Press: Cambridge, UK, 2009. [Google Scholar]
- Benson, D.A.; Karsch-Mizrachi, I.; Clark, K.; Lipman, D.J.; Ostell, J.; Sayers, E.W. GenBank. Nucleic Acids Res. 2012, 40, D48–D53. [Google Scholar] [CrossRef] [PubMed]
- Sanderson, M.J.; Boss, D.; Chen, D.; Cranston, K.A.; Wehe, A. The PhyLoTA Browser: Processing GenBank for molecular phylogenetics research. Syst. Biol. 2008, 57, 335–346. [Google Scholar] [CrossRef] [PubMed]
- Ashelford, K.E.; Chuzhanova, N.A.; Fry, J.C.; Jones, A.J.; Weightman, A.J. At least 1 in 20 16S rRNA sequence records currently held in public repositories is estimated to contain substantial anomalies. Appl. Environ. Microbiol. 2005, 71, 7724–7736. [Google Scholar] [CrossRef] [PubMed]
- Antonelli, A.; Hettling, H.; Condamine, F.L.; Vos, K.; Nilsson, R.H.; Sanderson, M.J.; Sauquet, H.; Scharn, R.; Silvestro, D.; Töpel, M.; et al. Toward a self-updating platform for estimating rates of speciation and migration, ages, and relationships of Taxa. Syst. Biol. 2017, 66, 153–166. [Google Scholar] [CrossRef] [PubMed]
- Pearse, W.D.; Purvis, A. phyloGenerator: An automated phylogeny generation tool for ecologists. Methods Ecol. Evol. 2013, 4, 692–698. [Google Scholar] [CrossRef]
- Eiserhardt, W.L.; Antonelli, A.; Bennett, D.J.; Botigué, L.R.; Burleigh, J.G.; Dodsworth, S.; Enquist, B.J.; Forest, F.; Kim, J.T.; Kozlov, A.M.; et al. A roadmap for global synthesis of the plant tree of life. Am. J. Bot. 2018, 105, 1–9. [Google Scholar] [CrossRef] [PubMed]
- Altschul, S.F.; Gish, W.; Miller, W.; Myers, E.W.; Lipman, D.J. Basic local alignment search tool. J. Mol. Biol. 1990, 215, 403–410. [Google Scholar] [CrossRef]
- PhyLoTa Browser. Available online: Phylota.net (accessed on 28 March 2018).
- GenBank and WGS Statistics. Available online: www.ncbi.nlm.nih.gov/genbank/statistics (accessed on 28 March 2018).
- Taxonomy Browser: Taxonomy Statistics. Available online: www.ncbi.nlm.nih.gov/Taxonomy/taxonomyhome.html (accessed on 28 March 2018).
- Altenhoff, A.M.; Glover, N.M.; Train, C.M.; Kaleb, K.; Warwick Vesztrocy, A.; Dylus, D.; De Farias, T.M.; Zile, K.; Stevenson, C.; Long, J.; et al. The OMA orthology database in 2018: Retrieving evolutionary relationships among all domains of life through richer web and programmatic interfaces. Nucleic Acids Res. 2018, 46, D477–D485. [Google Scholar] [CrossRef] [PubMed]
- Waterhouse, R.M.; Zdobnov, E.M.; Tegenfeldt, F.; Li, J.; Kriventseva, E.V. OrthoDB: The hierarchical catalog of eukaryotic orthologs in 2011. Nucleic Acids Res. 2011, 39 (Suppl. 1). [Google Scholar] [CrossRef] [PubMed]
- Pearson, W.R.; Lipman, D.J. Improved tools for biological sequence comparison. Proc. Natl. Acad. Sci. USA 1988, 85, 2444–2448. [Google Scholar] [CrossRef] [PubMed]
- Wickham, H.; Hester, J.; Chang, W.; Rstudio; R Core Team. Devtools: Tools to Make Developing R Packages Easier. 2018. Available online: CRAN.R-project.org/package=devtools (accessed on 28 March 2018).
- The Comprehensive R Archive Network. Available online: Cran.r-project.org (accessed on 28 March 2018).
- Bioconda. Available online: https://bioconda.github.io/ (accessed on 7 May 2018).
- Csardi, G.; Nepusz, T. The igraph software package for complex network research. Int. J. Complex Syst. 2018, 1695, 1–9. [Google Scholar]
- Winter, D. Rentrez: Entrez in R. R Package Version 1.1.0. 2017. Available online: CRAN.R-project.org/package=rentrez (accessed on 28 March 2018).
- Lang, D.T.; The CRAN Team. XML: Tools for Parsing and Generating XML within R and S-Plus. 2018. Available online: CRAN.R-project.org/package=XML (accessed on 28 March 2018).
- Wickham, H. Ggplot2: Elegant Graphics for Data Analysis; Springer: New York, NY, USA, 2009. [Google Scholar]
- Ooms, J. Sys: Portable System Utilities. Available online: CRAN.R-project.org/package=sys (accessed on 28 March 2018).
- Bennett, D.J.; Sutton, M.D.; Turvey, S.T. Treeman: An R package for efficient and intuitive manipulation of phylogenetic trees. BMC Res. Notes 2017, 10, 30. [Google Scholar] [CrossRef] [PubMed]
- Wilkins, D. Treemapify: Draw Treemaps in ‘ggplot2’. Available online: CRAN.R-project.org/package=treemapify (accessed on 28 March 2018).
- Bengtsson, H.R. utils: Various Programming Utilities. Available online: CRAN.R-project.org/package=R.utils (accessed on 28 March 2018).
- BLAST® Command Line Applications User Manual. Available online: www.ncbi.nlm.nih.gov/books/NBK279690 (accessed on 28 March 2018).
- Transforming Science Through Open Data and Software. Available online: Ropensci.org (accessed on 28 March 2018).
- Buchfink, B.; Xie, C.; Huson, D.H. Fast and sensitive protein alignment using DIAMOND. Nat. Methods 2015, 12, 59–60. [Google Scholar] [CrossRef] [PubMed]
- Edgar, R.C. Search and clustering orders of magnitude faster than BLAST. Bioinformatics 2010, 26, 2460–2461. [Google Scholar] [CrossRef] [PubMed] [Green Version]
- Kent, W.J. BLAT—The BLAST-like alignment tool. Genome Res. 2002, 12, 656–664. [Google Scholar] [CrossRef] [PubMed]
- Nguyen, V.H.; Lavenier, D. PLAST: Parallel local alignment search tool for database comparison. BMC Bioinform. 2009, 10. [Google Scholar] [CrossRef] [PubMed]
- Entrez Molecular Sequence Database System. Available online: www.ncbi.nlm.nih.gov/Web/Search/entrezfs.html (accessed on 28 March 2018).
- Basic Local Alignment Search Tool. Available online: https://blast.ncbi.nlm.nih.gov/Blast.cgi (accessed on 28 March 2018).
- Katoh, K.; Standley, D.M. MAFFT multiple sequence alignment software version 7: Improvements in performance and usability. Mol. Biol. Evol. 2013, 30, 772–780. [Google Scholar] [CrossRef] [PubMed]
- Stamatakis, A. RAxML version 8: A tool for phylogenetic analysis and post-analysis of large phylogenies. Bioinformatics 2014, 30, 1312–1313. [Google Scholar] [CrossRef] [PubMed]
- Baker, W.J.; Savolainen, V.; Asmussen-Lange, C.B.; Chase, M.W.; Dransfield, J.; Forest, F.; Harley, M.M.; Uhl, N.W.; Wilkinson, M. Complete generic-level phylogenetic analyses of palms (Arecaceae) with comparisons of supertree and supermatrix approaches. Syst. Biol. 2009, 58, 240–256. [Google Scholar] [CrossRef] [PubMed]
- Perelman, P.; Johnson, W.E.; Roos, C.; Seuánez, H.N.; Horvath, J.E.; Moreira, M.A.M.; Kessing, B.; Pontius, J.; Roelke, M.; Rumpler, Y.; et al. A molecular phylogeny of living primates. PLoS Genet. 2011, 7, 1–17. [Google Scholar] [CrossRef] [PubMed]
- Federhen, S. The NCBI taxonomy database. Nucleic Acids Res. 2012, 40, D136–D143. [Google Scholar] [CrossRef] [PubMed]
- Robinson, D.F.; Foulds, L.R. Comparison of phylogenetic trees. Math. Biosci. 1981, 53, 131–147. [Google Scholar] [CrossRef]
- Critchlow, D.E.; Pearl, D.K.; Qian, C. The triples distance for rooted bifurcating phylogenetic trees. Syst. Biol. 1996, 45, 323–334. [Google Scholar] [CrossRef]
- Masters, J.C.; Anthony, N.M.; De Wit, M.J.; Mitchell, A. Reconstructing the evolutionary history of the Lorisidae using morphological, molecular, and geological data. Am. J. Phys. Anthropol. 2005, 127, 465–480. [Google Scholar] [CrossRef] [PubMed]
- Shi, C.M.; Yang, Z. Coalescent-based analyses of genomic sequence data provide a robust resolution of phylogenetic relationships among major groups of gibbons. Mol. Biol. Evol. 2018, 35, 159–179. [Google Scholar] [CrossRef] [PubMed]
- Osterholz, M.; Walter, L.; Roos, C. Phylogenetic position of the langur genera Semnopithecus and Trachypithecus among Asian colobines, and genus affiliations of their species groups. BMC Evolut. Biol. 2008, 8, 1–12. [Google Scholar] [CrossRef] [PubMed]
- Couvreur, T.L.P.; Forest, F.; Baker, W.J. Origin and global diversification patterns of tropical rain forests: Inferences from a complete genus-level phylogeny of palms. BMC Biol. 2011, 9. [Google Scholar] [CrossRef] [PubMed]
- Dransfield, J.; Uhl, N.W.; Asmussen-Lange, C.B.; Baker, W.J.; Harley, M.M.; Lewis, C.E. A new phylogenetic classification of the palm family, Arecaceae. Kew Bull. 2005, 60, 559–569. [Google Scholar] [CrossRef]


| phylotaR | PhyLoTa | |
|---|---|---|
| Features | ||
| Direct clades | Yes | Yes |
| Subtree clades | Yes | Yes |
| Paraphyletic clades | Yes | No |
| Merged clades | Yes | No |
| Outputs | Clusters | Clusters, alignments, trees |
| Implementation | ||
| Language | R | Perl |
| Open source | Yes | No |
| Execution | Local computer | Web-interface |
| Modular design | Yes | No |
| Resources | ||
| GenBank release | Latest | 2013 |
| Search-tool | BLAST, user-choice * | BLAST |
| Taxonomy | NCBI, user-choice * | NCBI |
| Sequence features | Yes | No |
| Non-NCBI sequences | Yes * | No |
© 2018 by the authors. Licensee MDPI, Basel, Switzerland. This article is an open access article distributed under the terms and conditions of the Creative Commons Attribution (CC BY) license (http://creativecommons.org/licenses/by/4.0/).
Share and Cite
Bennett, D.J.; Hettling, H.; Silvestro, D.; Zizka, A.; Bacon, C.D.; Faurby, S.; Vos, R.A.; Antonelli, A. phylotaR: An Automated Pipeline for Retrieving Orthologous DNA Sequences from GenBank in R. Life 2018, 8, 20. https://doi.org/10.3390/life8020020
Bennett DJ, Hettling H, Silvestro D, Zizka A, Bacon CD, Faurby S, Vos RA, Antonelli A. phylotaR: An Automated Pipeline for Retrieving Orthologous DNA Sequences from GenBank in R. Life. 2018; 8(2):20. https://doi.org/10.3390/life8020020
Chicago/Turabian StyleBennett, Dominic J., Hannes Hettling, Daniele Silvestro, Alexander Zizka, Christine D. Bacon, Søren Faurby, Rutger A. Vos, and Alexandre Antonelli. 2018. "phylotaR: An Automated Pipeline for Retrieving Orthologous DNA Sequences from GenBank in R" Life 8, no. 2: 20. https://doi.org/10.3390/life8020020