A Review of Heating and Temperature Control in Microfluidic Systems: Techniques and Applications

Abstract
:1. Introduction
![Diagnostics 03 00033 i002]() Section 2 covers external heating methods, i.e., by means of commercial heaters with some degree of integration, but entirely external approaches (such as using hot-plates) are not considered here,
Section 2 covers external heating methods, i.e., by means of commercial heaters with some degree of integration, but entirely external approaches (such as using hot-plates) are not considered here,![Diagnostics 03 00033 i002]() Section 3 using integrated heaters within the microsystem, and,
Section 3 using integrated heaters within the microsystem, and,![Diagnostics 03 00033 i002]() Section 4 heating techniques exploiting electromagnetic radiations, i.e., the liquid is directly heated in the bulk material.
Section 4 heating techniques exploiting electromagnetic radiations, i.e., the liquid is directly heated in the bulk material.![Diagnostics 03 00033 i002]() In Section 5, we introduce a range of applications that illustrate the efficacy of different heating techniques. Throughout the paper we refer to these applications, the reader not familiar with the applications is invited to refer to this section. The spectrum of applications is wide-ranging and rapidly growing; and it is not our intention to detail all the applications that may benefit from thermal control but rather to give an overview of the variety of approaches that have been adapted for different applications.
In Section 5, we introduce a range of applications that illustrate the efficacy of different heating techniques. Throughout the paper we refer to these applications, the reader not familiar with the applications is invited to refer to this section. The spectrum of applications is wide-ranging and rapidly growing; and it is not our intention to detail all the applications that may benefit from thermal control but rather to give an overview of the variety of approaches that have been adapted for different applications.


| Heating method | Level of integration | Range of temperature (°C) | Spatial distribution | Power needed (mW) | |||||||
|---|---|---|---|---|---|---|---|---|---|---|---|
| Pre-heated liquids | Joule heating | Microwaves | Chemical reactions | Constant T | Gradient T | ||||||
| homogeneous T | gradient T | Ramp rate (°C/s) | Accuracy (± °C) | Maximum value (°C/mm) | Response time | ||||||
| [36] | + | 5–45 | +4 −3 | 0.3 | |||||||
| [37] | + | 5–45 | +4 −3 | 1 | |||||||
| [38] | + + | 10–80 | 5.8 | ||||||||
| [46] | + + | 10–80 | 25 | <50 | |||||||
| [16] | + + | 5–60 | 13.75 | ~3 min | |||||||
| [40] | + + + | −3–120 | +106 −89 | 0.2 | |||||||
| [2] | + + + | 22–95 | +100 −90 | 0.1 | |||||||
| [67] | + + | 20–96 | +20 −11.5 | 0.5 | 1,000 | ||||||
| [41] | + + | 20–130 | +0.1 | 0.2 | |||||||
| [44] | + + + | 50–100 | +20 −10 | 1 | 2,200 | ||||||
| [42] | + + | 25–130 | 1,700 | ||||||||
| [15] | + + + | 25–96 | |||||||||
| [13] | + + + | 25–96 | +20 −10 | 0.2 | |||||||
| [29] | + + + | 25–55 | 11 | 1 s | 500 | ||||||
| [45] | + + + | 25–96 | +20 −20 | 0.6 | 300 | ||||||
| [20] | + + + | 25–96 | 6 | ~1 min | 500 | ||||||
| [21] | + + + | 25–96 | 40 | 500 | |||||||
| [43] | + + | 25–75 | +20 | 2 | 1,000 | ||||||
| [59] | + | 25–32 | 10 | ||||||||
| [56] | + | 20–70 | +7 | not stable | 400 | ||||||
| [57] | + | 20–96 | +65 | 0.1 | 500 | ||||||
| [64] | + + + | 21–51 | +2,000 −30,000 | 1.4 | |||||||
| [55] | + + + | 31–53 | 7.3 | 1 s | 1,000 | ||||||
| [65] | + + + | −3–76 | 1 | 0 | |||||||
2. External Heating
2.1. Homogeneous Temperature


2.2. Temperature Gradient
3. Integrated Heating


3.1. Homogeneous Temperature


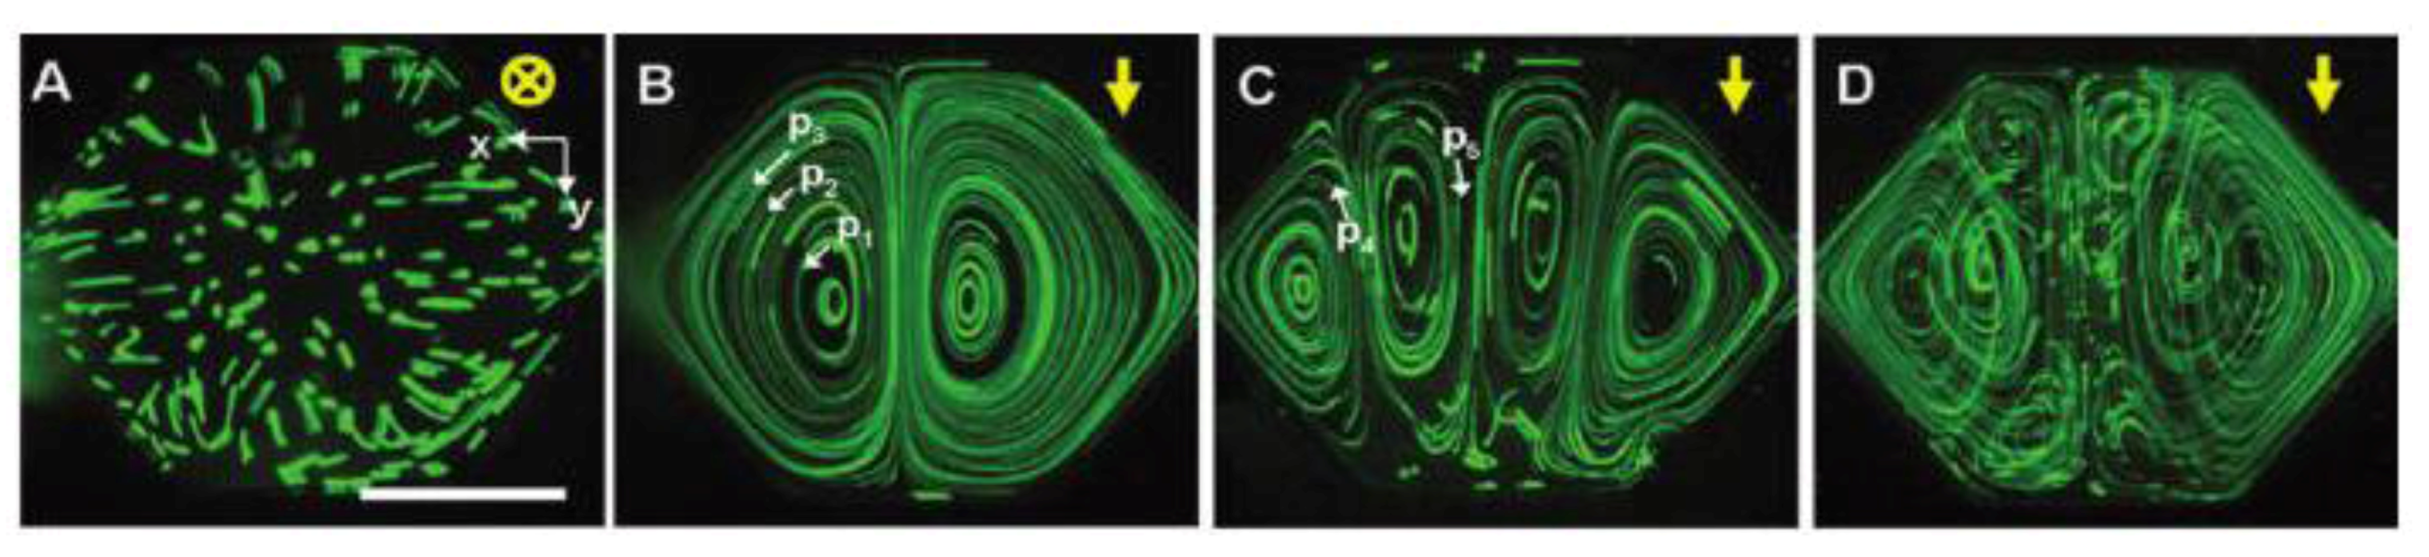
3.2. Temperature Gradient


 was used to determine the degree of mixing in the chamber, where I is the normalized intensity of each pixel.
4. Electromagnetic Radiation
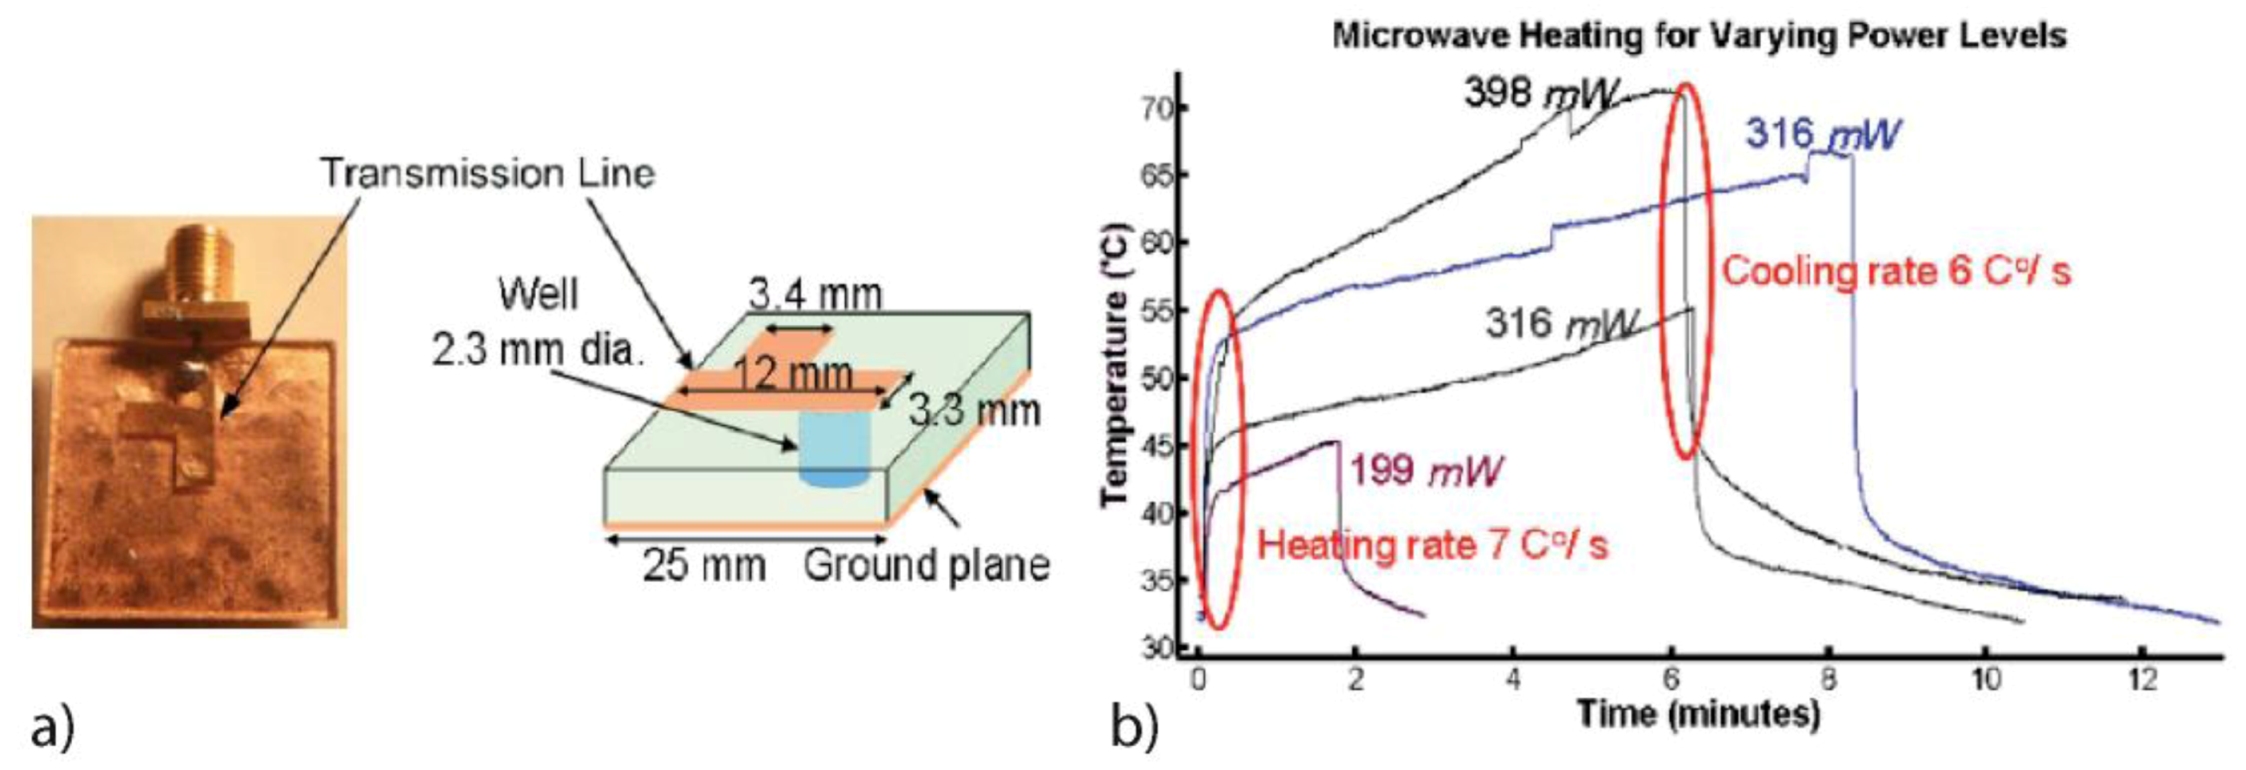
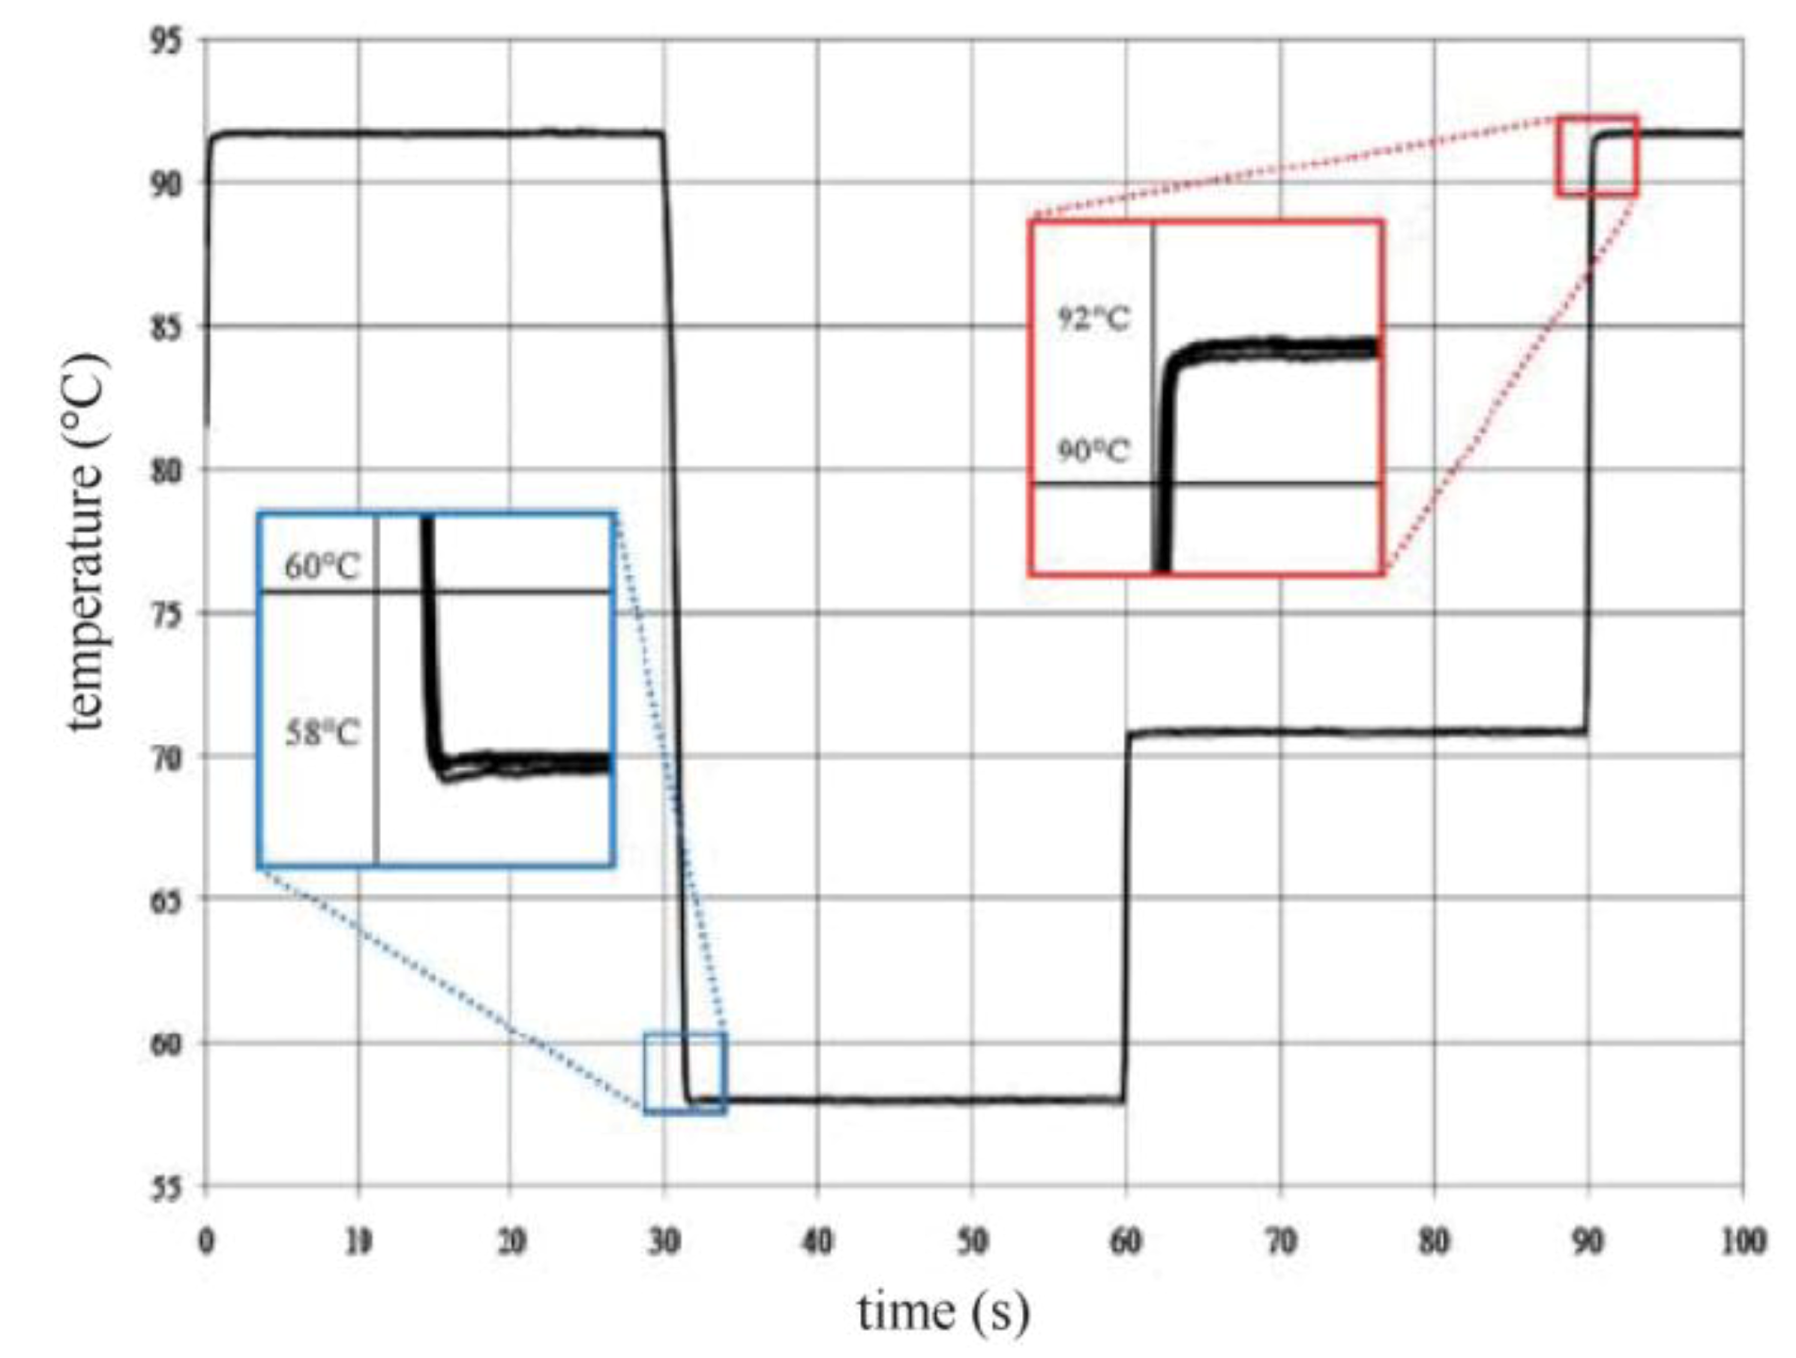
4.1. Microwaves


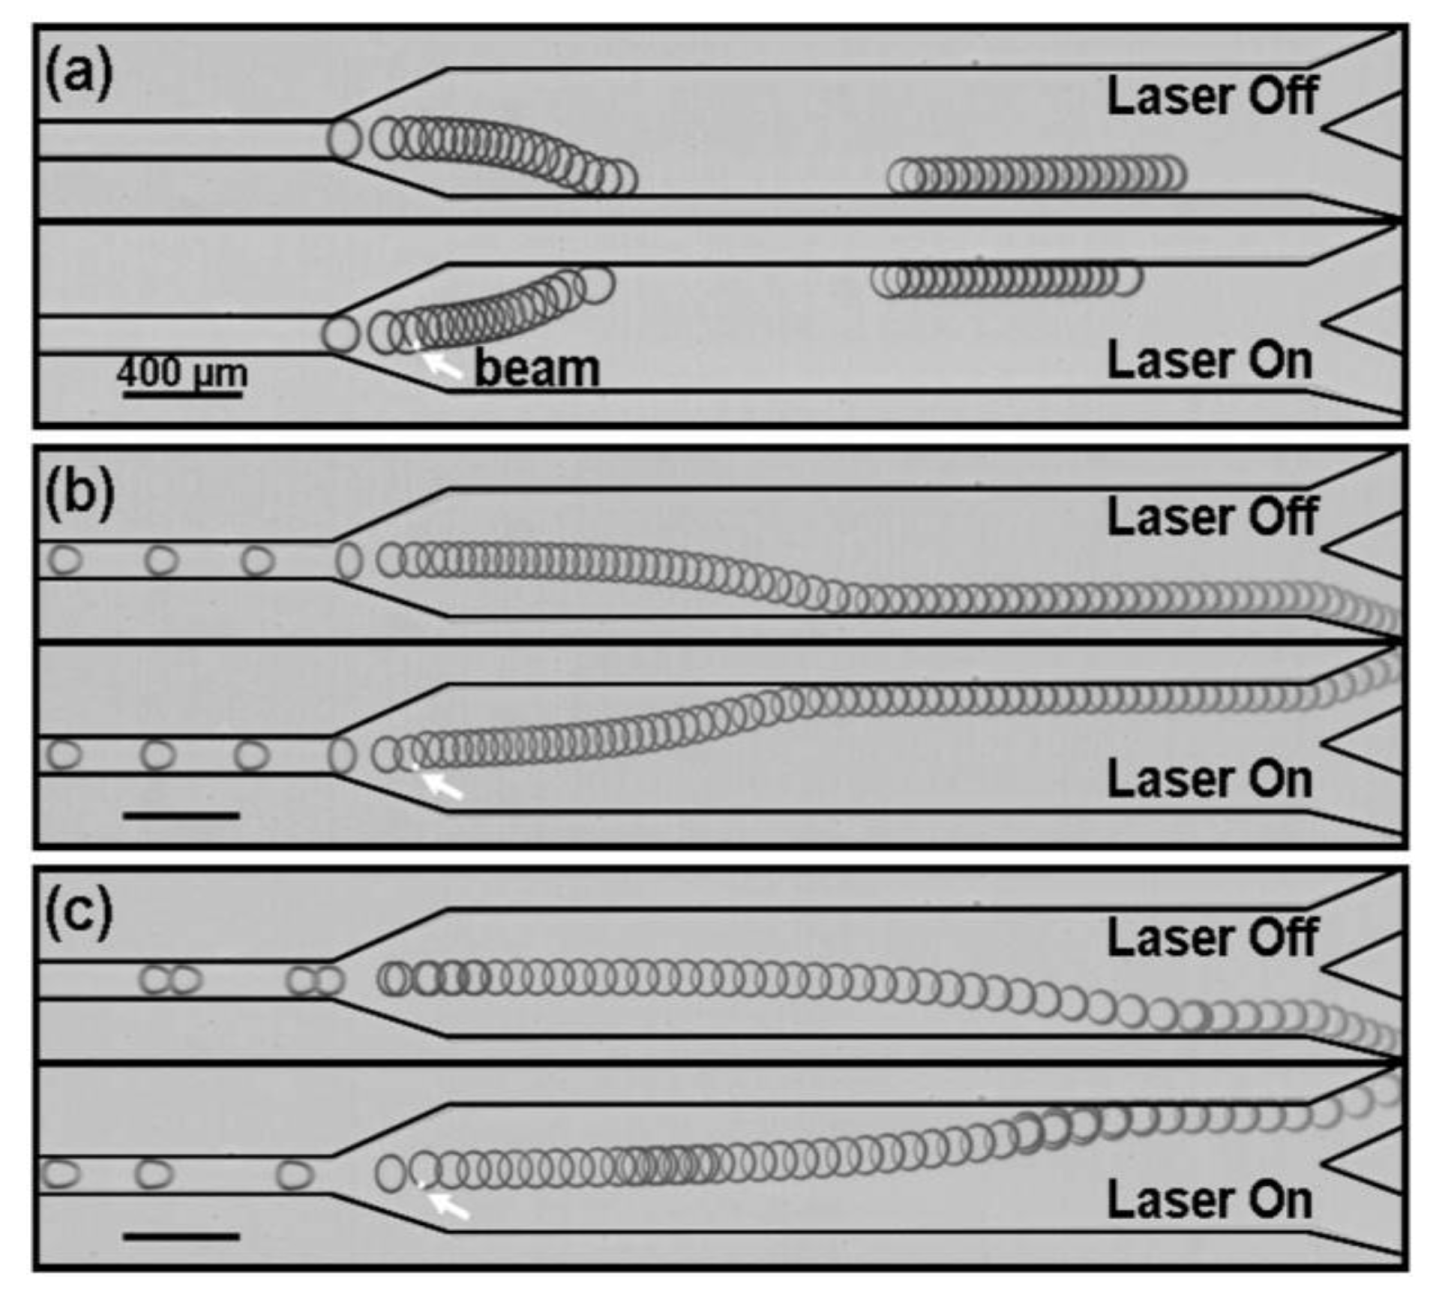
4.2. Use of a Laser


5. Applications
6. Conclusions
Acknowledgments
References
- Bartlett, J.M.S.; Stirling, D. A short history of the polymerase chain reaction. Meth. Mol. Biol. 2003, 226, 3–6. [Google Scholar] [CrossRef]
- Maltezos, G.; Gomez, A.; Zhong, J.; Gomez, F.A.; Scherer, A. Microfluidic polymerase chain reaction. Appl. Phys. Lett. 2008, 93, 243901:1–243901:3. [Google Scholar]
- Maltezos, G.; Johnston, M.; Taganov, K.; Srichantaratsamee, C.; Gorman, J. Exploring the limits of ultrafast polymerase chain reaction using liquid for thermal heat exchange: A proof of principle. Appl. Phys. Lett. 2010, 97, 264101:1–264101:3. [Google Scholar]
- Khandurina, J.; McKnight, T.E.; Jacobson, S.C.; Waters, L.C.; Foote, R.S.; Ramsey, J.M. Integrated system for rapid PCR-based DNA analysis in microfluidic devices. Anal. Chem. 2000, 72, 2995–3000. [Google Scholar] [CrossRef]
- Yang, J.; Liu, Y.; Rauch, C.B.; Stevens, R.L.; Liu, R.H.; Lenigk, R.; Grodzinski, P. High sensitivity PCR assay in plastic micro reactors. Lab Chip 2002, 2, 179–187. [Google Scholar] [CrossRef]
- Hua, Z.; Rouse, J.L.; Eckhardt, A.E.; Srinivasan, V.; Pamula, V.K.; Schell, W.A.; Benton, J.L.; Mitchell, T.G.; Pollack, M.G. Multiplexed real-time polymerase chain reaction on a digital microfluidic platform. Anal. Chem. 2010, 82, 2310–2316. [Google Scholar] [CrossRef] [PubMed]
- Mahjoob, S.; Vafai, K.; Beer, N.R. Rapid microfluidic thermal cycler for polymerase chain reaction nucleid acid amplification. Int. J. Heat Mass Transfer 2008, 51, 2109–2122. [Google Scholar] [CrossRef]
- Dinca, M.P.; Gheorghe, M.; Aherne, M.; Galvin, P. Fast and accurate temperature control of a PCR microsystem with a disposable reactor. J. Micromech. Microeng. 2009, 19, 065009:1–065009:15. [Google Scholar]
- Lien, K.Y.; Lee, S.-H.; Tsai, T.-J.; Chen, T.-Y.; Lee, G.-B. A microfluidic-based system using reverse transcription polymerase chain reactions for rapid detection of aquaculture diseases. Microfluid. Nanofluid. 2009, 7, 795–806. [Google Scholar] [CrossRef]
- Wang, W.; Li, Z.; Yang, Y.; Guo, Z. Droplet Based Micro Oscillating Flow-Through PCR Chip. In Proceedings of the 17th IEEE International Conference on Micro Electro Mechanical Systems (MEMS), Maastricht, The Netherlands, 25–29 January 2004; pp. 280–283.
- Qiu, X.; Mauk, M.G.; Chen, D.; Liu, C.; Bau, H.H. A large volume, portable, real-time PCR reactor. Lab Chip 2010, 10, 3170–3177. [Google Scholar] [CrossRef]
- Hsieh, T.-M.; Luo, C.-H.; Huang, F.-C.; Wang, J.-H.; Chien, L.-J.; Lee, G.-B. Enhancement of thermal uniformity for a microthermal cycler and its application for polymerase chain reaction. Sens. Actuator. B 2008, 130, 848–856. [Google Scholar] [CrossRef]
- Hsieh, T.-M.; Luo, C.-H.; Wang, J.-H.; Lin, J.-L.; Lien, K.-Y.; Lee, G.-B. Enhancement of thermal uniformity for a microthermal cycler and its application for polymerase chain reaction. Microfluid. Nanofluid. 2009, 6, 797–809. [Google Scholar] [CrossRef]
- Shen, K.; Chen, X.; Guo, M.; Cheng, J. A microchip-based PCR device using flexible printed circuit technology. Sens. Actuator. B 2005, 105, 251–258. [Google Scholar] [CrossRef]
- Wang, J.-H.; Chien, L.-J.; Hsieh, T.-M.; Luo, C.-H.; Chou, W.-P.; Chen, P.-H.; Chen, P.-J.; Lee, D.-S.; Lee, G.-B. A miniaturized quantitative polymerase chain reaction system for DNA amplification and detection. Sens. Actuator. B 2009, 141, 329–337. [Google Scholar] [CrossRef]
- Matsui, T.; Franzke, J.; Manz, A.; Janasek, D. Temperature gradient focusing in a PDMS/glass hybrid microfluidic chip. Electrophoresis 2007, 28, 4606–4611. [Google Scholar] [CrossRef] [PubMed]
- Ross, D.; Locascio, L.E. Microfluidic temperature gradient focusing. Anal. Chem. 2002, 74, 2556–2564. [Google Scholar] [CrossRef] [PubMed]
- Yap, Y.F.; Tan, S.H.; Nguyen, N.T.; Murshed, S.M.S.; Wong, T.N.; Yobas, L. Thermally mediated control of liquid microdroplets at a bifurcation. J. Phys. D Appl. Phys. 2009, 42, 1–14. [Google Scholar]
- Ting, T.H.; Yap, Y.F.; Nguyen, N.-T.; Wong, T.N.; Chai, J.C.K. Thermally mediated breakup of drops in microchannels. Appl. Phys. Lett. 2006, 89, 234101:1–234101:3. [Google Scholar]
- Jiao, Z.; Huang, X.; Nguyen, N.-T.; Abgrall, P. Thermocapillary actuation of droplet in a planar microchannel. Microfluid. Nanofluid. 2008, 5, 205–214. [Google Scholar] [CrossRef]
- Jiao, Z.; Huang, X.; Nguyen, N.-T. Manipulation of a droplet in a planar channel by periodic thermocapillary actuation. J. Micromech. Microeng. 2008, 18, 045027:1–045027:9. [Google Scholar]
- Nguyen, N.T.; Huang, X.Y. Thermocapillary effect of a liquid plug in transient temperature fields. Jpn. J. Appl. Phys. 2005, 44, 1139–1142. [Google Scholar] [CrossRef]
- Jiao, Z.J.; Nguyen, N.T.; Huang, X.Y.; Ang, Y.Z. Reciprocating thermocapillary plug motion in an externally heated capillary. Microfluid. Nanofluid. 2007, 3, 39–46. [Google Scholar]
- Darhuber, A.A.; Valentino, J.P.; Davis, J.M.; Troian, S.M. Microfluidic actuation by modulation of surface stresses. Appl. Phys.Lett. 2003, 82, 657–659. [Google Scholar] [CrossRef]
- Darhuber, A.A.; Valentino, J.P. Thermocapillary actuation of droplets on chemically patterned surfaces by programmable microheater arrays. J. Microelectromech. Syst. 2003, 12, 873–879. [Google Scholar] [CrossRef]
- Darhuber, A.A.; Davis, J.M.; Troian, S.M. Thermocapillary actuation of liquid flow on chemically patterned surfaces. Phys. Fluids 2003, 15, 1295–1304. [Google Scholar] [CrossRef]
- Darhuber, A.A.; Valentino, J.P.; Troian, S.M. Planar digital nanoliter dispensing system based on thermocapillary actuation. Lab Chip 2010, 10, 1061–1071. [Google Scholar] [CrossRef]
- Selva, B.; Cantat, I.; Jullien, M.-C. Temperature-induced migration of a bubble in a soft microgravity. Phys. Fluids 2011, 23, 052002:1–052002:12. [Google Scholar]
- Selva, B.; Marchalot, J.; Jullien, M.-C. An optimized resistor pattern for temperature gradient control in microfluidics. J. Micromech. Microeng. 2009, 19, 065002:1–065002:10. [Google Scholar]
- Selva, B.; Miralles, V.; Cantat, I.; Jullien, M.-C. Thermocapillary actuation by optimized resistor pattern: bubbles and droplets displacing, switching and trapping. Lab Chip 2010, 10, 1835–1840. [Google Scholar] [CrossRef]
- Guo, M.T.; Rotem, A.; Heyman, J.A.; Weitz, D.A. Droplet microfluidics for high-throughput biological assays. Lab Chip 2012, 12, 2146–2155. [Google Scholar] [CrossRef]
- Stroock, A.D.; Dertinger, S.K.W.; Ajdari, A.; Mezic, I.; Stone, H.A.; Whitesides, G.M. Chaotic mixer for microchannels. Science 2002, 295, 647–651. [Google Scholar] [CrossRef]
- Kim, S.-J.; Wang, F.; Burns, M.A.; Kurabayashi, K. Temperature-programmed natural convection for micromixing and biochemical reaction in a single microfluidic chamber. Anal. Chem. 2009, 81, 4510–4516. [Google Scholar] [CrossRef]
- Liu, R.H.; Stremler, M.A.; Sharp, K.V.; Olsen, M.G.; Santiago, J.G.; Adrian, R.J.; Aref, H.; Beebe, D.J. Passive mixing in a three-dimensional serpentine microchannel. J. Microelectromech. Syst. 2000, 9, 190–197. [Google Scholar] [CrossRef]
- Laval, P.; Lisai, N.; Salmon, J.-B.; Joanicot, M. A microfluidic device based on droplet storage for screening solubility diagrams. Lab Chip 2007, 7, 829–834. [Google Scholar] [CrossRef]
- Velve Casquillas, G.; Fu, C.; Le Berre, M.; Cramer, J.; Meance, S.; Plecis, A.; Baigl, D.; Greffet, J.-J.; Chen, Y.; Piel, M.; Tran, P.T. Fast microfluidic temperature control for high resolution live cell imaging. Lab Chip 2011, 11, 484–489. [Google Scholar] [CrossRef]
- Velve Casquillas, G.; Costa, J.; Carlier-Grynkorn, F.; Mayeux, A. A fast microfluidic temperature control device for studying microtubule dynamics in fission yeast. Method. Cell Biol. 2010, 97, 185–201. [Google Scholar] [CrossRef]
- Mao, H.; Yang, T.; Cremer, P.S. A microfluidic device with a linear temperature gradient for parallel and combinatorial measurements. J. Am. Chem. Soc. 2002, 124, 4432–4435. [Google Scholar] [CrossRef]
- Xia, Y.; Whitesides, G.M. Soft lithography. Angew. Chem. Int. Ed. 1998, 37, 550–575. [Google Scholar] [CrossRef]
- Maltezos, G.; Johnston, M.; Scherer, A. Thermal management in microfluidics using micro Peltier junctions. Appl. Phys. Lett. 2005, 87, 154105:1–154105:3. [Google Scholar]
- De Mello, A.J.; Habgood, M.; Lancaster, N.L.; Welton, T.; Wooton, R.C.R. Precise temperature control in microfluidic devices using Joule heating of ionic liquids. Lab Chip 2004, 4, 417–419. [Google Scholar] [CrossRef]
- Mavraki, E.; Moschou, D.; Kokkoris, G.; Vourdas, N.; Chatzandroulis, S.; Tserepi, A. A continuous flow µPCR device with integrated microheaters on a flexible polyimide substrate. Procedia Eng. 2011, 25, 1245–1248. [Google Scholar] [CrossRef]
- Vigolo, D.; Rusconi, R.; Piazza, R.; Stone, H.A. A portable device for temperature control along microchannels. Lab Chip 2010, 10, 795–798. [Google Scholar] [CrossRef]
- Lao, A.I.K.; Lee, T.M.H.; Hsing, I.-M.; Ip, N.Y. Precise temperature control of microfluidic chamber for gas and liquid phase reactions. Sens. Actuator. A 2000, 84, 11–17. [Google Scholar] [CrossRef]
- Selva, B.; Mary, P.; Jullien, M.-C. Integration of a uniform and rapid heating source into microfluidic systems. Microfluid. Nanofluid. 2010, 8, 755–765. [Google Scholar] [CrossRef]
- Ross, D.; Gaitan, M.; Locascio, L.E. Temperature measurement in microfluidic systems using a temperature-dependent fluorescent dye. Anal. Chem. 2001, 73, 4117–4123. [Google Scholar] [CrossRef]
- Oda, R.P.; Strausbauch, M.A.; Huhmer, A.F.; Borson, N.; Jurrens, S.R.; Craighead, J.; Wettstein, P.J.; Eckloff, B.; Kline, B.; Landers, J.P. Infrared-mediated thermocycling for ultrafast polymerase chain reaction amplification of DNA. Anal. Chem. 1998, 70, 4361–4368. [Google Scholar] [CrossRef] [PubMed]
- Ferrance, J.P.; Wu, Q.; Giordano, B.; Hernandez, C.; Kwok, Y.; Snow, K.; Thibodeau, S.; Landers, J.P. Developments toward a complete micro-total analysis system for Duchenne muscular dystrophy diagnosis. Anal. Chim. Acta 2003, 500, 223–236. [Google Scholar] [CrossRef]
- Giordano, B.; Ferrance, J.; Swedberg, S.; Hulhmer, A.; Landers, J. Polymerase chain reaction in polymeric microchips: DNA amplification in less than 240 seconds. Anal. Biochem. 2001, 291, 124–132. [Google Scholar] [CrossRef] [PubMed]
- Ke, C.; Berney, H.; Mathewson, A.; Sheehan, M. Rapid amplification for the detection of Mycobacterium tuberculosis using a non-contact heating method in a silicon microreactor based thermal cycler. Sens. Actuator. B 2001, 102, 308–314. [Google Scholar]
- Jagannathan, H.; Yaralioglu, G.; Ergun, A.; Khuri-Yakub, B. Acoustic Heating and Thermometry in Microfluidic Channels. In Proceedings of IEEE the Sixteenth Annual International Conference on Micro Electro Mechanical Systems (MEMS-03 Kyoto), Kyoto, Japan, 19–23 January 2003; pp. 474–477.
- Kondoh, J.; Shimizu, N.; Matsui, Y.; Sugimoto, M.; Shiokawa, S. Development of temperature-control system for liquid droplet using surface Acoustic wave devices. Sens. Actuator. A 2009, 149, 292–297. [Google Scholar] [CrossRef]
- Yaralioglu, G. Ultrasonic heating and temperature measurement in microfluidic channels. Sensors Sens. Actuator. A 2011, 170, 1–7. [Google Scholar] [CrossRef]
- Bykov, Y.V.; Rybakov, K.I.; Semenov, V.E. High-temperature microwave processing of materials. J. Phys. D Appl. Phys. 2001, 34, R55–R75. [Google Scholar] [CrossRef]
- Shah, J.J.; Geist, J.; Gaitan, M.A. Microwave-induced adjustable nonlinear temperature gradients in microfluidic devices. J. Micromech. Microeng. 2010, 20, 105025:1–105025:8. [Google Scholar] [CrossRef]
- Kempitiya, A.; Borca-Tasciuc, D.A.; Mohamed, H.S.; Hella, M.M. Localized microwave heating in microwells for parallel DNA amplification applications. Appl. Phys. Lett. 2009, 94, 064106:1–064106:3. [Google Scholar]
- Shaw, K.J.; Docker, P.T.; Yelland, J.V.; Dyer, C.E.; Greenman, J.; Greenway, G.M.; Haswell, S.J. Rapid PCR amplification using a microfluidic device with integrated microwave heating and air impingement cooling. Lab Chip 2010, 10, 1725–1728. [Google Scholar] [CrossRef]
- Orrling, K.; Nilsson, P.; Gullberg, M.; Larhed, M. An efficient method to perform milliliter-scale PCR utilizing highly controlled microwave thermocycling. Chem. Commun. 2004. [Google Scholar] [CrossRef]
- Shah, J.J.; Sundaresan, S.G.; Geist, J.; Reyes, D.R.; Booth, J.C.; Rao, M.V.; Gaitan, M. Microwave dielectric heating of fluids in an integrated microfluidic device. J. Micromech. Microeng. 2007, 17, 2224–2230. [Google Scholar] [CrossRef]
- Geist, J.J.; Gaitan, M. Microwave power absorption in low-reflectance, complex, lossy transmission lines. J. Res. Natl. Inst. Stand. Technol. 2007, 112, 177–189. [Google Scholar] [CrossRef]
- Siegel, A.C.; Shevkoplyas, S.S.; Weibel, D.B.; Bruzewicz, D.A.; Martinez, A.W.; Whitesides, G.M. Cofabrication of electromagnets and microfluldic systems in poly(dimethylsiloxane). Angew. Chem. Int. Ed. 2006, 45, 6877–6882. [Google Scholar] [CrossRef]
- Kappe, C.O.; Dallinger, D. The impact of microwave synthesis on drug discovery. Nat. Rev. Drug Discov. 2006, 5, 51–63. [Google Scholar] [CrossRef] [PubMed]
- Fermer, C.; Nilsson, P.; Larhed, M. Microwave-assisted high-speed PCR. Eur. J. Pharm. Sci. 2003, 18, 129–132. [Google Scholar] [CrossRef]
- Issadore, D.; Humphry, K.J.; Brown, K.A.; Sandberg, L.; Weitz, D.A.; Westervelt, R.M. Microwave dielectric heating of drops in microfluidic devices. Lab Chip 2009, 9, 1701–1706. [Google Scholar] [CrossRef] [PubMed]
- Guijt, R.M.; Dodge, A.; van Dedem, G.W.K.; de Rooij, N.F.; Verpoorte, E. Chemical and physical processes for integrated temperature control in microfluidic devices. Lab Chip 2003, 3, 1–4. [Google Scholar] [PubMed]
- Maltezos, A.; Rajagopal, A. Scherer. Evaporative cooling in microfluidic channels. Appl. Phys. Lett. 2006, 89, 074107:1–074107:3. [Google Scholar] [CrossRef]
- Wu, J.; Cao, W.; Chen, W.; Chang, D.C.; Sheng, P. Polydimethylsiloxane microfluidic chip with integrated microheater and thermal sensor. Biofluidics 2009, 3, 012005:1–012005:7. [Google Scholar]
- Robert de Saint Vincent, M.; Wunenburger, R.; Delville, J.-P. Laser switching and sorting for high speed digital microfluidics. Appl. Phys. Lett. 2008, 92, 154105:1–154105:3. [Google Scholar] [CrossRef]
- Kim, H.; Vishniakou, S.; Faris, G.W. Petri dish PCR: Laser-heated reactions in nanoliter droplet arrays. Lab Chip 2009, 9, 1230–1235. [Google Scholar] [CrossRef]
- Ohta, A.T.; Jamshidi, A.; Valley, J.K.; Hsu, H.-Y.; Wu, M.C. Optically actuated thermocapillary movement of gas bubbles on an absorbing substrate. Appl. Phys. Lett. 2007, 91, 074103:1–074103:3. [Google Scholar]
- Gosse, C.; Bergaud, C.; Löw, P. Molecular probes for thermometry in microfluidic devices. Top. Appl. Phys. 2009, 118, 301–341. [Google Scholar]
- Liu, R.H.; Yang, J.; Lenigk, R.; Bonanno, J.; Grodzinski, P. Self-contained, fully integrated biochip for sample preparation, polymerase chain reaction amplification, and DNA microarray detection. Anal. Chem. 2004, 76, 1824–1831. [Google Scholar] [CrossRef]
- Unger, M.A.; Chou, H.-P.; Thorsen, T.; Scherer, A.; Quake, S.R. Monolithic microfabricated valves and pumps by multilayer soft lithography. Science 2000, 288, 113–115. [Google Scholar] [CrossRef] [PubMed]
- Kartalov, E.P.; Scherer, A.; Quake, S.R.; Taylor, C.R.; Anderson, W.F. Experimentally validated quantitative linear model for the device physics of elastomeric microfluidic valves. J. Appl. Phys. 2007, 101, 064505:1–064505:4. [Google Scholar]
- Pitchaimani, K.; Sapp, B.C.; Winter, A.; Gispanski, A.; Nishida, T.; Fan, Z.H. Manufacturable plastic microfluidic valves using thermal actuation. Lab Chip 2009, 9, 3082–3087. [Google Scholar] [CrossRef] [PubMed]
- Gu, P.; Liu, K.; Chen, H.; Nishida, T.; Fan, Z.H. Chemical-assisted bonding of thermoplastics/elastomer for fabricating microfluidic valves. Anal. Chem. 2011, 83, 446–452. [Google Scholar] [CrossRef] [PubMed]
- Deb, K. Multi-Objective Optimization Using Evolutionary Algorithms; Wiley-Blackwell: Hoboken, NJ, USA, 2001; ISBN ISBN: 0–471–87339-X. [Google Scholar]
- Deb, K.; Pratap, A.; Agarwal, S.; Meyarivan, T. A fast and elitist multiobjective genetic algorithm: NSGA-II. IEEE Trans. Evol. Comput. 2002, 6, 182–197. [Google Scholar] [CrossRef]
- Vigolo, D.; Rusconi, R.; Stone, H.A.; Piazza, R. Thermophoresis: Microfluidics characterization and separation. Soft Matter 2010, 6, 3489–3493. [Google Scholar] [CrossRef]
- Baroud, C.N.; Delville, J.-P.; Gallaire, F.; Wununburger, R. Thermocapillary valve for droplet production and sorting. Phys. Rev. E 2007, 75, 046302:1–046302:5. [Google Scholar]
- Weinert, F.M.; Braun, D. Optically driven fluid along arbitrary microscale patterns using thermoviscous expansion. J. Appl. Phys. 2008, 104, 104701:1–104701:10. [Google Scholar] [CrossRef]
- Hettiarachchi, K.; Kim, H.; Faris, G.W. Optical manipulation and control of real-time PCR in cell encapsulating microdroplets by IR laser. Microfluid. Nanofluid. 2012, 13, 967–975. [Google Scholar] [CrossRef]
- Hung, P.J.; Lee, P.J.; Sabounchi, P.; Lin, R; Lee, L.P. Continuous perfusion microfluidic cell culture array for high-throughput cell-based assays. Biotechnol. Bioeng. 2005, 89, 1–8. [Google Scholar] [CrossRef]
- Mary, P.; Studer, V.; Tabeling, P. Microfluidic droplet-based liquid-liquid extraction. Anal. Chem. 2008, 80, 2680–2687. [Google Scholar] [CrossRef] [PubMed]
- Davis, S.H. Thermocapillary instabilities. Annu. Rev. Fluid Mech. 1987, 19, 403–435. [Google Scholar] [CrossRef]
- Mugele, F.; Baret, J.-C. Electrowetting: From basics to applications. J. Phys. Condens. Matter 2005, 17, 705–774. [Google Scholar] [CrossRef]
- Moon, H.; Cho, S.K.; Garrell, R.L.; Kim, C.J. Low voltage electrowetting-on-dielectric. J. Appl. Phys. 2002, 92, 4080–4087. [Google Scholar] [CrossRef]
- Vigolo, D.; Brambilla, G.; Piazza, R. Thermophoresis of microemulsion droplets: Size dependence of the Soret effect. Phys. Rev. E 2007, 75, 040401:1–040401:4. [Google Scholar] [CrossRef]
- Piazza, R.; Guarino, A. Soret effect in interacting micellar solutions. Phys. Rev. Lett. 2002, 88, 208302:1–208302:8. [Google Scholar] [CrossRef]
- Cong, H.; Pan, T. Photopatternable conductive PDMS materials for microfabrication. Adv. Funct. Mater. 2008, 18, 1912–1921. [Google Scholar] [CrossRef]
© 2013 by the authors; licensee MDPI, Basel, Switzerland. This article is an open access article distributed under the terms and conditions of the Creative Commons Attribution license (http://creativecommons.org/licenses/by/3.0/).
Share and Cite
Miralles, V.; Huerre, A.; Malloggi, F.; Jullien, M.-C. A Review of Heating and Temperature Control in Microfluidic Systems: Techniques and Applications. Diagnostics 2013, 3, 33-67. https://doi.org/10.3390/diagnostics3010033
Miralles V, Huerre A, Malloggi F, Jullien M-C. A Review of Heating and Temperature Control in Microfluidic Systems: Techniques and Applications. Diagnostics. 2013; 3(1):33-67. https://doi.org/10.3390/diagnostics3010033
Chicago/Turabian StyleMiralles, Vincent, Axel Huerre, Florent Malloggi, and Marie-Caroline Jullien. 2013. "A Review of Heating and Temperature Control in Microfluidic Systems: Techniques and Applications" Diagnostics 3, no. 1: 33-67. https://doi.org/10.3390/diagnostics3010033