
Technologies for Clinical Diagnosis Using Expired Human Breath Analysis

Abstract
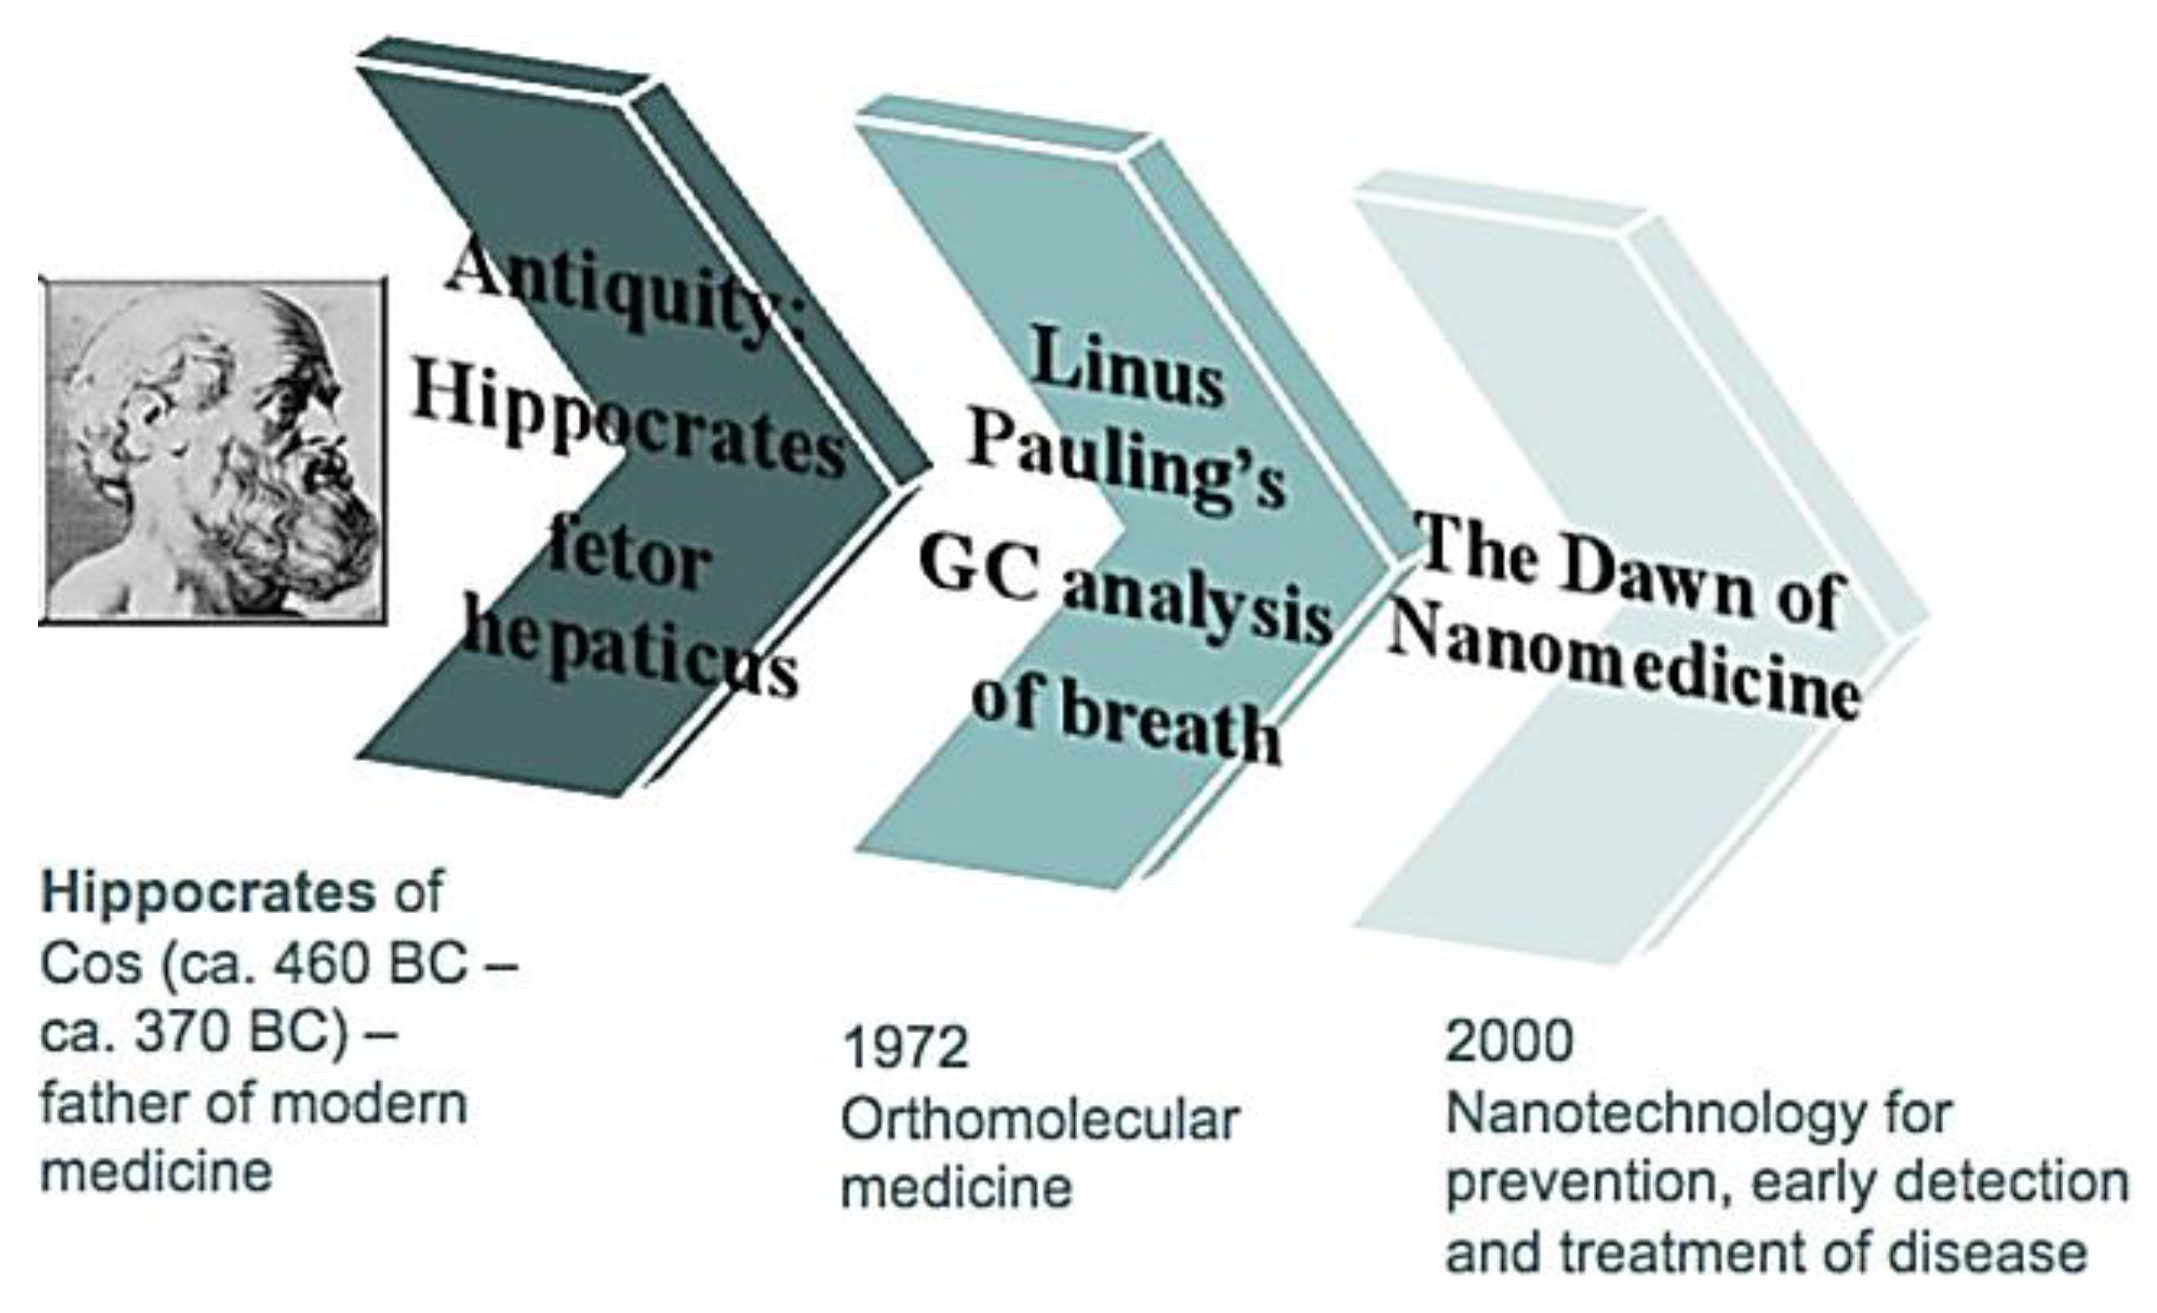
:1. Introduction
1.1. Human Exhaled Breath Gas Analysis

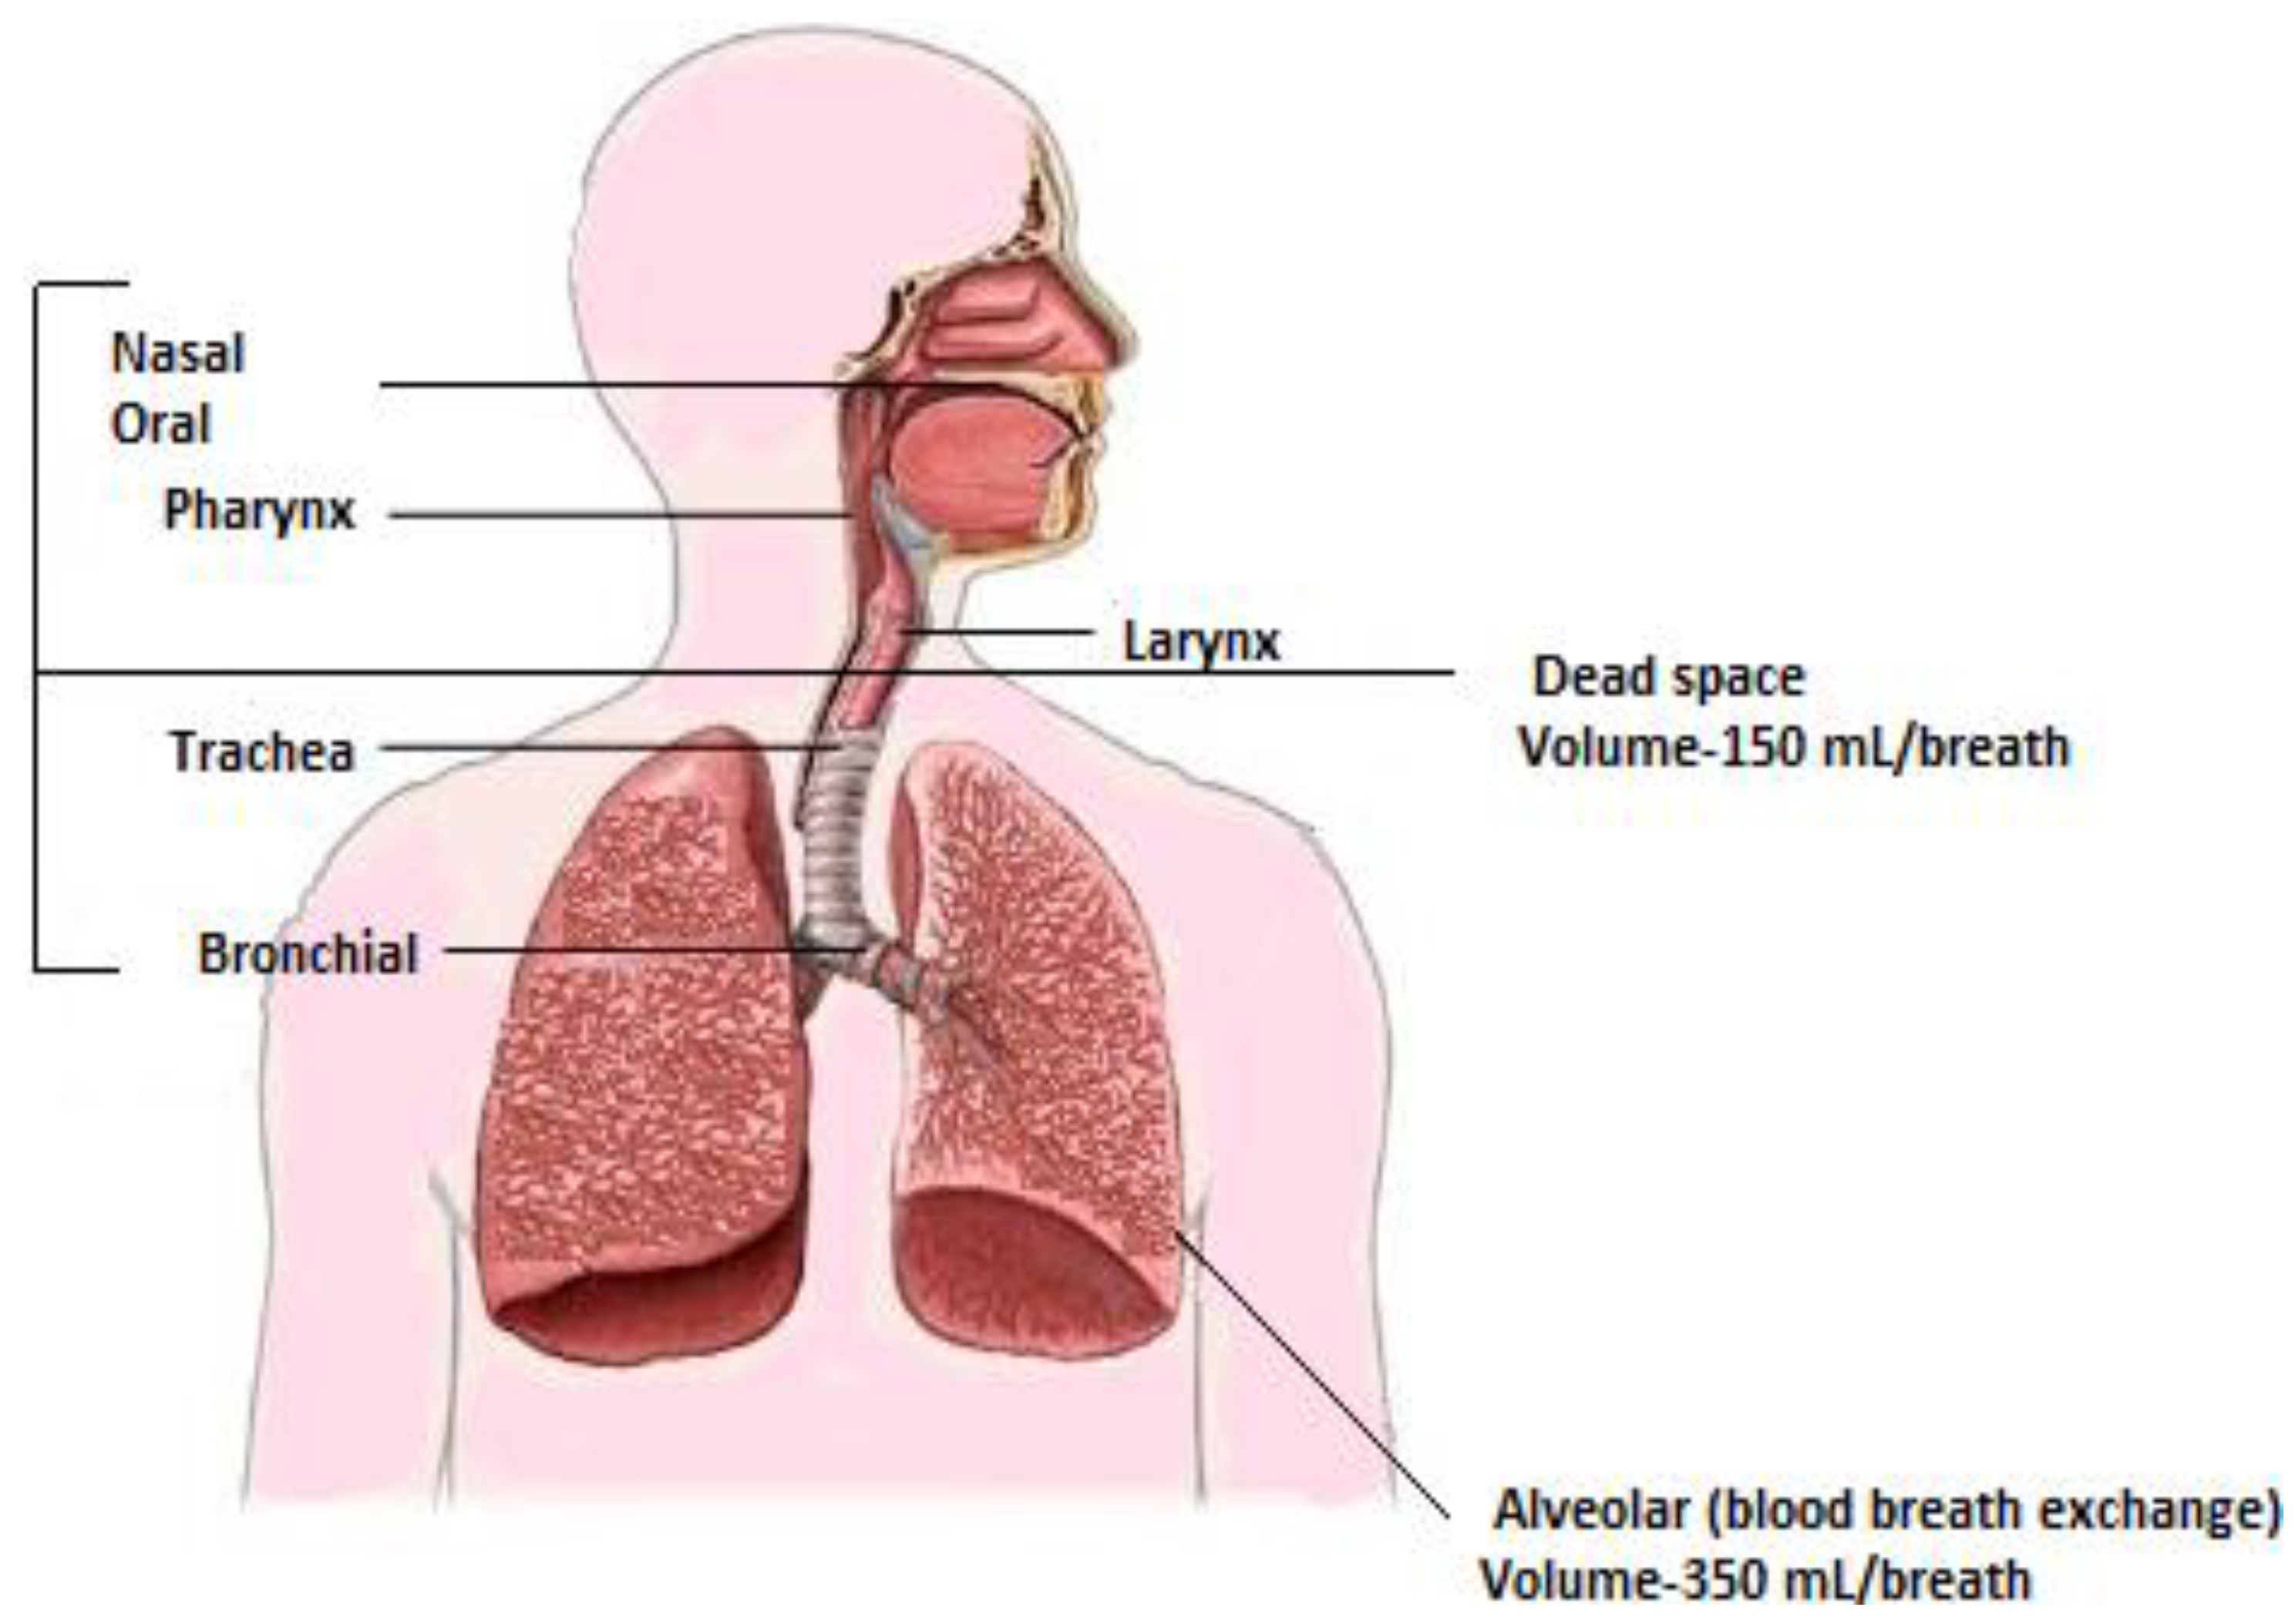
1.2. Human Breath


| Exhaled Breath | Concentration | Reference |
|---|---|---|
| Nitrogen | 78.04% | [18] |
| Oxygen | 16% | [18] |
| Carbon dioxide | 4%–5% | [18] |
| Hydrogen | 5% | [18] |
| Carbon monoxide | 0–6 ppm | [19] |
| Ammonia | 0.5 ppm–2 ppm | [20] |
| Inert gases and VOCs: Acetone, Isoprene and Ethanol | 0.9% <1 ppm | [21] |
| Hydrogen sulphide | 0–1.3 ppm | [22] |
| Nitric oxide | 10 ppb–50 ppb | [6] |
| Nitrous oxide | 1 ppb–20 ppb | [6] |
| Carbonyl Sulphide | 0–10 ppb | [6] |
| Ethane | 0–10 ppb | [6] |
| Pentane | 0–10 ppb | [6] |
| Methane | 2 ppm–10 ppm | [6] |
| Relative Humidity: | ||
| 1. Oral Exhalation | 91%–96% | [18] |
| 2. Nasal Exhalation | 82%–85% | [18] |
| Temperature Range | Between 34 °C and 36 °C | [18] |
2. Interfering Expired Gases and Its Effects
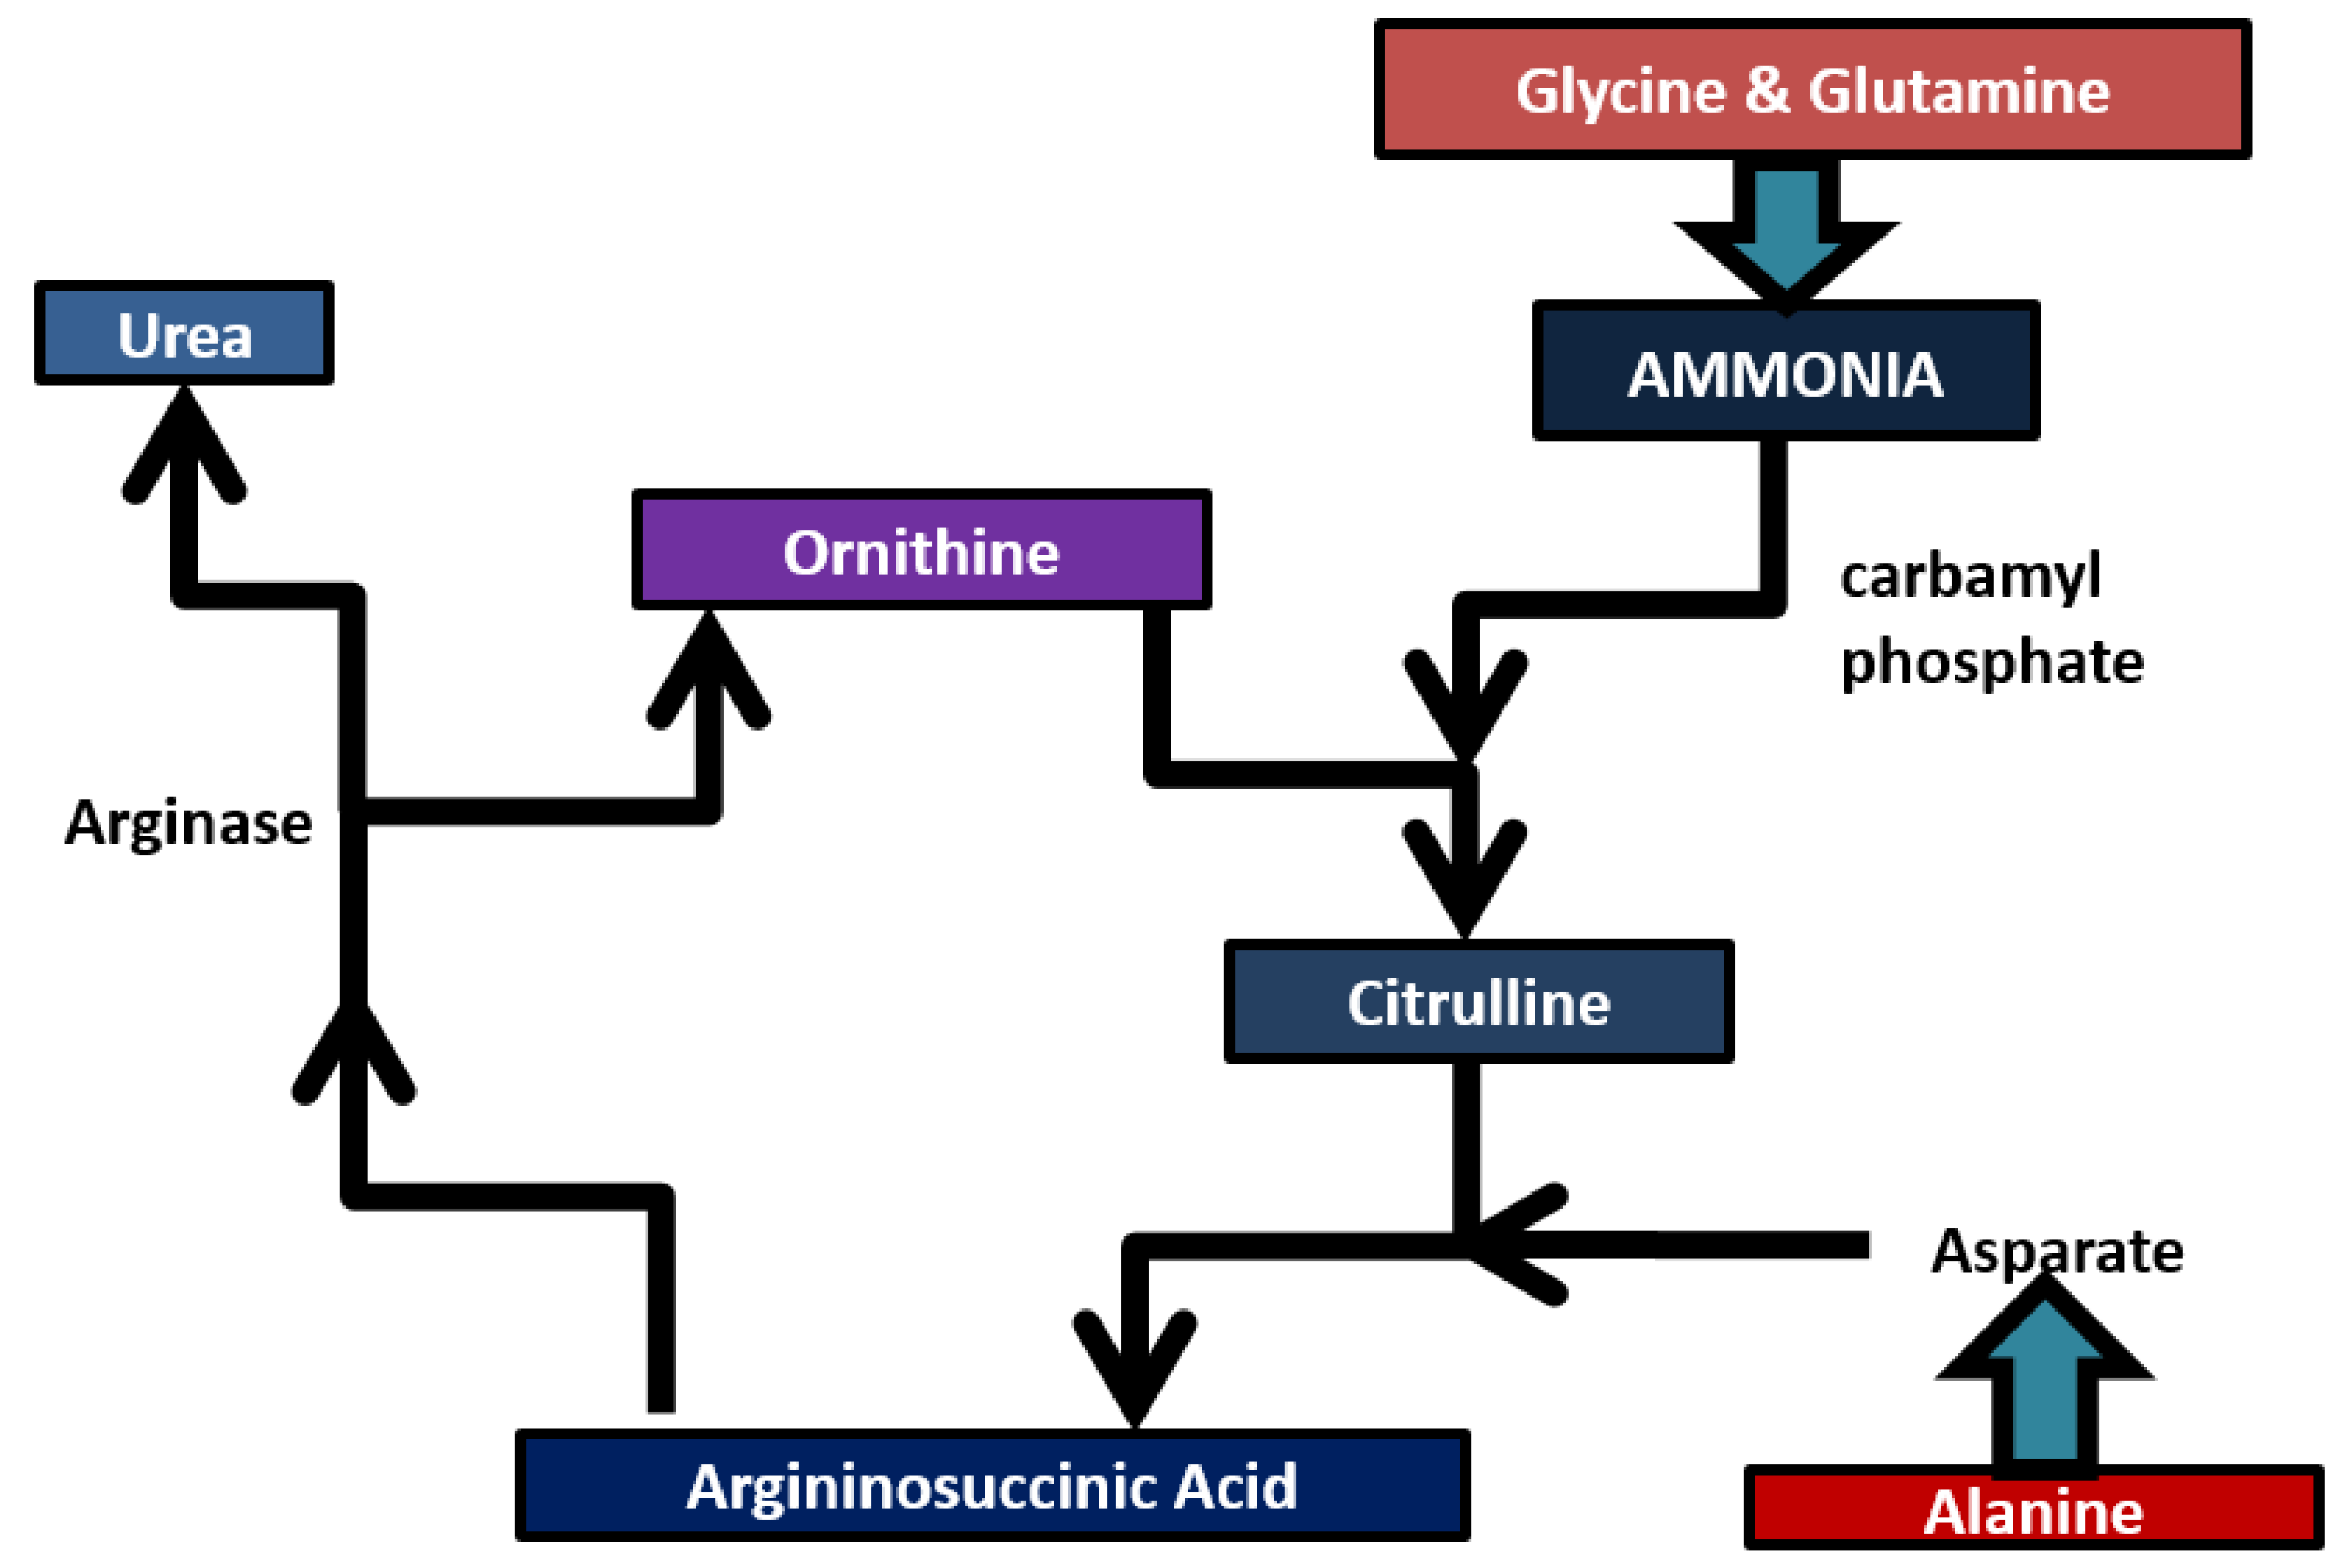
2.1. Ammonia Metabolism

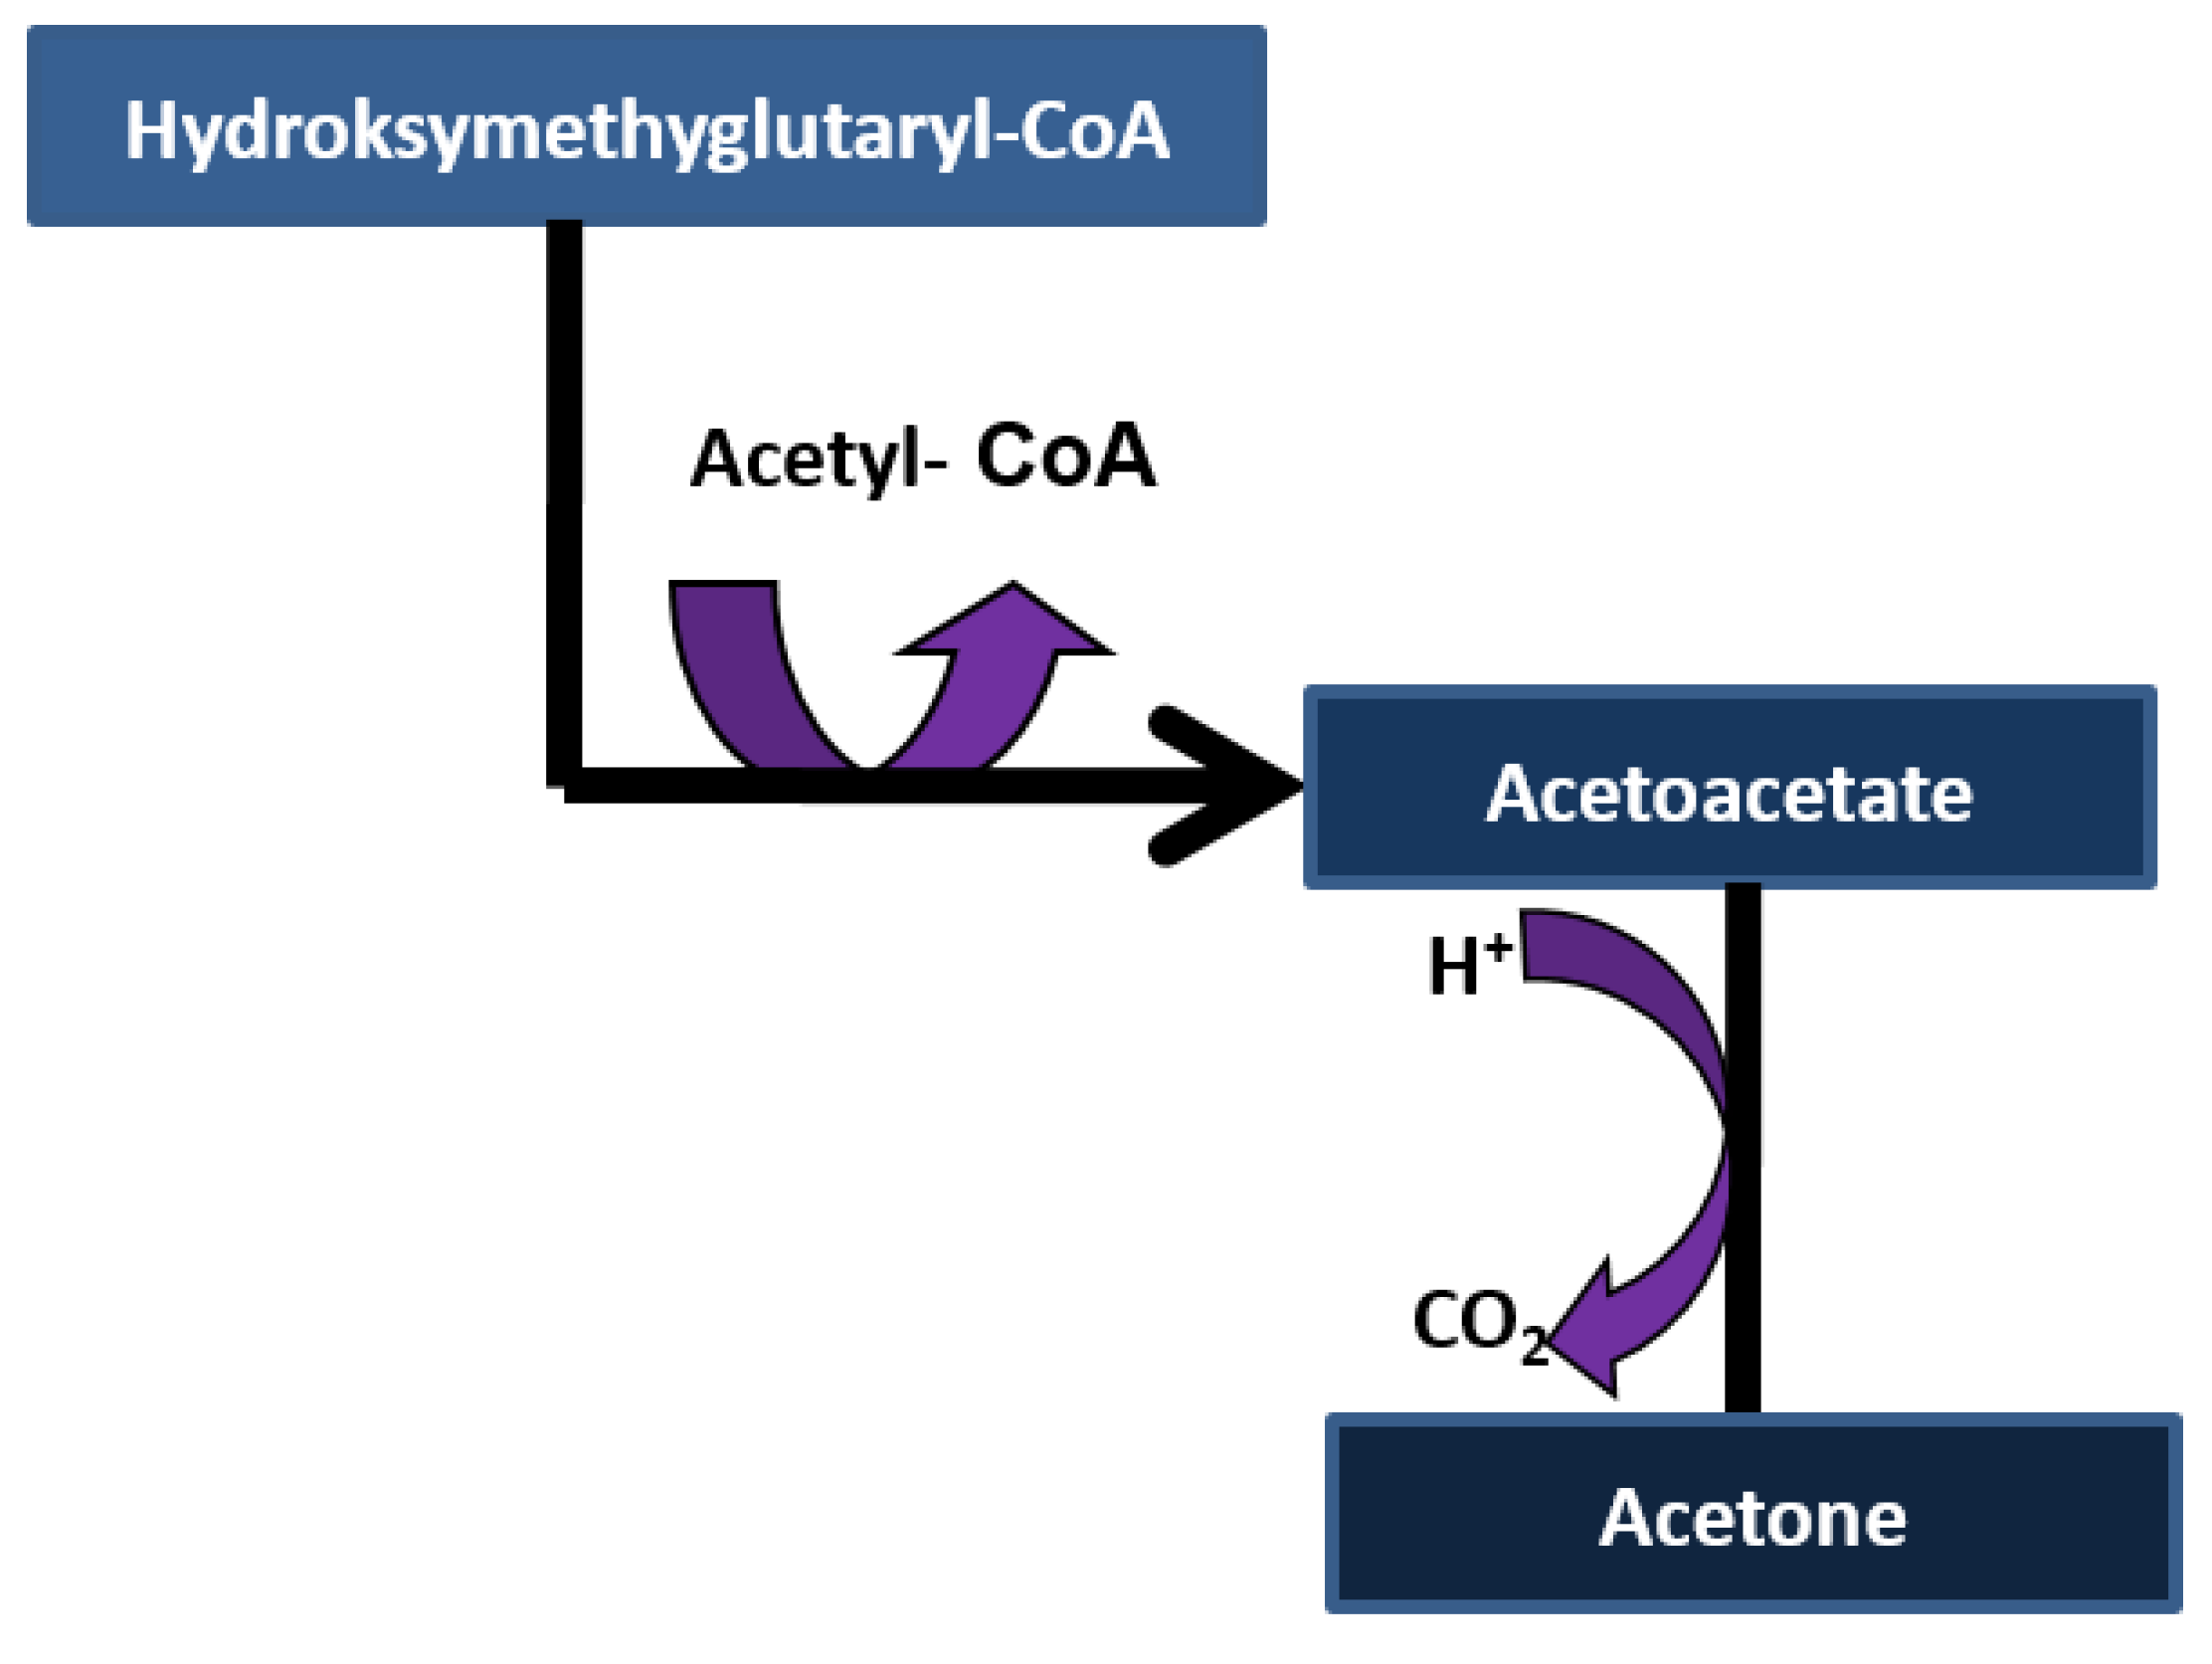
2.2. Acetone Metabolism

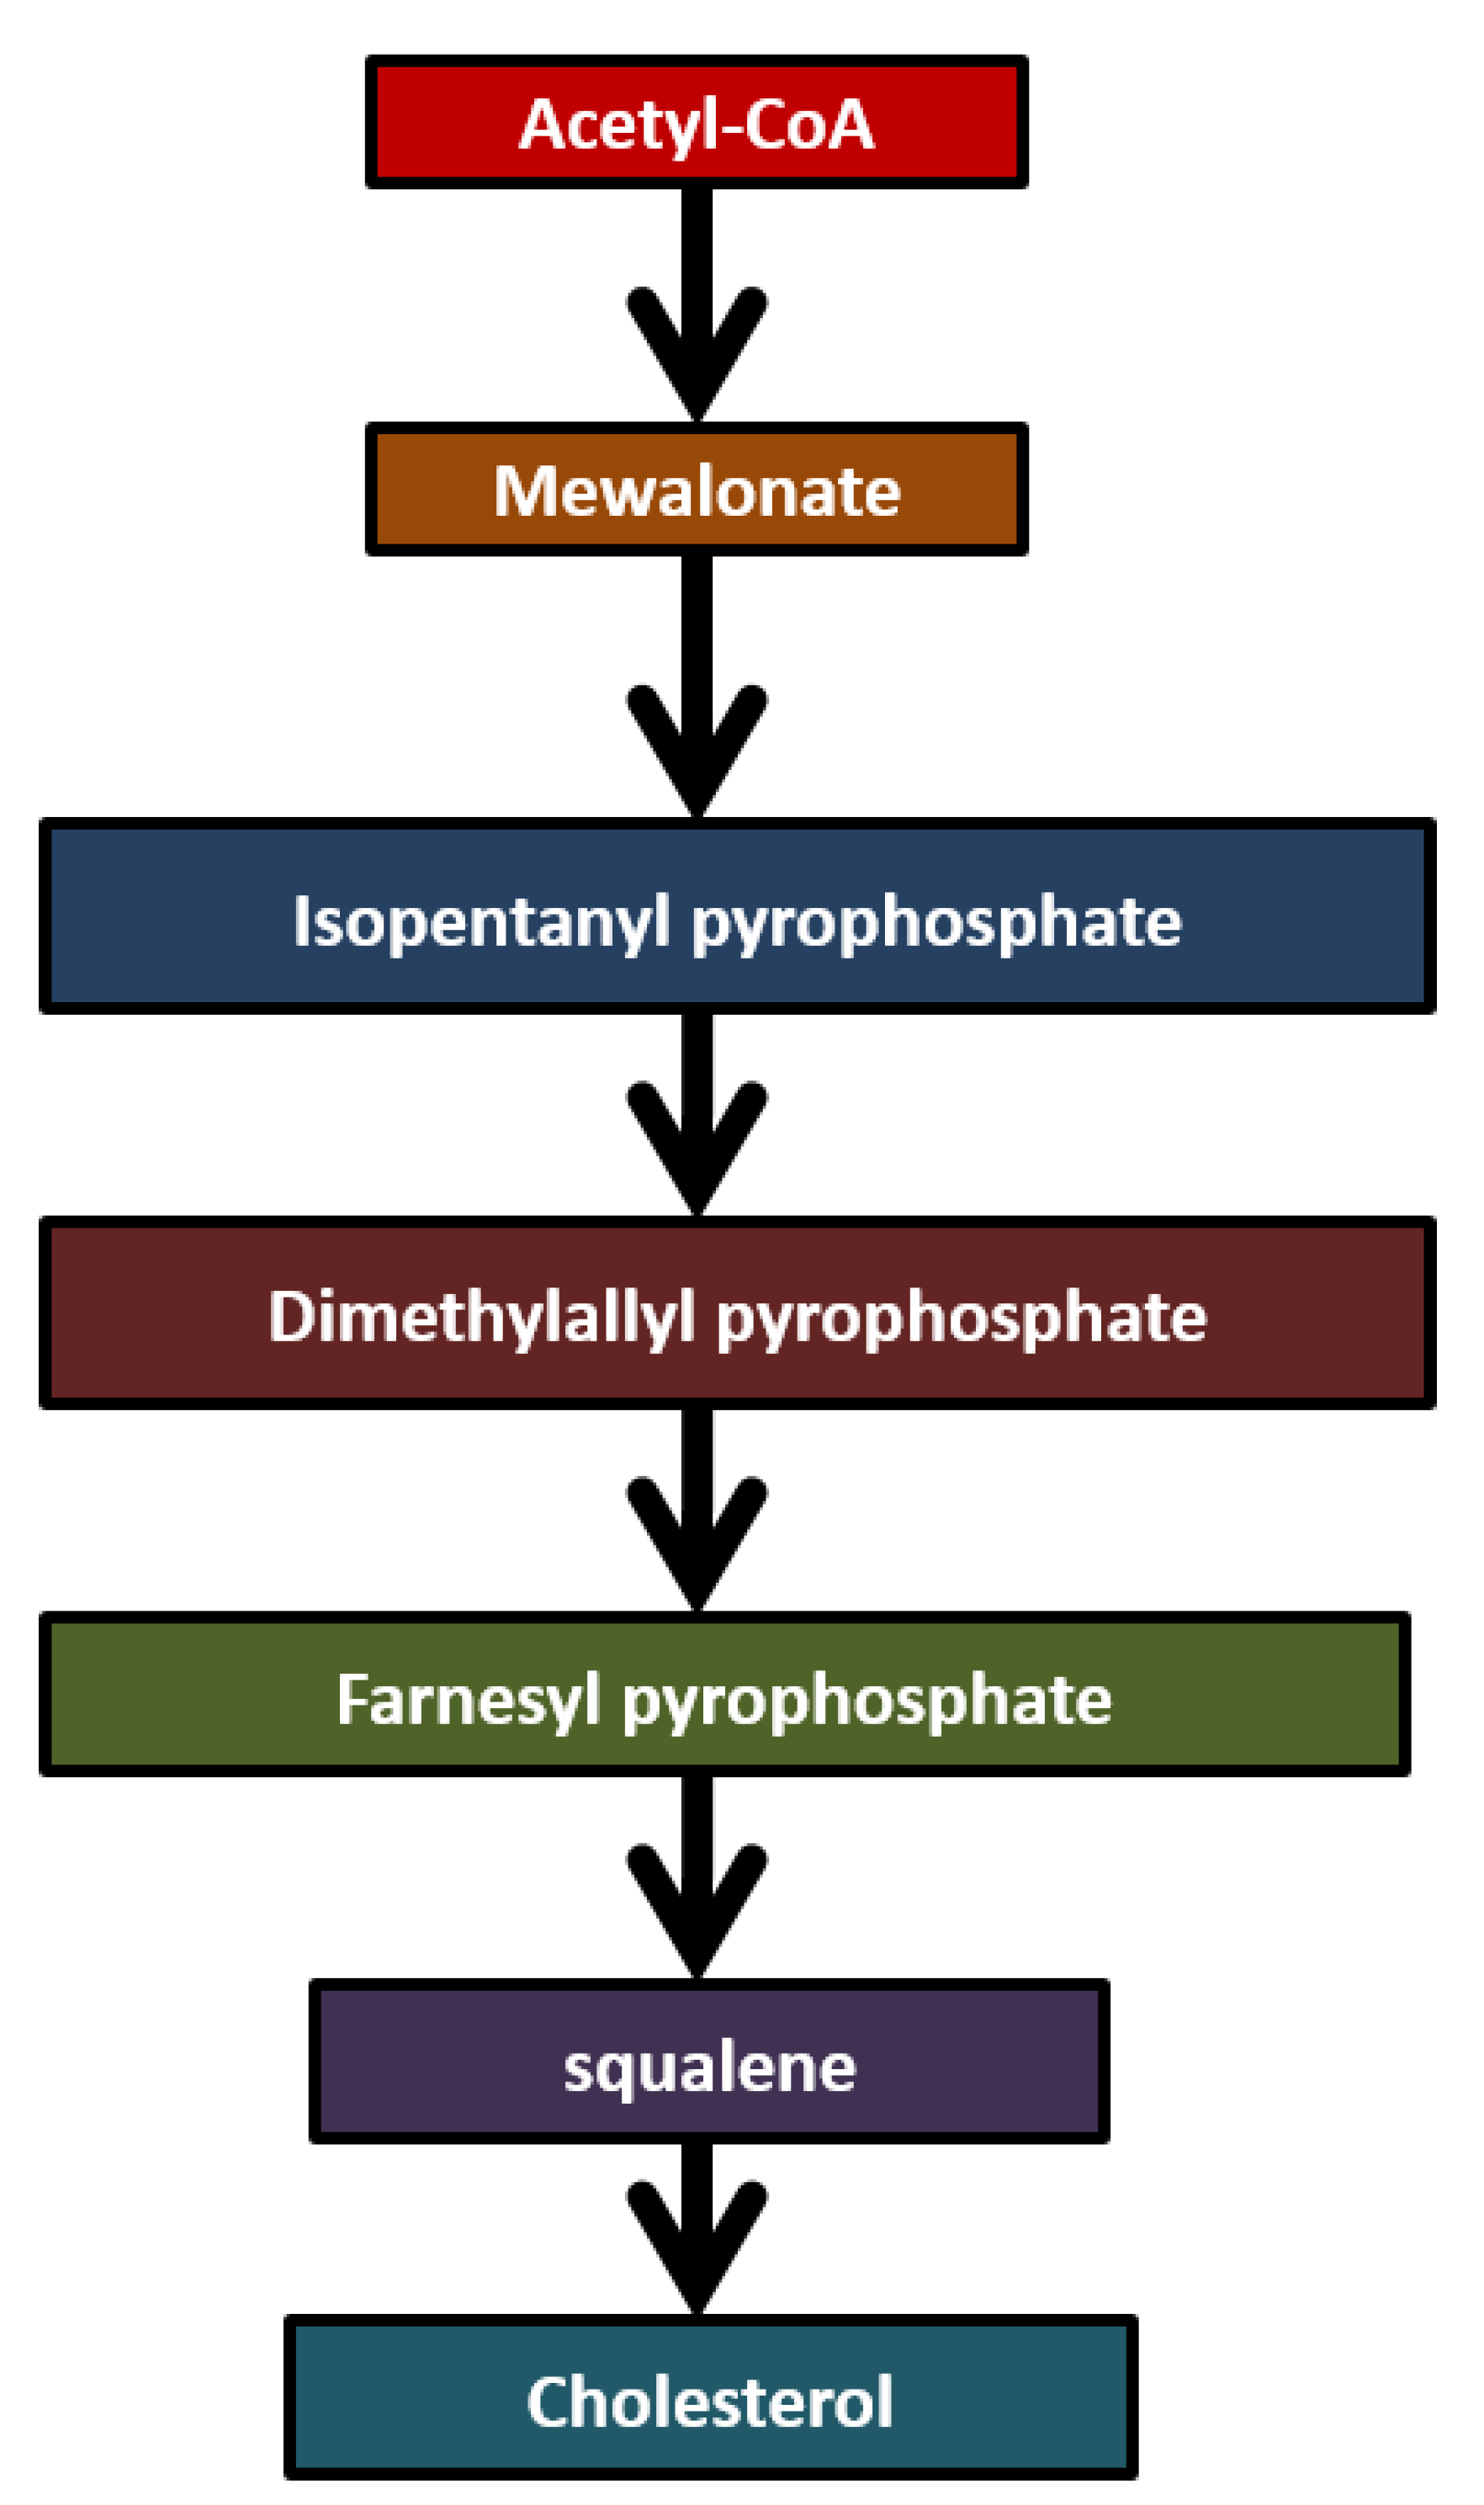
2.3. Isoprene Metabolism

2.4. Methane Metabolism
2.5. Hydrogen Sulphide Metabolism
2.6. Nitric Oxide Metabolism
2.7. Ethane and Pentane Metabolism
| Biomarkers | Sources | Diseases |
|---|---|---|
| Ammonia | Protein Metabolism | kidney failure, cirrhosis or hepatitis, hepatic encephalopathy, peptic ulcers, halitosis and asthma |
| Acetone | Acetoacetate Decarboxylation | Diabetes, lung cancer, dietary fat losses, congestive heart failure, brain seizure |
| Isoprene | Mevalonate Metabolism | disorders in cholesterol metabolism such as hypercholesterolemia |
| Methane | Intestinal bacteria metabolism of carbohydrates | Intestinal problems, colonic fermentation |
| Hydrogen Sulphide | metabolism of l-cysteine, cystathionine beta-synthase (CBS) | airway inflammation |
| Nitric Oxide | Nitric oxide Synthase | Asthma, acute lung injury, ARDS, inflammatory lung diseases, lung infection, lung cancer, rhinitis |
| Ethane | Peroxidation of polyunsaturated fatty acids | Oxidative stress, vitamin E deficiency, breast cancer, active ulcerative colitis |
| Pentane | Peroxidation of polyunsaturated fatty acids | Liver diseases, schizophrenia, breast cancer, rheumatoid arthritis, oxidative stress, acute myocardial infarction, asthma |
3. Techniques for Breath Gas Analysis
3.1. Gas Chromatography (GC)
3.1.1. Gas Chromatography-Mass Spectrometry (GC-MS)
3.1.2. Gas Chromatography-Flame Ionized Detection (GC-FID)
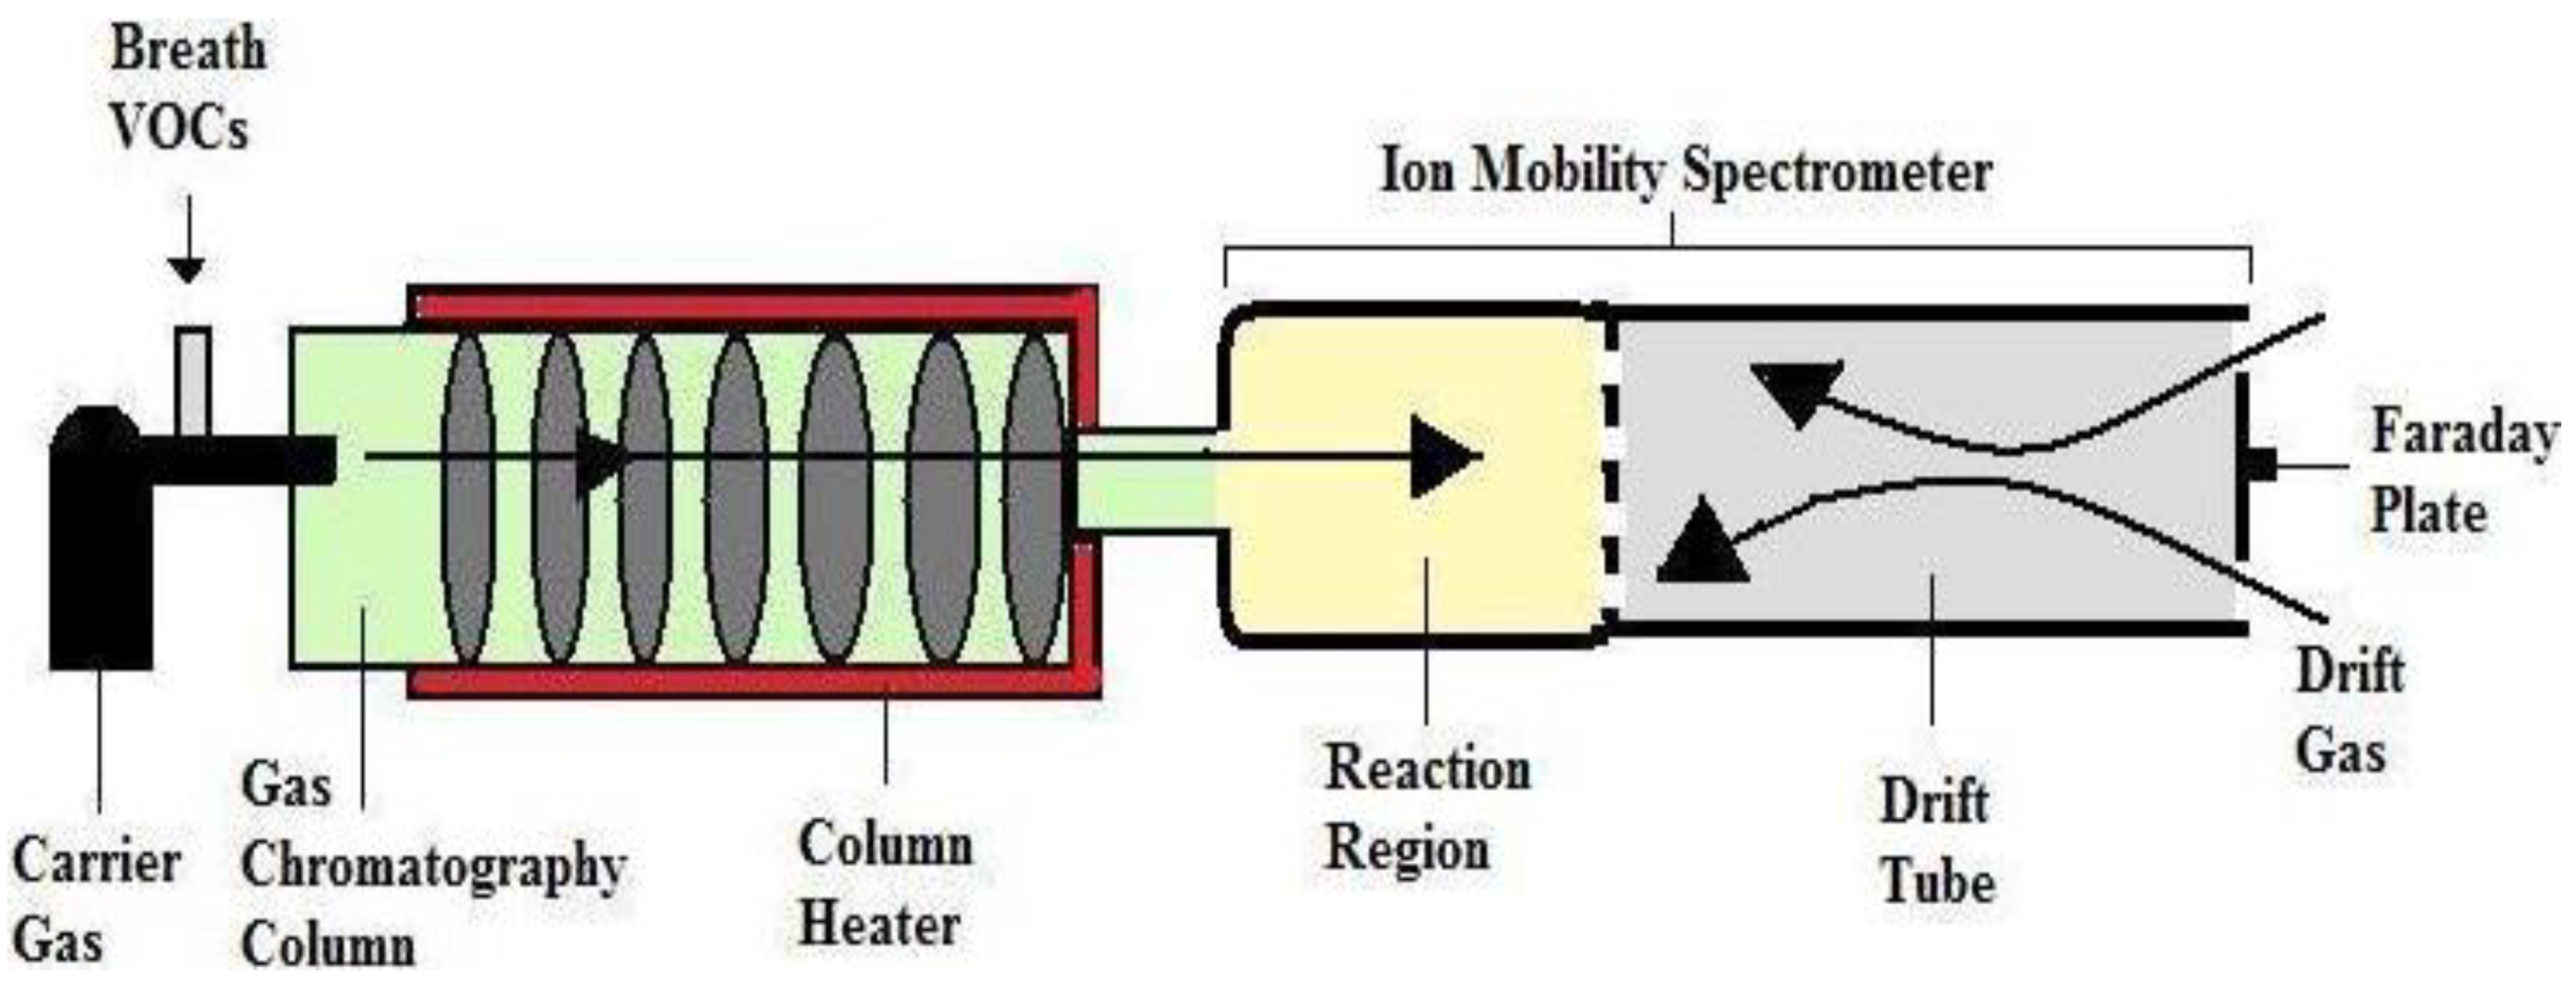
3.1.3. Gas Chromatography-Ion Mobility Spectroscopy (GC-IMS)

3.1.4. Gas Chromatography-Electrolyzer Powdered Flame Ionization Detector (GC-EFID)
3.2. Proton Transfer Reaction-Mass Spectrometry (PTR-MS)

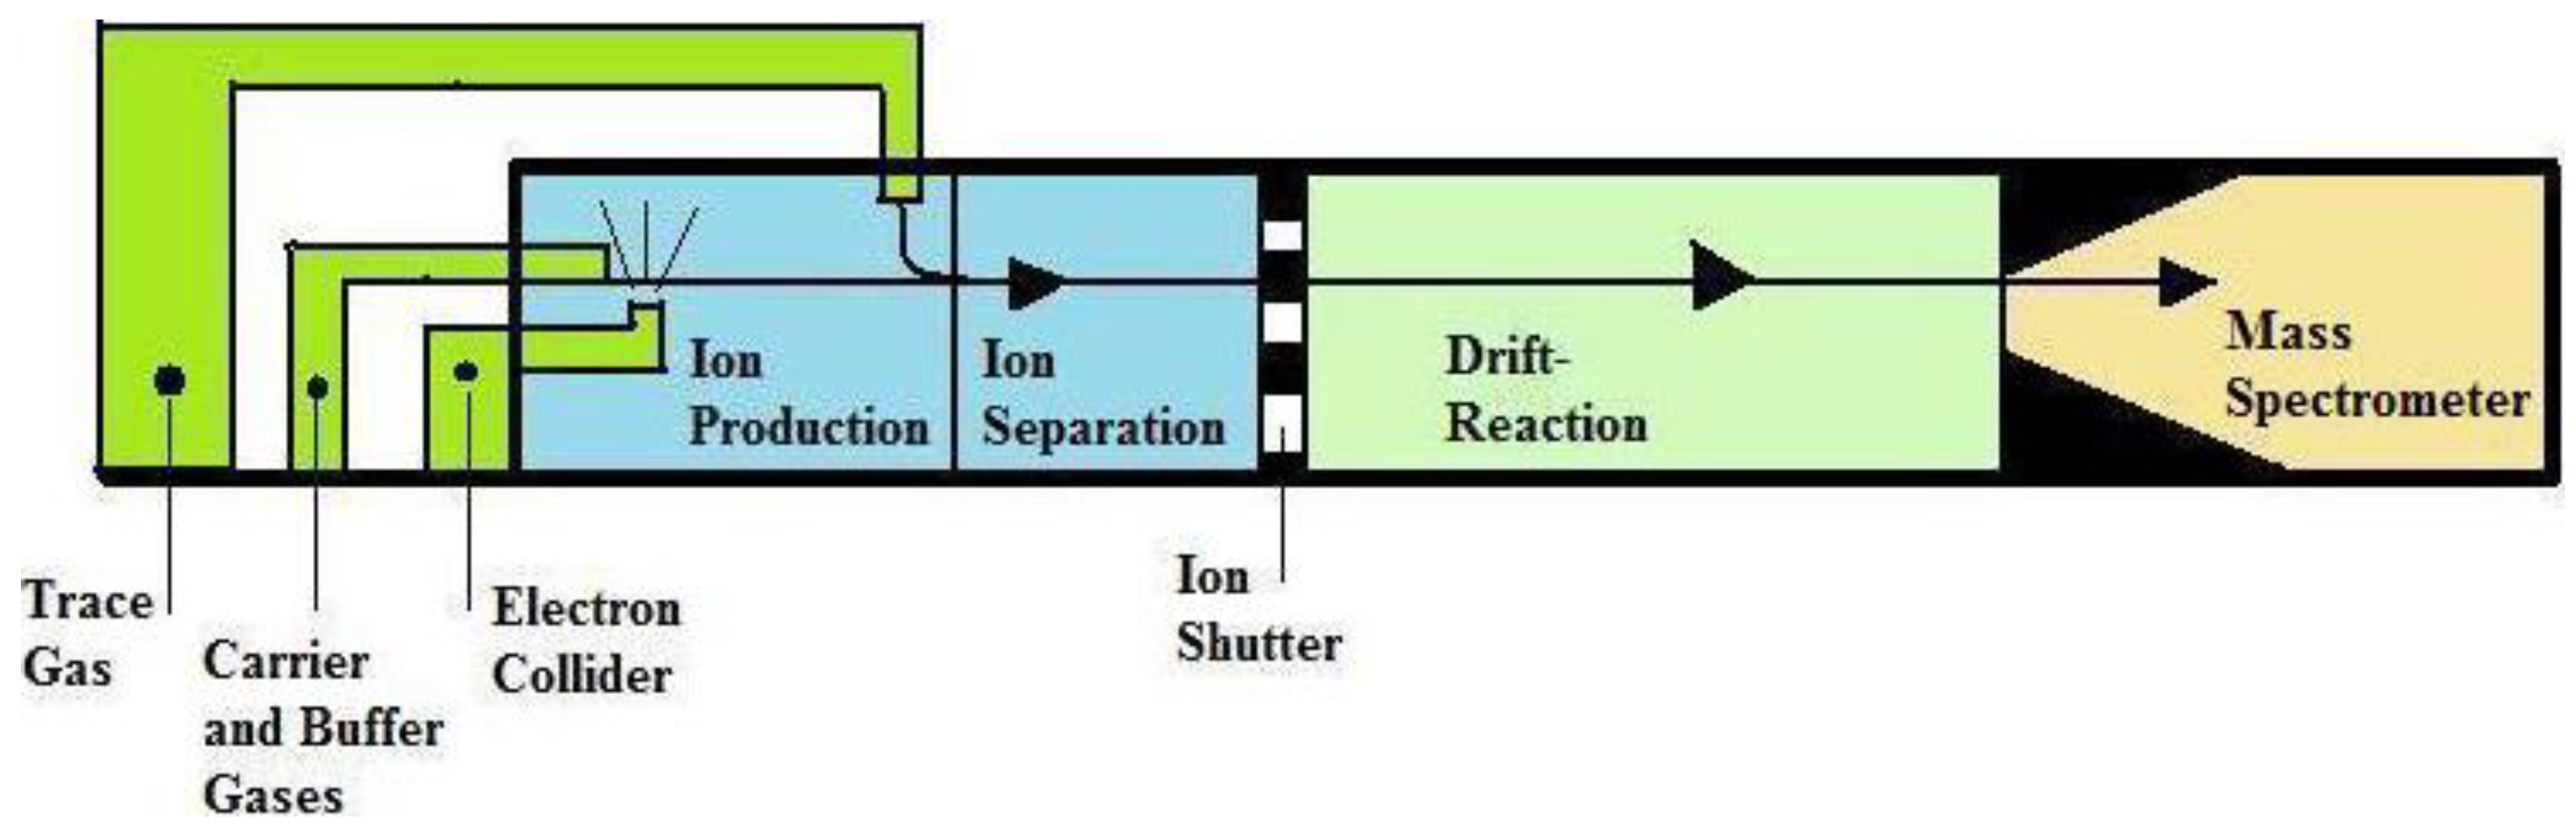
3.3. Selected Ion Flow Tube-Mass Spectrometry (SIFT-MS)

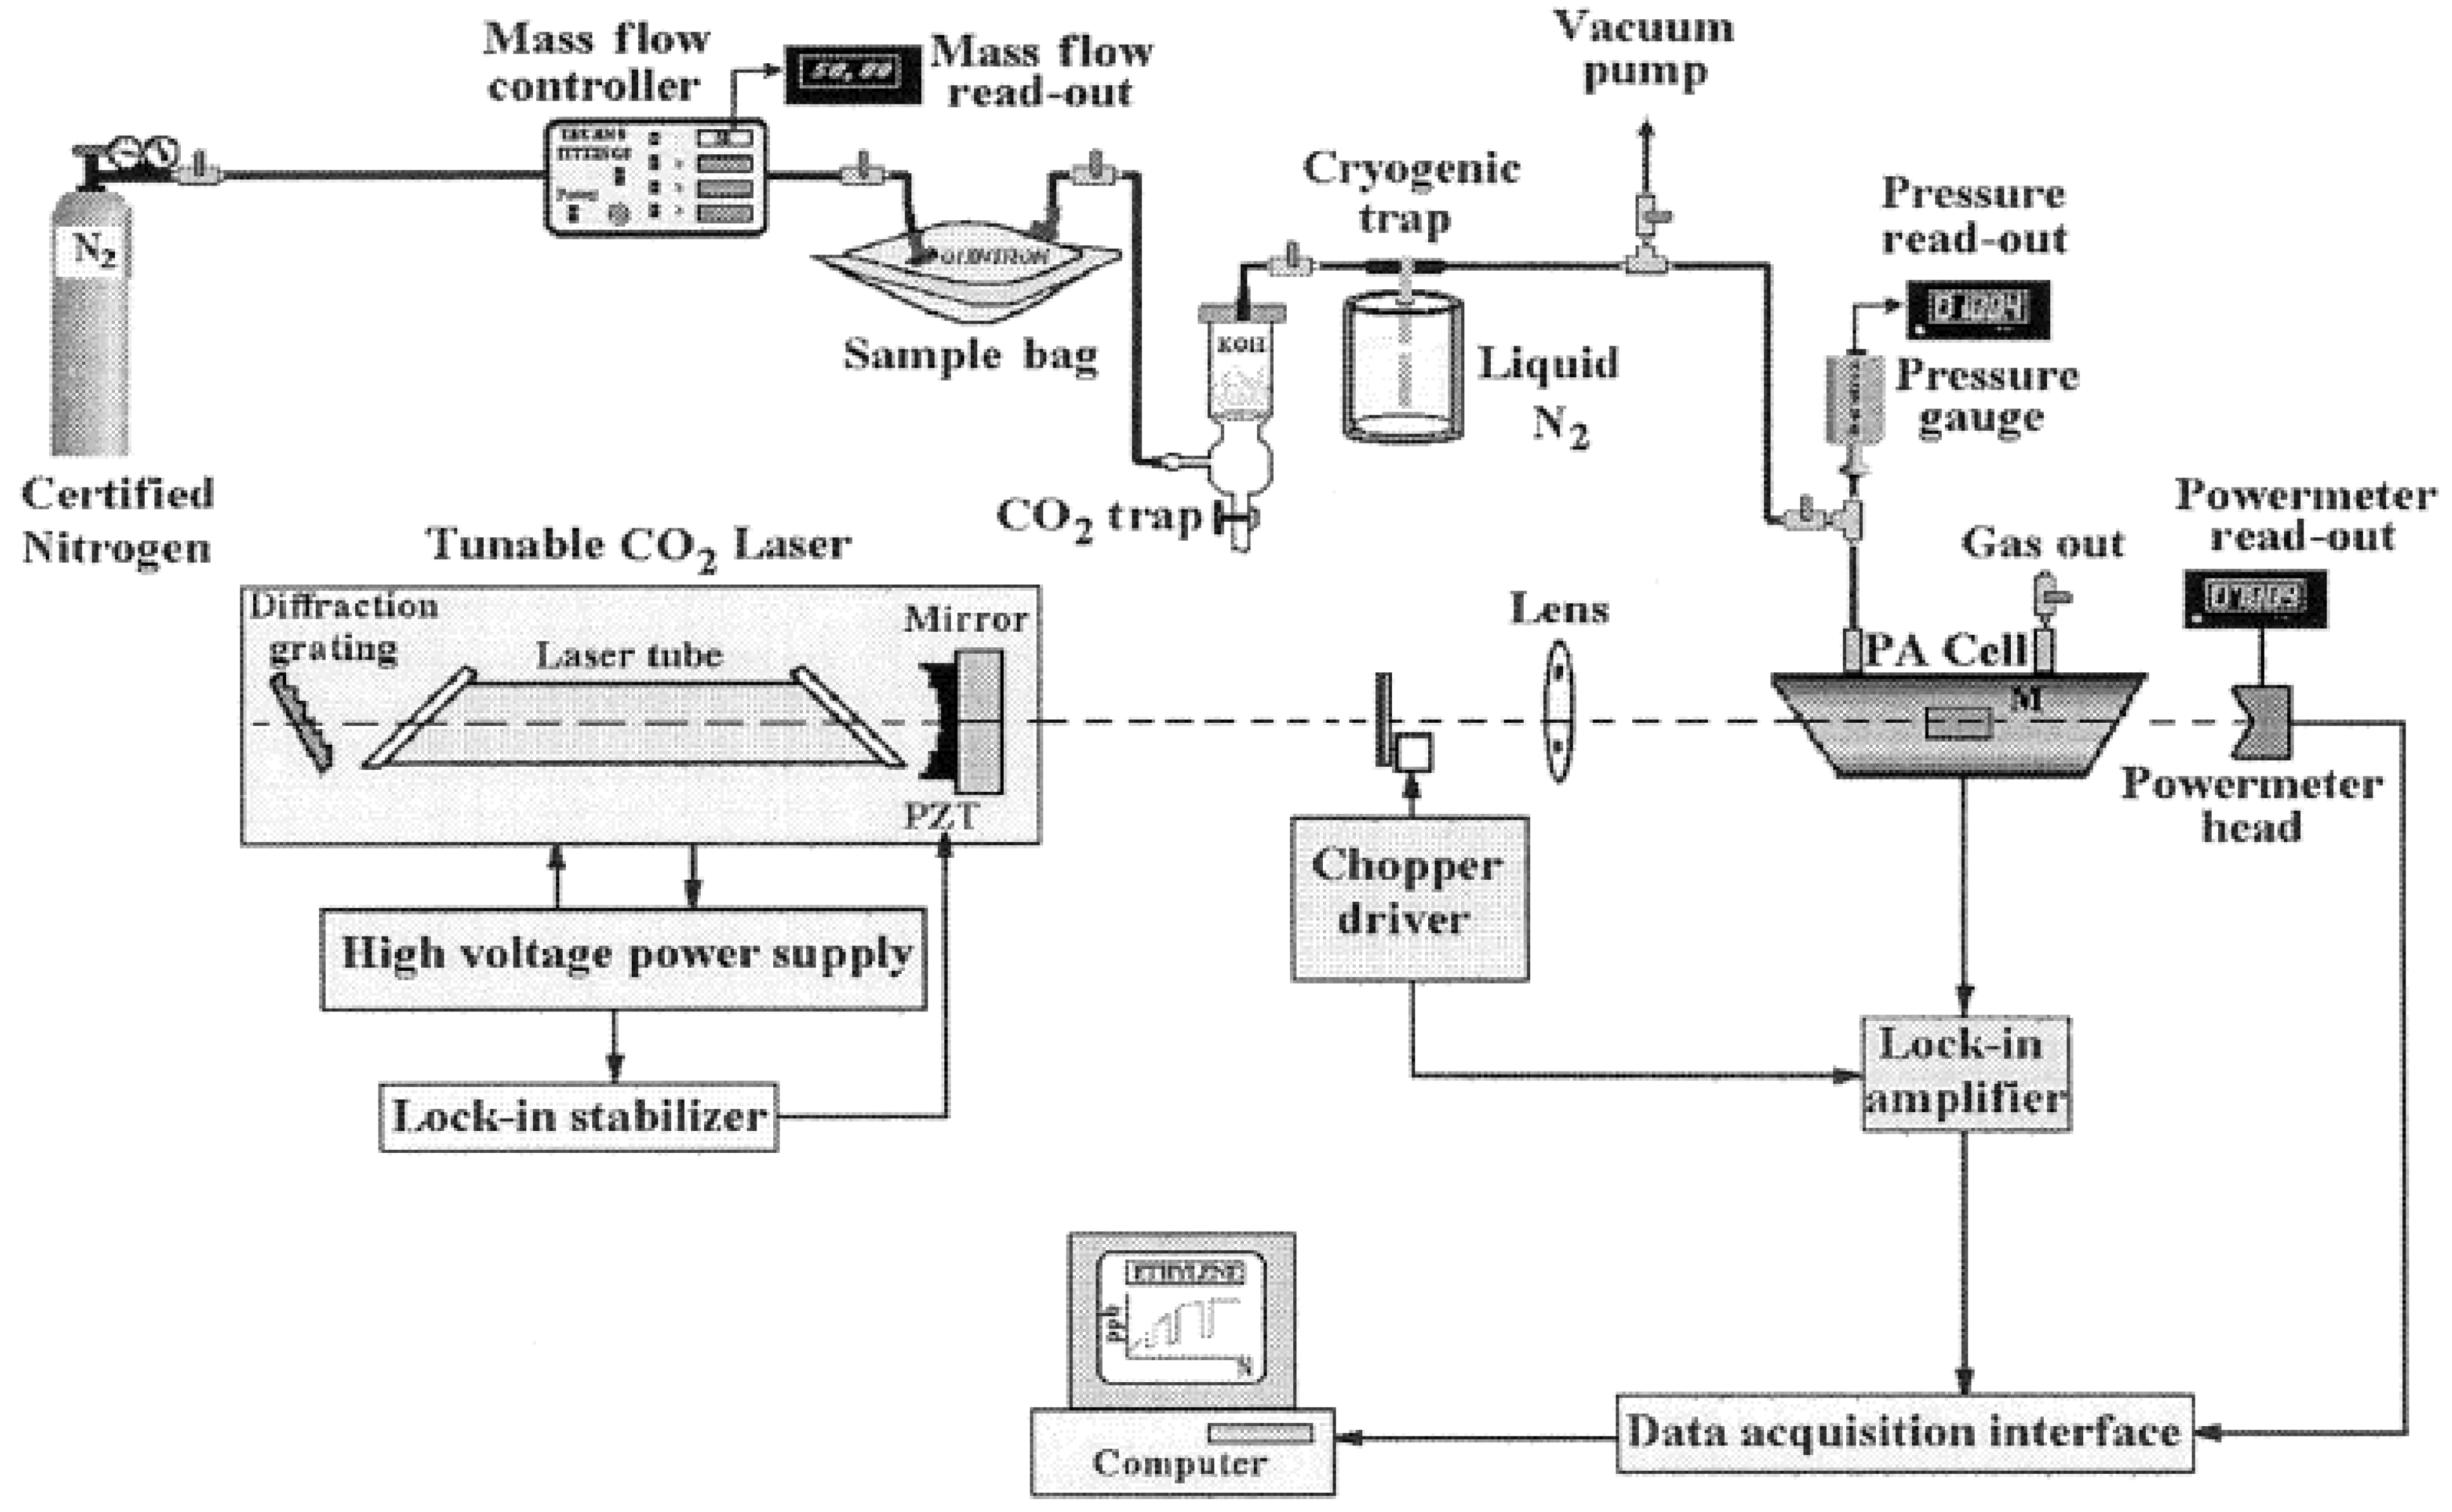
3.4. Laser Photoacoustic Spectroscopy

3.5. Chemiluminescence Analyzer
3.6. Colorimetric Sensor Arrays
3.7. Differential Mobility Spectrometer (DMS)
| Gases | Techniques | Concentration | References |
|---|---|---|---|
| Ammonia | PTR-MS | 90 ppt | [129] |
| SIFT-MS | 10 ppb | [130] | |
| GC-IMS | 4 ppt | [103] | |
| Acetone | PTR-MS | 50 ppb | [131] |
| 1.33 ± 0.19 ppm | [40] | ||
| GC-MS | 0.049 ppb | [40] | |
| Nitrogen Monoxide | Chemiluminescence | 200 ppb | [75] |
| Isoprene | PTR-MS | 100 ppb | [40] |
| SIFT-MS | 0–474 ppb | [132] | |
| Methane | SIFT-MS | 0.2 ppm | [133] |
| Ethanol | PTR-MS | 289.00 ± 67.47 | [40] |
| SIFT-MS | 0–1663 ppb | [134] |
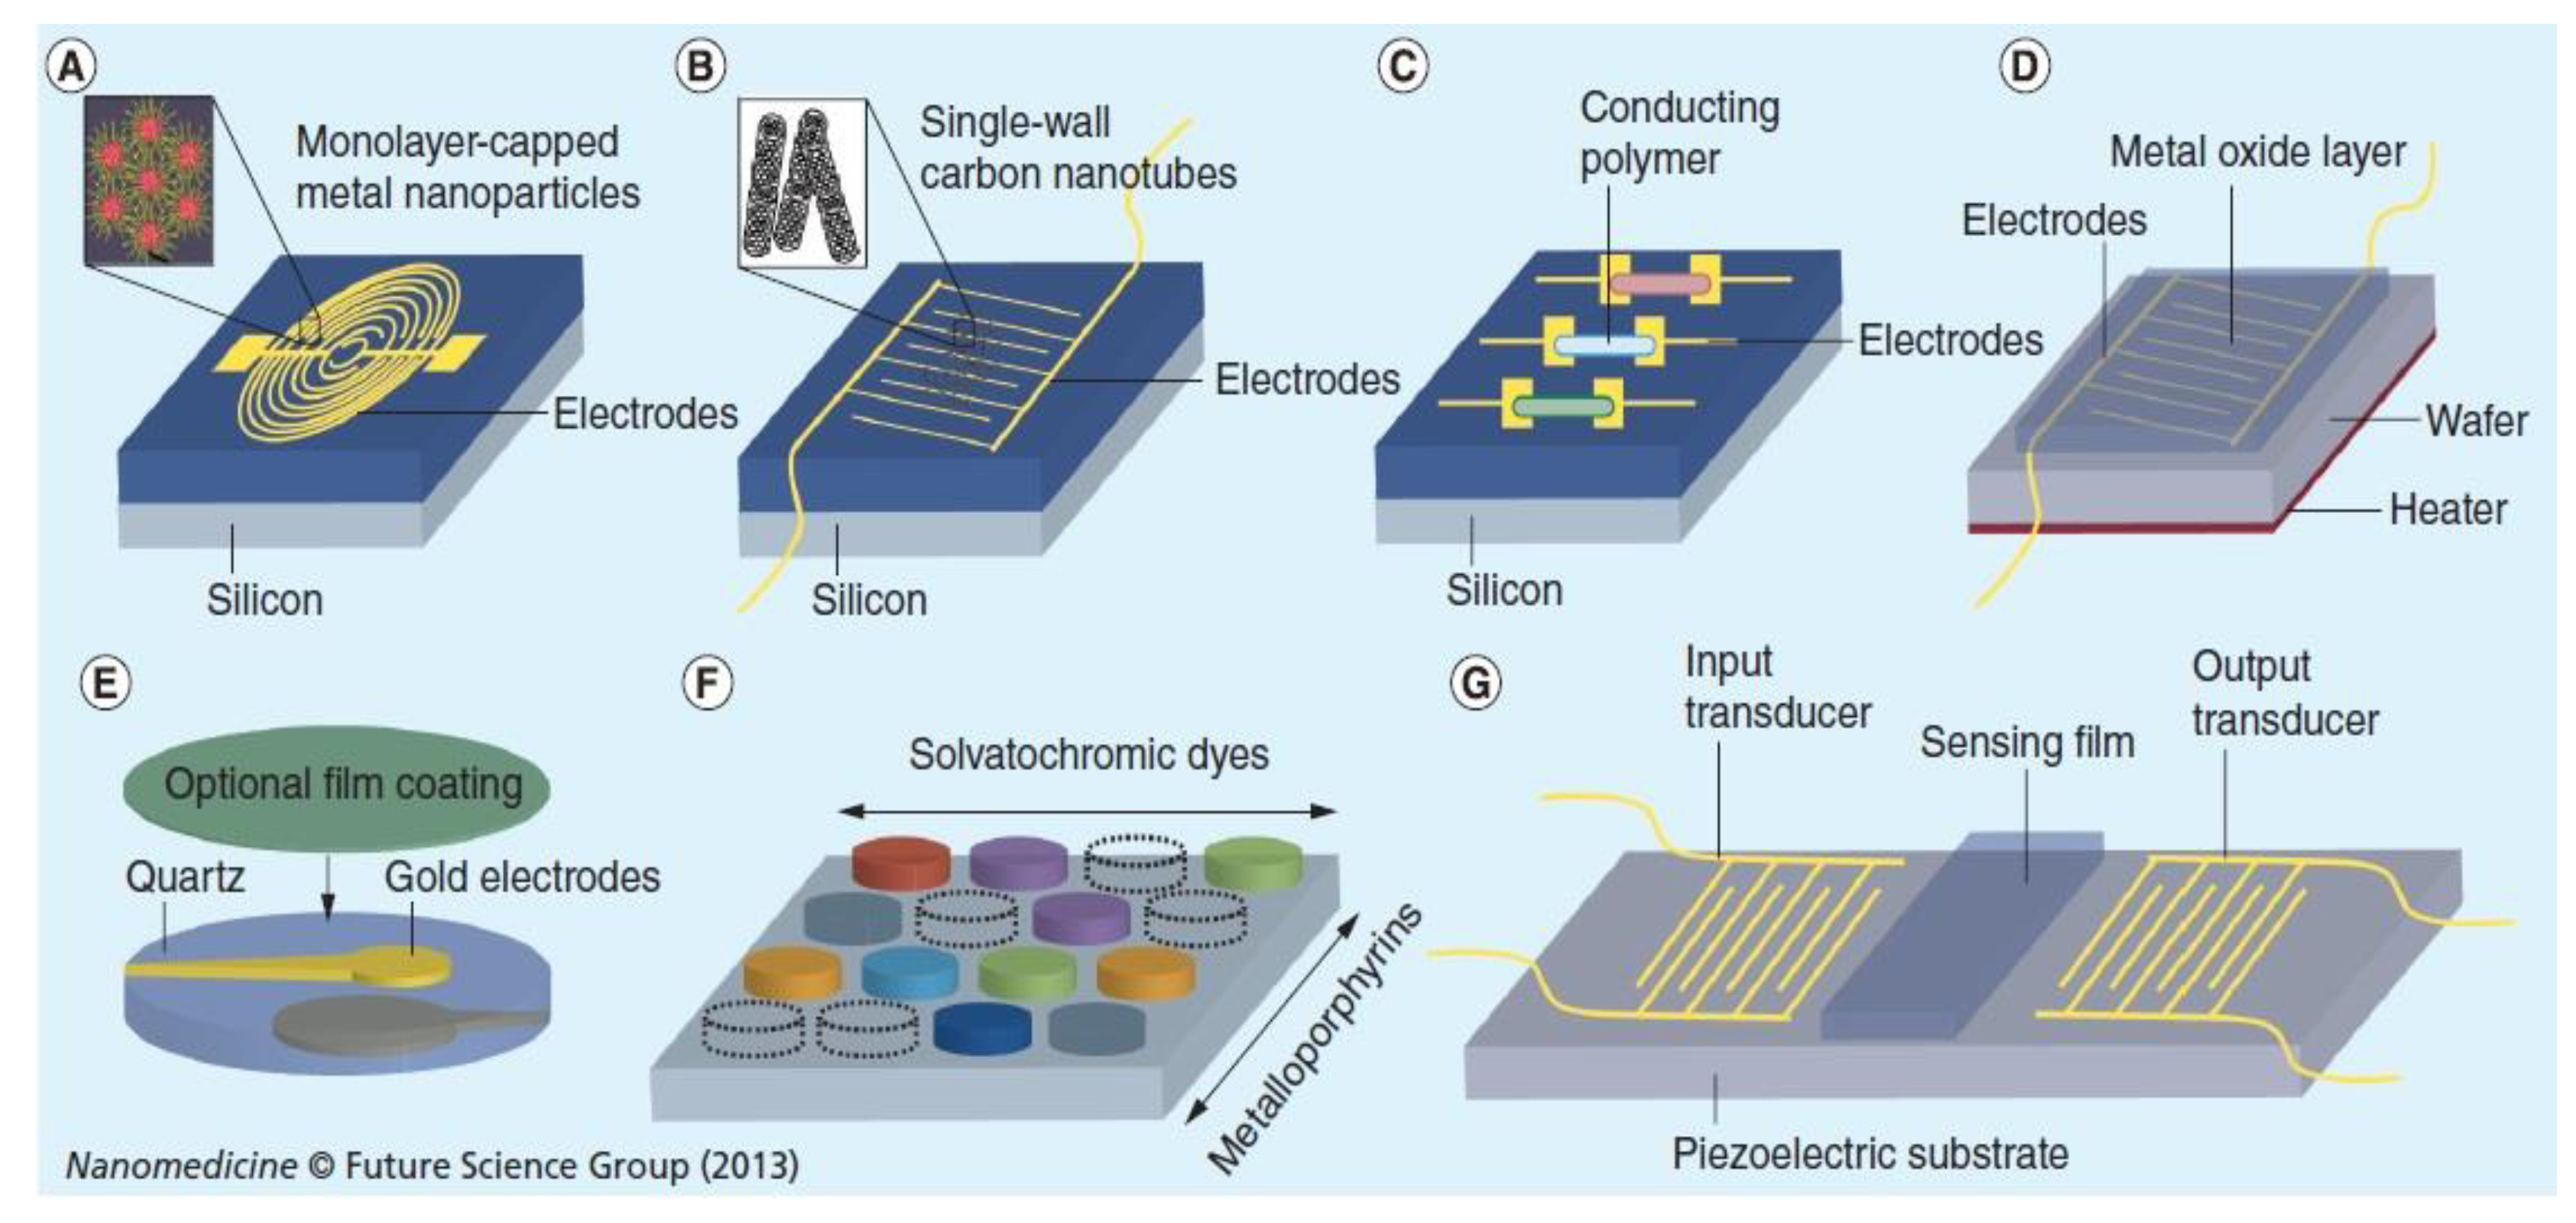
3.8. Nanomaterials for Breath Gas Analysis
| Materials | Analytical Technology/Device | Gases | Reference |
|---|---|---|---|
| Gold nanoparticles | GC-MS | VOCs | [144] |
| MoO3 Nanosensor | Nanosensor device | Isoprene, CO2, NH3 | [143] |
| Gold Nanoparticles | GC-MS | VOCs | [141] |
| Si-doped WO3 Nanoparticle | Chemiresistor/PTR-MS | Acetone | [140] |
| Tungsten trioxide (WO3) nanostructured probe | - | ethanol, methanol, isoprene, acetone | [153] |
| Gold Nanoparticles and Single Walled Carbon Nanotubes | Chemiresistor | VOCs | [136] |
| Functionalized gold nanoparticles | GC-MS | VOCs | [138] |
| Thiol derivatized gold nanoparticles sensors | GC-MS | Acetone and Ethanol | [139] |
| Nanomaterial-based (Au NP and Pt NP) sensor | GC-MS | VOCs | [148] |
| Chitosan | Chemiresistor | Acetone | [154] |
| Gold nanoparticles decorated polyaniline | Chemiresistor | VSCs | [155] |
| In2O3 and Pt-In2O3 | Chemiresistor | Acetone | [156] |
| PEDOT:PSS coated nanofibrous TiO2 | Chemiresistor | Nitric Oxide | [157] |
| MoO3 | Chemiresistor | Ammonia | [147] |
| H2SO4 solution | Chemiresistor | Ammonia | [158] |
| MWCNTs | Chemiresistor | Sleep apnea | [159] |
| Chemically functionalized carbon nanotubes | Chemiresistor | Nitric Oxide | [160] |
| Hemitubes of Pt-WO3 | Chemiresistor | Acetone | [161] |
4. Conclusions
Acknowledgements
Conflicts of Interest
References
- Bhairavi, P. Exhaled breath analysis a review of clinical applications to determine oxidative stress. Available online: http://www.researchgate.net/publication/265149864_Exhaled_Breath_Analysis_A_Review_of_Clinical_Applications_to_Determine_Oxidative_Stress (access on 17 December 2014).
- Popov, T.A. Human exhaled breath analysis. Ann. Allergy Asthma Immunol. 2011, 106, 451–456. [Google Scholar] [CrossRef] [PubMed]
- Cheng, W.-H.; Le, W.-J. Technology development in breath microanalysis for clinical diagnosis. J. Lab. Clin. Med. 1999, 133, 218–228. [Google Scholar] [CrossRef] [PubMed]
- Buszewski, B.; Kesy, M.; Ligor, T.; Amann, A. Human exhaled air analytics: Biomarkers of diseases. Biomed. Chromatogr. 2007, 21, 553–566. [Google Scholar] [CrossRef] [PubMed]
- Braun, P.X.; Gmachl, C.F.; Dweik, R.A. Bridging the collaborative gap: Realizing the clinical potential of breath analysis for disease diagnosis and monitoring-tutorial. IEEE Sens. 2012, 12, 3258–3270. [Google Scholar] [CrossRef]
- Murtz, M. Breath diagnostics using laser spectroscopy. Opt. Photonics News 2005, 16, 30–35. [Google Scholar] [CrossRef]
- Monk, P.S.; Willis, K.A. Breath analysis. Educ. Chem. 2010, 47, 110. [Google Scholar]
- Gouma, P. Selective oxide sensors as non-invasive disease monitors. SPIE Newsroom 2011. [Google Scholar] [CrossRef]
- Haick, H.; Broza, Y.Y.; Mochalski, P.; Ruzsanyi, V.; Amann, A. Assessment, origin, and implementation of breath volatile cancer markers. Chem. Soc. Rev. 2014, 43, 1423–1449. [Google Scholar] [CrossRef] [PubMed]
- Anton, A.; Pawel, M.; Vera, R.; Yoav, Y.B.; Hossam, H. Assessment of the exhalation kinetics of volatile cancer biomarkers based on their physicochemical properties. J. Breath Res. 2014, 8, 016003. [Google Scholar] [CrossRef] [PubMed]
- Broza, Y.Y.; Haick, H. Nanomaterial-based sensors for detection of disease by volatile organic compounds. Nanomedicine 2013, 8, 785–806. [Google Scholar] [CrossRef] [PubMed]
- Hakim, M.; Broza, Y.Y.; Barash, O.; Peled, N.; Phillips, M.; Amann, A.; Haick, H. Volatile Organic Compounds of Lung Cancer and Possible Biochemical Pathways. Chem. Rev. 2012, 112, 5949–5966. [Google Scholar] [PubMed]
- Konvalina, G.; Haick, H. Sensors for breath testing: From nanomaterials to comprehensive disease detection. Acc. Chem. Res. 2013, 47, 1–11. [Google Scholar]
- Shaji, J.; Jadhav, D. Breath biomarker for clinical diagnosis and different analysis technique. Res. J. Pharm. Biol. Chem. Sci. 2010, 1, 639. [Google Scholar]
- Vereb, H.; Dietrich, A.M.; Alfeeli, B.; Agah, M. The possibilities will take your breath away: Breath analysis for assessing environmental exposure. Environ. Sci. Technol. 2011, 45, 1–9. [Google Scholar] [CrossRef] [PubMed]
- Gouma, P.; Stanacevic, M. Selective nanosensor array microsystem for exhaled breath analysis. Procedia Eng. 2011, 25, 1557–1560. [Google Scholar] [CrossRef]
- Cao, W.; Duan, Y. Breath analysis: Potential for clinical diagnosis and exposure assessment. Clin. Chem. 2006, 52, 800–811. [Google Scholar] [CrossRef] [PubMed]
- Hibbard, T.; Killard, A.J. Breath ammonia analysis: Clinical application and measurement. Breath Ammon. Clin. App. Meas. 2011, 41, 21–35. [Google Scholar]
- Lindinger, W.; Hansel, A. Analysis of trace gases at ppb levels by proton transfer reaction mass spectrometry (PTR-MS). Plasma Sources Sci. Technol. 1997, 6, 111–117. [Google Scholar] [CrossRef]
- Lindinger, W.; Hansel, A.; Jordan, A. On-line monitoring of volatile organic compounds at pptv levels by means of proton-transfer-reaction mass spectrometry (PTR-MS) medical applications, food control and environmental research. J. Mass Spect. Ion Proc. 1998, 173, 191–241. [Google Scholar] [CrossRef]
- Schmidt, F.M.; Vaittinen, O.; Metsälä, M.; Lehto, M.; Forsblom, C.; Groop, P.H.; Halonen, L. Ammonia in breath and emitted from skin. J. Breath Res. 2013, 7, 017109. [Google Scholar] [CrossRef] [PubMed]
- Warneke, C.; Kuczynski, J.; Hansel, A.; Jordan, A.; Vogel, W.; Lindinger, W. Proton transfer reaction mass spectrometry (PTR-MS): Propanol in human breath. J. Mass Spect. Ion Proc. 1996, 154, 61–70. [Google Scholar] [CrossRef]
- Galassetti, P.R.; Novak, B.; Nemet, D.; Rose-Gottron, C.; Cooper, D.M.; Meinardi, S.; Newcomb, R.; Zaldivar, F.; Blake, D.R. Breath ethanol and acetone as indicators of serum glucose levels: An initial report. Diabetes Technol. Ther. 2005, 7, 115–123. [Google Scholar] [CrossRef] [PubMed]
- Perez-Guaita, D.; Kokoric, V.; Wilk, A.; Garrigues, S.; Mizaikoff, B. Towards the determination of isoprene in human breath using substrate-integrated hollow waveguide mid-infrared sensors. J. Breath Res. 2014, 8, 1–8. [Google Scholar] [CrossRef]
- Berg, J.M.; Tymoczko, J.L.; Stryer, L. Protein turnover and amino acid catabolism. In Biochemistry, 5th ed.; W H Freeman: New York, NY, USA, 2002; pp. 633–659. [Google Scholar]
- Voet, D.; Voet, J.G.; Pratt, C.A. The urea cycle. In Fundamentals of Biochemistry; Wiley: New York, NY, USA, 1999; pp. 620–624. [Google Scholar]
- Tate, P. Protein Metabolism. In Seeley’s Principles of Anatomy and Physiology; McGraw-Hill Companies, Inc.: New York, NY, USA, 2009; pp. 704–743. [Google Scholar]
- Essiet, I.O. Diagnosis of kidney failure by analysis of the concentration of ammonia in exhaled human breath. J. Emerg. Trends Eng. Appl. Sci. 2013, 4, 859–862. [Google Scholar]
- Butterworth, R.F. Hepatic encephalopathy. Alcohol Res. Health 2003, 27, 240–246. [Google Scholar] [PubMed]
- National Digestive Diseases Clearing House. Available online: http://digestive.niddk.nih.gov/diseases/pubs/hpylori/index.htm (accessed on 17 December 2014).
- Society of Nuclear Medicine Procedure Guideline for C-14 Urea Breath Test. Available online: http://interactive.snm.org/docs/pg_ch07_0403.pdf (accessed on 17 December 2014).
- Kearney, D.J.; Hubbard, T.; Putnam, D. Breath ammonia measurement in Helicobacter pylori infection. Dig. Dis. Sci. 2002, 47, 25232–25530. [Google Scholar] [CrossRef]
- Amano, A. Monitoring ammonia to assess halitosis. Oral Surg. Oral Med. Oral Pathol. 2002, 94, 692–696. [Google Scholar] [CrossRef]
- Van den Broek, A.M.; Feenstra, L.; de Baat, C. A review of the current literature on aetiology and measurement methods of halitosis. J. Dent. 2007, 35, 627–635. [Google Scholar] [CrossRef] [PubMed]
- MacGregor, G. Breath condensate ammonium is lower in children with chronic asthma. Eur. Respir. J. 2005, 26, 271–276. [Google Scholar] [CrossRef] [PubMed]
- Nilsson, A. Development of a handheld meter for monitoring of diabetes using exhaled air. Available online: http://www.tekniskdesign.se/download/Rapport_Exjobb_-_AndersNilsson_-_INLAGA.pdf (accessed on 17 December 2014).
- Crofford, O.B.; Mallard, R.E.; Winton, R.E.; Rogers, N.L.; Jackson, C.; Keller, U. Acetone in Breath and blood. Trans. Am. Clin. Climatol. Assoc. 1977, 88, 128–139. [Google Scholar] [PubMed]
- Reichard, G.A.; Skutches, C.L.; Hoeldtke, R.D.; Owen, E.O. Acetone metabolism in humans during diabetic ketoacidosis. Diabetes 1986, 35, 1–7. [Google Scholar] [CrossRef] [PubMed]
- Deng, C.; Zhang, J.; Yu, X.; Zhang, W.; Zhang, X. Determination of acetone in human breath by gas chromatography-mass spectrometry and solid-phase microextraction with on-fiber derivatization. J. Chromatogr. 2004, 810, 269–275. [Google Scholar]
- Massick, S. Portable Breath Acetone Measurements Combine Chemistry and Spectroscopy; Southwest Sciences, Inc.: Santa Fe, NM, USA; pp. 1–3.
- Toyooka, T.; Hiyama, S.; Yamada, Y. A prototype portable breath acetone analyzer for monitoring fat loss. J. Breath Res. 2013, 7, 1–8. [Google Scholar] [CrossRef]
- King, J.; Koc, H.; Unterkoflera, K.; Mochalski, P.; Kupferthalera, A.; Teschl, G.; Teschl, S.; Hinterhuber, H.; Amanna, A. Physiological modeling of isoprene dynamics in exhaled breath. J. Theoret. Biol. 2010, 267, 1–14. [Google Scholar] [CrossRef]
- Mendis, S.; Sobotka, P.A.; Euler, D.E. Expired hydrocarbons in patients with acute myocardinal infarction. Free Rad. Res. 1995, 23, 117–122. [Google Scholar] [CrossRef]
- McGrath, L.T.; Patrick, R.; Silke, B. Breath isoprene in patients with heart failure. Eur. J. Heart Fail. 2001, 3, 423–427. [Google Scholar] [CrossRef] [PubMed]
- Bajtarevic, A.; Ager, C.; Pienz, M.; Klieber, M.; Schwarz, K.; Ligor, M.; Ligor, T.; Filipiak, W.; Denz, H.; Fiegl, M.; et al. Noninvasive detection of lung cancer by analysis of exhaled breath. BMC Cancer 2009, 9, 1–16. [Google Scholar] [CrossRef] [PubMed]
- Kinoyama, M.; Nitta, H.; Ohta, T.; Hatase, Y.; Hara, S.; Hirakawa, K.; Watanabe, K.; Watanabe, A.; Ueda, H. Diurnal variation in the concentration of methane in the breath of methane producers. Microb. Ecol. Health Dis. 2006, 18, 47–54. [Google Scholar] [CrossRef]
- De Lacy Costelo, J.P.B.; Ledochowski, M.; Ratcliffe, M.N. The importance of methane breath. testing: A review. J. Breath Res. 2013, 7, 024001. [Google Scholar] [CrossRef] [PubMed]
- Tuboly, E.; Szabo, A.; Eros, G.; Mohacsi, A.; Szabo, G.; Tengölics, R.; Rakhely, G.; Boros, M. Determination of endogenous methane formation by photoacoustic spectroscopy. J. Breath Res. 2013, 7, 1–9. [Google Scholar] [CrossRef]
- Toombs, C.F.; Insko, M.A.; Wintner, E.A.; Deckwerth, T.L.; Usansky, H.; Jamil, K.; Goldstein, B.; Cooreman, M.; Szabo, C. Detection of exhaled hydrogen sulphide gas in healthy human volunteers during intravenous administration of sodium sulphide. Br. J. Clin. Pharmacol. 2010, 69, 626–636. [Google Scholar] [CrossRef] [PubMed]
- Wu, R.; Yao, W.Z.; Chen, Y.H.; Geng, B.; Tang, C.S. Plasma level of endogenous hydrogen sulfide in patients with acute asthma. (in Chinese). Beijing Da Xue Xue Bao 2008, 40, 505–508. [Google Scholar] [PubMed]
- Chen, Y.H.; Yao, W.Z.; Gao, J.Z.; Geng, B.; Wang, P.P.; Tang, C.S. Serum hydrogen sulfide as a novel marker predicting bacterial involvement in patients with community-acquired lower respiratory tract infections. Respirology 2009, 14, 746–752. [Google Scholar] [CrossRef] [PubMed]
- Wang, P.; Zhang, G.; Wondimu, T.; Ross, B.; Wang, R. Hydrogen sulfide and asthma. Exp. Physiol. 2014, 96, 1–17. [Google Scholar]
- Bernard, C.; Tripier, A. Leconssur les effets des substances toxiques et medicamenteuses. (in French). Available online: http://gallica.bnf.fr/ark:/12148/bpt6k773289 (accessed on 16 December 2014).
- Furne, J.; Saeed, A.; Levitt, M.D. Levitt Whole tissue hydrogen sulfide concentrations are orders of magnitude lower than presently accepted values. Am. J. Physiol. Regul. Integr. Comp. Physiol. 2008, 295, 1479–1485. [Google Scholar] [CrossRef]
- Rosenberg, M.; McCulloch, C.A. Measurement of oral malodor: Current methods and future prospects. J. Periodontol. 1992, 63, 776–782. [Google Scholar] [CrossRef] [PubMed]
- Suarez, F.L.; Furne, K.J.; Springfield, J.; Levitt, D.M. Morning breath odor: Influence of treatments on sulfur gases. J. Dent. Res. 2000, 79, 1773–1777. [Google Scholar] [CrossRef] [PubMed]
- Miller, D.L.; Roth, M.B. Hydrogen sulfide increases thermotolerance and lifespan in Caenorhabditis elegans. Proc. Natl. Acad. Sci. USA 2007, 104, 20618–20622. [Google Scholar] [CrossRef] [PubMed]
- Blackstone, E.; Roth, M.B. Suspended animation-like state protects mice from lethal hypoxia. Shock 2007, 27, 370–372. [Google Scholar] [CrossRef] [PubMed]
- Rosenberg, M. Clinical assessment of bad breath: Current concepts. J. Am. Dent. Assoc. 1996, 127, 475–482. [Google Scholar] [CrossRef] [PubMed]
- Lundberg, J.O.; Weitzberg, E.; Lundberg, J.M.; Alving, K. Nitric oxide in exhaled air. Eur. Respir. J. 1996, 9, 2671–2680. [Google Scholar] [CrossRef] [PubMed]
- Gustafsson, L.E.; Leone, A.M.; Persson, M.G.; Wiklund, N.P.; Moncada, S. Endogenous nitric oxide is present in the exhaled air of rabbits, guinea pigs and humans. Biochem. Biophys. Res. Commun. 1991, 181, 852–857. [Google Scholar] [CrossRef] [PubMed]
- Barnes, P.J. Nitric oxide and airway disease. Ann. Med. 1995, 27, 389–393. [Google Scholar] [CrossRef] [PubMed]
- Archer, S. Measurement of nitric oxide in biological models. FASEB J. 1993, 7, 349–360. [Google Scholar] [PubMed]
- Saleh, D.; Ernst, P.; Lim, S.; Barnes, P.J.; Giaid, A. Increased formation of the potent oxidant peroxynitrite in the airways of asthmatic patients is associated with induction of nitric oxide synthase: Effect of inhaled glucocorticoid. FASEB J. 1998, 12, 929–937. [Google Scholar] [PubMed]
- Exhaled nitric oxide in patients with asthma: association with NOS1 genotype. Available online: http://www.aai.mf.vu.lt/alerimun/bibliografija/arch_2001/aai2.pdf (accessed on 16 December 2014).
- Pavord, I.D.; Shaw, D.E.; Gibson, P.G.; Taylor, D.R. Inflammometry to assess airway diseases. Lancet 2008, 372, 1017. [Google Scholar] [CrossRef] [PubMed]
- Kharitonov, S.A.; Yates, D.; Barnes, P.J. Increased nitric oxide in exhaled air of normal human subjects with upper respiratory tract infections. Eur. Respir. J. 1995, 8, 295–297. [Google Scholar] [CrossRef] [PubMed]
- Barnes, P.J.; Kharitonov, S.A. Exhaled nitric oxide: A new lung function test. Thorax 1996, 51, 233–237. [Google Scholar] [CrossRef] [PubMed]
- Maziak, W.; Loukides, S.; Culpitt, S.; Sullivan, P.; Kharitonov, S.A.; Barnes, P.J. Exhaled nitric oxide in chronic obstructive pulmonary disease. Am. J. Respir. Crit. Care Med. 1998, 157, 998–1002. [Google Scholar] [CrossRef] [PubMed]
- Dotsch, J.; Demirakca, S.; Terbrack, H.G.; Huls, G.; Rascher, W.; Kuhl, P.G. Airway nitric oxide in asthmatic children and patients with cystic fibrosis. Eur. Respir. J. 1996, 9, 2537–2540. [Google Scholar] [CrossRef] [PubMed]
- Riely, C.A.; Cohen, G.; Lieberman, M. Ethane evolution: A new index of lipid peroxidation. Science 1974, 183, 208–210. [Google Scholar] [CrossRef] [PubMed]
- Handelman, G.J.; Rosales, L.M.; Barbato, D.; Luscher, J.; Adhikarla, R.; Nicolosi, R.J.; Finkelstein, F.O.; Ronco, C.; Kaysen, G.A.; Hoenich, N.A.; et al. Breath ethane in dialysis patients and control subjects. Free Radic. Biol. Med. 2003, 35, 17–23. [Google Scholar] [CrossRef] [PubMed]
- Breiman, L. Random forests. Mach. Learn. 2001, 45, 5–32. [Google Scholar] [CrossRef]
- Efron, B. Bootstrap methods: Another look at the jackknife. Ann. Stat. 1979, 7, 1–26. [Google Scholar] [CrossRef]
- Mazzone, P.J.; Hammel, J.; Dweik, R.; Na, J.; Czich, C.; Laskowski, D.; Mekhail, T. Diagnosis of lung cancer by the analysis of exhaled breath with a colorimetric sensor array. Thorax 2007, 62, 565–568. [Google Scholar] [CrossRef] [PubMed]
- Shawe-Taylor, J.; Cristianini, N. Kernel Methods for Pattern Analysis; Cambridge University Press: Cambridge, UK, 2004. [Google Scholar]
- Guyon, I.; Weston, J.; Barnhill, S. Gene selection for cancer classification using support vector machine. Mach. Learn. 2002, 46, 389–422. [Google Scholar] [CrossRef]
- Paredi, P.; Kharitonov, S.A.; Leak, D.; Ward, S.; Cramer, D.; Barnes, P.J. Exhaled ethane, a marker of lipid peroxidation, is elevated in chronic obstructive pulmonary disease. Am. J. Respir. Crit. Care Med. 2000, 162, 369–373. [Google Scholar] [CrossRef] [PubMed]
- Dillard, C.J.; Tappel, A.L. Lipid peroxidation products in biological tissues. Free Radic. Biol. Med. 1989, 7, 193–196. [Google Scholar] [CrossRef] [PubMed]
- Knutson, M.D.; Handelman, G.J.; Viteri, F.E. Methods for measuring ethane and pentane in expired air from rats and humans. Free Radic. Biol. Med. 2000, 28, 514–519. [Google Scholar] [CrossRef] [PubMed]
- Scotter, J.M.; Allardyce, R.A.; Langford, V.S.; Hill, A.; Murdoch, D.R. The rapid evaluation of bacterial growth in blood cultures by selected ion flow tube-mass spectrometry (SIFT-MS) and comparison with the BacT/ALERT automated blood culture system. J. Microbiol. Methods 2006, 65, 628–631. [Google Scholar] [CrossRef]
- Thorn, R.M.; Reynolds, D.M.; Greenman, J. Multivariate analysis of bacterial volatile compound profiles for discrimination between selected species and strains in vitro. J. Microbiol. Methods 2011, 84, 258–264. [Google Scholar] [CrossRef] [PubMed]
- Allardyce, R.A.; Hill, A.L.; Murdoch, D.R. The rapid evaluation of bacterial growth and antibiotic susceptibility in blood cultures by selected ion flow tube mass spectrometry. Diagn. Microbiol. Infect. Dis. 2006, 55, 255–261. [Google Scholar] [CrossRef]
- Wendland, B.E.; Aghdassi, E.; Tam, C.; Carrrier, J.; Steinhart, A.H.; Wolman, S.L.; Baron, D.; Allard, J.P. Lipid peroxidation and plasma antioxidant micronutrients in Crohn’s disease. Am. J. Clin. Nutr. 2001, 74, 259–264. [Google Scholar] [PubMed]
- Olopade, C.O.; Christon, J.A.; Zakkar, M.; Hua, C.; Swedler, W.I.; Scheff, P.A.; Rubinstein, I. Exhaled pentane and nitric oxide levels in patients with obstructive sleep apnea. Chest 1997, 111, 1500–1504. [Google Scholar] [CrossRef] [PubMed]
- Hietanen, E.; Bartsch, H.; Bereziat, J.C.; Camus, A.M.; McClinton, S.; Eremin, O.; Davidson, L.; Boyle, P. Diet and oxidative stress in breast, colon and prostate cancer patients: A case-control study. Eur. J. Clin. Nutr. 1994, 48, 575–586. [Google Scholar] [PubMed]
- Mendis, S.; Sobotka, P.A.; Leja, F.L.; Euler, D.E. Breath pentane and plasma lipid peroxides in ischemic heart disease. Free Radic. Biol. Med. 1995, 19, 679–684. [Google Scholar] [CrossRef] [PubMed]
- Dweik, R.A. Exhaled breath analysis: The new frontier in medical testing. J. Breath Res. 2008, 2, 3. [Google Scholar] [CrossRef]
- Ghoos, Y.; Hiele, M.; Rutgeerts, P.; Vantrappen, G. Porous-layer open-tubular gas chromatography in combination with an ion trap detector to assess volatile metabolites in human breath. Biomed. Environ. Mass Spectrom. 1989, 18, 613–616. [Google Scholar] [CrossRef] [PubMed]
- Giardina, M.; Olesik, S.V. Application of low-temperature glassy carbon-coated macrofibers for solid-phase microextraction analysis of simulated breath volatiles. Anal. Chem. 2003, 75, 1604–1614. [Google Scholar] [CrossRef] [PubMed]
- Mayakova, T.I.; Kuznetsova, E.E.; Lazareva, M.V.; Dolgushina, G.S. Quantitative estimation of volatile fatty acids by means of gas chromatography in rapid diagnosis of non-clostridial anaerobic infection. Voprosy Meditsinskoi Khimii 1989, 35, 71–75. [Google Scholar] [PubMed]
- Manolis, A. The diagnostic potential of breath analysis. Clin. Chem. 1983, 29, 5–15. [Google Scholar] [PubMed]
- Phillips, M. Method for the collection and assay of volatile organic compounds in breath. Anal. Biochem. 1997, 247, 272–278. [Google Scholar] [CrossRef] [PubMed]
- Wilson, A.D.; Baietto, M. Advances in electronic-nose technologies developed for biomedical applications. Sensors 2011, 11, 1105–1176. [Google Scholar] [CrossRef] [PubMed]
- Sanchez, J.M.; Sacks, R.D. GC analysis of human breath with a series-coupled column ensemble and a multibed sorption trap. Anal. Chem. 2003, 75, 2231–2236. [Google Scholar] [CrossRef] [PubMed]
- Phillips, M.; Greenberg, J. Method for the collection and analysis of volatile compounds in the breath. J. Chromatogr. Biomed. Appl. 1991, 8, 242–249. [Google Scholar] [CrossRef]
- Mendis, S.; Sobotka, P.A.; Euler, D.E. Pentane and isoprene in expired air from humans: Gas-chromatographic analysis of single breath. Clin. Chem. 1994, 40, 1485–1488. [Google Scholar] [PubMed]
- Kneepkens, C.M.E.; Lepage, G.; Roy, C.C. The potential of the hydrocarbon breath test as a measure of lipid peroxidation. Free Radic. Biol. Med. 1994, 17, 127–160. [Google Scholar] [CrossRef] [PubMed]
- Cohen, M.J.; Karasek, F.W. Plasma Chromatography—A new dimension for gas chromatography and mass spectrometry. J. Chromatogr. Sci. 1970, 8, 330–337. [Google Scholar] [CrossRef]
- Baumbach, J.I. Process analysis using ion mobility spectrometry. Anal. Bioanal. Chem. 2006, 384, 1059–1070. [Google Scholar] [CrossRef] [PubMed]
- Pfeifera, K.B.; Sanchez, R.C. Miniaturized ion mobility spectrometer system for explosives and contraband detection. Int. J. Ion Mobil. Spectrom. 2002, 3, 63–66. [Google Scholar]
- Snyder, A.P.; Maswadeh, W.M.; Eiceman, G.A.; Wang, Y.F.; Bell, S.E. Multivariate statistical analysis characterization of application-based ion mobility spectra. Anal. Chim. Acta 1995, 316, 1–14. [Google Scholar] [CrossRef]
- Ruzsanyi, V.; Baumbach, J.I.; Sielemann, S.; Litterst, P.; Westhoff, M.; Freitag, L. Detection of human metabolites using multi-capillary columns coupled to ion mobility spectrometers. J. Chromatogr. A 2005, 1084, 145–151. [Google Scholar] [CrossRef] [PubMed]
- Baumbach, J.I.; Westhoff, M. Ion mobility spectrometry to detect lung cancer and airway infections. Spectrosc. Eur. 2006, 18, 18–22. [Google Scholar]
- Ruzsanyi, V.; Sielemann, S.; Baumbach, J.I. Determination of VOCs in human breath using IMS. Int. J. Ion Mobil. Spectrom. 2002, 3, 45. [Google Scholar]
- Ligor, T.; Szeliga, J.; Jackowski, M.; Buszewski, B. Preliminary study of volatile organic compounds from breath and stomach tissue by means of solid phase microextraction and gas chromatography-mass spectrometry. J. Breath Res. 2007, 1, 016001. [Google Scholar] [CrossRef] [PubMed]
- Vautz, W.; Ruszany, V.; Sielemann, S.; Baumbach, J.I. Sensitive ion mobility spectrometry of humid ambient air using 10.6 eV UV-IMS. Int. J. Ion Mobil. Spectrom. 2004, 1, 3–8. [Google Scholar]
- Haley, L.V.; Romeskie, J.M. Development of an explosives detection system using fast GC-IMS technology. In Proceedings of the IEEE 32nd Annual 1998 International Carnahan Conference on Security Technology, Alexandria, VA, USA, 12–14 October 1998; pp. 59–64.
- Lord, H.; Yu, Y.F.; Segal, A.; Pawliszyn, J. Breath analysis and monitoring by membrane extraction with sorbent interface. Anal. Chem. 2002, 74, 5650–5657. [Google Scholar] [CrossRef] [PubMed]
- Borsdorf, H.; Schelhorn, H.; Flachowsky, J.; Doring, H.-R.; Stach, J. Corona discharge ion mobility spectrometry of aliphatic and aromatic hydrocarbons. Int. J. Ion Mobil. Spectrom. 2000, 403, 235–242. [Google Scholar]
- Eiceman, G.A.; Nazarov, E.G.; Rodriguez, J.E.; Bergloff, J.F. Positive reactant ion chemistry for analytical, high temperature ion mobility spectrometry (IMS): Effects of electric field of the drift tube and moisture, temperature, and flow of the drift gas. Int. J. Ion Mobil. Spectrom. 1998, 1, 28–37. [Google Scholar]
- Amirav, A. Flame-based Method and Apparatus for Analyzing a Sample. EP0763733 A1, 19 March 1997. [Google Scholar]
- Amirav, A.; Tzanani, N. Electrolyzer Device and Method for the Operation of Flame Ionization Detectors. U.S. Patent 6,096,178, 1 August 2000. [Google Scholar]
- Tzanani, N.; Amirav, A. Electrolyzer-powered flame ionization detector. Anal. Chem 1997, 69, 1248–1255. [Google Scholar] [CrossRef]
- Hansel, A.; Jordan, A.; Holzinger, R.; Prazeller, P.; Vogel, W.; Lindinger, W. Proton transfer reaction mass spectrometry: On-line trace analysis at the ppb level. J. Mass Spect. Ion Proc. 1995, 150, 609–619. [Google Scholar] [CrossRef]
- Jordan, A.; Hansel, A.; Holzinger, R.; Lindinger, W. Acetonitrile and benzene in the breath of smokers and non-smokers investigated by proton transfer reaction mass spectrometry. J. Mass Spect. Ion Proc. 1995, 148, L1–L3. [Google Scholar] [CrossRef]
- Taucher, J.; Hansel, A.; Jordan, A.; Lindinger, W. Analysis of compounds in human breath after ingestion of garlic using proton-transfer-reaction mass spectrometry. J. Agric. Food Chem. 1996, 44, 3778–3782. [Google Scholar] [CrossRef]
- Amann, A.; Poupart, G.; Telser, S.; Ledochowski, M.; Schmid, A.; Mechtcheriakov, S. Applications of breath gas analysis in medicine. Int. J. Mass Spect. 2004, 239, 227–233. [Google Scholar] [CrossRef]
- Boschetti, A.; Biasioli, F.; Opbergen, M.; Warneke, C.; Jordan, A.; Holzinger, R.; Prazeller, P.; Karl, T.; Hansel, A.; Lindinger, W.; et al. PTR-MS real time monitoring of the volatile organic compounds during postharvest aging of berryfruit postharvest biology and technology. Postharvest Biol. Technol. 1999, 17, 143–151. [Google Scholar] [CrossRef]
- Blake, R.S.; Whyte, C.; Hughes, C.O.; Ellis, A.M.; Monks, P.S. Demonstration of proton-transfer reaction time-of-flight mass spectrometry for real-time analysis of trace volatile organic compounds. Anal. Chem. 2004, 76, 3841–3845. [Google Scholar] [CrossRef] [PubMed]
- Hewitt, C.N.; Hayward, S.; Tani, A. The application of proton transfer reaction-mass spectrometry (PTR-MS) to the monitoring and analysis of volatile organic compounds in the atmosphere. J. Environ. Monit. 2003, 5, 1–7. [Google Scholar] [CrossRef] [PubMed]
- Smith, D.; Spanel, P. The novel selected ion flow tube approach to trace gas analysis of air and breath. Rapid Commun. Mass Spectrum. 1996, 10, 1183–1198. [Google Scholar] [CrossRef]
- Smith, D.; Spaněl, P. Selected ion flow tube mass spectrometry (SIFT flow tube approach to trace gas analysis. Mass Spectrom. Rev. 2005, 24, 661–700. [Google Scholar] [CrossRef] [PubMed]
- Dumitrasa, C.D.; Giubileob, G.; Puiu, A. Investigation of human biomarkers in exhaled breath by laser photoacoustic spectroscopy. Proc. SPIE 2004, 111. [Google Scholar] [CrossRef]
- Cristescu, M.S.; Mandon, J.; Harren, M.J.F.; Merilainen, P.; Ogman, M.H. Methods of NO detection in exhaled breath. J. Breath Res. 2013, 7, 11. [Google Scholar] [CrossRef]
- Lundberg, J.; Rinder, J.; Weitzberg, E.; Lundberg, J.M.; Alving, K. Nasally exhaled nitric oxide in humans originates mainly in the paranasal sinuses. Acta Physiol. Scand. 1994, 152, 431–432. [Google Scholar] [CrossRef] [PubMed]
- Sankaran, S.; Zhao, W.; Loyola, B.; Morgan, J.; Molina, M.; Shivo, M.; Rana, R.; Kenyon, N.; Davis, C. Microfabricated differential mobility spectrometers for breath analysis. In Proceedings of the 2007 IEEE Sensors, Atlanta, GA, USA, 28–31 October 2007; pp. 16–19.
- Tisch, U.; Haick, H. Nanomaterials for cross-reactive sensor arrays. MRS Bull. 2010, 35, 797–803. [Google Scholar] [CrossRef]
- Norman, M.; Spirig, C.; Wolff, V.; Trebs, I.; Flechard, C.; Wisthaler, A.; Schnitzhofer, R.; Hansel, A.; Neftel, A. Intercomparison of ammonia measurement techniques at an intensively managed grassland site (Oensingen, Switzerland). Atmos. Chem. Phys. 2009, 9, 2635–2645. [Google Scholar] [CrossRef]
- Davies, S.; Spanel, P.; Smith, D. Quantitative analysis of ammonia on the breath of patients in end-stage renal failure. Kidney Int. 1997, 52, 223–228. [Google Scholar] [CrossRef] [PubMed]
- King, J.; Kupferthaler, A.; Unterkofler, K.; Koc, H.; Teschl, S.; Teschl, G.; Miekisch, W.; Schubert, A.; Hinterhuber, H.; Amann, A. Isoprene and acetone concentration profiles during exercise on an ergometer. J. Breath Res. 2009, 3, 1–35. [Google Scholar] [CrossRef]
- Dummer, J.F. Analysis of Volatile Biomarkers of Airway Inflammation in Breath. Ph.D. Thesis; University of Otago: New Zealand, 2010. Available online: http://hdl.handle.net/10523/1912 (accessed on 17 December 2014).
- Madasamy, T.; Pandiaraj, M.; Balamurugan, M.; Karnewar, S.; Benjamin, A.R.; Venkatesh, K.A.; Vairamani, K.; Kotamraju, S.; Karunakaran, C. Virtual electrochemical nitric oxide analyzer using copper, zinc superoxide dismutase immobilized on carbon nanotubes in polypyrrole matrix. Talanta 2012, 100, 168–174. [Google Scholar] [CrossRef] [PubMed]
- Dryahina, K.; Smith, D.; Spanel, P. Quantification of methane in humid air and exhaled breath using selected ion flow tube mass spectrometry. Rapid Commun. Mass Spectrom. 2010, 24, 1296–1304. [Google Scholar] [CrossRef] [PubMed]
- Xu, H.; Wei, Y.; Zhu, L.; Huang, J.; Li, Y.; Liu, F.; Wang, S.; Liu, S. Bifunctional magnetic nanoparticles for analysis of aldehyde metabolites in exhaled breath of lung cancer patients. J. Chrmotogr. 2014, 1324, 29–35. [Google Scholar] [CrossRef]
- Zhen-qin, X.; Broza, Y.Y.; Ionsecu, R.; Tisch, U.; Ding, L.; Liu, H.; Song, Q.; Pan, Y.Y.; Xiong, F.X.; Gu, K.S. A nanomaterial-based breath test for distinguishing gastric cancer from benign gastric conditions. Br. J. Cancer 2013, 108, 941–950. [Google Scholar] [CrossRef] [PubMed]
- Wu, Y.; Wen, F.; Liu, D.; Kong, H.; Zhanga, C.; Zhang, S. Analysis of 2-propanol in exhaled breath using in situ enrichment and cataluminescence detection. J. Biol. Chem. Lumin. 2011, 26, 125–129. [Google Scholar]
- Marom, O.; Nakhoul, F.; Tisch, U.; Shiban, A.; Abassi, Z.; Haick, H. Gold nanoparticle sensors for detecting chronic kidney disease and disease progression. Nanomedicine 2012, 7, 639–650. [Google Scholar] [CrossRef] [PubMed]
- Stephens, J.S. Investigation of Thiol Derivatized Gold Nanoparticle Sensors for Gas Analysis. Available online: http://digital.library.louisville.edu/cdm/singleitem/collection/etd/id/2729/rec/2 (accessed on 17 December 2014).
- Righettoni, M.; Tricoli, A.; Gass, S.; Schmid, A.; Anton, A.; Pratsinis, S.E. Breath acetone monitoring by portable Si:WO3 gas sensors. Anal. Chim. Acta 2012, 738, 69–75. [Google Scholar] [CrossRef] [PubMed]
- Peng, G.; Hakim, M.; Broza, Y.Y.; Billan, S.; Abdah-Bortnyak, R.; Kuten, A.; Tisch, U.; Haick, H. Detection of lung, breast, colorectal, and prostate cancers from exhaled breath using a single array of nanosensors. Br. J. Cancer 2010, 103, 542–551. [Google Scholar] [CrossRef] [PubMed]
- Wang, L.; Kalyanasundaram, K.; Stanacevic, M.; Gouma, P. Nanosensor device for breath acetone detection. Sens. Lett. 2010, 8, 1–4. [Google Scholar] [CrossRef]
- Gouma, P.; Prasad, A.; Stanacevic, S. A selective nanosensor device for exhaled breath analysis. J. Breath Res. 2011, 5, 1–6. [Google Scholar] [CrossRef] [PubMed]
- Kumar, A.; Boruah, B.M.; Liang, X.-J. Gold Nanoparticles: Promising nanomaterials for the diagnosis of cancer and HIV/AIDS. J. Nanomater. 2011, 2011, 202187:1–202187:17. [Google Scholar] [PubMed]
- Peng, G.; Tisch, U.; Adams, O.; Hakim, M.; Shehada, N.; Broza, Y.; Billan, S.; Abdah-Bortnyak, R.; Kuten, A.; Haick, H. Diagnosing lung cancer in exhaled breath using gold nanoparticles. Nat. Nanotechnol. 2009, 4, 669–673. [Google Scholar] [CrossRef] [PubMed]
- Gouma, P.; Kalyanasundaram, K.; Wang, L.; Yun, X.; Stanacevic, M. Nanosensor and breath analyzer for ammonia detection in exhaled human breath. IEEE Sens. 2010, 10, 49–53. [Google Scholar] [CrossRef]
- Broza, Y.Y.; Kremer, R.; Tisch, U.; Gevorkyan, A.; Shiban, A.; Best, L.A.; Haick, H. A nanomaterial-based breath test for short-term follow-up after lung tumor resection. Nanomed. Nanotechnol. Biol. Med. 2013, 9, 15–21. [Google Scholar] [CrossRef]
- Righettoni, M.; Tricoli, A.; Pratsinis, S.E. Si:WO3 sensors for highly selective detection of acetone for easy diagnosis of diabetes by breath analysis. Anal. Chem. 2010, 82, 3581–3587. [Google Scholar] [CrossRef] [PubMed]
- Ionescu, R.; Broza, Y.; Shaltieli, H.; Sadeh, D.; Zilberman, Y.; Feng, X.; Glass-Marmor, L.; Lejbkowicz, I.; Müllen, K.; Miller, A. Detection of multiple sclerosis from exhaled breath using bilayers of polycyclic aromatic hydrocarbons and single-wall carbon nanotubes. ACS Chem. Neurosci. 2011, 2, 687–693. [Google Scholar] [CrossRef] [PubMed]
- Gruber, M.; Tisch, U.; Jeries, R.; Amal, H.; Hakim, M.; Ronen, O.; Marshak, T.; Zimmerman, D.; Israel, O.; Amiga, E. Analysis of exhaled breath for diagnosing head and neck squamous cell carcinoma: A feasibility study. Br. J. Cancer 2014, 111, 790–798. [Google Scholar] [CrossRef] [PubMed]
- Bachar, N.; Liberman, L.; Muallem, F.; Feng, X.; Mullen, K.; Haick, H. Sensor Arrays Based on Polycyclic Aromatic Hydrocarbons: Chemiresistors versus Quartz-Crystal Microbalance. ACS Appl. Mater. Interfaces 2013, 5, 11641–11653. [Google Scholar] [CrossRef] [PubMed]
- Fu, X.A.; Li, M.; Knipp, R.J.; Nantz, M.H.; Bousamra, M. Noninvasive detection of lung cancer using exhaled breath. Cancer Med. 2014, 3, 174–181. [Google Scholar] [CrossRef] [PubMed]
- Gouma, P.I.; Kalyanasundaram, K. A selective nanosensing probe for nitric oxide. Appl. Phys. Lett. 2008, 93, 244102. [Google Scholar] [CrossRef]
- Nasution, T.I.; Nainggolan, I.; Hutagalung, S.D.; Ahmad, K.R.; Ahmad, Z.A. The sensing mechanism and detection of low concentration acetone using chitosan-based sensors. Sens. Actuators B Chem. 2013, 177, 522–528. [Google Scholar] [CrossRef]
- Liu, C.; Hayashi, K.; Toko, K. Au nanoparticles decorated polyaniline nanofiber sensor for detecting volatile sulfur compounds in expired breath. Sens. Actuators B Chem. 2012, 161, 504–509. [Google Scholar] [CrossRef]
- Neri, G.; Bonavita, A.; Micali, G.; Donato, N. Design and development of a breath acetone MOS sensor for ketogenic diets control. Sens. J. IEEE 2010, 10, 131–136. [Google Scholar] [CrossRef]
- Pantalei, S.; Zampetti, E.; Bearzotti, A.; de Cesare, F.; Macagnano, A. Improving sensing features of a nanocomposite PEDOT: PSS sensor for NO breath monitoring. Sens. Actuators B Chem. 2013, 179, 87–94. [Google Scholar] [CrossRef]
- Toda, K.; Li, J.; Dasgupta, P.K. Measurement of ammonia in human breath with a liquid-film conductivity sensor. Anal. Chem. 2006, 78, 7284–7291. [Google Scholar] [CrossRef] [PubMed]
- Liu, H.C.; Huang, W.C.; Chen, Y.J.; Lu, C.C.; Huang, J.T. An Electromechanical System Based on Carbon Nanotube Sensors to Detect Apnea. IEEE Sens. J. 2013, 13, 2737–2741. [Google Scholar] [CrossRef]
- Kuzmych, O.; Allen, B.L.; Star, A. Carbon nanotube sensors for exhaled breath components. Nanotechnology 2007, 18, 375502. [Google Scholar] [CrossRef]
- Choi, S.-J.; Lee, I.; Jang, B.-H.; Youn, D.-Y.; Ryu, W.-H.; Park, C.O.; Kim, I.-D. Selective Diagnosis of Diabetes Using Pt-Functionalized WO3 Hemitube Networks As a Sensing Layer of Acetone in Exhaled Breath. Anal. Chem. 2012, 85, 1792–1796. [Google Scholar] [CrossRef]
© 2015 by the authors; licensee MDPI, Basel, Switzerland. This article is an open access article distributed under the terms and conditions of the Creative Commons Attribution license (http://creativecommons.org/licenses/by/4.0/).
Share and Cite
Mathew, T.L.; Pownraj, P.; Abdulla, S.; Pullithadathil, B. Technologies for Clinical Diagnosis Using Expired Human Breath Analysis. Diagnostics 2015, 5, 27-60. https://doi.org/10.3390/diagnostics5010027
Mathew TL, Pownraj P, Abdulla S, Pullithadathil B. Technologies for Clinical Diagnosis Using Expired Human Breath Analysis. Diagnostics. 2015; 5(1):27-60. https://doi.org/10.3390/diagnostics5010027
Chicago/Turabian StyleMathew, Thalakkotur Lazar, Prabhahari Pownraj, Sukhananazerin Abdulla, and Biji Pullithadathil. 2015. "Technologies for Clinical Diagnosis Using Expired Human Breath Analysis" Diagnostics 5, no. 1: 27-60. https://doi.org/10.3390/diagnostics5010027