Color Differences between Clockwise and Counterclockwise Spiral Galaxies


Department of Computer Science, Lawrence Technological University, Michigan, MI 48075, USA
Galaxies 2013, 1(3), 210-215; https://doi.org/10.3390/galaxies1030210
Submission received: 22 August 2013
/
Revised: 23 October 2013
/
Accepted: 24 October 2013
/
Published: 25 October 2013
Abstract
:While spiral galaxies observed from Earth clearly seem to spin in different directions, little is yet known about other differences between galaxies that spin clockwise and galaxies that spin counterclockwise. Here we compared the color of 64,399 spiral galaxies that spin clockwise to 63,215 spiral galaxies that spin counterclockwise. The results show that clockwise galaxies tend to be bluer than galaxies that spin counterclockwise. The probability that the color differences can be attributed to chance is ~0.019. g-r, r-i and i-z did not show significant differences between clockwise and counterclockwise galaxies.
1. Introduction
A morphological feature of spiral galaxies that can be easily identified by the human eye is the handedness—some spiral galaxies spin clockwise, while other spiral galaxies rotate counterclockwise. Previous studies suggest large-scale asymmetry between the number of galaxies that rotate clockwise and the number of galaxies that rotate counterclockwise [1,2], and a large-scale correlation between the galaxy handedness and other characteristics can indicate an asymmetry at a cosmological scale.
Here we analyze 127,614 spiral galaxies imaged by Sloan Digital Sky Survey (SDSS) to investigate whether there are differences between the color of spiral galaxies that spin clockwise and the color of spiral galaxies that spin counterclockwise.
2. Data
The dataset included galaxies imaged by SDSS [3], and classified as spiral galaxies by Galaxy Zoo [4]. Then, the galaxies were analyzed using the Ganalyzer method [5,6], and were separated by their appearance as described in [1] to 64,399 spiral galaxies that spin clockwise and 63,215 spiral galaxies that spin counterclockwise. The Ganalyzer algorithm that was used to classify clockwise and counterclockwise galaxies is described thoroughly in [1,5,7]. In summary, Ganalyzer first separates the foreground pixels of the galaxy from the background pixels, and detects the 8-connected objects of the foreground pixels. For each 8-connected foreground object Ganalyzer then finds the center (Ox,Oy) of the galaxy by fitting a point spread function, and then defines the radius R (in pixels) as the most distant foreground pixel from the center, such that the pixel is part of the same 8-connected object. Next, Ganalyzer transforms the galaxy image into its 360 × 35 radial intensity plot, in which the pixel (x,y) in the radial intensity plot is the pixel at coordinate [Ox + r sin(θ), Ox – r cos(θ)] of the original galaxy image; such that θ is the polar angle and r is the radial distance in pixels, which ranges from 0.4 R to 0.75 R. A peak detection algorithm then finds the peaks in each line of the radial intensity plot, and the slope of the peaks reflects the curve of the galaxy arms. The sign of the slope determines the spin direction of the galaxy. A detailed description of Ganalyzer that includes thorough analysis and experimental results is available in [1,5,7].
The declination of the galaxies in the dataset was approximately between −11.2° and 70.3°, and the redshift of the galaxies was smaller than 0.3. Some right ascension (RA) ranges had very few or no galaxies in them. The RA range 60°–90° had less than 100 galaxies, and the range 270°–300° had no galaxies in the dataset.
The magnitudes used in this study are the cmodel magnitude values taken from the PhotObjAll table (“u”, “g”, “r” ,”i”, “z” fields) of SDSS DR7. The cmodel magnitude is defined by:
![Galaxies 01 00210 i001]() where fracDeV is the coefficient of the de Vaucouleurs term, and FdeV and Fexp are the de Vaucouleurs and exponential fluxes of the celestial object.
where fracDeV is the coefficient of the de Vaucouleurs term, and FdeV and Fexp are the de Vaucouleurs and exponential fluxes of the celestial object.

3. Results
Table 1 shows the mean and standard error of the mean of the u-g, g-r, r-i, i-z of the galaxies that rotate clockwise and galaxies that rotate counterclockwise. For each color the table also shows the two-tailed probability (p) that the two means are not different. The probability p that the two means appear to be different due to mere chance was computed using the unpaired t-test with different sample sizes, which given the means, sample sizes, and standard error of the means (or standard deviation) determines the statistical significance p that the means for clockwise and counterclockwise galaxies are not different.
As the table shows, most of the differences between the means are not statistically significant except for u-g, in which the two-tailed probability that the two means are not different is ~0.0194.
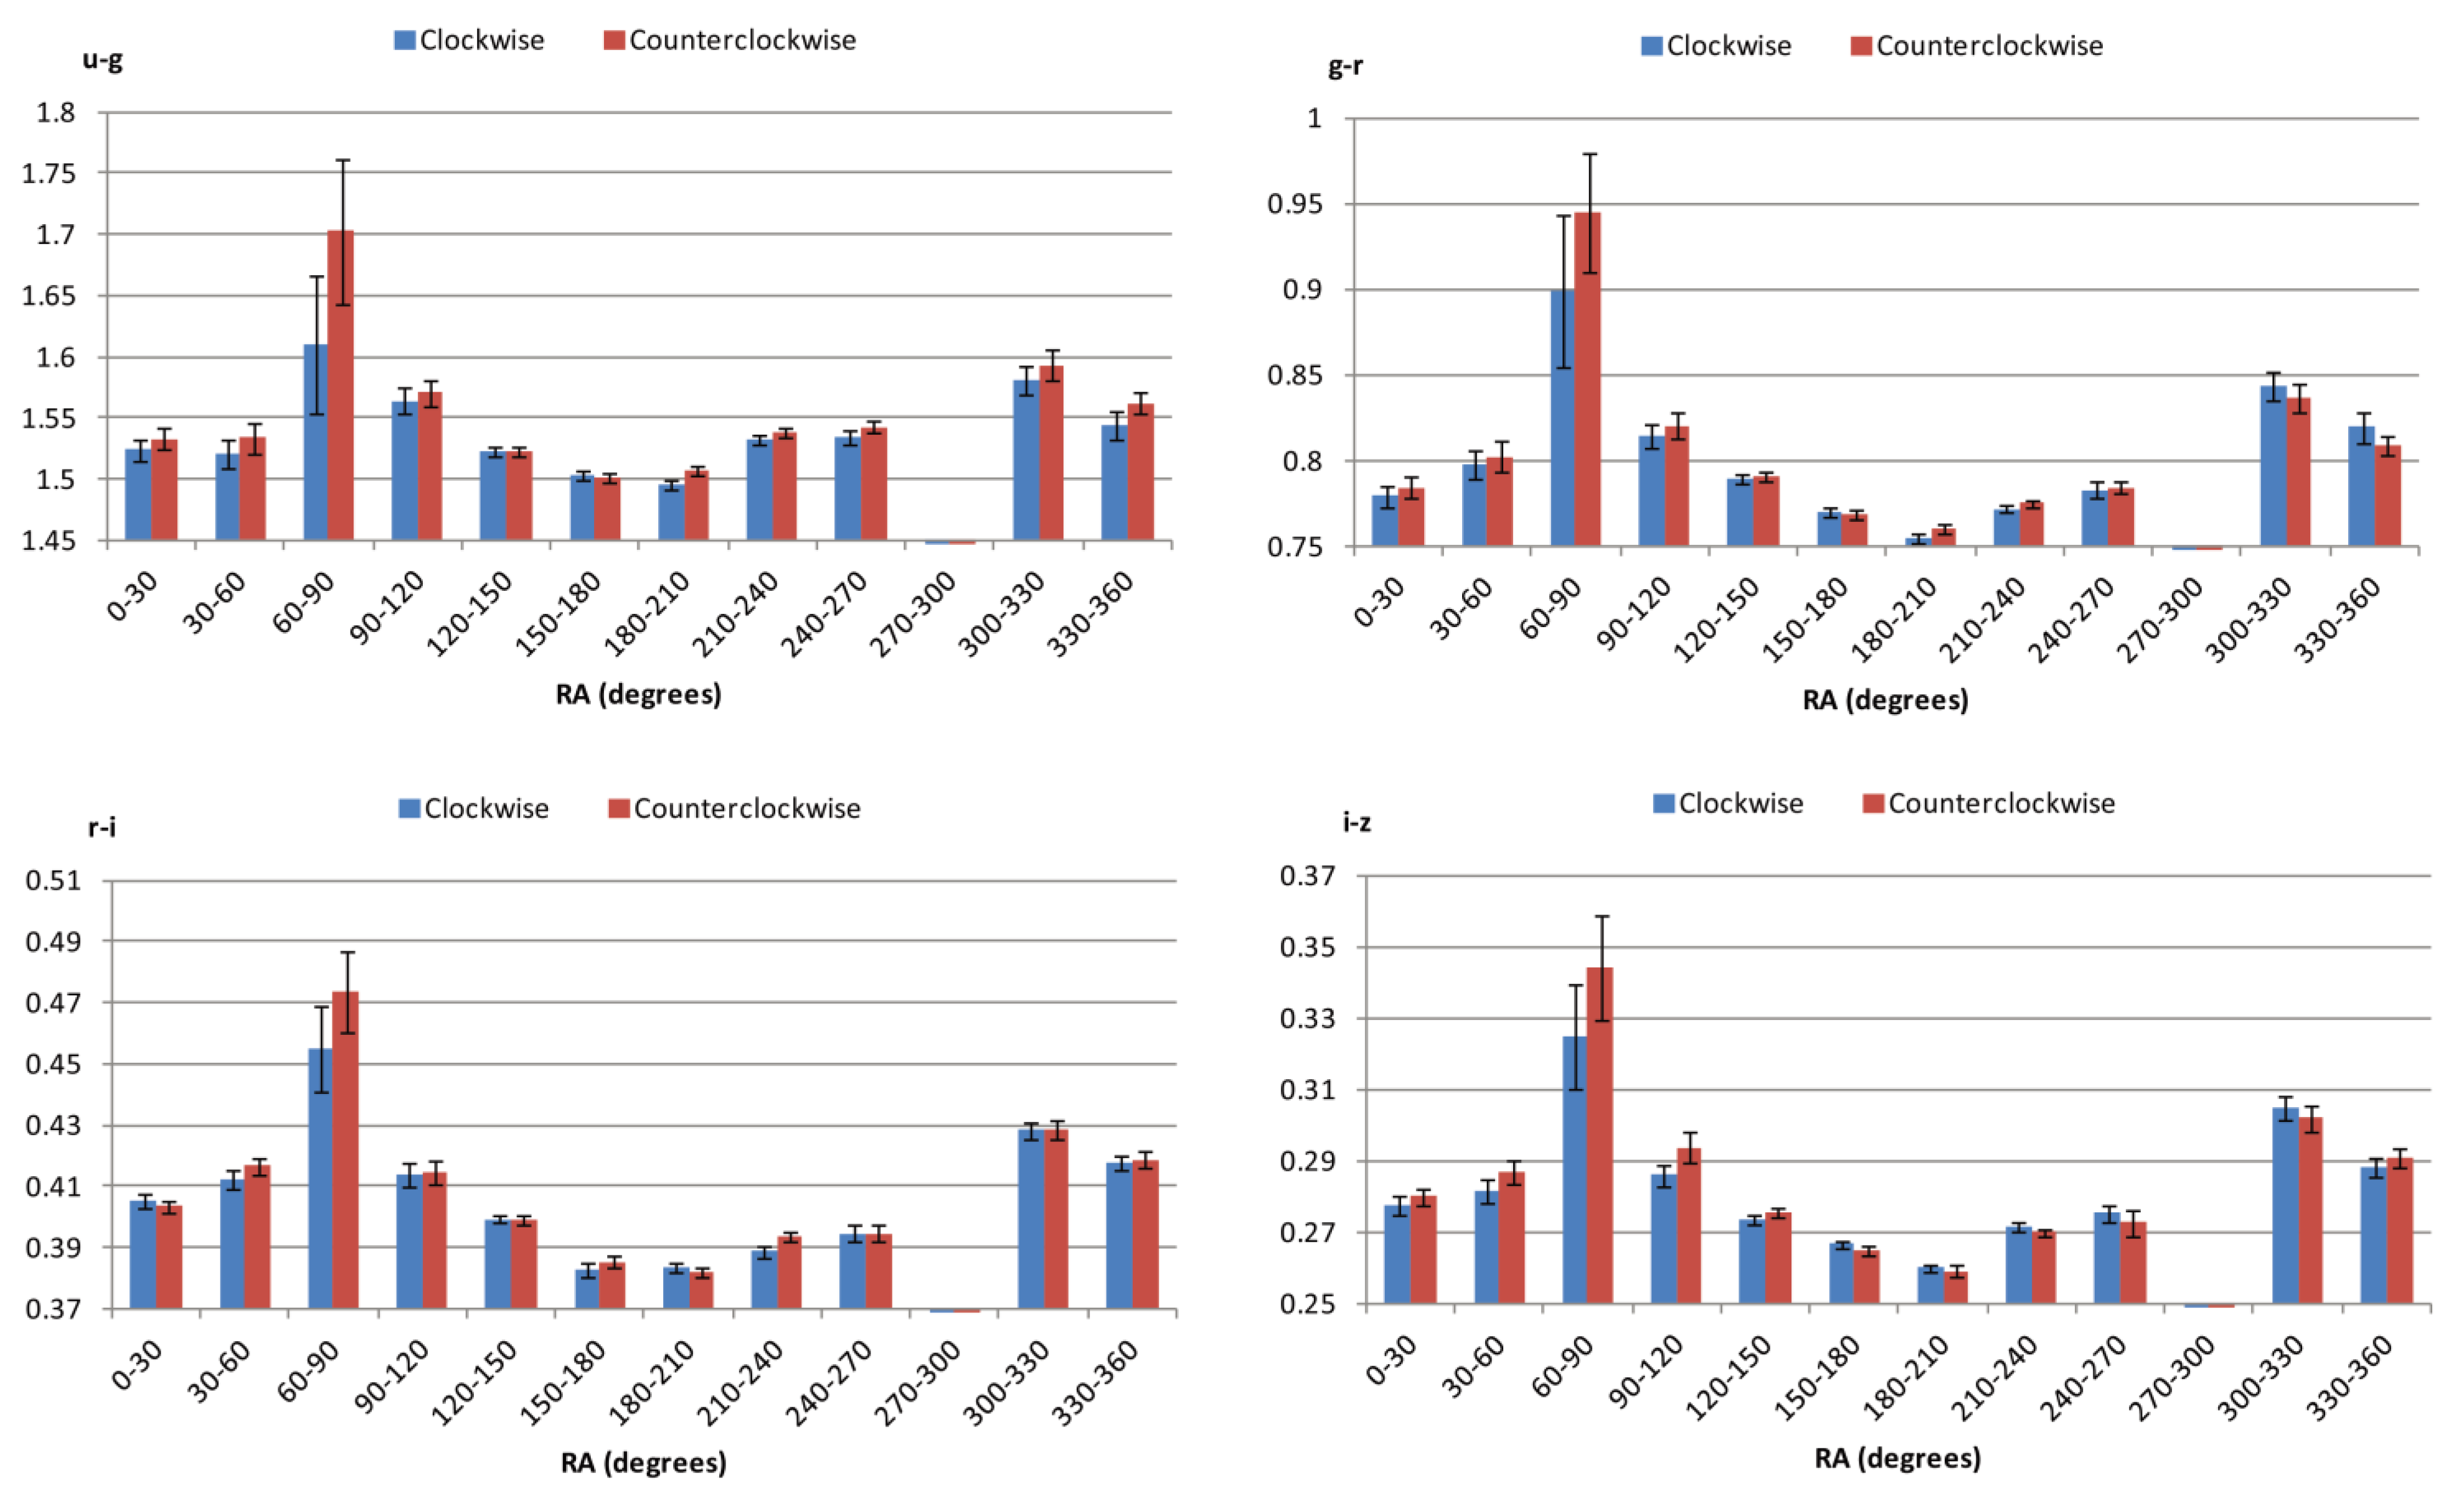
Figure 1 shows the means and standard error of u-g, g-r, r-i, i-z in different 30° RA slices. As can be learned from the figure, the u-g is higher in galaxies that spin counterclockwise in almost all RA ranges. The most significant two-tailed t-test of the difference between the mean is in the RA range 180°–210°, and the probability that the u-g is not different between clockwise and counterclockwise galaxies in that RA range is ~0.0211.

Table 1.
Mean and standard error of u-g, g-r, r-i, i-z of clockwise and counterclockwise spiral galaxies. Probability (p) is determined by two-tailed unpaired t-test.
| Color | Clockwise | Counterclockwise | p |
|---|---|---|---|
| u-g | ~1.51831 ± 0.001701 | ~1.52405 ± 0.00176 | ~0.0194 |
| g-r | ~0.77590 ± 0.001193 | ~0.77772 ± 0.00117 | ~0.2733 |
| r-i | ~0.39161 ± 0.000798 | ~0.39285 ± 0.00076 | ~0.2606 |
| i-z | ~0.27045 ± 0.000541 | ~0.27012 ± 0.00065 | ~0.6886 |
Figure 1.
Mean and standard error of u-g, g-r, r-i, i-z of spiral galaxies with different handedness in different right ascension (RA) ranges.
Figure 1.
Mean and standard error of u-g, g-r, r-i, i-z of spiral galaxies with different handedness in different right ascension (RA) ranges.

The differences in the means of u-g, g-r, r-i, i-z were also tested in different redshift ranges. Table 2 shows the t-test two-tailed probability that the means computed for galaxies with different handedness are not different. The values used were the SDSS colors without correction for deriving rest frame colors for galaxies with high redshift. As the table shows, when separating the data into different redshift ranges the highest probability for u-g difference is in redshift range of 0.1–0.2. It should be noted that redshift range 0.2 < z < 0.3 included just 10,027 galaxies.
To profile the asymmetry, the u-g color differences were computed for different RA and declination (DEC) ranges. Table 3 and Table 4 show the asymmetries of galaxies with z < 0.2 and 0.2 < z < 0.3, respectively, in three declination ranges (−11.2°–15°, 15°–45° and 45°–70.3°) and 60° RA ranges.
Table 2.
Two-tailed t-test probability that the color of clockwise galaxies and counterclockwise galaxies in different redshift ranges are not different.
| Color | 0 < z < 0.1 | 0.1 < z < 0.2 | 0.2 < z< 0.3 |
|---|---|---|---|
| u-g | ~0.0843 | ~0.0115 | ~0.969 |
| g-r | ~0.1897 | ~0.1894 | ~0.1600 |
| r-i | ~0.7056 | ~0.9653 | ~0.3832 |
| i-z | ~0.5773 | ~0.3893 | ~0.1685 |
Table 3.
Difference between u-g of galaxies with different handedness in different RA and declination (DEC) ranges for galaxies with z < 0.2. The two-tailed t-test p values are in parenthesis. Empty cells are ranges with no galaxies.
| RA | −11.2°–15° | 15°–45° | 45°–70.3° |
|---|---|---|---|
| 0°–60° | 0.00734 (0.3968) | 0.015638 (0.6088) | |
| 60°–120° | 0.05180 (0.2956) | 0.000311 (0.9846) | −0.02951 (0.4494) |
| 120°–180° | 0.00655 (0.3004) | 0.007561 (0.1195) | −0.02711 (0.0140) |
| 180°–240° | 0.02074 (0.0168) | 0.000835 (0.8560) | 0.017058 (0.0236) |
| 240°–300° | 0.017973 (0.4604) | 0.01367 (0.1252) | −0.00766 (0.6705) |
| 300°–360° | 0.019131 (0.0798) | 0.020672 (0.0657) | −0.01812 (0.6404) |
Table 4.
Difference between u-g of clockwise and counterclockwise galaxies in different RA and DEC ranges for galaxies with 0.2 < z < 0.3. The two-tailed t-test p values are in parenthesis.
| RA | −11.2°–15° | 15°–45° | 45°–70.3° |
|---|---|---|---|
| 0°–60° | 0.045886 (0.9452) | ||
| 60°–120° | −0.03738 (0.699) | 0.432131 (0.6249) | |
| 120°–180° | −0.03059 (0.442) | −0.02609 (0.3519) | −0.09046 (0.2453) |
| 180°–240° | −0.00244 (0.7946) | −0.02813 (0.5691) | |
| 240°–300° | 0.041818 (0.8512) | 0.033898 (0.4794) | −0.37415 (0.3684) |
| 300°–360° | 0.01202 (0.9237) |
In the z range of >0.2 the number of galaxies is low, leading to high t-test p values, as well as many RA, DEC ranges in which no galaxies were found in SDSS DR7. In z < 0.2 the lowest probability that the means of the u-g values of clockwise and counterclockwise galaxies are not different was measured between RA 180° and 240°.
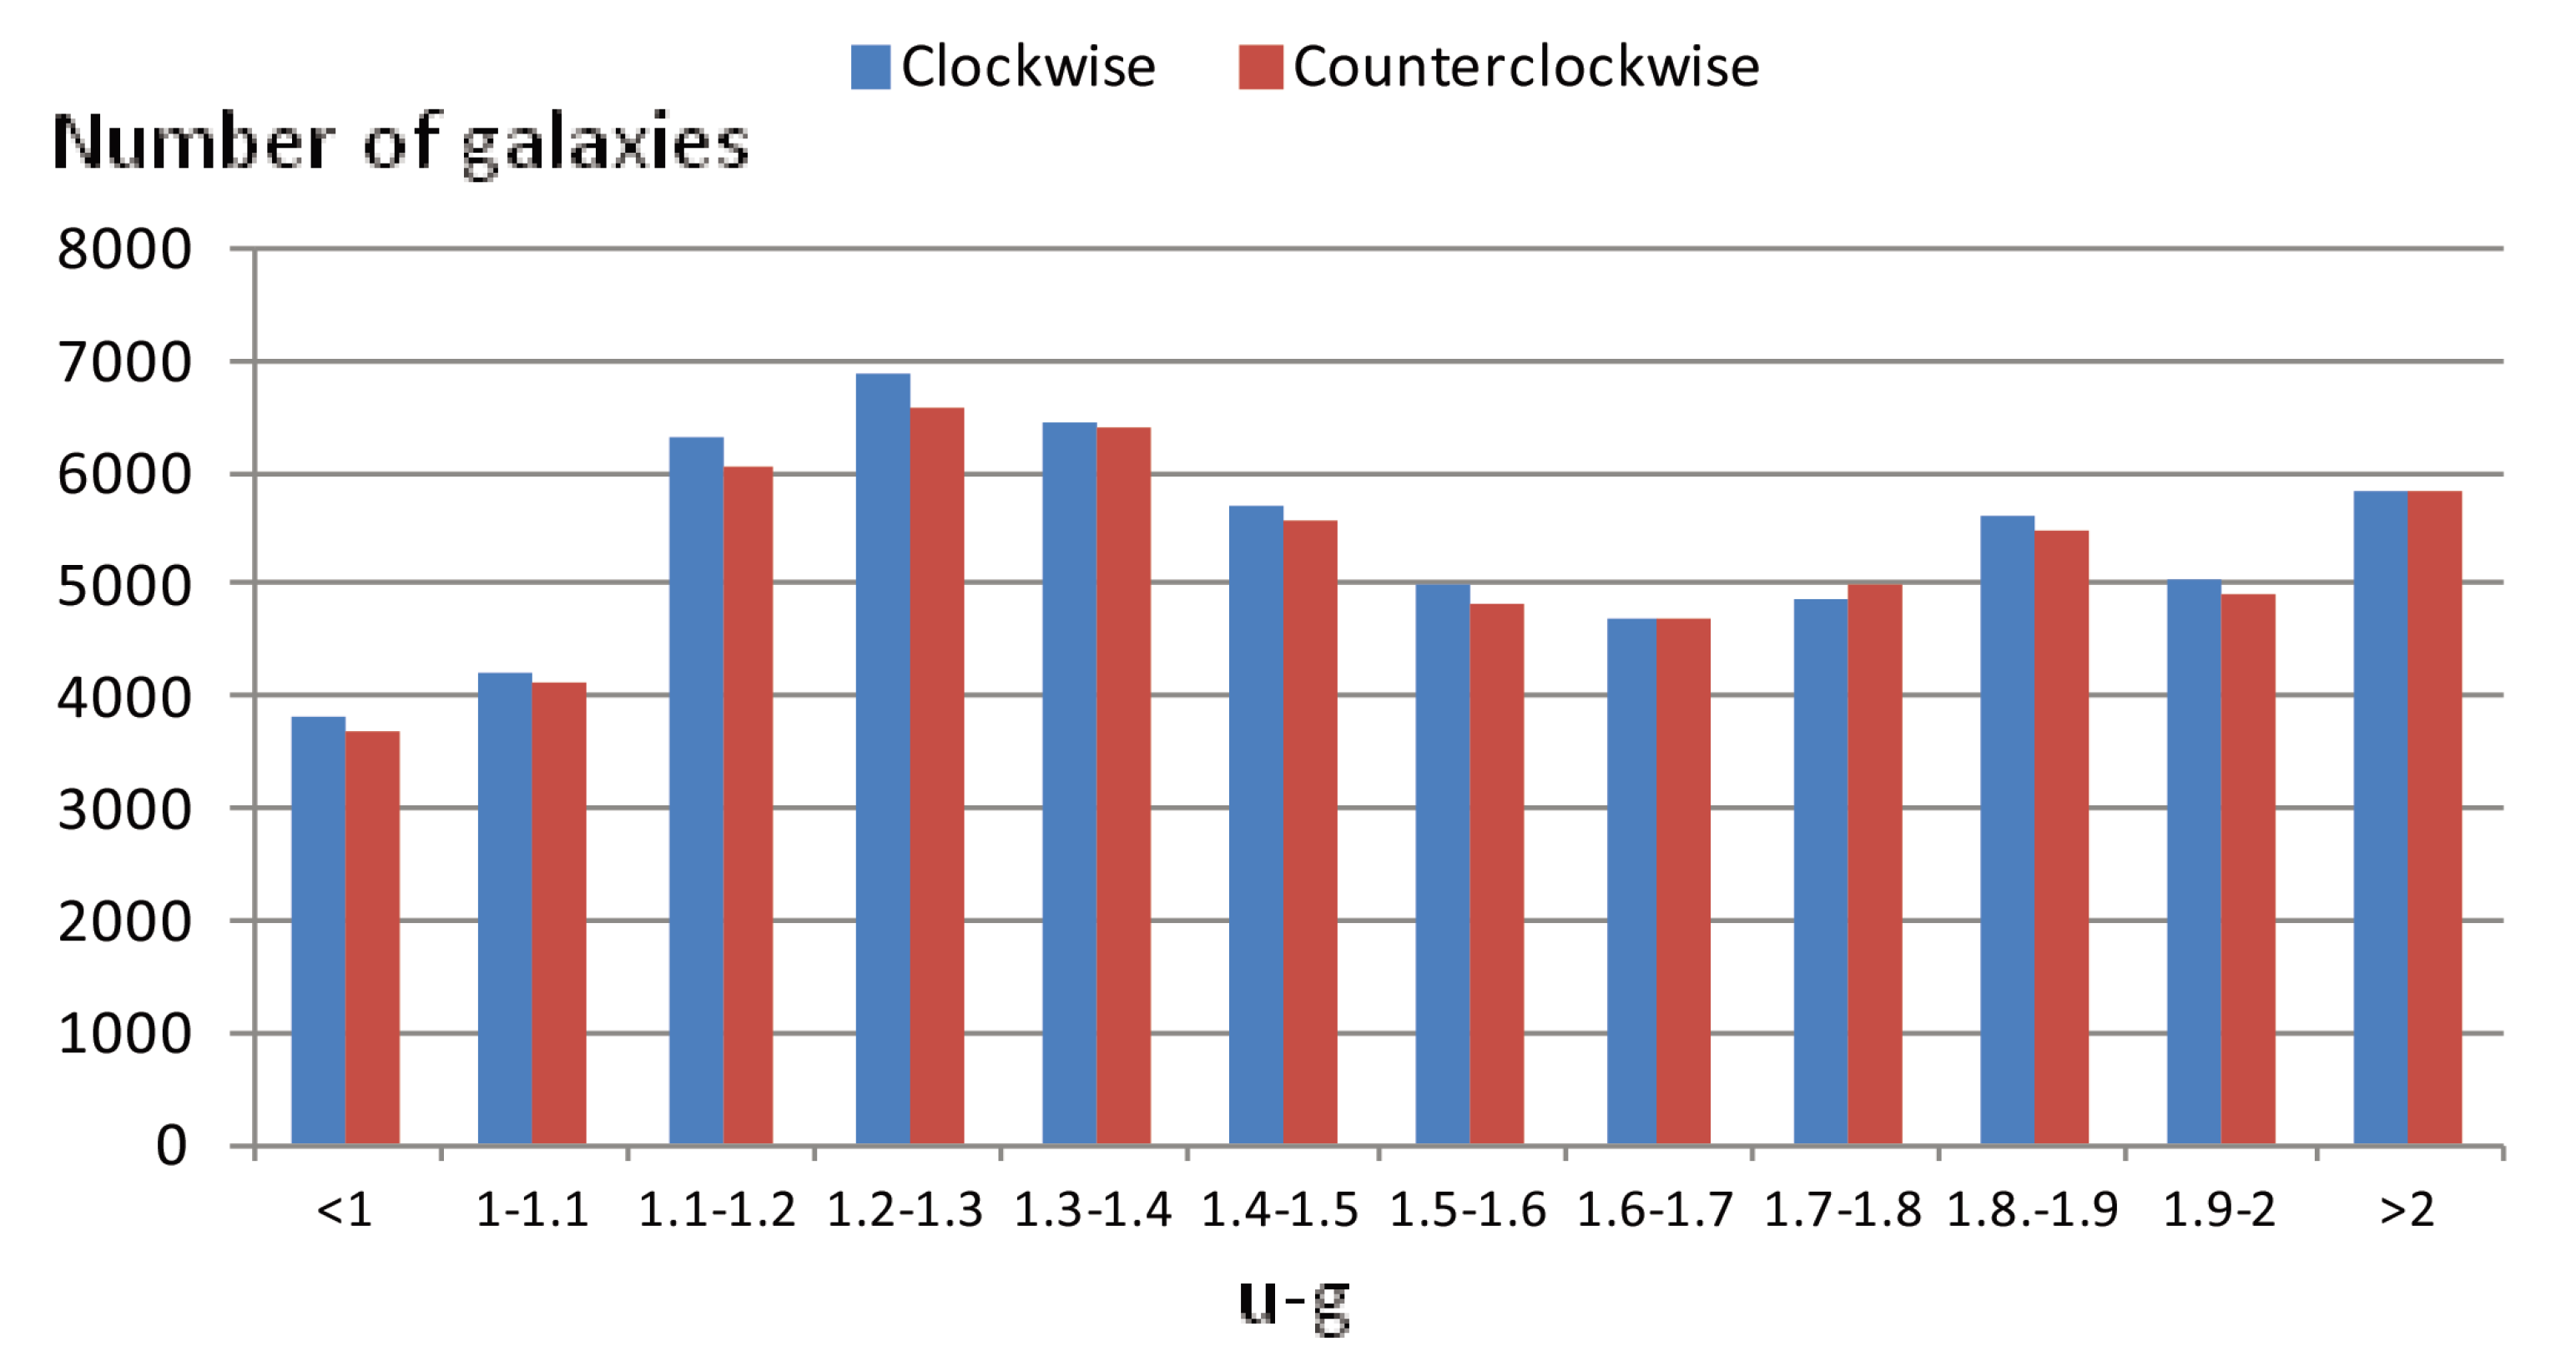
Figure 2 shows the histogram of the distribution of clockwise and counterclockwise galaxies by their u-g. The numbers are normally higher for the clockwise galaxies because there are more clockwise galaxies in the dataset than counterclockwise galaxies.
For control, the analysis was also done such that the galaxies were separated into two arbitrary different groups, such that the first group included all galaxies with an even SDSS ID, and the other group included all galaxies with odd SDSS ID. The results showed no statistical significance between the color of the galaxies in the two groups. For instance, the mean u-g in the galaxies with even IDs is 1.521188 ± 0.0017, and the mean u-g in the galaxies with odd ID is 1.521131 ± 0.0017, leading to a t-test p value of 0.9811 that the two values are not different. This shows that the arbitrary arrangement of spiral galaxies in the Galaxy Zoo sample does not lead to the color differences found when the galaxies are separated by their spin direction, therefore, ruling out observational systematic.
Figure 2.
Histogram of galaxies with different handedness by u-g.

4. Conclusions
The spin direction of a spiral galaxy is a morphological feature that can be clearly identified by the human eye observing the galaxy. In this paper we described color differences between galaxies with different handedness, and showed that galaxies that spin clockwise have a smaller u-g compared to galaxies that spin counterclockwise, meaning that on average clockwise galaxies are bluer than galaxies that rotate counterclockwise. The difference is the most significant in redshift range of 0.1–0.2 and RA range 180°–210°. While the statistical significance of the u-g difference is marginal, future sky surveys such as Large Synoptic Survey Telescope (LSST) will acquire more and better galaxy images that will allow morphological analyses of more galaxies and, consequently, stronger statistical significance of the results.
The comparisons were based on galaxies in the same region of the sky, but were separated by their handedness so that the color difference cannot be attributed to the different atmospheric effects when different parts of the sky are observed. The number of galaxies used in this study is not sufficient to profile statistically significant asymmetry in each RA range, making it difficult to profile a possible dipole axis [1,2]. Also, the fact that different regions of the sky were imaged on different days of the year adds further difficulties in deducing valid conclusions that are based on the comparison of the asymmetries in different sky regions, where differences between regions might be driven by differences in the image acquisition conditions when imaging different regions of the sky. However, while the strength of the u-g asymmetry between galaxies with different handedness can vary between different regions of the sky because of calibration or atmospheric effects, u-g differences between clockwise and counterclockwise galaxies are not expected in the same sky region. It is important to note that the galaxies used in this study are not uniformly distributed in the sky, but their distribution follows the distribution of galaxies in SDSS.
Galaxy mergers can change the spin direction of the galaxy while also increasing star formation [8], and therefore large-scale blue color asymmetry can also be related to large-scale asymmetry in interaction between galaxies, or to large-scale asymmetry in spin direction [1,2,9]. Another possible explanation can be internal extinction at the edges of the arms, which can be affected by the radial velocity. While there is no solid explanation to the surprising difference between the colors of galaxies based on their spin rotation, the purpose of this study is to initiate discussion and further investigation on differences between galaxies based on their spin direction.
Acknowledgments
I would like to thank the three anonymous reviewers for their insightful comments and the thorough discussion that helped to improve the paper. I would also like to thank John Wallin for his help in obtaining the spectroscopy data for the Galaxy Zoo galaxies.
Conflicts of Interest
The author declares no conflict of interest.
References
- Shamir, L. Handedness asymmetry of spiral galaxies with z < 0.3 shows cosmic parity violation and a dipole axis. Phys. Lett. B 2012, 715, 25–29. [Google Scholar] [CrossRef]
- Longo, M.J. Detection of a dipole in the handedness of spiral galaxies with redshifts z~0.04. Phys. Lett. B 2011, 699, 224–229. [Google Scholar] [CrossRef]
- York, D.G.; Adelman, J.; Anderson, J.E., Jr.; Anderson, S.F.; Annis, J.; Bahcall, N.A.; Bakken, J.A.; Barkhouser, R.; Bastian, S.; Berman, E.; et al. The Sloan Digital Sky Survey: Technical summary. Astron. J. 2000, 120, 1579–1587. [Google Scholar] [CrossRef]
- Lintott, C.; Schawinski, K.; Bamford, S.; Slosar, A.; Land, K.; Thomas, D.; Edmondson, E.; Masters, K.; Nichol, R.; Raddick, J.; et al. Galaxy Zoo 1: Data release of morphological classifications for nearly 900,000 galaxies. Mon. Not. R. Astron. Soc. 2011, 410, 166–178. [Google Scholar] [CrossRef] [Green Version]
- Shamir, L. Ganalyzer: A tool for automatic galaxy image analysis. Astrophys. J. 2011, 736, 141. [Google Scholar] [CrossRef]
- Shamir, L. Ganalyzer: A Tool for Automatic Galaxy Image Analysis. Astrophysics Source Code Library. Starship Asterisk. 20 May 2011; ascl:1105.011. Available online: http://asterisk.apod.com/viewtopic.php?f=35&t=23720&p=148805#p148805 (accessed on 25 October 2013).
- Dojcsak, L.; Shamir, L. Quantitative analysis of spirality in elliptical galaxies. New Astron. 2014, 28, 1–8. [Google Scholar]
- Jimenez, R.; Slosar, A.; Verde, L.; Bamford, S.; Lintott, C.; Schawinski, K.; Nichol, R.; Andreescu, D.; Land, K.; Murray, P.; et al. Galaxy Zoo: A correlation between the coherence of galaxy spin chirality and star formation efficiency. Mon. Not. R. Astron. Soc. 2010, 404, 975–980. [Google Scholar] [CrossRef] [Green Version]
- Gullu, I.; Tekin, B. An observable prediction of massive gravity: Long-range spin correlations of spiral galaxies. ArXiv E-Prints 2013. arXiv:gr-qc/1305.5461. [Google Scholar]
© 2013 by the authors; licensee MDPI, Basel, Switzerland. This article is an open access article distributed under the terms and conditions of the Creative Commons Attribution license (http://creativecommons.org/licenses/by/3.0/).
Share and Cite
MDPI and ACS Style
Shamir, L. Color Differences between Clockwise and Counterclockwise Spiral Galaxies. Galaxies 2013, 1, 210-215. https://doi.org/10.3390/galaxies1030210
AMA Style
Shamir L. Color Differences between Clockwise and Counterclockwise Spiral Galaxies. Galaxies. 2013; 1(3):210-215. https://doi.org/10.3390/galaxies1030210
Chicago/Turabian StyleShamir, Lior. 2013. "Color Differences between Clockwise and Counterclockwise Spiral Galaxies" Galaxies 1, no. 3: 210-215. https://doi.org/10.3390/galaxies1030210