Article

Broad Band Observations of Gravitationally Lensed Blazar during a Gamma-Ray Outburst

1
Department of Astrophysics, University of Łódź, PL-90236 Lodz, Poland
2
Astrophysics Science Division, NASA Goddard Space Flight Center, Greenbelt, MD 20771, USA
3
Department of Physics, University of Maryland, College Park, MD 20742, USA
4
Department of Astronomy, University of Maryland, College Park, MD 20742, USA
5
Center for Research and Exploration in Space Science and Technology (CRESST), University of Maryland Baltimore County, Baltimore, MD 21250, USA
6
Department of Physics, University of Rijeka, Radmile Matejčić 2, 51000 Rijeka, Croatia
7
Instituto de Astrofísica de Canarias, E-38200 La Laguna, Tenerife, Spain
8
Departamento de Astrofísica, Universidad de La Laguna, E-38206 La Laguna, Tenerife, Spain
9
Institute for Cosmic Ray Research, University of Tokyo, Kashiwa-no-ha 5-1-5, Kashiwa-shi, 277-8582 Chiba, Japan
10
Max-Planck-Institut für Physik, D-80805 München, Germany
11
Tuorla Observatory, Astronomy Division, University of Turku, FI-21500 Piikkiö, Finland
12
Department of Atomic, Molecular and Nuclear Physics, Universidad Complutense de Madrid, E-28040 Madrid, Spain
13
INAF National Institute for Astrophysics, I-00136 Rome, Italy
*
Author to whom correspondence should be addressed.
Galaxies 2016, 4(4), 31; https://doi.org/10.3390/galaxies4040031
Submission received: 15 July 2016 / Accepted: 2 September 2016 / Published: 27 September 2016
(This article belongs to the Special Issue Blazars through Sharp Multi-wavelength Eyes)

Abstract

:
QSO B0218+357 is a gravitationally lensed blazar located at a cosmological redshift of 0.944. In July 2014 a GeV flare was observed by Fermi-LAT, triggering follow-up observations with the MAGIC telescopes at energies above 100 GeV. The MAGIC observations at the expected time of arrival of the trailing component resulted in the first detection of QSO B0218+357 in Very-High-Energy (VHE, >100 GeV) gamma rays. We report here the observed multiwavelength emission during the 2014 flare.

1. Introduction

Most of the blazars detected in the VHE range are relatively close-by sources with redshift z 0.5 . With the recent detection by the MAGIC (Major Atmospheric Gamma Imaging Cherenkov) telescopes of VHE gamma-ray emission from two sources at a redshift z 0.94 : QSO B0218+357 [1] and PKS1441+25 [2], the boundaries of the known gamma-ray universe nearly doubled. Observations of distant sources in VHE gamma-rays are strongly affected by an absorption in the extragalactic background light (EBL). At a redshift of QSO B0218+357, it results in a cut-off at energies ∼100 GeV, which is the lower edge of the sensitivity range of the current generation of Imaging Atmospheric Cherenkov Telescopes.
QSO B0218+357 is classified as a flat spectrum radio quasar (FSRQ) [3,4]. Its redshift has been estimated as z = 0 . 944 ± 0 . 002 [4], one of the lines used for this measurement was confirmed later by [5]. The object is gravitationally lensed by the face-on spiral galaxy B0218+357 G. Strong gravitational lensing produces two distinct images of QSO B0218+357 visible in radio and optical frequencies [6,7]. Variability of the two radio components allowed a measurement of a delay of 10–12 days between the leading and trailing image [8,9,10,11]. The leading component of QSO B0218+357 (also called image A in literature) is located to the west of the trailing component (image B). The former shows a ∼3.6 times larger flux in radio frequencies [9], but is strongly absorbed in the optical range [12].
QSO B0218+357 went through a gamma-ray high state in 2012. A series of individual outbursts was registered by the Fermi-LAT [13], which, however, does not have the necessary angular resolution to spatially disentangle the two emission components. Nevertheless, the statistical analysis of the light curve auto-correlation function led to a measurement of the time delay between them of 11 . 46 ± 0 . 16 days. The average magnification factor—contrary to radio measurements—was estimated to be ∼1.
A new gamma-ray flare of QSO B0218+357 was observed by Fermi-LAT on the 13th and 14th of July 2014 [14]. The flux ratio of both images in this case was similar to the one observed in radio frequencies [15]. The MAGIC follow-up observations targeted at the trailing image, led to the discovery of VHE gamma-ray emission from QSO B0218+357 [1]. In this work, we present the results of gamma-ray, X-ray, and optical observations of QSO B0218+357 during the flaring state in July 2014. These results will be published in full in [16].

2. Observations and Data Analysis

The VHE gamma-ray observations of QSO B0218+357 were performed with the MAGIC telescopes. At GeV energies, the source was monitored by Fermi-LAT, in X-ray by Swift-XRT, and in optical by KVA. Note that the angular resolution of all of the above instruments is insufficient to spatially resolve the emission from the two lensed image components of QSO B0218+357; hence, a sum of the leading and trailing image is observed.
MAGIC is a system of two 17 m Cherenkov telescopes located in the Canary Island of La Palma at a height of 2200 m a.s.l. [17]. The large mirror dish of the MAGIC telescopes allows us to observe gamma rays with energies as low as ∼50 GeV [18]. The telescopes could not follow immediately the 2014 flare from QSO B0218+357 revealed by Fermi-LAT, as it occurred during the full Moon. The MAGIC observations were scheduled starting from the 23rd of July (MJD = 56861, two nights before the expected delayed emission) and lasted for 14 consecutive nights. The total exposure time was 12.8 h, and the source was seen in the zenith angle range 20°–43°. The data reduction (stereo reconstruction, gamma/hadron separation, and estimation of the energy and arrival direction of the primary particle) was performed using MARS, the standard analysis software of MAGIC [18,19].
Fermi-LAT is a pair-conversion telescope optimized for the energy range 20 MeV to 300 GeV [20]. The instrument is normally operated in scanning mode, providing coverage of the full sky every three hours, however between December 2013 and December 2014, an observation strategy emphasizing coverage of the Galactic center region was used. The coverage on the QSO B0218+357 position was on average a factor of 0.6 of the maximum one. Additionally, at the time of the expected delayed emission, Fermi-LAT performed a 2.7-day long Target of Opportunity observation on QSO B0218+357 to enhance exposure towards the source position. Fermi-LAT data were extracted from a circular region of interest (ROI) of 15° radius centered at the QSO B0218+357 radio position. The analysis was done in the energy range 0.3–100 GeV using the standard Fermi Science Tools (version v9r34p1) in combination with the P7REP_SOURCE_V15 LAT Instrument Response Functions. The data used span the time period between MJD 56849–56875 (11 July–6 August 2014). We applied the gtmktime filter (#3) cuts to the LAT data (see [21] ). Time intervals when the LAT boresight was rocked with respect to the local zenith by more than 52° and events with zenith angle >100° were excluded to limit the contamination from Earth limb photons. The spectral model of the region included all sources located within the ROI with the spectral shapes and the initial parameters for the modeling set to those reported in the third Fermi-LAT source catalog, 3FGL [22]. The isotropic (iso_source_v05.txt) and Galactic (gll_iem_v05.fit) diffuse background components have been used in the analysis. To obtain the light curve, the QSO B0218+357 was modeled with a power-law spectral shape with normalization and index free to vary. To evaluate the significance of the detection we used the Test Statistic (TS) value defined as 2 log ( L 0 / L ) , where L 0 is the maximum likelihood value for a model without an additional source (the “null hypothesis”) and L is the maximum likelihood value for a model with an additional source at the location of QSO B0218+357. Flux upper limits at the 95% confidence level were calculated for time intervals where TS was <9.
The Swift X-ray Telescope (XRT, [23]) is a CCD imaging spectrometer, sensitive in the 0.2–10 keV band. QSO B0218+357 was observed by the Swift satellite during 10 epochs, each with an exposure of about 4.5 ks. The observations first followed the original alert of enhanced activity in GeV gamma rays, and then were resumed at the expected time of arrival of the trailing flare. The data were reduced with the HEASoft package version 6.17, using the calibration files available in version 20140709 of the Swift-XRT CALDB. We ran the task xrtpipeline with standard screening criteria on the observations performed in pointing mode. Observations were done in Photon Counting (PC) mode with count rates of about 0.02 counts/s. The source and background counts were extracted with the task xrtproducts from a circular region of 35" for the source and 120" for the background.
The observations in the optical R-band were performed using the 35 cm Celestron telescope attached to the KVA 60 cm telescope, located close to the MAGIC telescopes site. QSO B0218+357 was observed between 24 July 2014 (MJD 56862.2) and 5 August 2014 (MJD 56874.2) on an almost nightly basis. The data have been analyzed using the semi-automatic pipeline developed at the Tuorla Observatory (Nilsson et al. 2016, in prep.). The magnitudes were measured using differential photometry. The absolute calibration of the optical fluxes was done using stars with known magnitudes present in the field of view of the instrument during observations of all targets of a given night (see Table 3 of [24] and references therein). As QSO B0218+357 is rather faint in the optical range and the telescope is relatively small, several images from the same night were combined for the measurement of the average flux.

3. Results

The VHE gamma-ray emission was detected by the MAGIC telescopes on the nights of 25 and 26 of July 2014 (MJD of 56863.2 and 56864.2 respectively), during the expected time of arrival of the trailing component of the flare registered by Fermi-LAT. The detection cuts were optimized to provide the best sensitivity in the 60–100 GeV estimated energy range (see [18]). The total observation time of 2.11 h during those two nights yielded a statistical significance of 5 . 7 σ (see Figure 1).
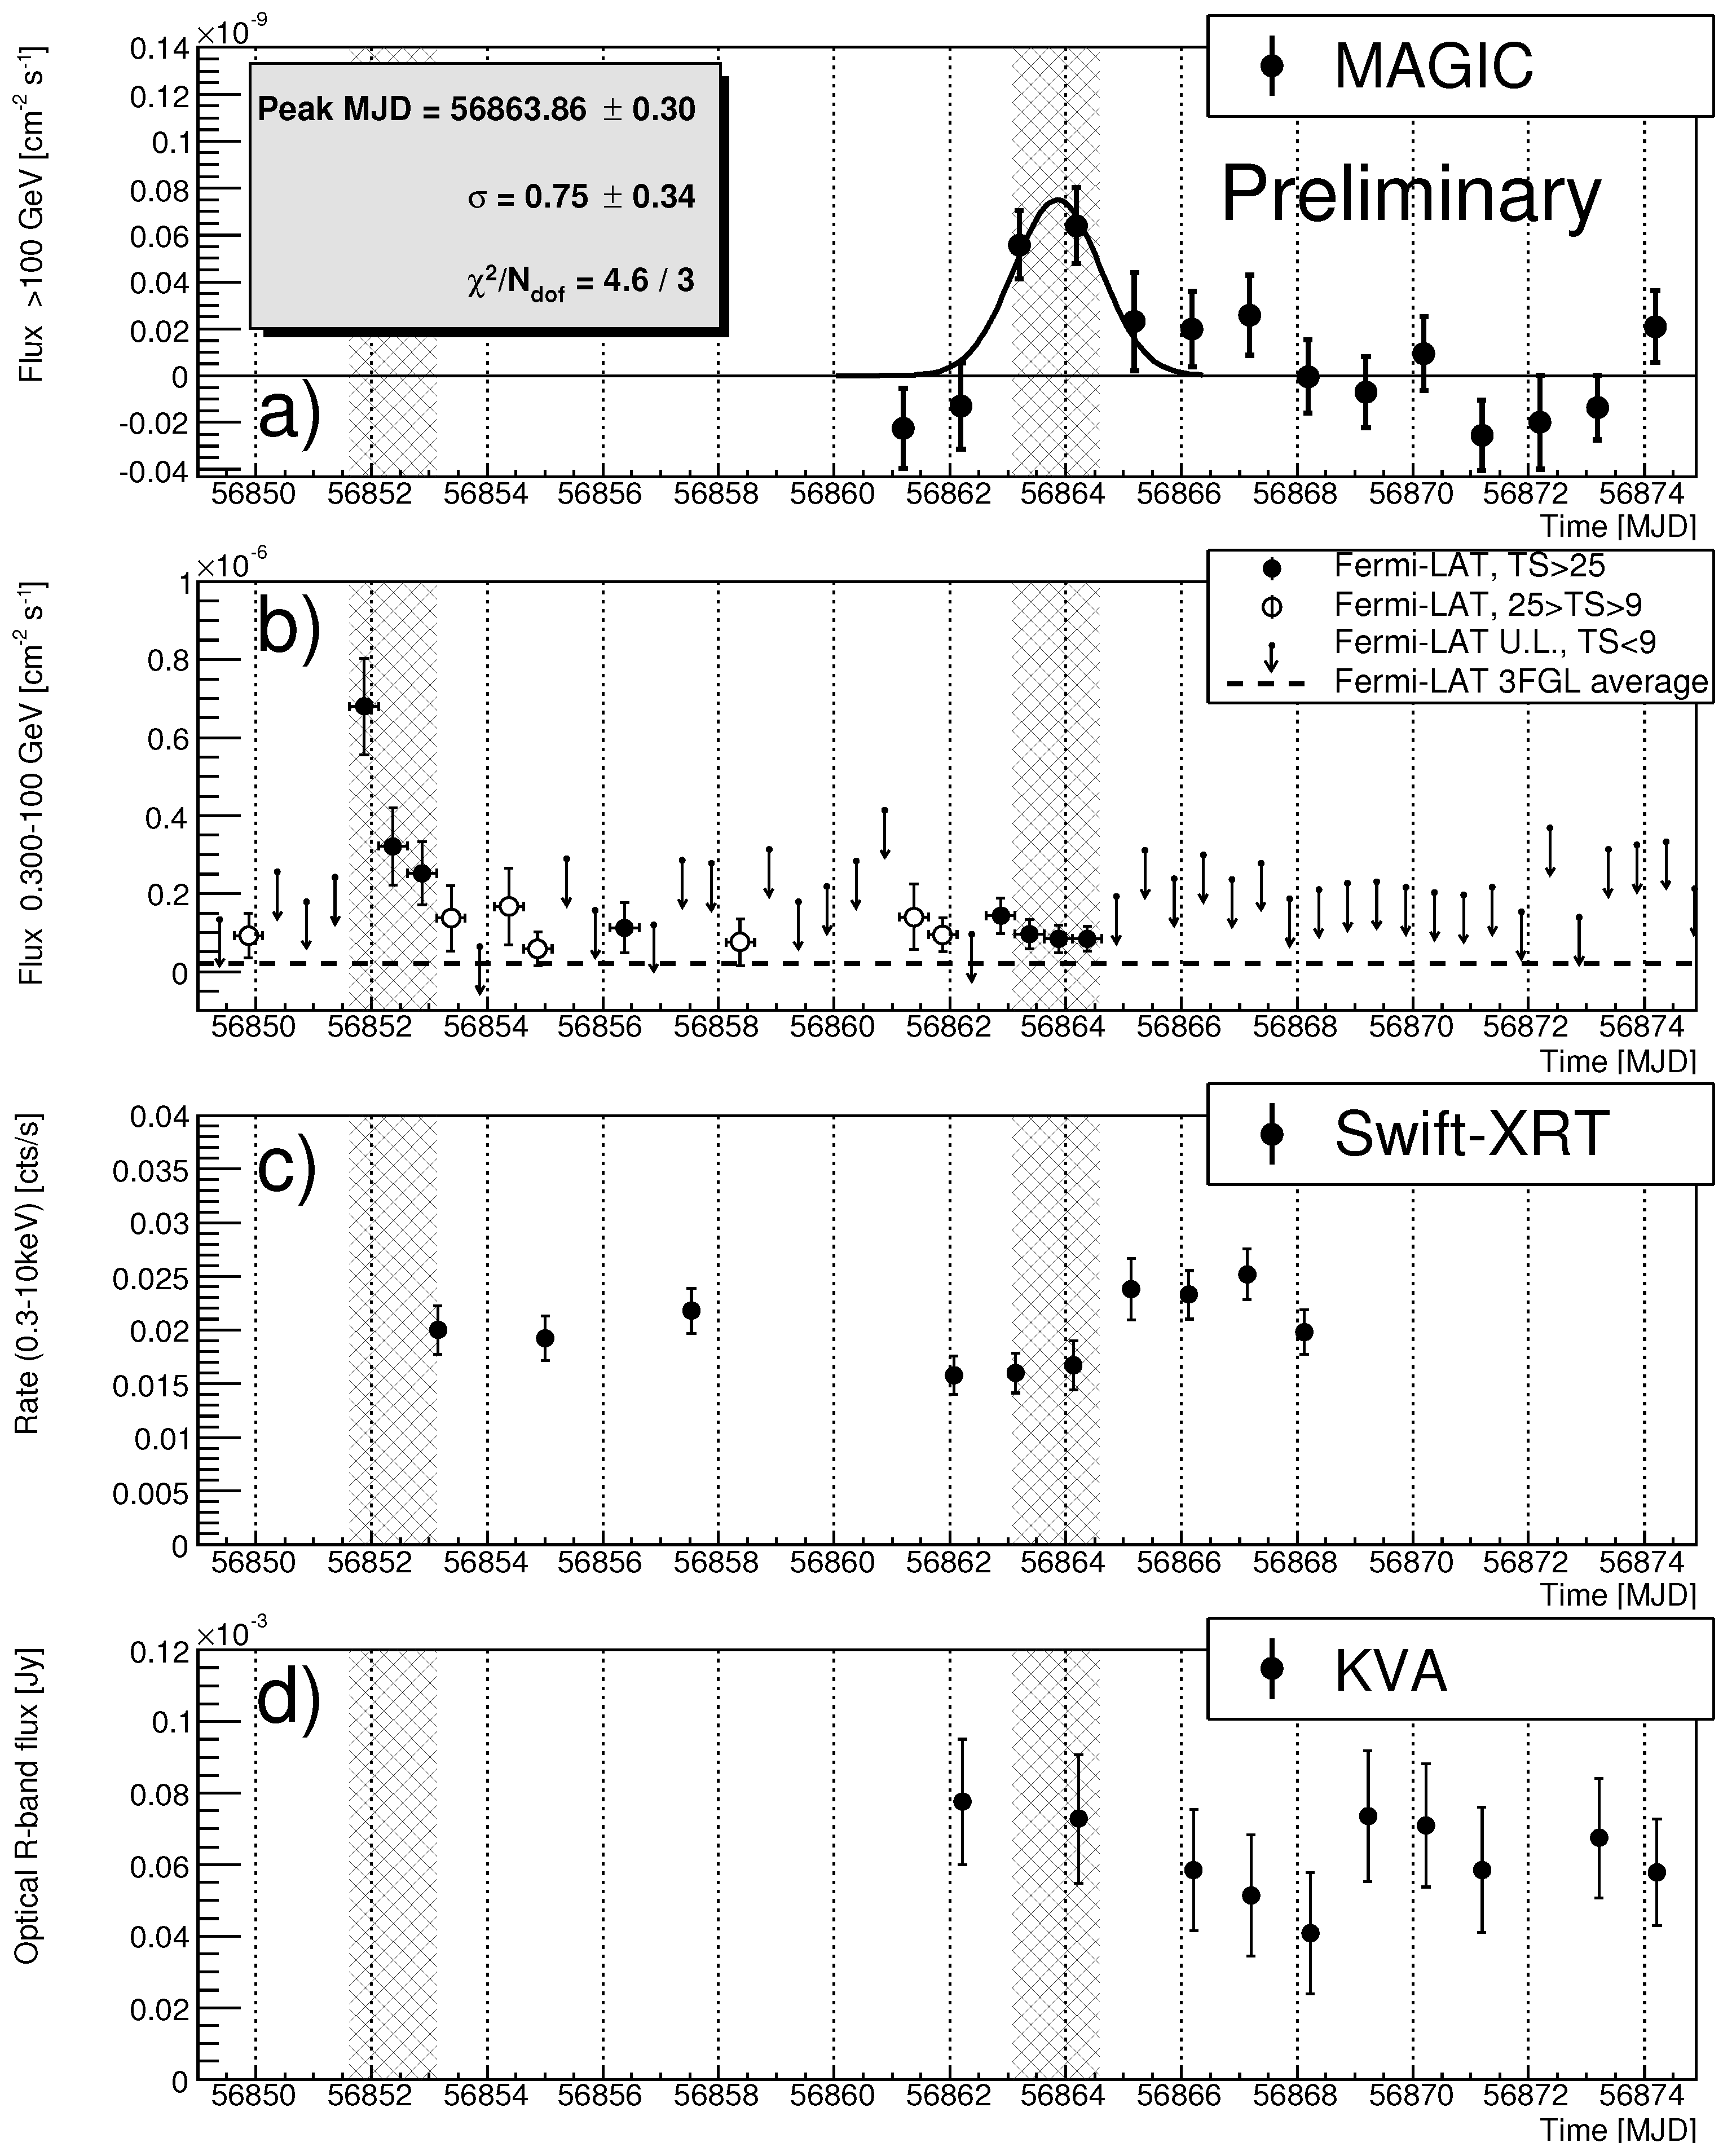
The multiwavelength light curve of QSO B0218+357 is shown in Figure 2.
A fit to the MAGIC light curve above 100 GeV (Figure 2a) with a Gaussian function gives the peak position at MJD of 56863.86 ± 0 . 30 stat and the standard deviation of 0 . 75 ± 0 . 34 stat days. The light curve energy threshold was chosen to limit the systematic uncertainties. The mean flux of the two flaring nights is ( 5 . 8 ± 1 . 6 stat ± 2 . 4 syst ) × 10 11 cm 2 · s 1 . The relatively large systematic error is mainly a result of a 15% uncertainty in the energy scale.
The GeV light curve of QSO B0218+357 measured by Fermi-LAT is shown in panel (b) of Figure 2. Significant GeV gamma-ray emission was detected both during the leading flare and the expected arrival time of the trailing component (TS of 615 and 129 respectively). The flux above 0.1 GeV during the two nights of MAGIC detection is F > 0 . 1 GeV = ( 1 . 7 ± 0 . 4 ) × 10 7 cm 2 · s 1 , nearly twice the average state of the source [22].
In panel (c) of Figure 2, we show the X-ray light curve of QSO B0218+357. There is only a small hint of variability in the investigated time span. A constant fit gives χ 2 / N dof = 21 . 3 / 9 , corresponding to a probability of 1.1%. Moreover, the source did not show an enhanced flux in the X-ray range during the trailing gamma-ray flare.
The optical light curve of QSO B0218+357 in the R band is shown in panel (d) of Figure 2. In all of our observations, the source was fainter than a magnitude of 19. The resulting error bars for the flux points were therefore relatively large, and no significant variability was detected.

4. Discussion

MAGIC has detected VHE gamma-ray emission from QSO B0218+357 during the expected time of arrival of the trailing component of a flare in July 2014. It is currently the most distant source detected with a ground-based gamma-ray telescope. The strong gravitational lensing effect with a delay measured at lower frequencies between individual components allowed us to plan the MAGIC observations before and during the flare. The VHE gamma-ray emission lasted for two nights, similar to the time span of elevated flux of the leading component seen clearly by Fermi-LAT.
Interestingly, the gamma-ray flare seen by MAGIC was not accompanied with a similar increase in either optical or X-ray flux. This is unusual for FSRQs, where often a correlation is seen. Lack of correlation in the case of the QSO B0218+357 flare might be explained by a two-zone scenario, with one zone predominately responsible for the low energy emission, and gamma rays being produced mainly in the second zone. The detailed modelling of multiwavelength emission with a two-zone model was presented in [16].
The innermost regions of a FSRQ have a very high gamma-ray opacity. Therefore, observations of gamma rays with energies above 100 GeV by the MAGIC telescopes can constrain the location of the second emission zone. In order to avoid the strong absorption, the gamma-rays should have been produced close to or beyond the BLR define radius (see e.g., [25] and references therein). The second region must be also sufficiently small to allow day timescale variability observed in gamma-rays, namely R D τ c / ( 1 + z ) = 2 . 7 × 10 16 ( D / 20 ) ( τ / 1 d ) ( cm ) , where R is the radius of the source region, D is the Doppler factor, τ is the observed variability time scale, and c is the speed of light. The quasi-stable optical and X-ray emission might however originate from both a larger and a more inner region of QSO B0218+357.

Acknowledgments

We would like to thank the Instituto de Astrofísica de Canarias for the excellent working conditions at the Observatorio del Roque de los Muchachos in La Palma. The financial support of the German BMBF and MPG, the Italian INFN and INAF, the Swiss National Fund SNF, the ERDF under the Spanish MINECO (FPA2012-39502), and the Japanese JSPS and MEXT is gratefully acknowledged. This work was also supported by the Centro de Excelencia Severo Ochoa SEV-2012-0234, CPAN CSD2007-00042, and MultiDark CSD2009-00064 projects of the Spanish Consolider-Ingenio 2010 programme, by grant 268740 of the Academy of Finland, by the Croatian Science Foundation (HrZZ) Project 09/176 and the University of Rijeka Project 13.12.1.3.02, by the DFG Collaborative Research Centers SFB823/C4 and SFB876/C3, and by the Polish MNiSzW grant 745/N-HESS-MAGIC/2010/0. The Fermi-LAT Collaboration acknowledges support for LAT development, operation and data analysis from NASA and DOE (United States), CEA/Irfu and IN2P3/CNRS (France), ASI and INFN (Italy), MEXT, KEK, and JAXA (Japan), and the K.A. Wallenberg Foundation, the Swedish Research Council and the National Space Board (Sweden). Science analysis support in the operations phase from INAF (Italy) and CNES (France) is also gratefully acknowledged.

Author Contributions

Julian Sitarek, Josefa Becerra González, Marina Manganaro, and Mireia Nievas analyzed the MAGIC data. Sara Buson, and Josefa Becerra González analyzed the Fermi-LAT data. Antonio Stamerra, and Mireia Nievas analyzed the Swift-XRT data. Kari Nilsson analyzed the KVA data. Julian Sitarek coordinated the project and led writing of the manuscript. All the coauthors participated in discussion of obtained results.

Conflicts of Interest

The authors declare no conflict of interest.

References

  1. Mirzoyan, R. Discovery of Very High Energy Gamma-Ray Emission From Gravitationally Lensed Blazar S3 0218+357 With the MAGIC Telescopes. Astron. Telegr. 2014, 6349. Available online: http://www.astronomerstelegram.org/?read=6349 (accessed on 9 September 2016). [Google Scholar]
  2. Ahnen, M.L.; Ansoldi, S.; Antonelli, A.; Antoranz, P.; Babic, A.; Banerjee, B.; Bangale, P.; de Almeida, U.B.; Barrio, J.A.; Bednarek, W.; et al. Very High Energy γ-Rays from the Universe’s Middle Age: Detection of the z = 0.940 Blazar PKS 1441+25 with MAGIC. Astrophys. J. Lett. 2015, 815, L23. [Google Scholar] [CrossRef]
  3. Ackermann, M.; Ajello, M.; Allafort, A.; Antolini, E.; Atwood, W.B.; Axelsson, M.; Baldini, L.; Ballet, J.; Barbiellini, G.; Bastieri, D.; et al. The Second Catalog of Active Galactic Nuclei Detected by the Fermi Large Area Telescope. Astrophys. J. 2011, 743, 171. [Google Scholar] [CrossRef]
  4. Cohen, J.G.; Lawrence, C.R.; Blandford, R.D. The Redshift of the Lensed Object in the Einstein Ring B0218+357. Astrophys. J. 2003, 583, 67–69. [Google Scholar] [CrossRef]
  5. Landoni, M.; Falomo, R.; Scarpa, R.; Treves, A.; Reverte Payá, D. Optical spectroscopy of high redshift BL Lacs at GTC. In Proceedings of the Poster in EWASS 2015 Conference, La Laguna, Tenerife, Spain, 22–26 June 2015.
  6. Baum, S.A.; Stanghellini, C.; Dey, A.; van Breugel, W.; Deustua, S.; Smith, E.P. Radio and optical observations of 0218+357—The smallest Einstein ring? Astron. J. 1992, 104, 1320–1330. [Google Scholar]
  7. Lehár, J.; Falco, E.E.; Kochanek, C.S.; McLeod, B.A.; Muñoz, J.A.; Impey, C.D.; Rix, H.-W.; Keeton, C.R.; Peng, C.Y. Hubble Space Telescope Observations of 10 Two-Image Gravitational Lenses. Astrophys. J. 2000, 536, 584–605. [Google Scholar] [CrossRef]
  8. Corbett, E.A.; Browne, I.W.A.; Wilkinson, P.N.; Patnaik, A. Radio Measurement of the Time Delay in 0218+357. Astrophys. Appl. Gravit. Lensing 1996, 173, 37–42. [Google Scholar]
  9. Biggs, A.D.; Browne, I.W.A.; Helbig, P.; Koopmans, L.V.E.; Wilkinson, P.N.; Perley, R.A. Time delay for the gravitational lens system B0218+357. Mon. Not. R. Astron. Soc. 1999, 304, 349–358. [Google Scholar] [CrossRef]
  10. Cohen, A.S.; Hewitt, J.N.; Moore, C.B.; Haarsma, D.B. Further Investigation of the Time Delay, Magnification Ratios, and Variability in the Gravitational Lens 0218+357. Astrophys. J. 2000, 545, 578. [Google Scholar] [CrossRef]
  11. Eulaers, E.; Magain, P. Time delays for eleven gravitationally lensed quasars revisited. Astron. Astrophys. 2011, 536, A44. [Google Scholar] [CrossRef]
  12. Falco, E.E.; Impey, C.D.; Kochanek, C.S.; Lehár, J.; McLeod, B.A.; Rix, H.-W.; Keeton, C.R.; Muñoz, J.A.; Peng, C.Y. Dust and Extinction Curves in Galaxies with z > 0: The Interstellar Medium of Gravitational Lens Galaxies. Astrophys. J. 1999, 523, 617. [Google Scholar] [CrossRef]
  13. Cheung, C.C.; Larsson, S.; Scargle, J.D.; Amin, M.A.; Blandford, R.D.; Bulmash, D.; Chiang, J.; Ciprini, S.; Corbet, R.H.D.; Falco, E.E.; et al. Fermi Large Area Telescope Detection of Gravitational Lens Delayed γ-Ray Flares from Blazar B0218+357. Astrophys. J. Lett. 2014, 782, L14. [Google Scholar] [CrossRef]
  14. Buson, S.; Cheung, C.C. Fermi LAT Detection of a Hard Spectrum Gamma-ray Flare from Gravitationally Lensed Blazar S3 0218+357. Astron. Telegr. 2014, 6316. Available online: http://www.astronomerstelegram.org/?read=4411 (accessed on 9 September 2016). [Google Scholar]
  15. Buson, S.; Cheung, C.C.; Larsson, S.; Scargle, J.D. Fermi-LAT Detection of a Hard Spectrum Flare from the Gravitationally Lensed Blazar B0218+357. In Proceedings of the 2014 Fermi Symposium, Nagoya, Japan, 20–24 October 2014.
  16. Ahnen, J.; Ansoldi, S.; Antonelli, L.A.; Antoranz, P.; Arcaro, C.; Babic, A.; Banerjee, B.; Bangale, P.; de Almeida, U.B.; Barrio, J.A.; et al. Detection of very high energy gamma-ray emission from the gravitationally lensed blazar QSO B0218+357 with the MAGIC telescopes. Astron. Astrophys. 2016. [Google Scholar] [CrossRef]
  17. Aleksic, J.; Ansoldi, S.; Antonelli, L.A.; Antoranz, P.; Babic, A.; Bangale, P.; Barcelo, M.; Barrio, J.A.; Gonzalez, J.B.; Bednarek, W.; et al. The major upgrade of the MAGIC telescopes, Part I: The hardware improvements and the commissioning of the system. Astropart. Phys. 2016, 72, 61–75. [Google Scholar] [CrossRef] [Green Version]
  18. Aleksiá, J.; Ansoldi, S.; Antonelli, L.A.; Antoranz, P.; Babic, A.; Bangale, P.; Barceló, M.; Barrio, J.A.; Becerra González, J.; Bednarek, W.; et al. The major upgrade of the MAGIC telescopes, Part II: A performance study using observations of the Crab Nebula. Astropart. Phys. 2016, 72, 76–94. [Google Scholar] [CrossRef]
  19. Zanin, R.; Carmona, E.; Sitarek, J.; Colin, P.; Frantzen, K.; Gaug, M.; Lombardi, S.; Lopez, M.; Moralejo, A.; Satalecka, K.; et al. MARS, the MAGIC analysis and reconstruction software. In Proceedings of the 33rd ICRC, Rio de Janeiro, Brazil, 2–9 July 2013.
  20. Atwood, W.B.; Abdo, A.A.; Ackermann, M.; Althouse, W.; Anderson, B.; Axelsson, M.; Baldini, L.; Ballet, J.; Band, D.L.; Barbiellini, G.; et al. The Large Area Telescope on the Fermi Gamma-Ray Space Telescope Mission. Astrophys. J. 2009, 697, 1071. [Google Scholar] [CrossRef]
  21. Precomputation of Livetime and Exposure. Available online: http://fermi.gsfc.nasa.gov/ssc/data/analysis/documentation/Cicerone/Cicerone_Likelihood/Exposure.html (accessed on 9 September 2016).
  22. Acero, F.; Ackermann, M.; Ajello, M.; Albert, A.; Atwood, W.B.; Axelsson, M.; Baldini, L.; Ballet, J.; Barbiellini, G.; Bastieri, D.; et al. Fermi Large Area Telescope Third Source Catalog. Astrophys. J. Suppl. Ser. 2015, 218, 23. [Google Scholar] [CrossRef]
  23. Burrows, D.N.; Hill, J.E.; Nousek, J.A.; Kennea, J.A.; Wells, A.; Osborne, J.P.; Abbey, A.F.; Beardmore, A.; Mukerjee, K.; Short, A.D.T.; et al. The Swift X-ray telescope. Space Sci. Rev. 2005, 120, 165–195. [Google Scholar] [CrossRef]
  24. Nilsson, K.; Pasanen, M.; Takalo, L.O.; Lindfors, E.; Berdyugin, A.; Ciprini, S.; Pforr, J. Host galaxy subtraction of TeV candidate BL Lacertae objects. Astron. Astrophys. 2007, 475, 199–207. [Google Scholar] [CrossRef]
  25. Pacciani, L.; Tavecchio, F.; Donnarumma, I.; Stamerra, A.; Carrasco, L.; Recillas, E.; Porras, A.; Uemura, M. Exploring the Blazar Zone in High-energy Flares of FSRQs. Astrophys. J. 2014, 790, 45. [Google Scholar] [CrossRef]
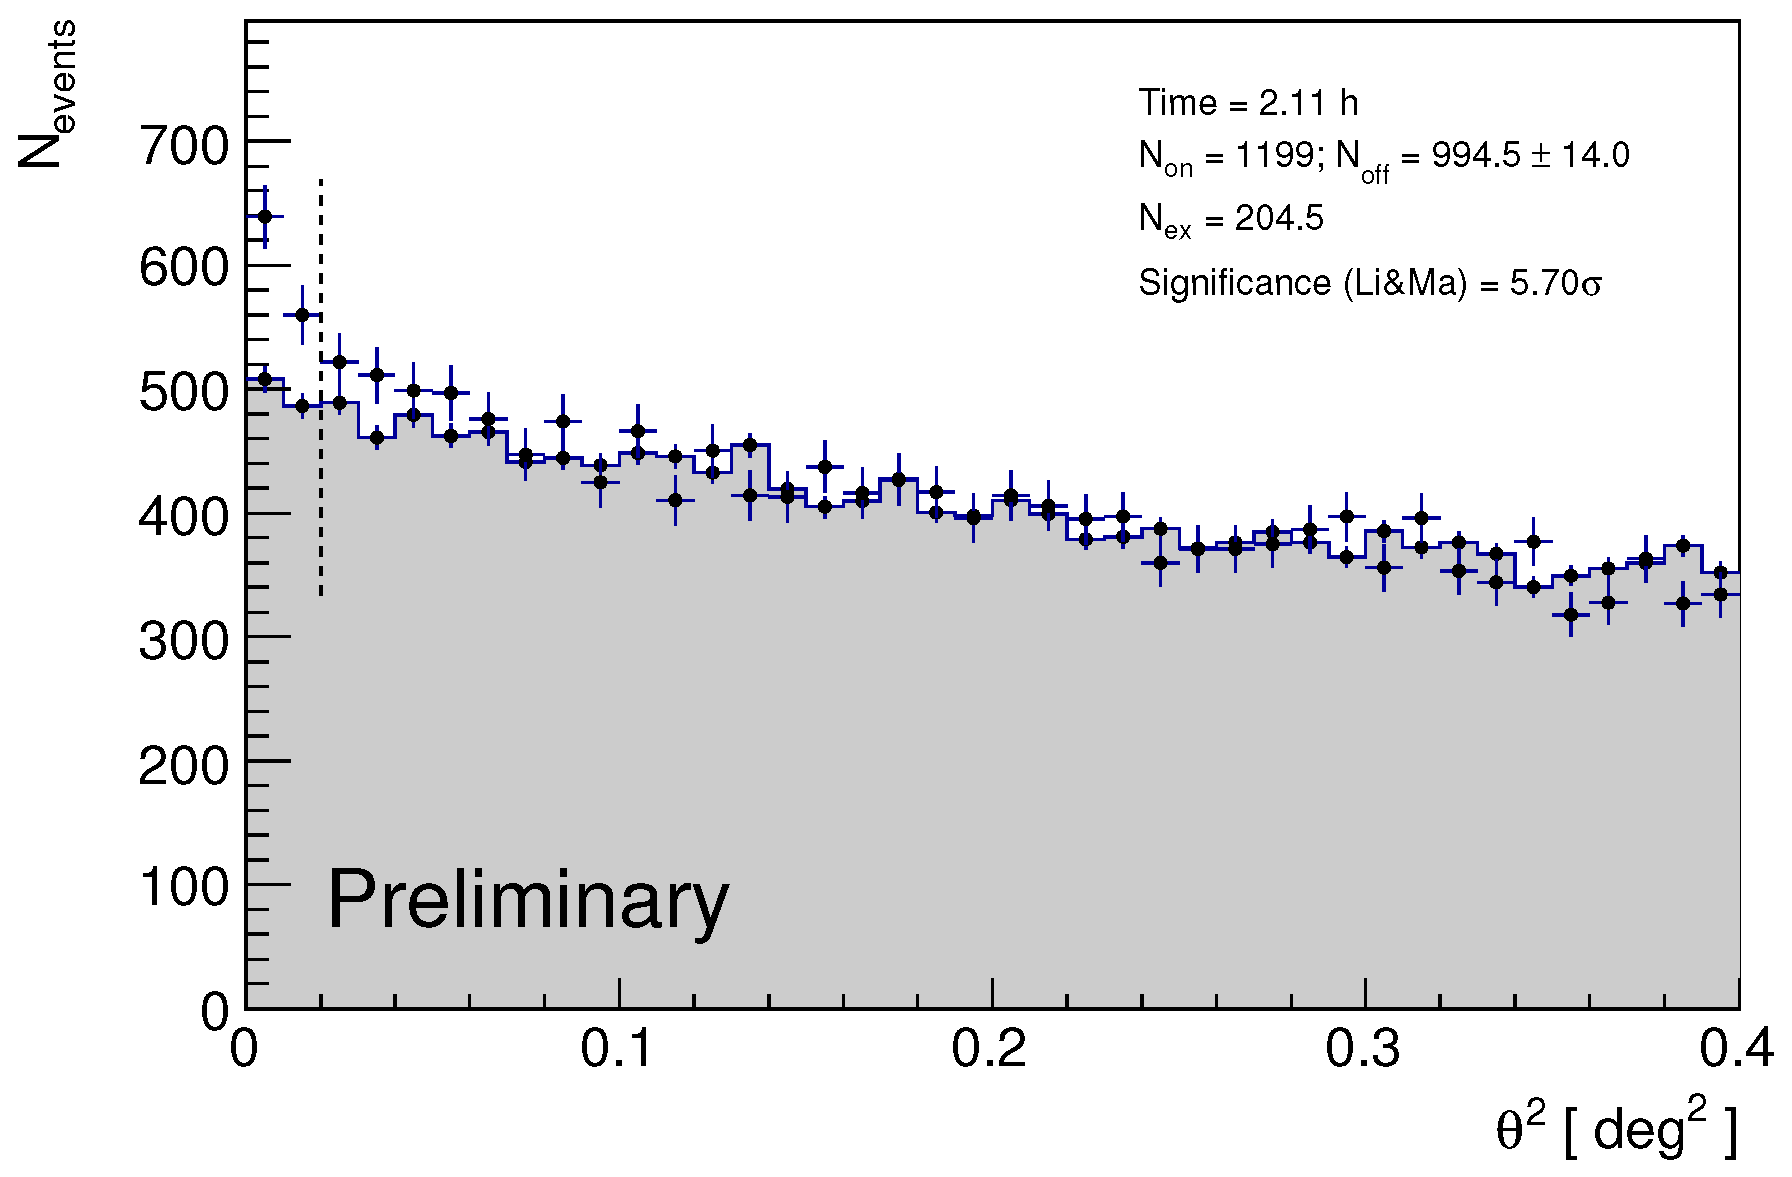
Figure 1. Distribution of the squared angular distance, θ 2 , between the reconstructed source position and the nominal source position (points) or the background estimation position (shaded area). Vertical dashed line shows the value of the θ 2 cut up to which the number of excess events and significance are computed.
Galaxies 04 00031 g001
Figure 2. Multiwavelength light curve of QSO B0218+357 during the flaring state in July/August 2014. (a) MAGIC (points) above 100 GeV with a Gaussian fit to the peak position (thick solid line); (b) Fermi-LAT above 0.3 GeV with the average flux from the 3rd Fermi-LAT Catalog [22] shown as a dashed line. Notice that during the days where the trailing emission was expected Fermi-LAT was in pointing mode allowing significant detection of lower flux levels; (c) Swift-XRT count rate in the 0.3–10 keV range; (d) KVA in R band (not corrected for the contribution of host/lens galaxies and the Galactic extinction). The two shaded regions are separated by 11.46 days.
Galaxies 04 00031 g002