Article

Investigating the Puzzling Synchrotron Behaviour of Mrk 421

by
Maria I. Carnerero
1,*,
Claudia M. Raiteri
1,
Massimo Villata
1,
Jose A. Acosta Pulido
2,3,
Paul S. Smith
4,
Valeri M. Larionov
5,6 and
The WEBT Collaboration
1
1
INAF, Osservatorio Astrofisico di Torino, via Osservatorio 20, I-10025 Pino Torinese, Italy
2
Instituto de Astrofisica de Canarias (IAC). E-38205 La Laguna, Tenerife, Spain
3
Departamento de Astrofisica, Universidad de La Laguna, E-38206 La Laguna, Tenerife, Spain
4
Steward Observatory, University of Arizona, Tucson, AZ 85721, USA
5
Astronomical Institute, St. Petersburg State University, St. Peterburg 198504, Russia
6
Pulkovo Observatory, St.-Petersburg 196140, Russia
*
Author to whom correspondence should be addressed.
Galaxies 2016, 4(4), 61; https://doi.org/10.3390/galaxies4040061
Submission received: 9 September 2016 / Revised: 6 October 2016 / Accepted: 15 October 2016 / Published: 4 November 2016
(This article belongs to the Special Issue Blazars through Sharp Multi-wavelength Eyes)

Abstract

:
We investigate the multiwavelength behaviour of the high-energy peaked BL Lac object (HBL) Mrk 421 at redshift z = 0 . 031 in the period 2007–2015. We use optical photometric, spectroscopic, and polarimetric data and near-infrared data obtained by 35 observatories participating in the GLAST-AGILE Support Program (GASP) of the Whole Earth Blazar Telescope (WEBT), as well as by the Steward Observatory Support of the Fermi Mission. We also employ high-energy data from the Swift (UV and X-rays) satellite to study correlations among emission in different bands.

1. Introduction

Blazars are highly variable active galactic nuclei (AGN) that can be detected at all wavelengths, from radio waves to γ-rays. The strong relativistic jets from blazars are closely aligned with the observer’s line of sight and appear bright due to relativistic beaming. Blazar emission typically consists of two spectral components: the low energy one contributes to the radio through the optical regime, and is attributed to synchrotron radiation from relativistic electrons; the high energy one is likely inverse Compton scattering radiation peaking in the γ-ray regime.
Mrk 421 at z = 0.031 [1] was the first blazar to be detected at γ-ray energy E >500 GeV [2]. It is classified as a high-energy-peaked BL Lac (HBL), a relatively low-luminosity source with both synchrotron and inverse Compton peaks located at high energies.

2. The GASP-WEBT Collaboration

The Whole Earth Blazar Telescope (WEBT) (http://www.oato.inaf.it/blazar/webt/) was born in 1997 as a network of optical astronomers who, in concert, have the capability to obtain continuous high-temporal-density monitoring of blazars (Figure 1). Later on, the monitoring activity was extended to the radio and near-infrared bands. This is extremely useful for understanding the broad-band continuum emission of these sources, especially when the study is performed in conjunction with observations at higher frequencies (ultraviolet, X, and γ-rays). In 2007, a WEBT project called GASP (GLAST-AGILE Support Program) was started to provide long-term low-energy monitoring of a selected sample of 28 γ-loud sources, in particular to compare to the high energy observations of the Fermi (formerly GLAST) and AGILE γ-ray satellites.
In the framework of the WEBT, one can also get continuous polarimetric monitoring of blazars in the optical (and recently near-infrared) bands (e.g., [3,4,5,6]).
The data collected by the GASP-WEBT collaboration are stored in the GASP-WEBT archive, and are available one year after the publication of the results (For questions regarding the data availability, one can contact the WEBT President Massimo Villata ([email protected])).

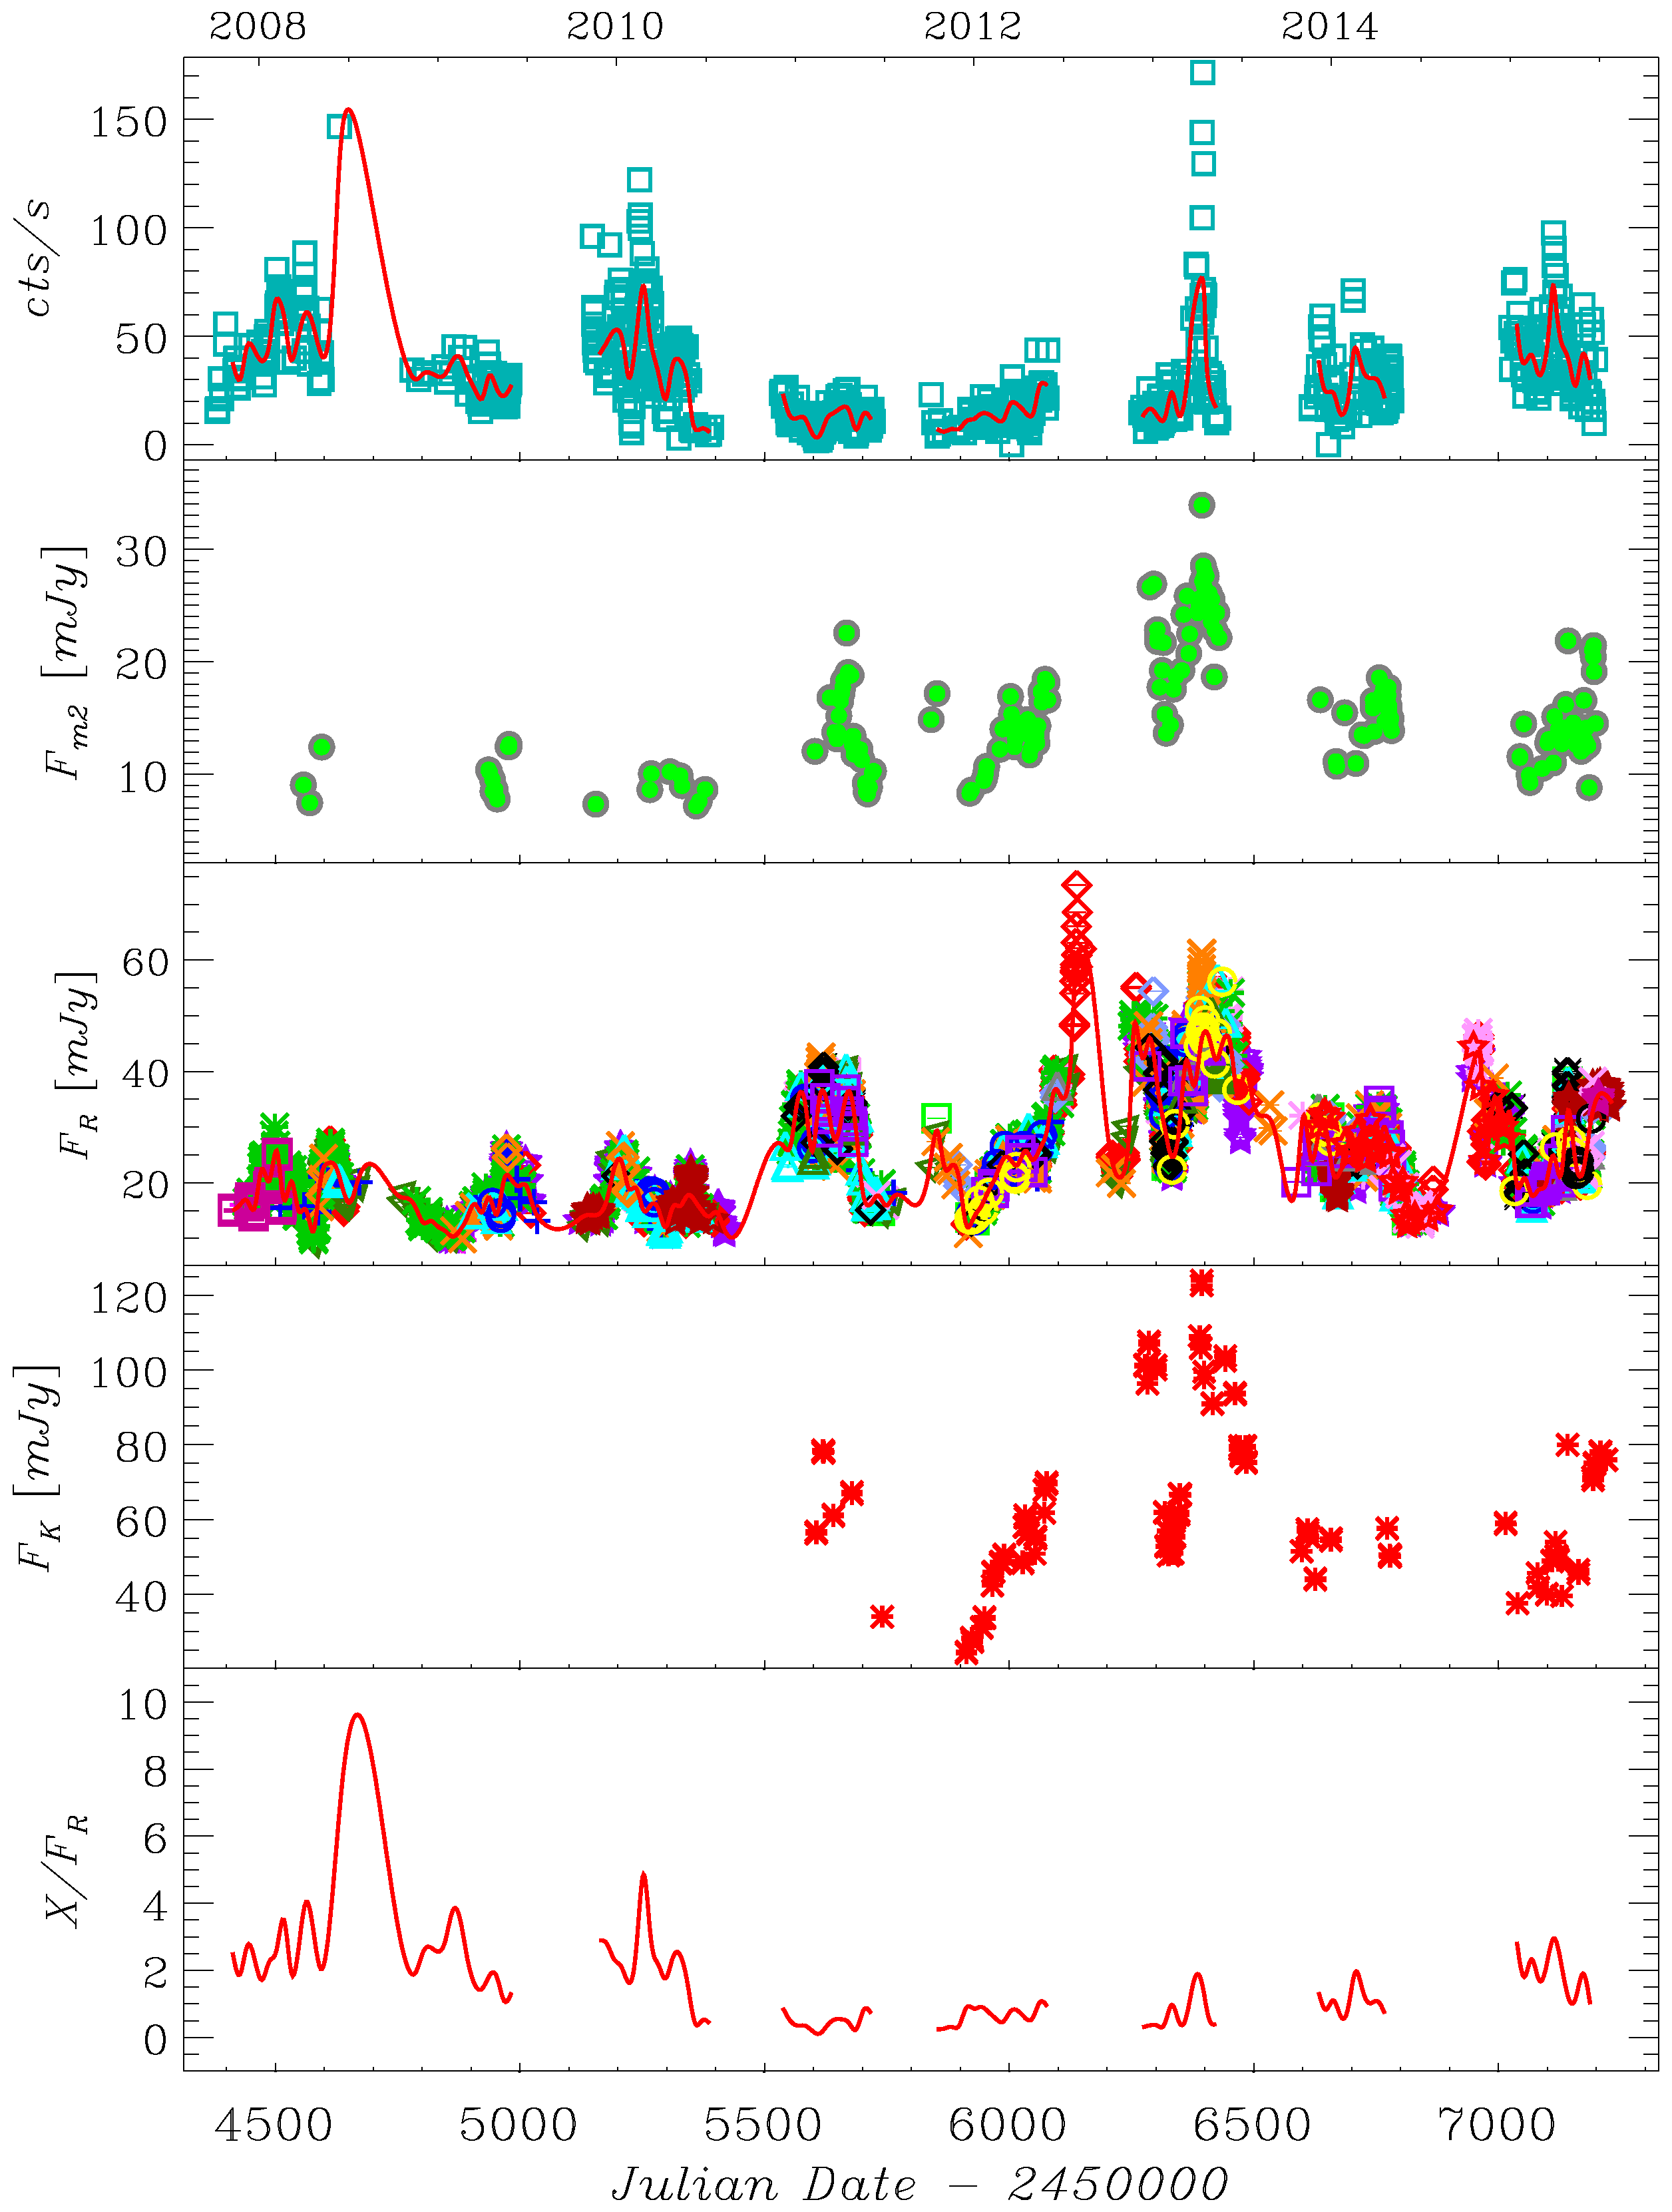
3. Multiwavelength Light Curves of Mrk 421

Figure 2 shows the multi-wavelength light curves of Mrk 421 from the near-infrared to the X-ray band between 2007–2015.
The GASP–WEBT data were taken by 25 observatories in 10 countries: Abastumani (Georgia), AstroCamp (Spain), Belogradchik (Bulgaria), Calar Alto (Spain), Castelgrande (Italy), Crimean (Russia), Lowell (USA), L’Ampolla (Spain), Lulin (Taiwan), New Mexico Skies (USA), Pulkovo (Russia), ROVOR (USA), Roque de los Muchachos (Spain), Rozhen (Bulgaria), Sabadell (Spain), Sirio (Italy), Skinakas (Greece), St. Petersburg (Russia), Talmassons (Italy), Teide (Spain), Tijarafe (Spain), Torino (Italy), Tuorla (Finland), Videojevica (Serbia), and West Mountain (USA).
A clear correlation between the X-ray, UV, optical, and NIR is visible during the outbursts in 2013, while the X-ray outbursts in 2008 and 2010 lack a major optical counterpart and are difficult to identify in UV because of poor sampling. In contrast, in 2011, we see an outburst in UV, optical, and NIR, but not in X-rays.
We compare the light curves in X-ray and R bands. Interpolations with a cubic spline through the 15-day binned light curves are drawn to highlight the long-term behaviour. The bottom panel shows the ratio between the spline fits to the X-ray and R band data. The X-ray emission appears to be strongly dominant in the first two observing periods (OPs) from June 2007 to June 2009. Then, it decreases in the third OP (June 2009–July 2010) and reaches a minimum value in the fourth and fifth OPs (October 2010–June 2012), when the optical emission shows strong activity. Since 2013, the X-ray/optical ratio seems to be slowly increasing again.
If both the X-ray and optical radiation in Mrk 421 is produced by the synchrotron process, the change in the X-ray/optical ratio then suggests that they do not come from the same jet emission region. This change may indicate a different (and varying) viewing angle of the corresponding emitting zones, with a consequent difference in the relativistic Doppler beaming. According to this interpretation, the jet region responsible for the X-ray emission would be more closely aligned with the line of sight in the first OPs, and more misaligned in the fourth and fifth OPs, while the optical emission would be more Doppler-enhanced during the optical outbursts.

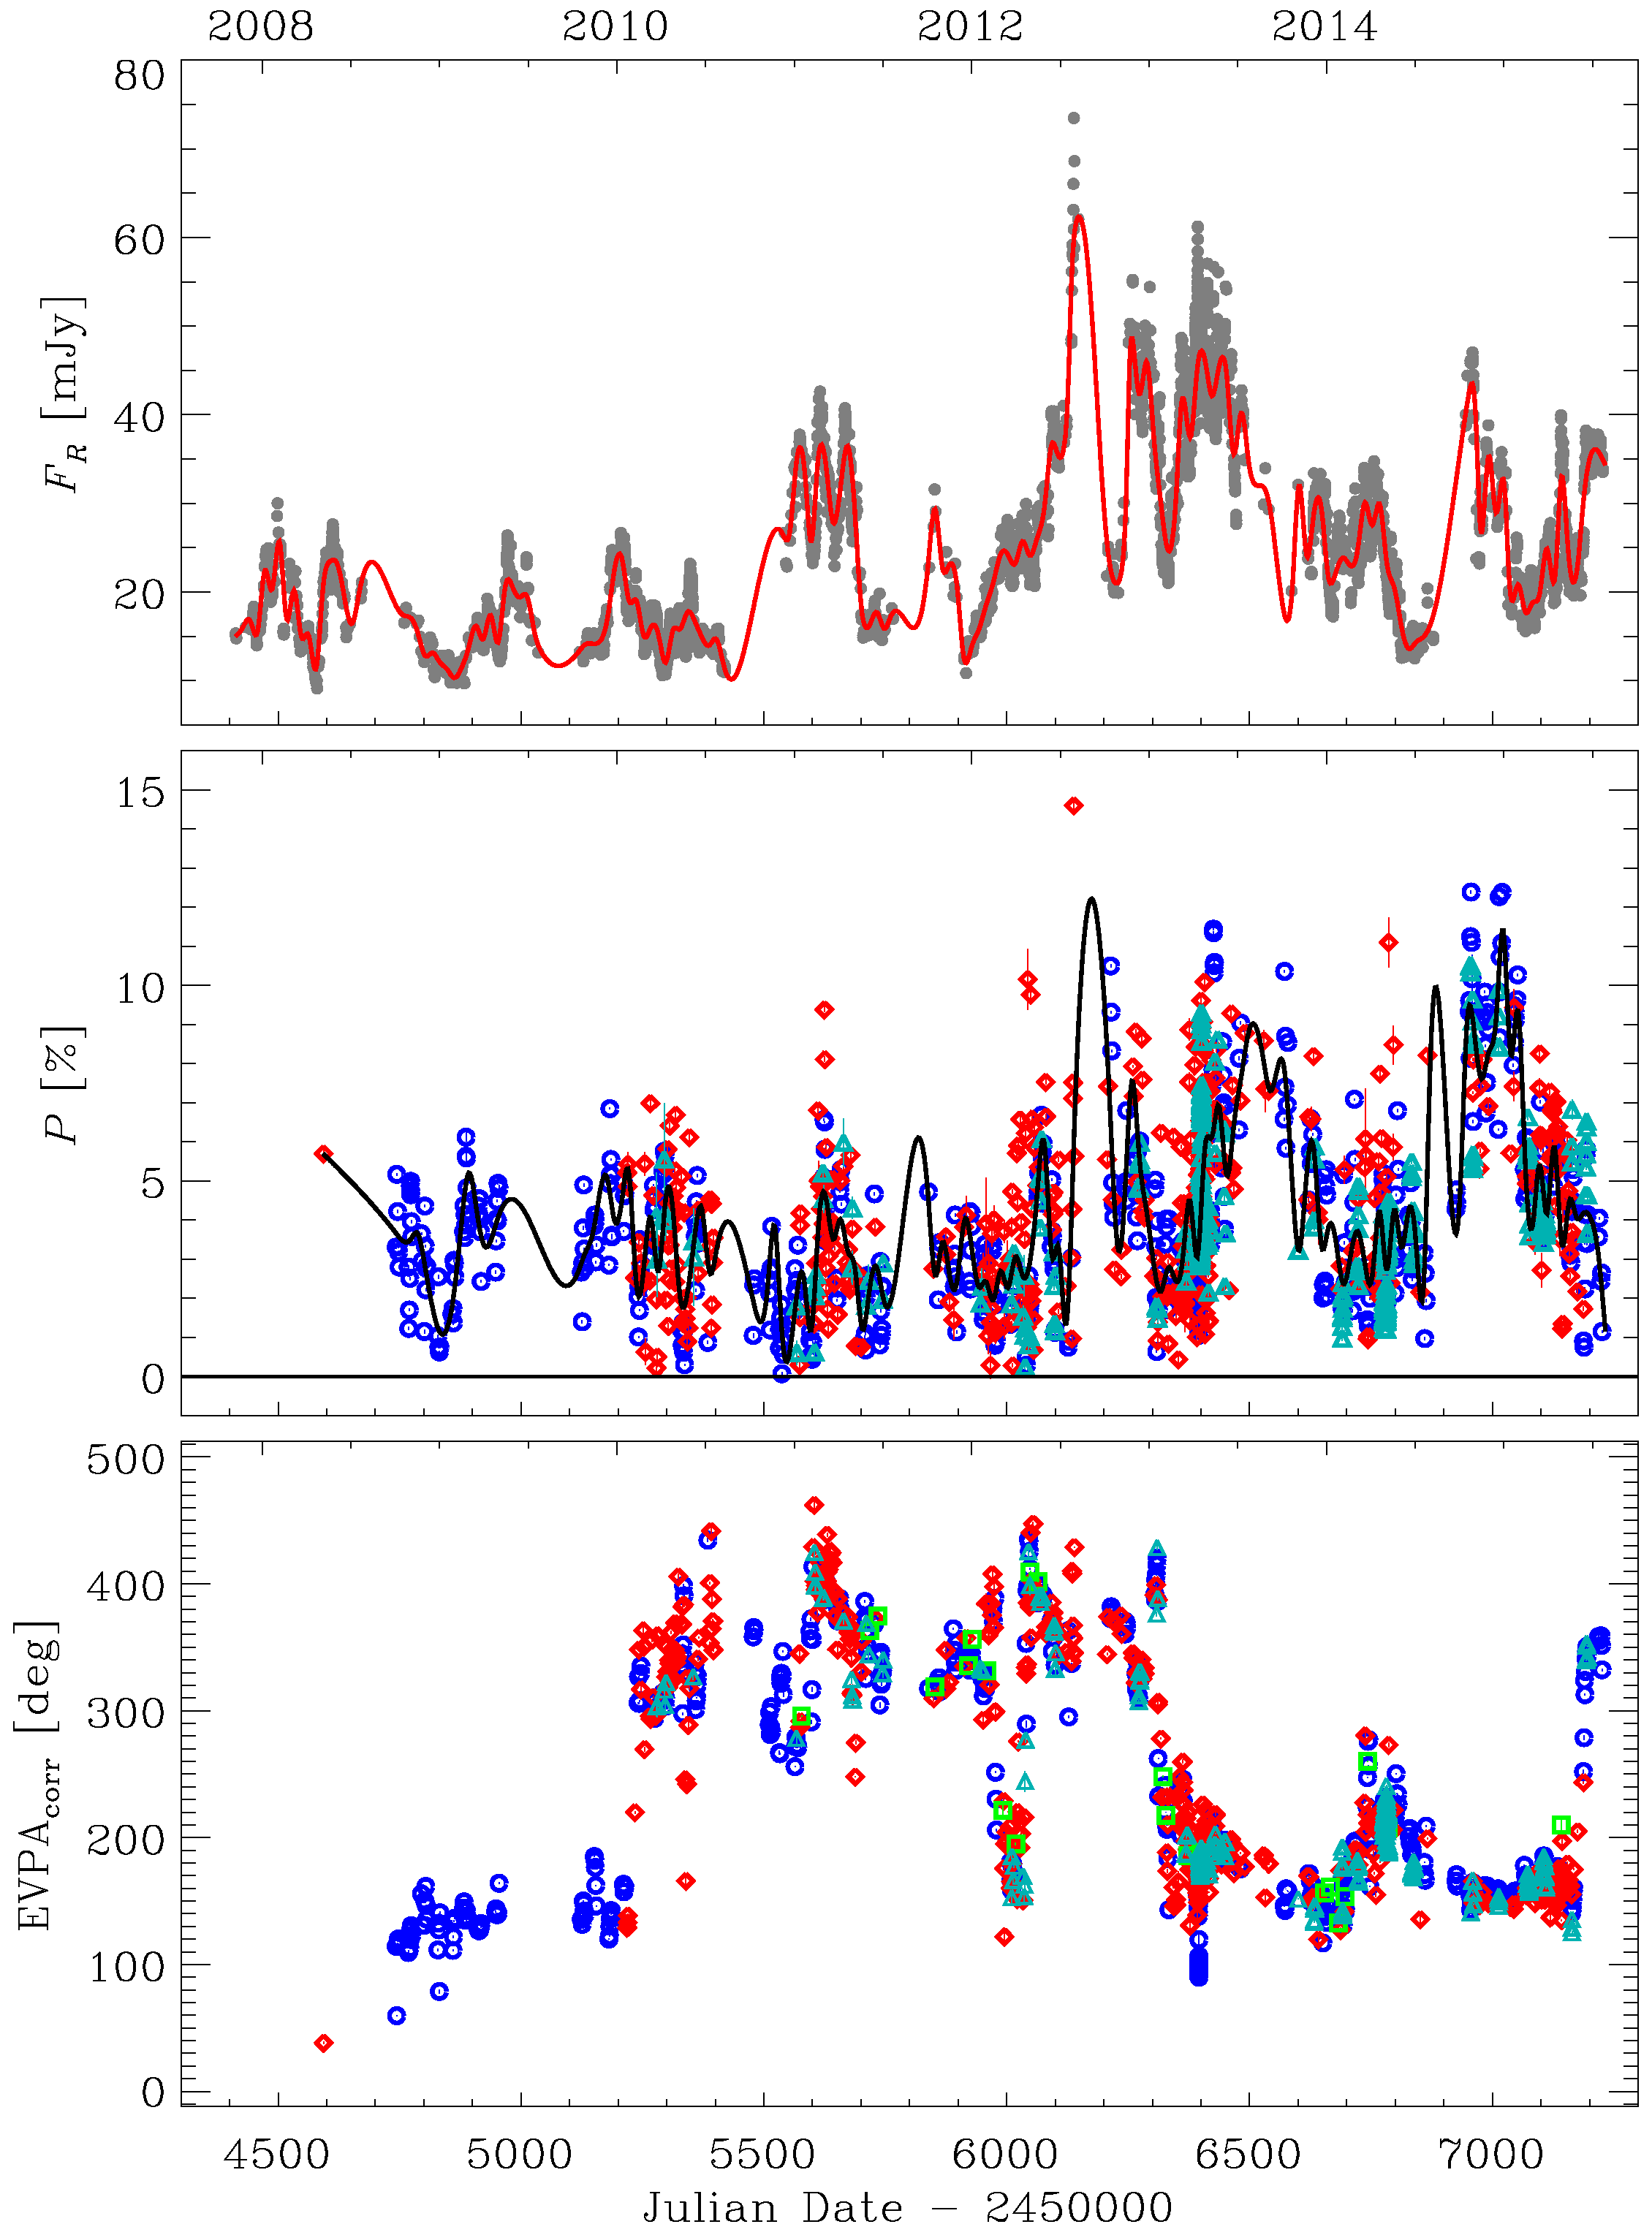
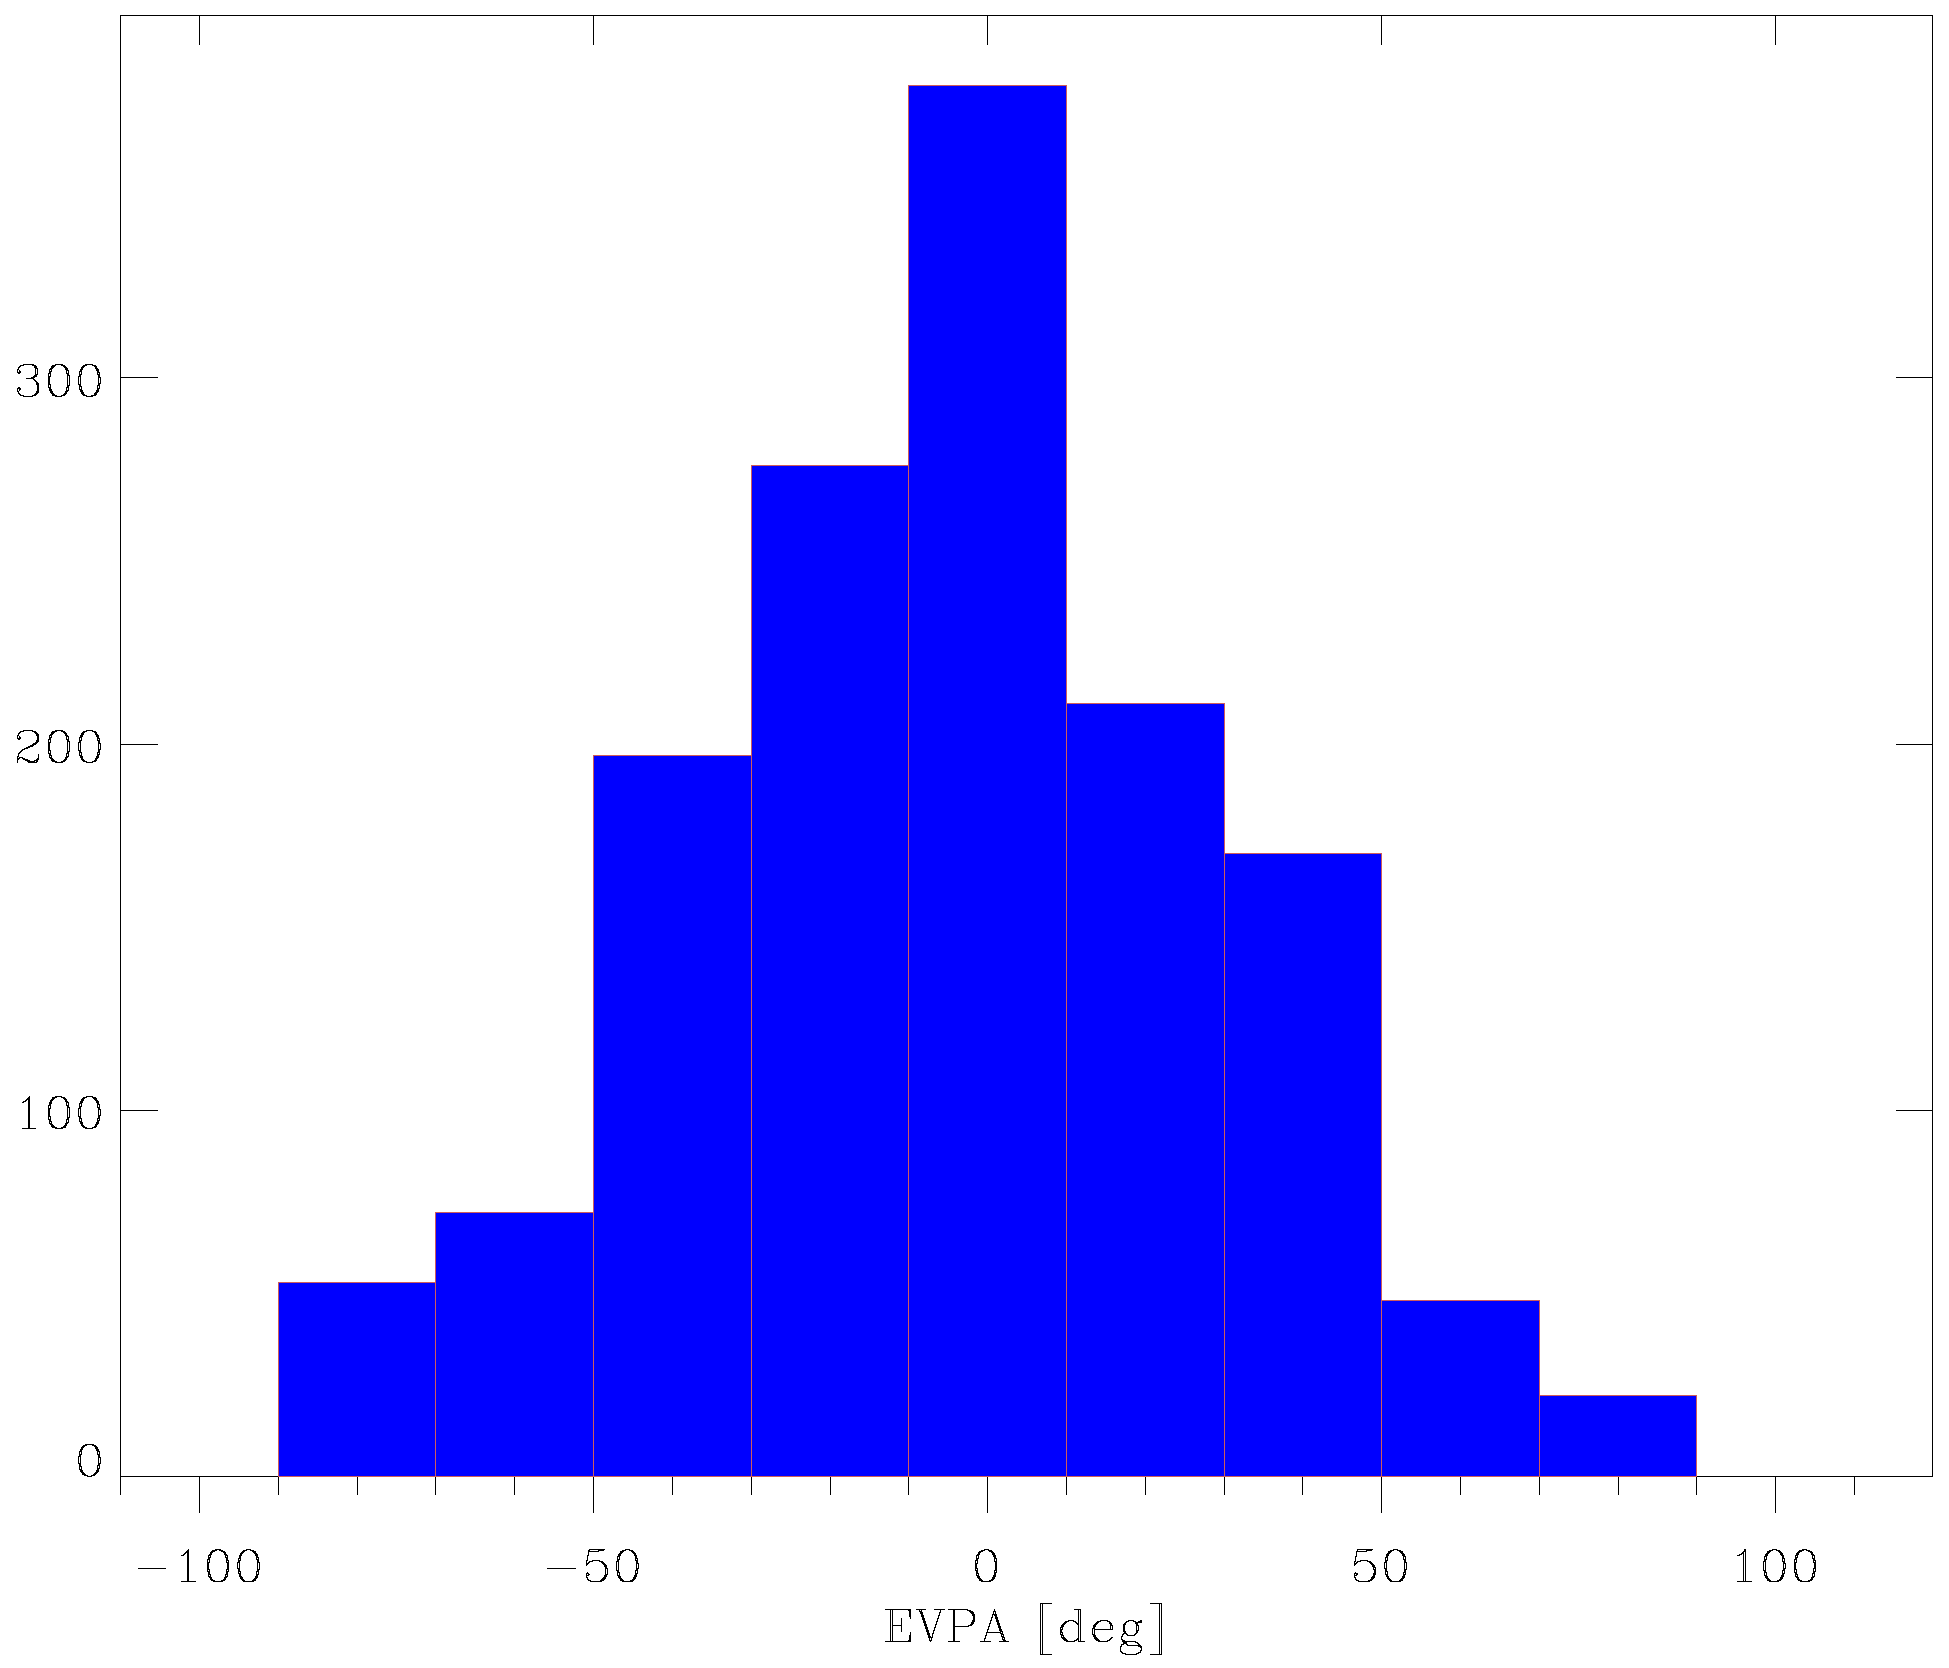
4. Long-Term Optical Polarization Variability

Blazar emission is characterised by a variable degree of linear polarisation P and electric vector polarisation angle (EVPA; [7]). We collected 1430 polarisation data in the R-band from the Lowell (Perkins Telescope), Crimean, Calar Alto, and Steward observatories. While the data of the first three come from photometry, the measurements from Steward Observatory are derived from 4000–7550 Å spectropolarimetry with resolution of ∼15 Å. The reported P and EVPA values are constructed from the median Q/I and U/I in the 5000–7000 Å band. The effective wavelength of this bandpass is not too different from the Cousin’s R-band, and the wavelength dependence of the polarization seen in the spectropolarimetry during this period is not strong enough to significantly affect the analysis. Details on the data acquisition and reduction procedures can be found in [8,9,10].
Figure 3 shows the behaviour of the observed P (not corrected for the host galaxy contribution) and EVPA as a function of time for the period 2007–2015. These are compared to the R-band light curve. To solve the ± 180 n ambiguity in EVPA, we minimized the angle difference between subsequent points, taking the errors on the EVPAs into account. Cubic spline interpolations through the 15-day binned light and polarisation curves are drawn to highlight the long-term behaviour. Visual inspection of the figure reveals that in some cases periods of high flux correspond to periods of high polarisation degree, while in other cases, the opposite is true. The mean value of the observed P is about 4%, but with variations between 0.07% and 14.6%. We notice that when considered between 90 and 90 , the EVPA values peak in the 10 + 10 bin, with a mean value of ∼4 (see Figure 4), but when the ± 180 n ambiguity is solved, wide rotations appear.
In particular, in the last observing season, the EVPA rotated by ∼ 200 in about one month. At about half way, P showed a local minimum simultaneously with a small flux peak. This is compatible with the geometric explanation given by [11].

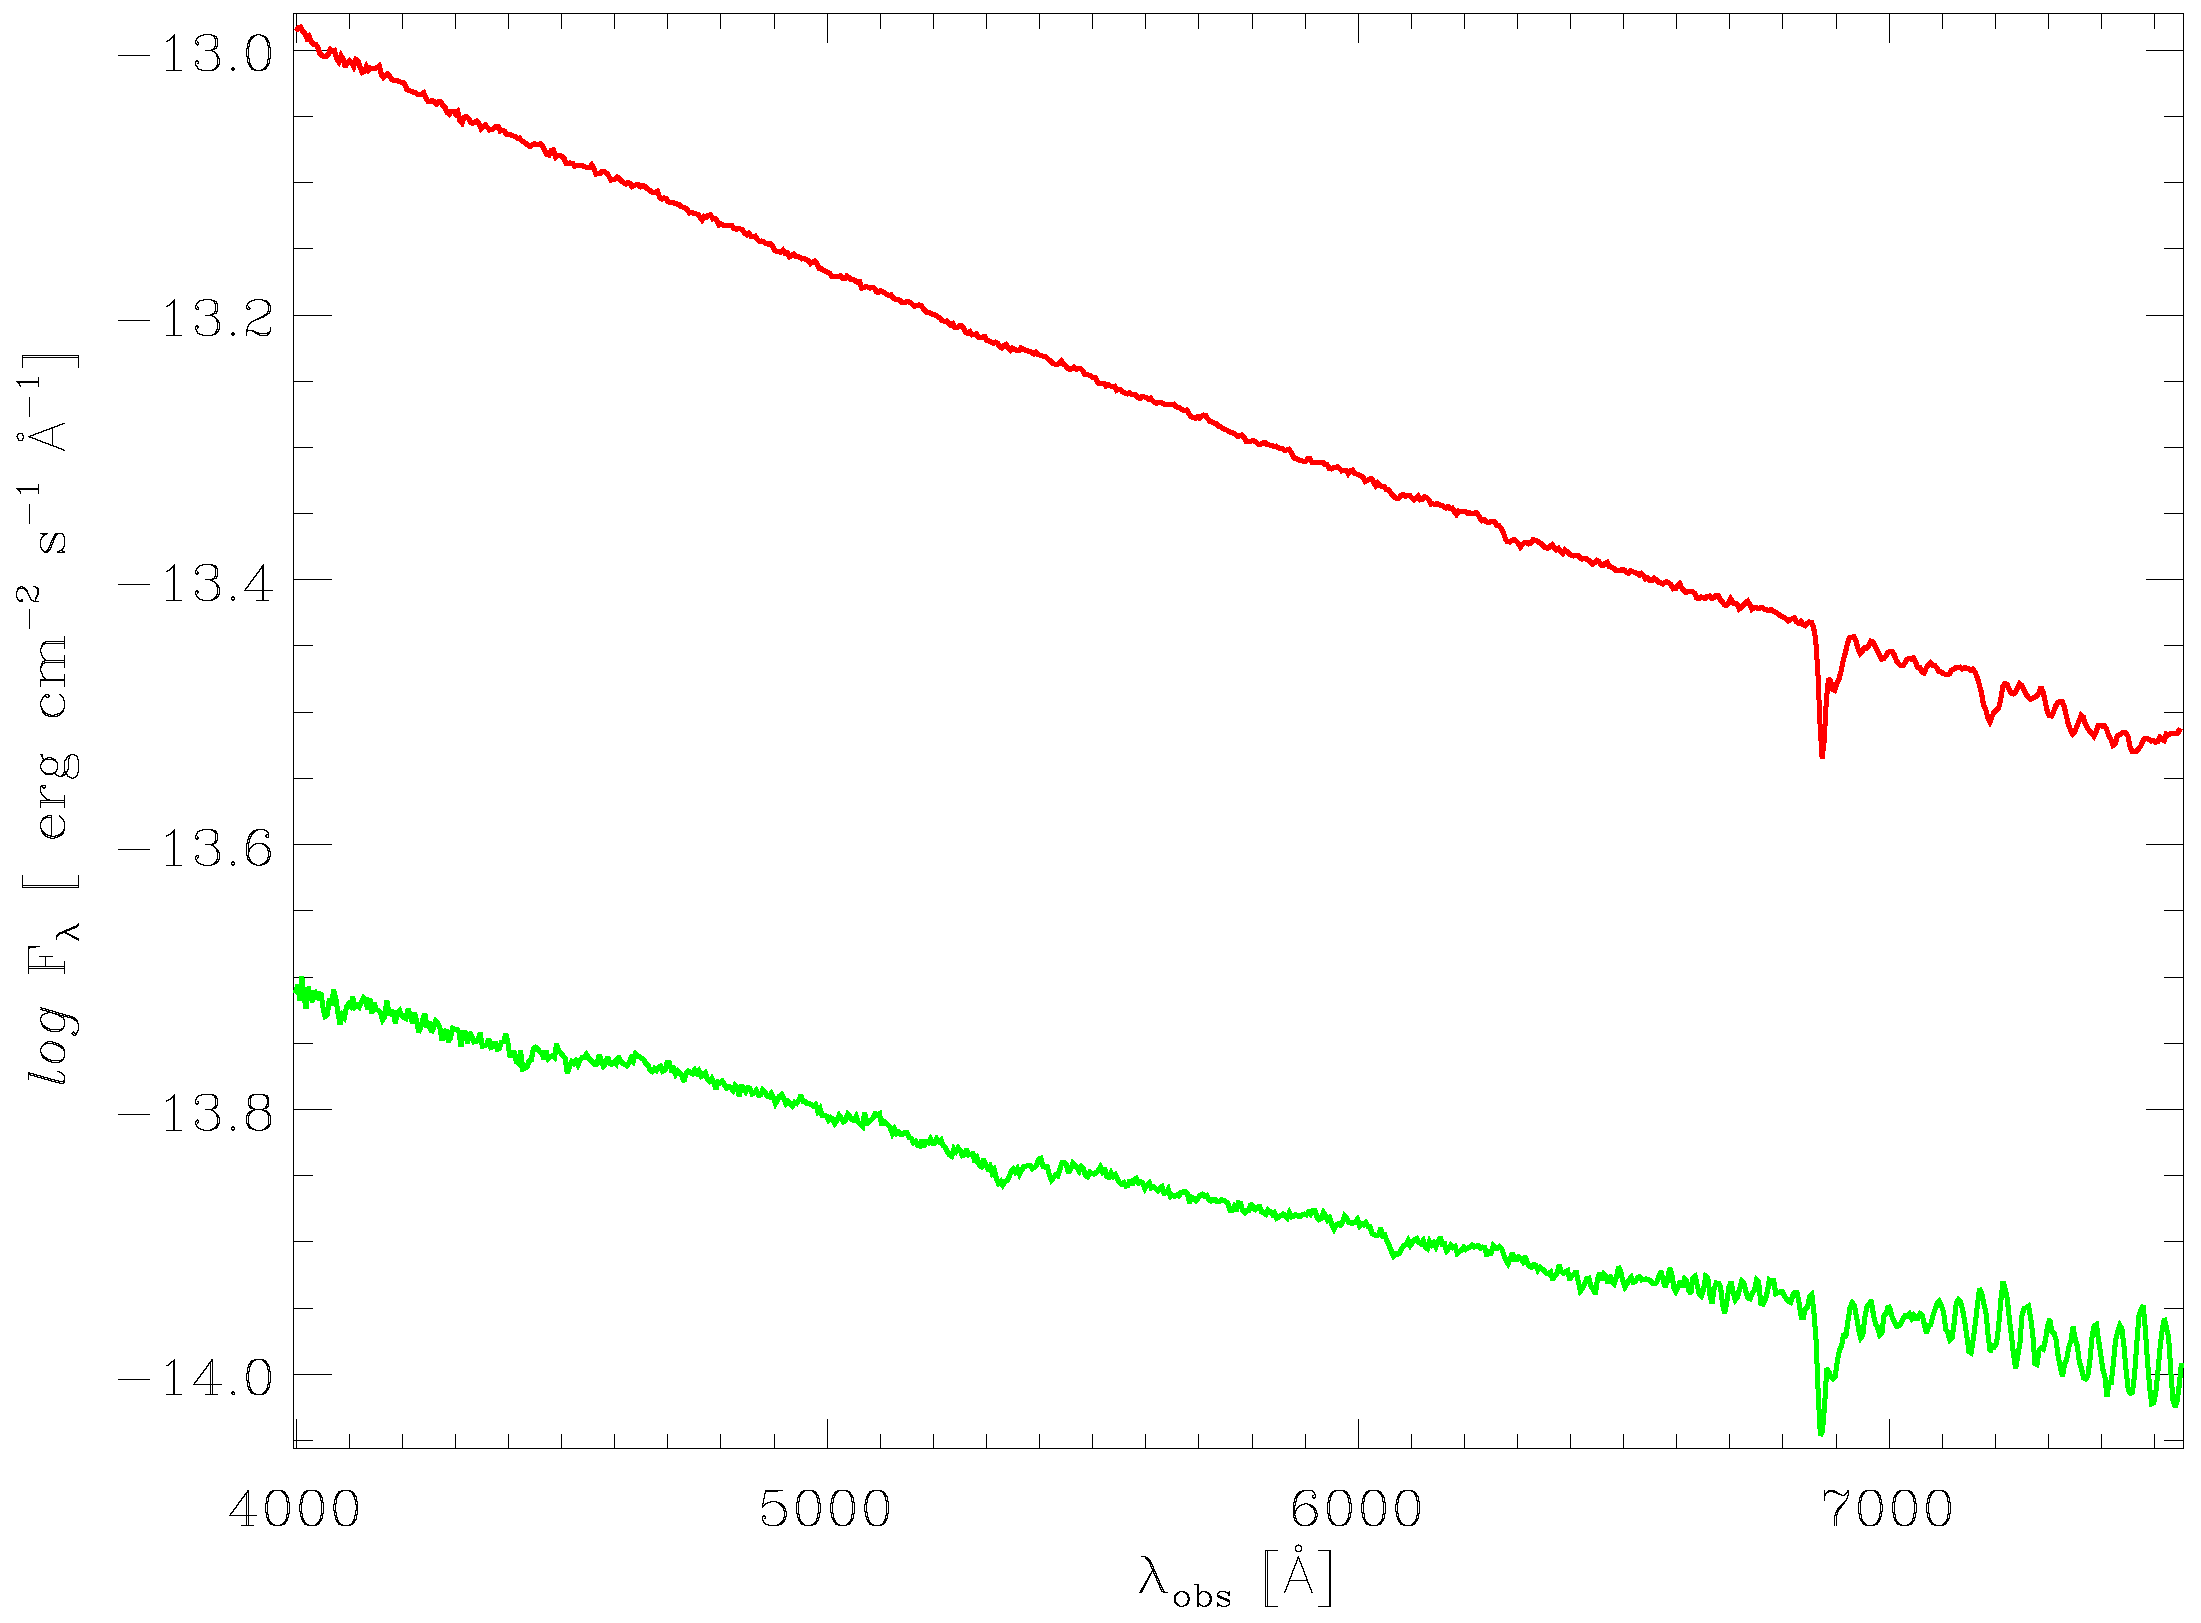
5. Optical Spectropolarimetric Variability

The Steward spectropolarimetry database can be used to examine the optical spectral variability of Mrk 421 in detail. We used 603 spectropolarimetric data.
In Figure 5, we display the source spectra corresponding to the maximum and minimum brightness states. They are featureless, and show a clear bluer-when-brighter trend.
In Figure 6, we present the flux densities and polarization percentages derived from the spectra for two different ranges of wavelengths: blue (4000–5000 Å) and red (5800–6800 Å). The flux is more variable and polarized in the blue than in the red. This is consistent with the greater contribution from the host galaxy in the red.

6. Conclusions

We presented an analysis of the long-term multiwavelength emission behaviour of Mrk 421. Near-infrared and optical data were provided by the GASP-WEBT Collaboration, while UV and X-ray data come from observations by the Swift satellite. Moreover, spectropolarimetric information acquired at Steward Observatory was used to study a possible dependency of polarization degree, P, on frequency. We found incessant activity at all wavelengths over the entire 2007–2015 period considered. The near-IR and UV fluxes are well correlated with the optical ones, while the X-ray flux appears to behave in a different way. Prominent X-ray flares occurred in 2008, 2010, and 2013, while major optical flares were observed in 2012–2013.
Polarimetry can, in principle, help to understand whether geometrical effects play a role. We thus examined the polarimetric information on the source to find episodes where the behaviour of P and EVPA can suggest a curved motion in the source, as expected in case of, for example, a helical jet. We may have found one case in which this scenario is plausible. Indeed, in general, P and EVPA variations are not correlated with flux. This may support the existence of multiple emission regions with different polarization characteristics. Alternatively, the source polarimetric properties are mostly determined by stochastic variations due to turbulence [12].
A more detailed presentation and discussion of the results will be published in Carnerero et al. (in preparation).

Author Contributions

All authors contributed actively to the paper.

Conflicts of Interest

The authors declare no conflict of interest.

References

  1. Ulrich, M.-H.; Kinman, T.D.; Lynds, C.R.; Rieke, G.H.; Ekers, R.D. Nonthermal continuum radiation in three elliptical galaxies. Astrophys. J. 1975, 198, 261–266. [Google Scholar] [CrossRef]
  2. Punch, M.; Akerlof, C.W.; Cawley, M.F.; Chantell, M.; Fegan, D.J.; Fennell, S.; Gaidos, J.A.; Hagan, J.; Hillas, A.M.; Jiang, Y.; et al. Detection of TeV photons from the active galaxy Markarian 421. Nature 1992, 358, 477–478. [Google Scholar] [CrossRef]
  3. Carnerero, M.I.; Raiteri, C.M.; Villata, M.; Acosta-Pulido, J.A.; D’Ammando, F.; Smith, P.S.; Larionov, V.S.; Agudo, I.; Arévalo, M.J.; Arkharov, A.A.; et al. Multiwavelength behaviour of the blazar OJ 248 from radio to β-rays. Mon. Not. R. Astron. Soc. 2015, 450, 2677–2691. [Google Scholar] [CrossRef]
  4. Larionov, V.M.; Villata, M.; Raiteri, C.M.; Jorstad, S.G.; Marscher, A.P.; Agudo, I.; Smith, P.S.; Acosta-Pulido, J.A.; Arévalo, M.J.; Arkharov, A.A.; et al. Exceptional outburst of the blazar CTA 102 in 2012: the GASP–WEBT campaign and its extension. Mon. Not. R. Astron. Soc. 2016, 461, 3047–3056. [Google Scholar] [CrossRef]
  5. Raiteri, C.M.; Villata, M.; Smith, P.S.; Larionov, V.M.; Acosta-Pulido, J.A.; Aller, M.F.; D’Ammando, F.; Gurwell, M.A.; Jorstad, S.G.; Joshi, M.; et al. Variability of the blazar 4C 38.41 (B3 1633+382) from GHz frequencies to GeV energies. Astron. Astrophys. 2012, 545, A48. [Google Scholar] [CrossRef]
  6. Raiteri, C.M.; Villata, M.; D’Ammando, F.; Larionov, V.M.; Gurwell, M.A.; Mirzaqulov, D.O.; Smith, P.S.; Acosta-Pulido, J.A.; Agudo, I.; Arévalo, M.J.; et al. The awakening of BL Lacertae: observations by Fermi, Swift and the GASP-WEBT. Mon. Not. R. Astron. Soc. 2013. [Google Scholar] [CrossRef]
  7. Smith, A.G. Blazar Continuum Variability; Miller, H.R., Webb, J.R., Noble, J.C., Eds.; Astronomical Society of the Pacific Conference Series: San Francisco, CA, USA, 1996; Volume 110, p. 3. [Google Scholar]
  8. Jorstad, S.G.; Marscher, A.P.; Larionov, V.M.; Agudo, I.; Smith, P.S.; Gurwell, M.; Lähteenmäki, A.; Tornikoski, M.; Markowitz, A.; Arkharov, A.A.; et al. Flaring behavior of the Quasar 3C 454.3 across the electromagnetic spectrum. Astrophys. J. 2010, 715, 362. [Google Scholar] [CrossRef]
  9. Larionov, V.M.; Jorstad, S.G.; Marscher, A.P.; Raiteri, C.M.; Villata, M.; Agudo, I.; Aller, M.F.; Arkharov, A.A.; Asfandiyarov, I.M.; Bach, U.; et al. Results of WEBT, VLBA and RXTE Monitoring of 3C 279 during 2006–2007. Astron. Astrophys. 2008, 492, 389–400. [Google Scholar] [CrossRef]
  10. Smith, P.S.; Schmidt, G.D.; Hines, D.C.; Foltz, C.B. Optical Spectropolarimetry of Quasi-stellar Objects Discovered by the Two-Micron All Sky SurveyA portion of the results presented here made use of the Multiple Mirror Telescope Observatory, a facility operated jointly by the University of Arizona and the Smithsonian Institution. Astrophys. J. 2003, 593, 676. [Google Scholar]
  11. Nalewajko, K. Polarization swings from curved trajectories of the emitting regions. Int. J. Mod. Phys. D 2010, 19, 701–703. [Google Scholar] [CrossRef]
  12. Marscher, A.P. Turbulent, extreme multi-zone model for simulating flux and polarization variability in blazars. Astrophys. J. 2014, 780, 87. [Google Scholar] [CrossRef]
Figure 1. The WEBT collaboration logo, showing the longitude distribution of the participants.
Galaxies 04 00061 g001
Figure 2. Light curves of Mrk 421 at different frequencies in 2007–2015. From top to bottom: (1) the X-ray light curve from Swift-XRT (counts s 1 ) with a cubic spline interpolation through the 15-day binned data; (2) the Swift-UVOT light curve in the uvm2 band (mJy); (3) the GASP-WEBT R-band flux density light curve (mJy) with a cubic spline interpolation through the 15-day binned data; (4) the near-infrared K band flux density light curve (mJy); (5) the ratio between the spline fits to the X-ray and R band. The light curves in the uvm2, R, and K bands were corrected for the host galaxy contribution.
Galaxies 04 00061 g002
Figure 3. (Top): R-band flux density light curve with cubic spline interpolation through the 15-day binned data (red line). (Middle): polarisation percentage with cubic spline interpolation through the 15-day binned data (black line); different symbols and colours refer to different observatories: Calar Alto (green squares), Crimean (red diamonds), Lowell (cyan triangles), and Steward (blue circles). (Bottom): EVPA after correction for the ± 180 n ambiguity.
Galaxies 04 00061 g003
Figure 4. Histograms of electric vector polarisation angle (EVPA).
Galaxies 04 00061 g004
Figure 5. Two of the Mrk 421 spectra obtained at the Steward Observatory. They correspond to the maximum (red) and minimum (green) brightness states in the period 2007–2015, differing by a factor t∼5 in flux density.
Galaxies 04 00061 g005
Figure 6. Time evolution of the observed flux density (top) and degree of polarization (bottom) in two different wavelength ranges (blue and red).
Galaxies 04 00061 g006

