
AP Librae: The Extended Jet as the Source of VHE Emission?


Landessternwarte, Universität Heidelberg, D-69117 Heidelberg, Germany
*
Author to whom correspondence should be addressed.
Galaxies 2016, 4(4), 63; https://doi.org/10.3390/galaxies4040063
Submission received: 8 July 2016
/
Revised: 25 October 2016
/
Accepted: 9 November 2016
/
Published: 15 November 2016
(This article belongs to the Special Issue Blazars through Sharp Multi-wavelength Eyes)
Abstract
:The LBL AP Librae has been detected in the TeV gamma-ray range, which is unexpected for this kind of blazar. The broad-band SED cannot be explained by a one-zone model, and especially fails in the TeV domain. An extended jet has been detected on arcsec scales both in radio and X-ray frequencies. The spectral index of the X-ray band indicates an inverse Compton origin. Using an IC/CMB model, the TeV emission can be successfully modeled as originating in the extended jet. Several arguments in favor of this model, as well as observational tests, will be presented. The observations suggest that acceleration of particles to very high energies is still efficient at large distances from the core.
1. Introduction
BL Lac objects are a type of active galaxy, where the jet is closely aligned with the line-of-sight. They may be characterized by the peak position of their synchrotron component in the spectral energy distribution (SED). Low-energy peaked BL Lac objects (LBLs) exhibit the synchrotron maximum below Hz, while intermediate-energy peaked BL Lac objects peak between Hz and Hz, and high-energy peaked BL Lac objects contribute the most above Hz.
The blazar AP Librae, located at a redshift and at , , exhibits a monotonically increasing X-ray energy spectrum. This, in combination with the lack of optical emission lines, has led to its classification as an LBL. However, some observational features of this source do not fit into this category.
Since LBLs exhibit their synchrotron peak frequency below Hz and the X-rays stem from the inverse Compton (IC) process, the maximum electron Lorentz factor in the electron energy distribution does not significantly exceed ∼ for reasonable values of the magnetic field strength on the order of ∼0.1 G. Hence, one would not expect very high energy γ-ray (VHE, GeV) emission from these objects. Surprisingly, AP Librae has been clearly detected by observations with the H.E.S.S. telescope array [1], and the SED extends to energies of a few TeV. Currently, AP Librae is the only LBL listed in the TeVCat (http://tevcat.uchicago.edu/), a catalog that gathers all sources detected above 100 GeV. Despite selection biases, this makes AP Librae an exceptional source.
High resolution X-ray observations led to the detection of extended X-ray jets in many AGN. However, due to the small viewing angle, it is surprising to observe extended X-ray emission in blazars. An extended X-ray jet has been detected in AP Librae by [2], which has thus become one of only six BL Lac objects listed in the X-JET database (http://hea-www.cfa.harvard.edu/XJET/). Of these six objects, three exhibit a synchrotron dominated X-ray spectrum, while the other three, including AP Librae, are IC dominated. The X-ray morphology of AP Librae’s jet follows exactly the radio morphology as observed with the VLA. The detection of the extended X-ray jet further demonstrates AP Librae’s peculiar state.
The detection in VHE implies an extremely broad high energetic component spanning 10 orders of magnitude of energy in the SED. Since the synchrotron emission cuts off below the X-ray band, the electron distribution covers a narrow range of energies and cannot explain the broad IC component in the usual one-zone blazar model.
The failure of the leptonic one-zone model provoked [3] to propose a leptonic multi-zone model, where the moving blob is immersed in the surrounding pc-scale jet structure producing inverse Compton emission on the jet’s synchrotron radiation. Hadronic modeling by [4] also gives a successful fit of the data.
In this proceeding, we summarize our recent results [5] that the extended jet dominates the total SED in the VHE γ-ray regime. Our model explains the VHE emission as originating mostly from the extended jet due to leptonic inverse Compton scattering of the CMB.
2. Important Observations
We describe only the important observations, which are necessary for our jet model. The remaining multiwavelength data is taken from the following papers or publicly available data bases: Radio [6,7], and IR/optical/UV [2,3].
2.1. Radio
2.1.1. VLA
VLA observations [8] at GHz led to the detection of the extended jet on arcsec-scales emerging in a south-westerly direction. Beyond ∼12 arcsec, the jet bends to the north-west for another ∼10–20 arcsec.
2.1.2. MOJAVE
The MOJAVE program [9] utilizes VLBI radio observations at 15 GHz to monitor blazars on milli-arcsec scales over long time periods. AP Librae was observed in this program over the course of ∼15 years. The data set reveals a steady core component (“component 0”), which is weakly variable (flux within a factor of 2). Its flux is marked with the open diamond in Figure 1.
Furthermore, a continuous jet is measured on scales of ∼10 milli-arcsec, which emerges in a southerly direction. Beyond this scale, only knots in a south-westerly direction are detected. This is the same position angle as exhibited by the VLA jet on arcsec scales. The total flux obtained from the MOJAVE data fits with the non-VLBI radio spectrum data (cf. Figure 1) indicating that these data points are influenced by the extended component.
The movement of the fastest knots led to the determination of a maximum apparent speed of the jet of .
2.2. X-rays
Chandra data revealed the extended jet on arcsec scales [2]. The photon index of the jet is ; thus a hard spectrum indicating an IC dominance.
The Chandra spectrum of the core is also hard with .
A 100-month average of observations with the Swift-BAT instrument [10] reveals a flux level of the hard X-rays that is in straight extrapolation of the Chandra core spectrum. Thus, the core X-ray spectrum can be described by a single power-law over more than two orders of magnitude in energy.
2.3. γ-rays
Due to a lack of spatial resolution of the γ-ray instruments, the jet cannot be resolved. Data from Fermi and H.E.S.S. are taken from [1]. The average γ-ray SED can be described by a flat level below a few GeV, followed by a decreasing power-law up to a few TeV. An approximately day-long high state observed with LAT is discussed in [1]. For energies larger than GeV, only upper limits are given in the flare spectrum.
3. The Jet Model
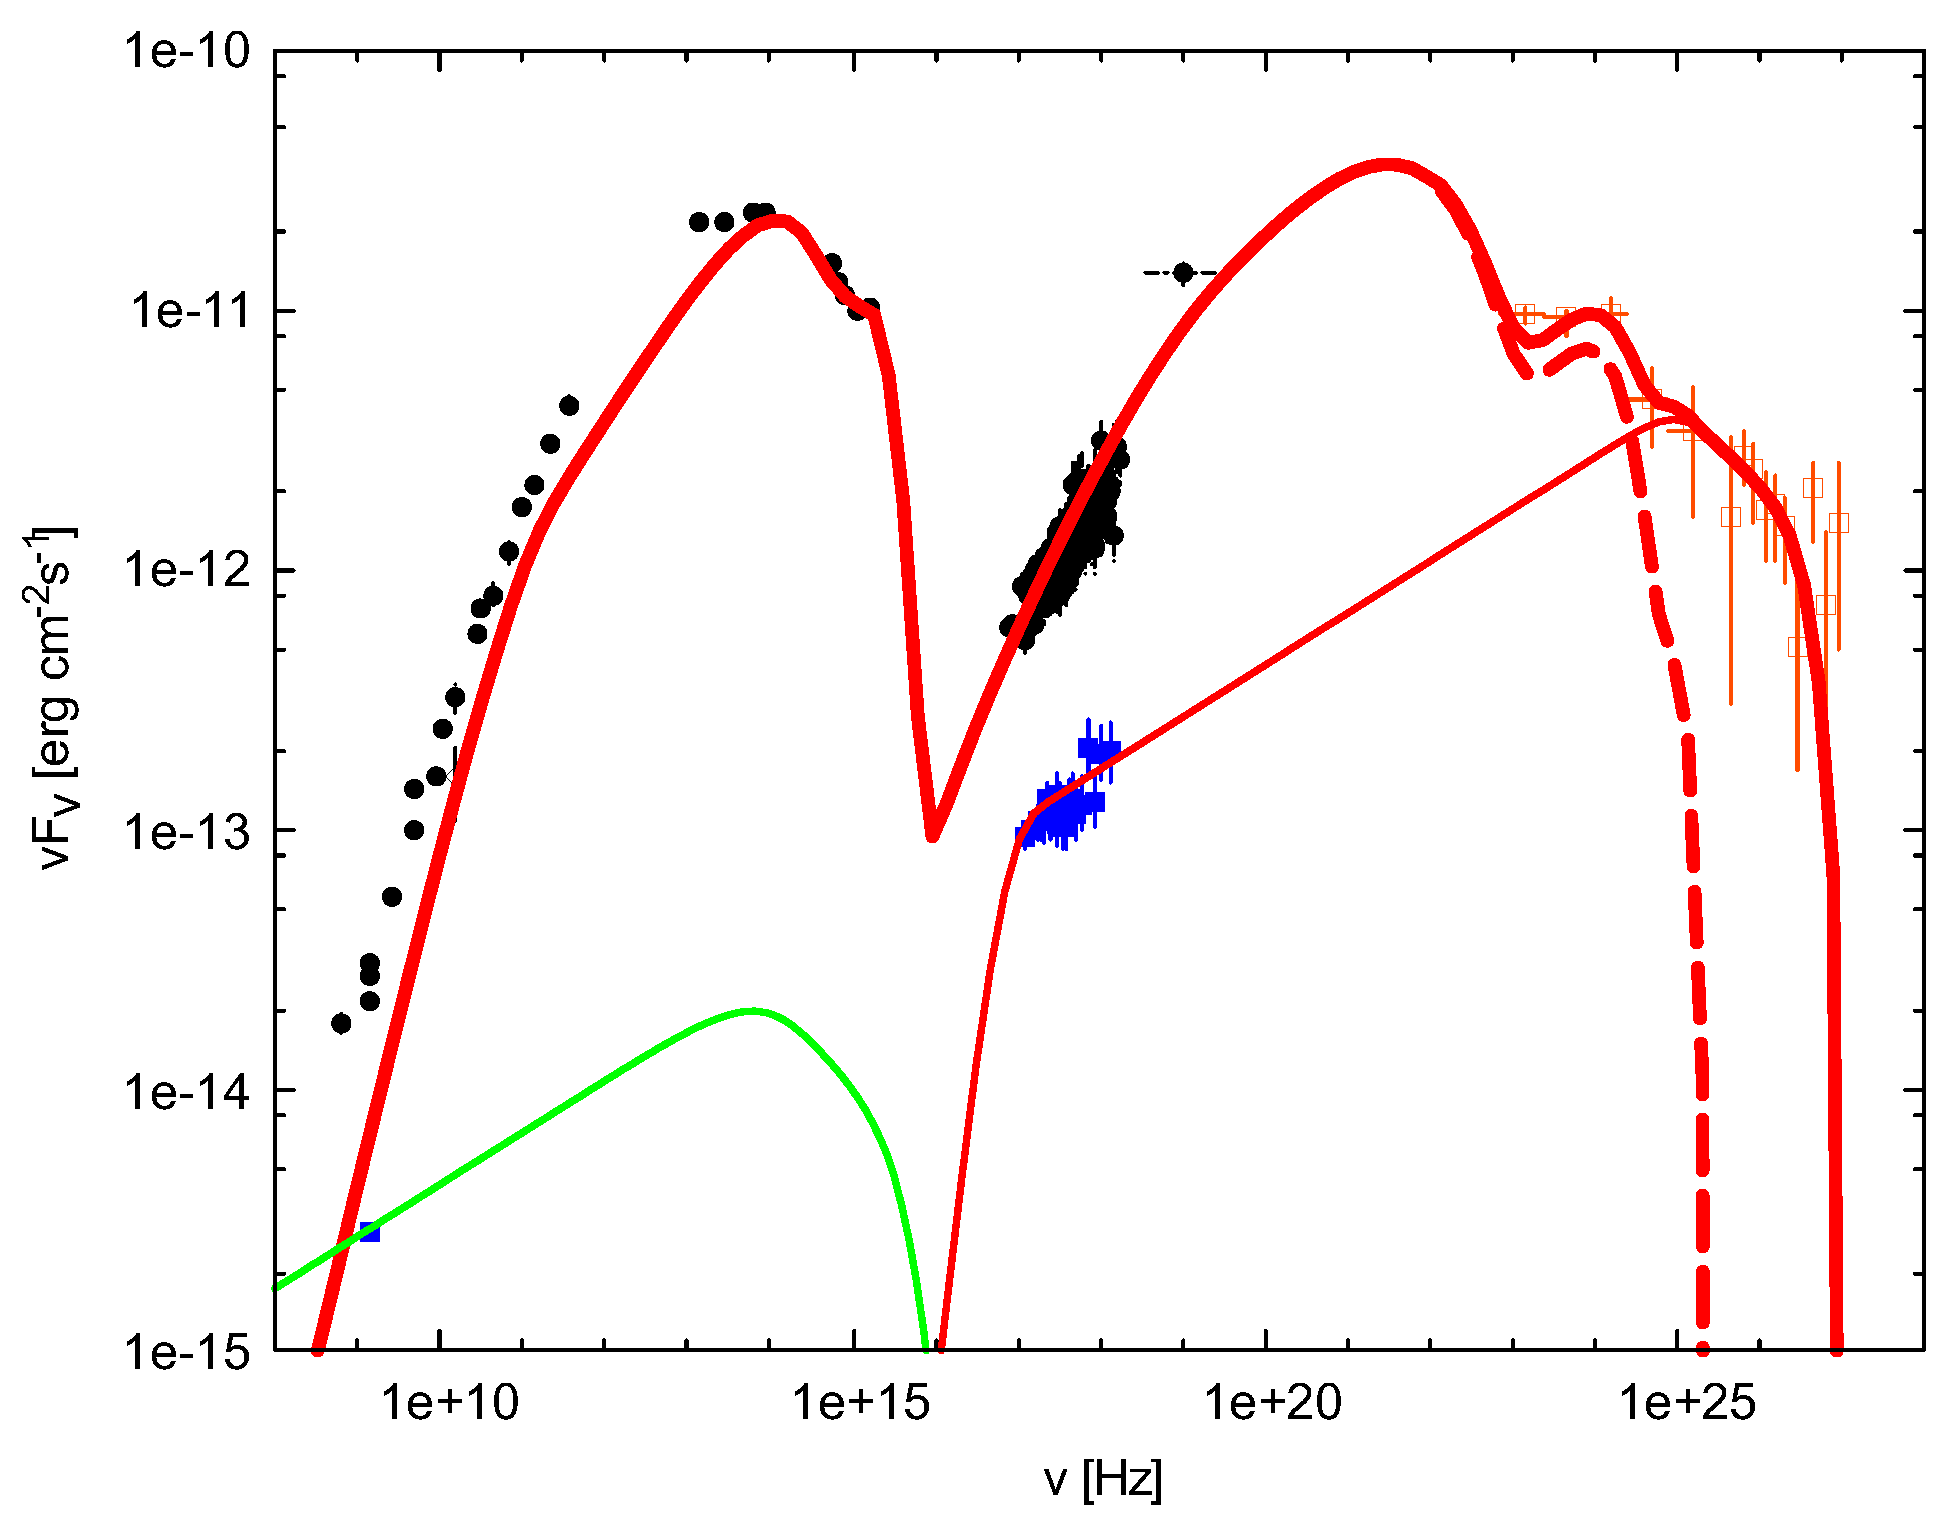
The data, together with the modeling, is presented in Figure 1. The respective parameter sets are given in Table 1.
Blazars are commonly described by a one-zone model, which in most cases gives successful fits to the SED. This model fails for AP Librae. The most important constraint comes from the hard X-ray spectrum. Attributing the X-ray core data to synchrotron-self Compton (SSC) emission requires a high minimum electron Lorentz factor of ∼100, because the SSC spectrum is a pure power-law only below the photon energy associated with the minimum electron energy. Above this energy, the SSC spectrum is significantly curved due to the convolution of the broken electron distribution with the synchrotron spectrum and the complicated IC cross section. Thus, the Chandra and the Swift-BAT spectrum cannot be fitted if the minimum Lorentz factor is set below 100. Another constraint is given by the fact that the Swift-BAT energy flux is slightly above the energy flux level of the γ-ray energy flux below a few GeV. Hence, the maximum of the IC component must be located between 100 keV and 100 MeV, resulting in a maximum electron Lorentz factor below ∼ in order to fit the Fermi energy flux (We note that a successful fit of the X-ray spectrum is also possible with a hard electron distribution with spectral index . However, the issue of the narrow electron distribution is not circumvented).
In turn, the electron distribution function, which explains the X-ray core data, is very narrow, and cannot account for the VHE γ-ray emission. The resulting model is presented with a thick dashed line in Figure 1. The fit is good for most of the synchrotron component and fits the “component 0” flux point of the MOJAVE observations. The rest of the radio emission includes contributions from the milli-arcsecond jet. The model describing this data is not shown here for clarity, and can be found in [5]. The flattening of the Swift-UVOT spectrum at higher UV energies suggests the addition of another component, which is usually attributed to the accretion disk. The accretion disk can illuminate the gas in close proximity of the black hole, which is interpreted here as a low-luminosity torus. These two photon fields can serve as target photons for IC scattering by the blob electrons. The resulting flux contributes in the γ-ray range, and can explain the flat flux level below a few GeV. However, due to the low maximum electron Lorentz factor, these emission processes, as well as second order SSC emission, cannot explain the VHE emission, either.
In order to explain the VHE γ-ray spectrum, we consider the extended jet. It is modeled as the combination of a number of self-similar zones. The combined emission of all zones gives the total flux of the jet.
The model of the kpc-scale jet is constrained by the VLA and Chandra data. Since the flux in both radio and X-rays drops beyond the bend [2], we only consider the part closer than ∼12 arcsec from the core corresponding to a projected length of ∼10 kpc. The synchrotron and IC/CMB emission of the kpc-scale jet gives a good fit in the radio and the Chandra energy range. Interestingly, the extrapolation of the Chandra jet spectrum intersects the Fermi data roughly at the break at a few GeV. This led us to the hypothesis that the VHE emission could originate in the kpc-scale jet. In fact, by choosing a maximum electron Lorentz factor of ∼ in the kpc-jet, we successfully reproduce the VHE spectrum.
4. Discussion and Conclusions
As was shown in the previous section, the extended jet plays an important role in the radiative output of AP Librae. It is responsible for a significant part of the SED.
Most importantly, the jet could be responsible for the VHE emission detected with the H.E.S.S. telescopes. This is an unusual interpretation, since it implies highly relativistic flows and continuous reacceleration of the jet material on very large scales, given that AP Librae’s jet is modeled with a deprojected length of 140 kpc. On milli-arcsec scales, the counter-jet has not been detected. Under the assumption that both jets are intrinsically identical, the counter-jet must be strongly de-beamed. Since far away from the black hole on ≫ arcsec-scales, there is no sign of the counter-jet, either; we can further conclude that even at large distances the jet must exhibit relativistic speeds without significant deceleration.
Since the electrons emitting in the X-ray band are less energetic than the radio emitting electrons, the power in relativistic particles is high and in some cases exceeds the Eddington luminosity even without accounting for cold protons. Our modeling suggests that in AP Librae, the Eddingtion luminosity constraint holds for the large-scale jet, even with the dominating contribution of cold protons.
Below, we present a few suggestions for how to test this theory.
The IC/CMB model has a small number of free parameters and can be very well constrained by radio, optical and X-ray observations. Observations at HE γ-ray energies have been used to rule out the IC/CMB model in a number of extended X-ray jets [11,12]. The resulting IC spectrum overpredicts the upper limits derived from Fermi observations, invalidating the model in the sources analyzed by [11,12]. In AP Librae, the X-ray and VHE spectrum is fit nicely by the IC/CMB model. The synchrotron component of the jet is constrained by the radio and X-ray data. Due to the required highly relativistic electrons, the jet should emit synchrotron emission up to the UV band. Since the contribution of the galaxy in the UV band is much reduced compared to the optical and IR bands, the jet should be detectable despite its proximity to the bright core. If the jet is not detected in the UV with an upper limit below the predicted flux of our model curve, the IC/CMB is ruled out as the origin of the VHE emission, because the required electron energies cannot be matched.
Within the kpc-scale jet, the relative flux decrease along the jet is expected to differ between the synchrotron and IC domains due to different beaming dependencies [13]. More sensitive mapping at radio and X-ray frequencies could test this prediction.
The HE and VHE emission can be used to indirectly test the extended jet model. Unlike the models of [3,4], we do not expect variability in the extended jet emission, because such a large object must be steady over time scales much longer than a few times . Thus, the flux above a few GeV should not drop below the observed level. An increase in the flux at these energies during a flare might still originate from an additional flaring component and would not rule out the extended jet model. However, this component should also change the spectrum in the UV and potentially in the X-ray band. The high state observed by Fermi can be accounted for by the core-part of our model, since the observed flare spectrum only extends up to GeV, where the γ-ray emission is strongly influenced by the core emission (Since no other multiwavelength data is reported for the time of the γ-ray flare, we have not attempted to model the flare data. The lack of constraints on the free parameters would result in an inconclusive model).
Hence, more observations in all energy bands are strongly encouraged. If confirmed, the emission of TeV radiation by an extended, more than 100 kpc long jet, would be a major result with strong implications for the transport and acceleration processes on large spatial scales.
Acknowledgments
The authors wish to thank Markus Böttcher for the numerical code, which is described in detail in [14]. Support by the German Ministry for Education and Research (BMBF) through Verbundforschung Astroteilchenphysik grant 05A14VH3 is gratefully acknowledged. This research has made use of data from the MOJAVE database that is maintained by the MOJAVE team [9]. This paper is based on observations obtained with Planck (http://www.esa.int/Planck), an ESA science mission with instruments and contributions directly funded by ESA Member States, NASA, and Canada.
Author Contributions
Modeling (M.Z.), data analysis (M.Z., S.J.W.), paper writing (M.Z., S.J.W.).
Conflicts of Interest
The authors declare no conflict of interest.
References
- H.E.S.S. Collaboration; Abramowski, A.; Aharonian, F.; Ait Benkhali, F.; Akhperjanian, A.G.; Angüner, E.; Anton, G.; Backes, M.; Balenderan, S.; Balzer, A.; et al. The high-energy γ-ray emission of AP Librae. Astron. Astrophys. 2015, 573, A31. [Google Scholar]
- Kaufmann, S.; Wagner, S.J.; Tibolla, O. Discovery of an extended X-ray jet in AP Librae. Astrophys. J. 2013, 776, 68. [Google Scholar] [CrossRef]
- Hervet, O.; Boisson, C.; Sol, H. Linking radio and gamma-ray emission in Ap Librae. Astron. Astrophys. 2015, 578, A69. [Google Scholar] [CrossRef]
- Petropoulou, M.; Vasilopoulos, G.; Giannios, D. The TeV emission of Ap Librae: A hadronic interpretation and prospects for CTA. arXiv 2016. [Google Scholar]
- Zacharias, M.; Wagner, S.J. The extended jet of AP Librae: Origin of the very high-energy γ-ray emission? Astron. Astrophys. 2016, 588, A110. [Google Scholar] [CrossRef]
- Kühr, H.; Witzel, A.; Pauliny-Toth, I.I.K.; Nauber, U. A catalog of extragalactic radio sources having flux densities greater than 1 Jy at 5 GHz. Astron. Astrophys. Supp. 1981, 45, 367–430. [Google Scholar]
- Planck Legacy Archive (PR1). Available online: http://www.cosmos.esa.int/web/planck/pla (accessed on 14 October 2014).
- Cassaro, P.; Stanghellini, C.; Bondi, M.; Dallacasa, D.; della Ceca, R.; Zappalà, R.A. Extended radio emission in BL Lac objects, I. The images. Astron. Astrophys. Suppl. 1999, 139, 601–616. [Google Scholar] [CrossRef]
- Lister, M.L.; Cohen, M.H.; Homan, D.C.; Kadler, M.; Kellermann, K.I.; Kovalev, Y.Y.; Ros, E.; Savolainen, T.; Zensus, J.A. MOJAVE: Monitoring of jets in active galactic nuclei with VLBA experiments. VI. Kinematics analysis of a complete sample of blazar jets. Astrophys. J. 2009, 138, 1874. [Google Scholar] [CrossRef]
- Palermo Swift-BAT Catalog. Available online: http://bat.ifc.inaf.it (accessed on 15 October 2014).
- Meyer, E.T.; Georganopoulos, M. Fermi rules out the inverse Compton/CMB model for the large-scale jet X-ray emission of 3C 273. Astrophys. J. Lett. 2014, 780, L27. [Google Scholar] [CrossRef]
- Meyer, E.T.; Georganopoulos, M.; Sparks, W.B.; Godfrey, L.; Lovell, J.E.J.; Perlman, E. Ruling out IC/CMB X-rays in PKS 0637-752 and the implications for the TeV emission from large-scale quasar jets. Astrophys. J. 2015, 805, 154. [Google Scholar] [CrossRef]
- Dermer, C.D. On the beaming statistics of gamma-ray sources. Astrophys. J. 1995, 446, L63. [Google Scholar] [CrossRef]
- Böttcher, M.; Reimer, A.; Sweeney, K.; Prakash, A. Leptonic and hadronic modeling of Fermi-detected blazars. Astrophys. J. 2013, 768, 54. [Google Scholar] [CrossRef]
Figure 1.
SED of AP Librae with the modeling of the blob and the kpc-scale jet. The data points are for the core (black dots), the kpc-scale jet (blue squares), the steady component of the MOJAVE observation (open diamond), and the γ-ray data (red squares) where the jet cannot be resolved. The line styles refer to the blob (thick dashed red), and the kpc-scale jet (thin solid lines). The line colors imply synchrotron (green), and IC/CMB (red) emission. The thick red line is the sum of the blob and the jet.


Table 1.
Parameters for the fit. is the electron density; , and are the minimum, break and maximum electron Lorentz factor, respectively; is the electron spectral index below the break; is the magnetic field strength; is the bulk Lorentz factor; R is the radius of the components; is the observation angle; and are the luminosity of the disk and the dusty torus, respectively; is the projected jet length.
| Blob | kpc-Scale Jet | |
|---|---|---|
| (cm) | ||
| (G) | ||
| 10 | 10 | |
| R (cm) | ||
| (deg) | ||
| (erg/s) | - | |
| (erg/s) | - | |
| (pc) | - |
© 2016 by the authors; licensee MDPI, Basel, Switzerland. This article is an open access article distributed under the terms and conditions of the Creative Commons Attribution (CC-BY) license (http://creativecommons.org/licenses/by/4.0/).
Share and Cite
MDPI and ACS Style
Zacharias, M.; Wagner, S.J. AP Librae: The Extended Jet as the Source of VHE Emission? Galaxies 2016, 4, 63. https://doi.org/10.3390/galaxies4040063
AMA Style
Zacharias M, Wagner SJ. AP Librae: The Extended Jet as the Source of VHE Emission? Galaxies. 2016; 4(4):63. https://doi.org/10.3390/galaxies4040063
Chicago/Turabian StyleZacharias, Michael, and Stefan J. Wagner. 2016. "AP Librae: The Extended Jet as the Source of VHE Emission?" Galaxies 4, no. 4: 63. https://doi.org/10.3390/galaxies4040063
Note that from the first issue of 2016, this journal uses article numbers instead of page numbers. See further details here.