Next Article in Journal / Special Issue
Direct Imaging of a Toroidal Magnetic Field in the Inner Jet of NRAO 150
Previous Article in Journal / Special Issue
JVLA Wideband Polarimetry Observations on a Sample of High Rotation Measure Sources
 
 
galaxies-logo
Article Menu
Article

Multiwavelength Picture of the Blazar S5 0716+714 during Its Brightest Outburst

by
Marina Manganaro
1,*,
Giovanna Pedaletti
2,
Marlene Doert
3,
Denis Bastieri
4,
Vandad Fallah Ramazani
5,
Dario Gasparrini
6,
Elina Lindfors
5,
Benoit Lott
7,
Mireia Nievas
8,
Bindu Rani
9,
David J. Thompson
9,
Emmanouil Angelakis
10,
George Borman
11,
Mark Gurwell
12,
Talvikki Hovatta
13,
Ryosuke Itoh
14,
Svetlana Jorstad
15,
Alex Kraus
10,
Thomas P. Krichbaum
10,
Paul Kuin
16,
Anne Lähteenmäki
13,17,
Valeri Larionov
18,
Amy Yarleen Lien
9,
Ioannis Myserlis
10,
Merja Tornikoski
13,
Ivan Troitsky
18,
J. Anton Zensus
10 and
The MAGIC and -LAT Collaborations
1
add Show full author list remove Hide full author list
1
Inst. de Astrofísica de Canarias, E-38200 La Laguna, and Universidad de La Laguna, Dpto. Astrofísica, E-38206 La Laguna, Tenerife, Spain
2
Deutsches Elektronen-Synchrotron (DESY), D-15738 Zeuthen, Germany
3
Department of Physics, Technical University of Dortmund, Dortmund D-44221, Germany
4
INFN Padova, I-35131 Padova, Italy
5
Department of Physics and Astronomy, University of Turku, 20500 Turku, Finland
6
ASI Science Data Center and INFN, 06123 Perugia, Italy
7
CEN Bordeaux-Gradignan, 33170 Gradignan, France
8
Department of Atomic Molecular and Nuclear Physics, Universidad Complutense, E-28040 Madrid, Spain
9
NASA’s Goddard Space Flight Center, Greenbelt, MD 20771, USA
10
Max Planck Institut für Radioastronomie (MPIfR), 53121 Bonn, Germany
11
Crimean Astrophysics Observatory, 98409 Nauchny, Crimea, Russia
12
Harvard-Smithsonian CfA, Cambridge, MA 02138, USA
13
Metsähovi Radio Observatory, Aalto University, FI-02540 Kylmälä, Finland
14
Department of Physical Science, Hiroshima University, Higashi-hiroshima 739-8526, Japan
15
Institute for Astrophysical Research, Boston University, Boston, MA 02215, USA
16
Mullard Space Science Lab., University College London, RH5 6NT Dorking, UK
17
Department of Radio Science and Engineering, Aalto University, FI-00076 Aalto, Finland
18
Astronomical Institute, St.-Petersburg State University, St.-Petersburg 198504, Russia
*
Author to whom correspondence should be addressed.
Galaxies 2016, 4(4), 69; https://doi.org/10.3390/galaxies4040069
Submission received: 15 July 2016 / Revised: 11 November 2016 / Accepted: 17 November 2016 / Published: 24 November 2016
(This article belongs to the Special Issue Blazars through Sharp Multi-wavelength Eyes)

Abstract

:
S5 0716+714 is a well known BL Lac object, and one of the brightest and most active blazars. The discovery in the Very High Energy band (VHE, E > 100 GeV) by MAGIC happened in 2008. In January 2015, the source went through the brightest optical state ever observed, triggering MAGIC follow-up and a VHE detection with ∼ 13 σ significance (ATel 6999 ). Rich multiwavelength coverage of the flare allowed us to construct the broad-band spectral energy distribution of S5 0716+714 during its brightest outburst. In this work, we will present the preliminary analysis of MAGIC and Fermi-LAT data of the flaring activity in January and February 2015 for the HE (0.1 < HE < 300 GeV) and VHE band, together with radio (Metsähovi, OVRO, VLBA, Effelsberg), sub-millimeter (SMA), optical (Tuorla, Perkins, Steward, AZT-8+ST7, LX-200, Kanata), X-ray and UV (Swift-XRT and UVOT), in the same time-window and discuss the time variability of the multiwavelength light curves during this impressive outburst.

1. Introduction

The BL Lac object S5 0716+714 is among the brightest and most active blazars [1]. Because of the featureless optical continuum, it is hard to estimate its redshift. A value of z = 0.31 ± 0.08 is derived from the photometric detection of the host galaxy [2]. It was detected in VHE for the first time by MAGIC in 2008 [3]. Because of its extreme variability, S5 0716+714 has been the subject of several optical monitoring campaigns (e.g., [1,4,5,6,7] and references therein). S5 0716+714 is also among the bright blazars in the Fermi-LAT (Large Area Telescope) Bright AGN Sample (LBAS) [8], whose GeV spectra are governed by a broken power law. The combined GeV–TeV spectrum of the source displays absorption-like features in 10–100 GeV energy range [9]. The blazar S5 0716+714 was observed in an unprecedented outburst phase during January 2015. The source was detected at its historic high brightness at optical and IR bands. In January 2015, MAGIC, triggered by the high optical state and by high energy photons detected by Fermi-LAT, detected the source with a significance of 13 σ [10].

2. Instruments Involved

MAGIC is a stereoscopic system consisting of two 17 m diameter Imaging Atmospheric Cherenkov Telescopes located at the Observatorio del Roque de los Muchachos, on the Canary Island of La Palma (Spain). The current integral sensitivity for the zenith range 35 < z d < 50 above 100 GeV is 1.76 % ± 0.03 % of the Crab Nebula’s flux in 50 h. The Field of View (FoV) of MAGIC is 3.5 [11]. The Large Area Telescope (LAT) on board of Fermi is an imaging high-energy γ-ray telescope in the energy range from about 20 MeV to more than 300 GeV [12]. The LAT’s Field of View covers about 20% of the sky at any time, and it scans continuously, covering the whole sky every three hours. Multiwavelength observations were performed collecting data from a large number of instruments. Our dataset includes data from Swift-XRT [13] in the X-ray and Swift-UVOT [14] in optical-UV; for the optical band we show data from the Tuorla Blazar monitoring program (http://users.utu.fi/kani/1m), the 1.8 m Perkins telescope (https://lowell.edu/research/research-facilities/1-8-meter-perkins/), the Steward Observatory (http://www.bu.edu/blazars/), the 70-cm AZT-8 reflector of the Crimean Astrophysical Observatory (http://craocrimea.ru/ru), the 40-cm LX-200 telescope in St. Petersburg, Russia, [15] and Kanata telescope at the Hiroshima Observatory (http://hasc.hiroshima-u.ac.jp/telescope/kanatatel-e.html); radio band was covered by Metsähovi [16], the Owens Valley Radio Observatory (OVRO) 40 m telescope [17] and the Effelsberg 100 m radio telescope (http://www.mpifr-bonn.mpg.de/en/effelsberg). Radio data at 230 GHz band are obtained using the Submillimeter Array (http://sma1.sma.hawaii.edu/) (SMA).

3. Observations and Results
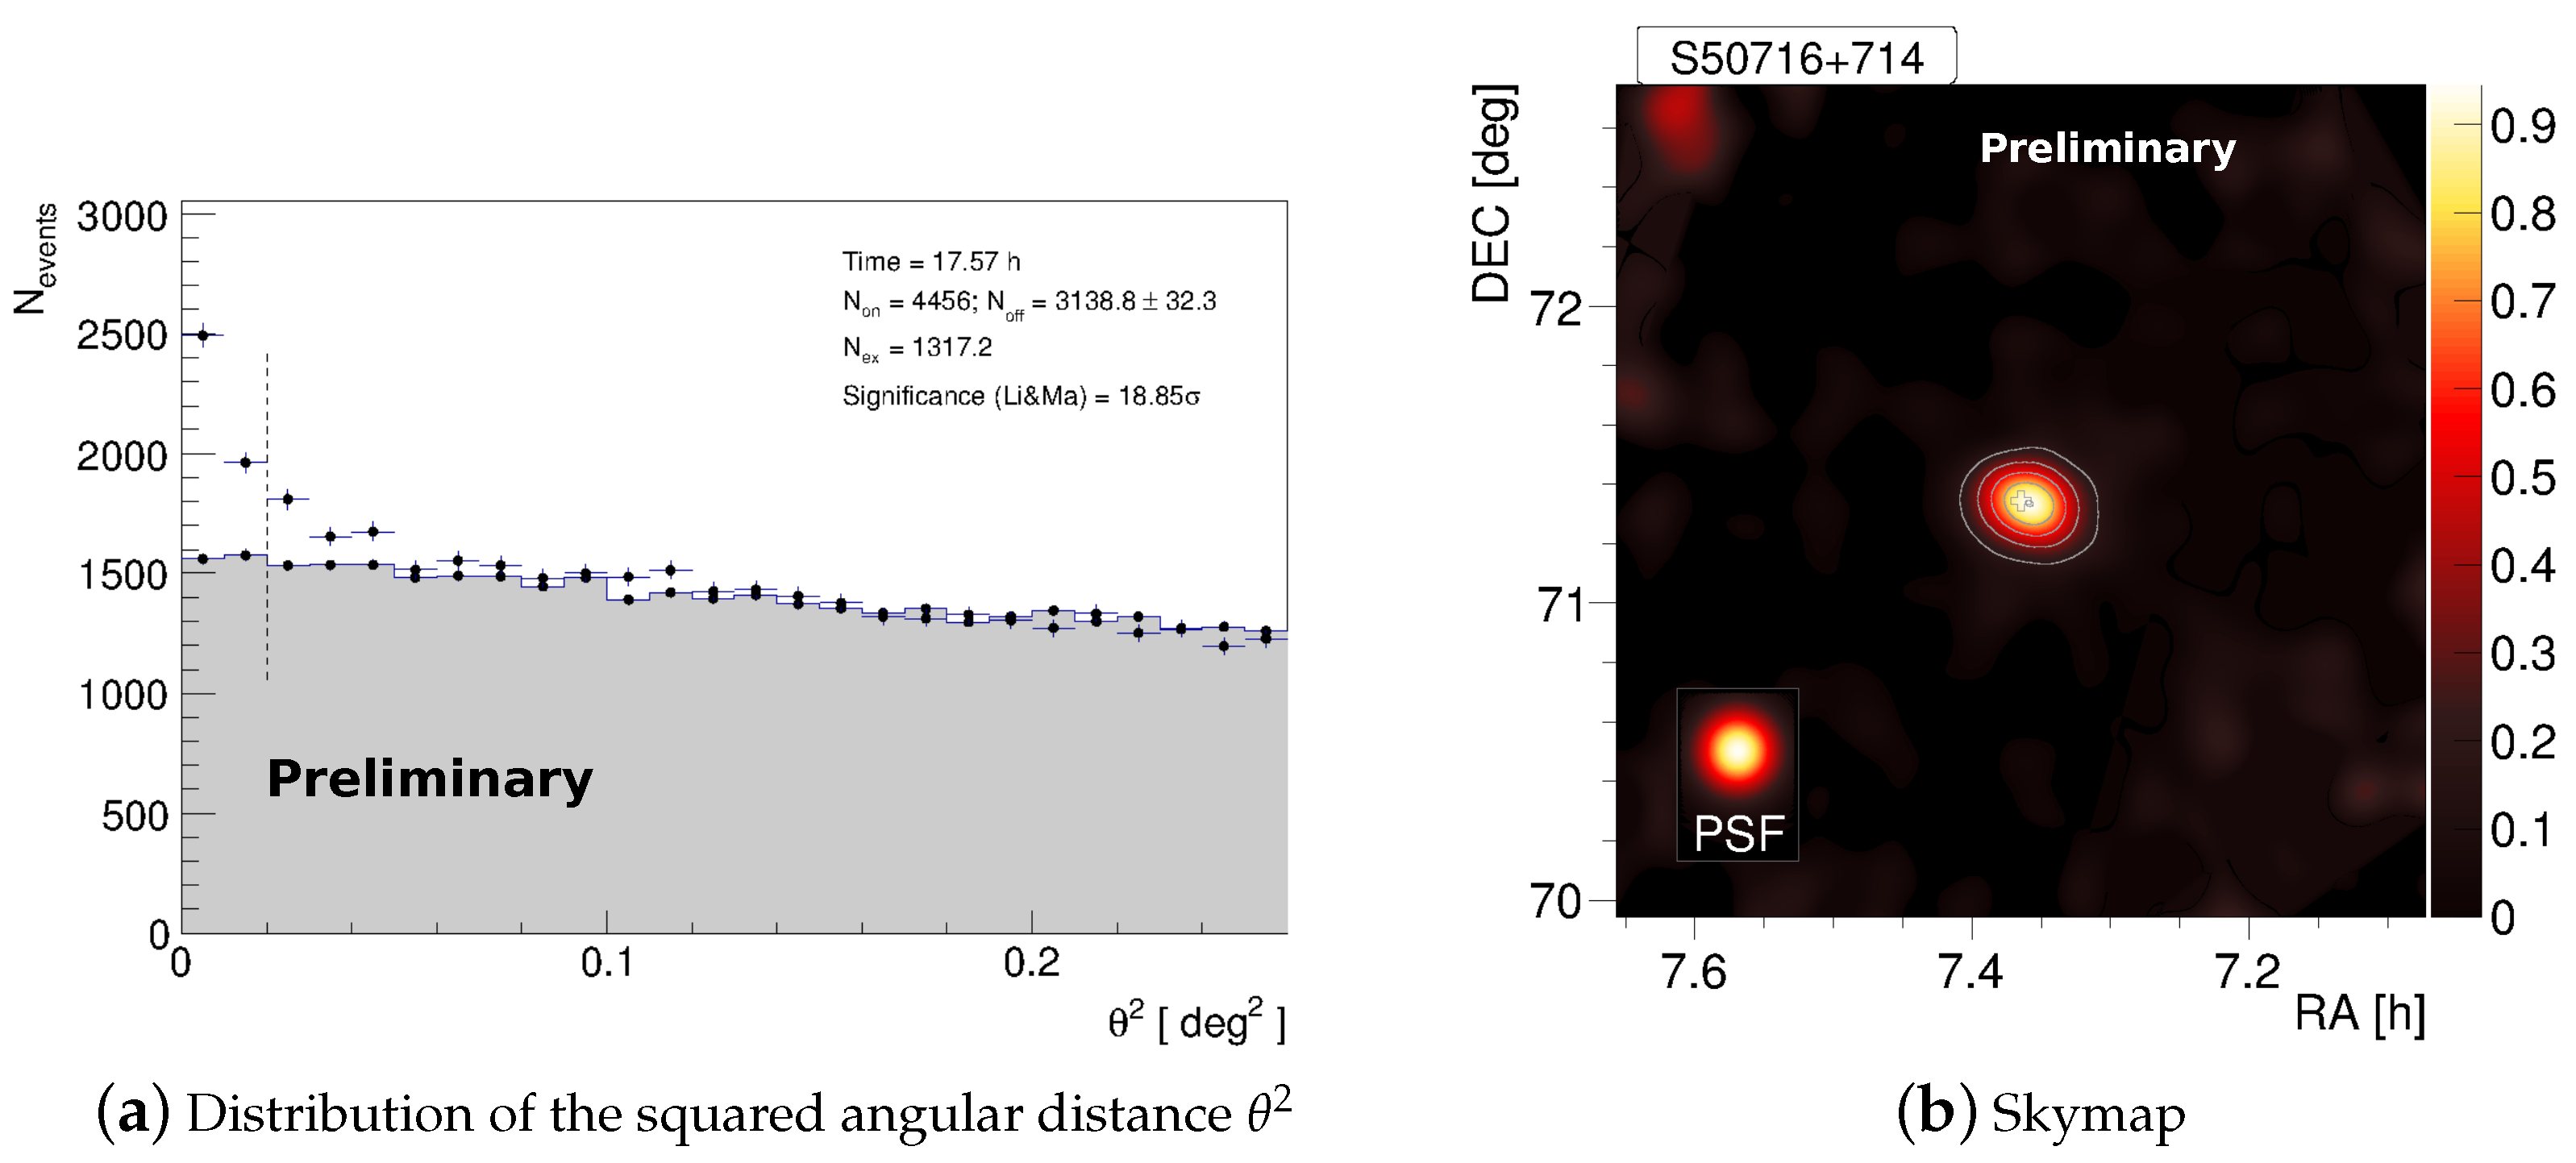
3.1. MAGIC Analysis

MAGIC started to observe S5 0716+714 on 19 January 2015. Unfortunately, the following two nights of strong wind during the S5 0716+714 visibility window prevented observation of the source, which was resumed on 23 January. From that day, the flux constantly increased up to the maximum flux ever observed in the VHE range for this source, on 27 January. The next activity of S5 0716+714 in the VHE was detected by MAGIC on the 13 February, and this time lasting three days only, up to the 16 February. In the present work, we will refer to January data (from MJD 57040 to MJD 57050) as phase A and to February data (from MJD 57066 to MJD 57069) as phase B. The observations were performed in wobble mode with a 0.4 deg offset and four symmetric positions with respect to the camera center. The observations were performed in 12 nights in January and February 2015 for a total duration of 17.57 h at the zenith range of 40 < z d < 50 ). The corresponding distribution of the squared angular distance θ 2 between the reconstructed source position and the nominal source position (points) or the background estimation position (shaded area) for the whole period of observation is shown in Figure 1a. The vertical dashed line shows the value of θ 2 up to which the number of excess events and significance are integrated. The cuts used are optimized for steep spectra and low energy thresholds. The analysis energy threshold is ∼65 GeV, measured as the peak of the energy distribution of a sample of Monte Carlo simulated events for a source with the spectral shape of S5 0716+714. The analysis of the data collected was performed within the standard MAGIC analysis framework MARS [11,18].

3.2. Fermi-LAT Analysis

The HE γ-ray (0.1–300 GeV) observations were obtained in a survey mode by the Fermi-LAT Large Area Telescope. The LAT data were analyzed using the standard ScienceTools (software version v10.01.01) and instrument response function CALDB. Photons in the source event class were selected for the analysis. We analyzed a region of interest of 10 in radius centred at the position of S5 0716+714 using a maximum-likelihood algorithm [19]. We included all the 54 sources of the 3FGL catalogue [20] within 10 in the unbinned likelihood analysis. Model parameters for sources within 5 degrees of the ROI are kept free, while we kept the model parameters for the rest fixed to their catalogue values.

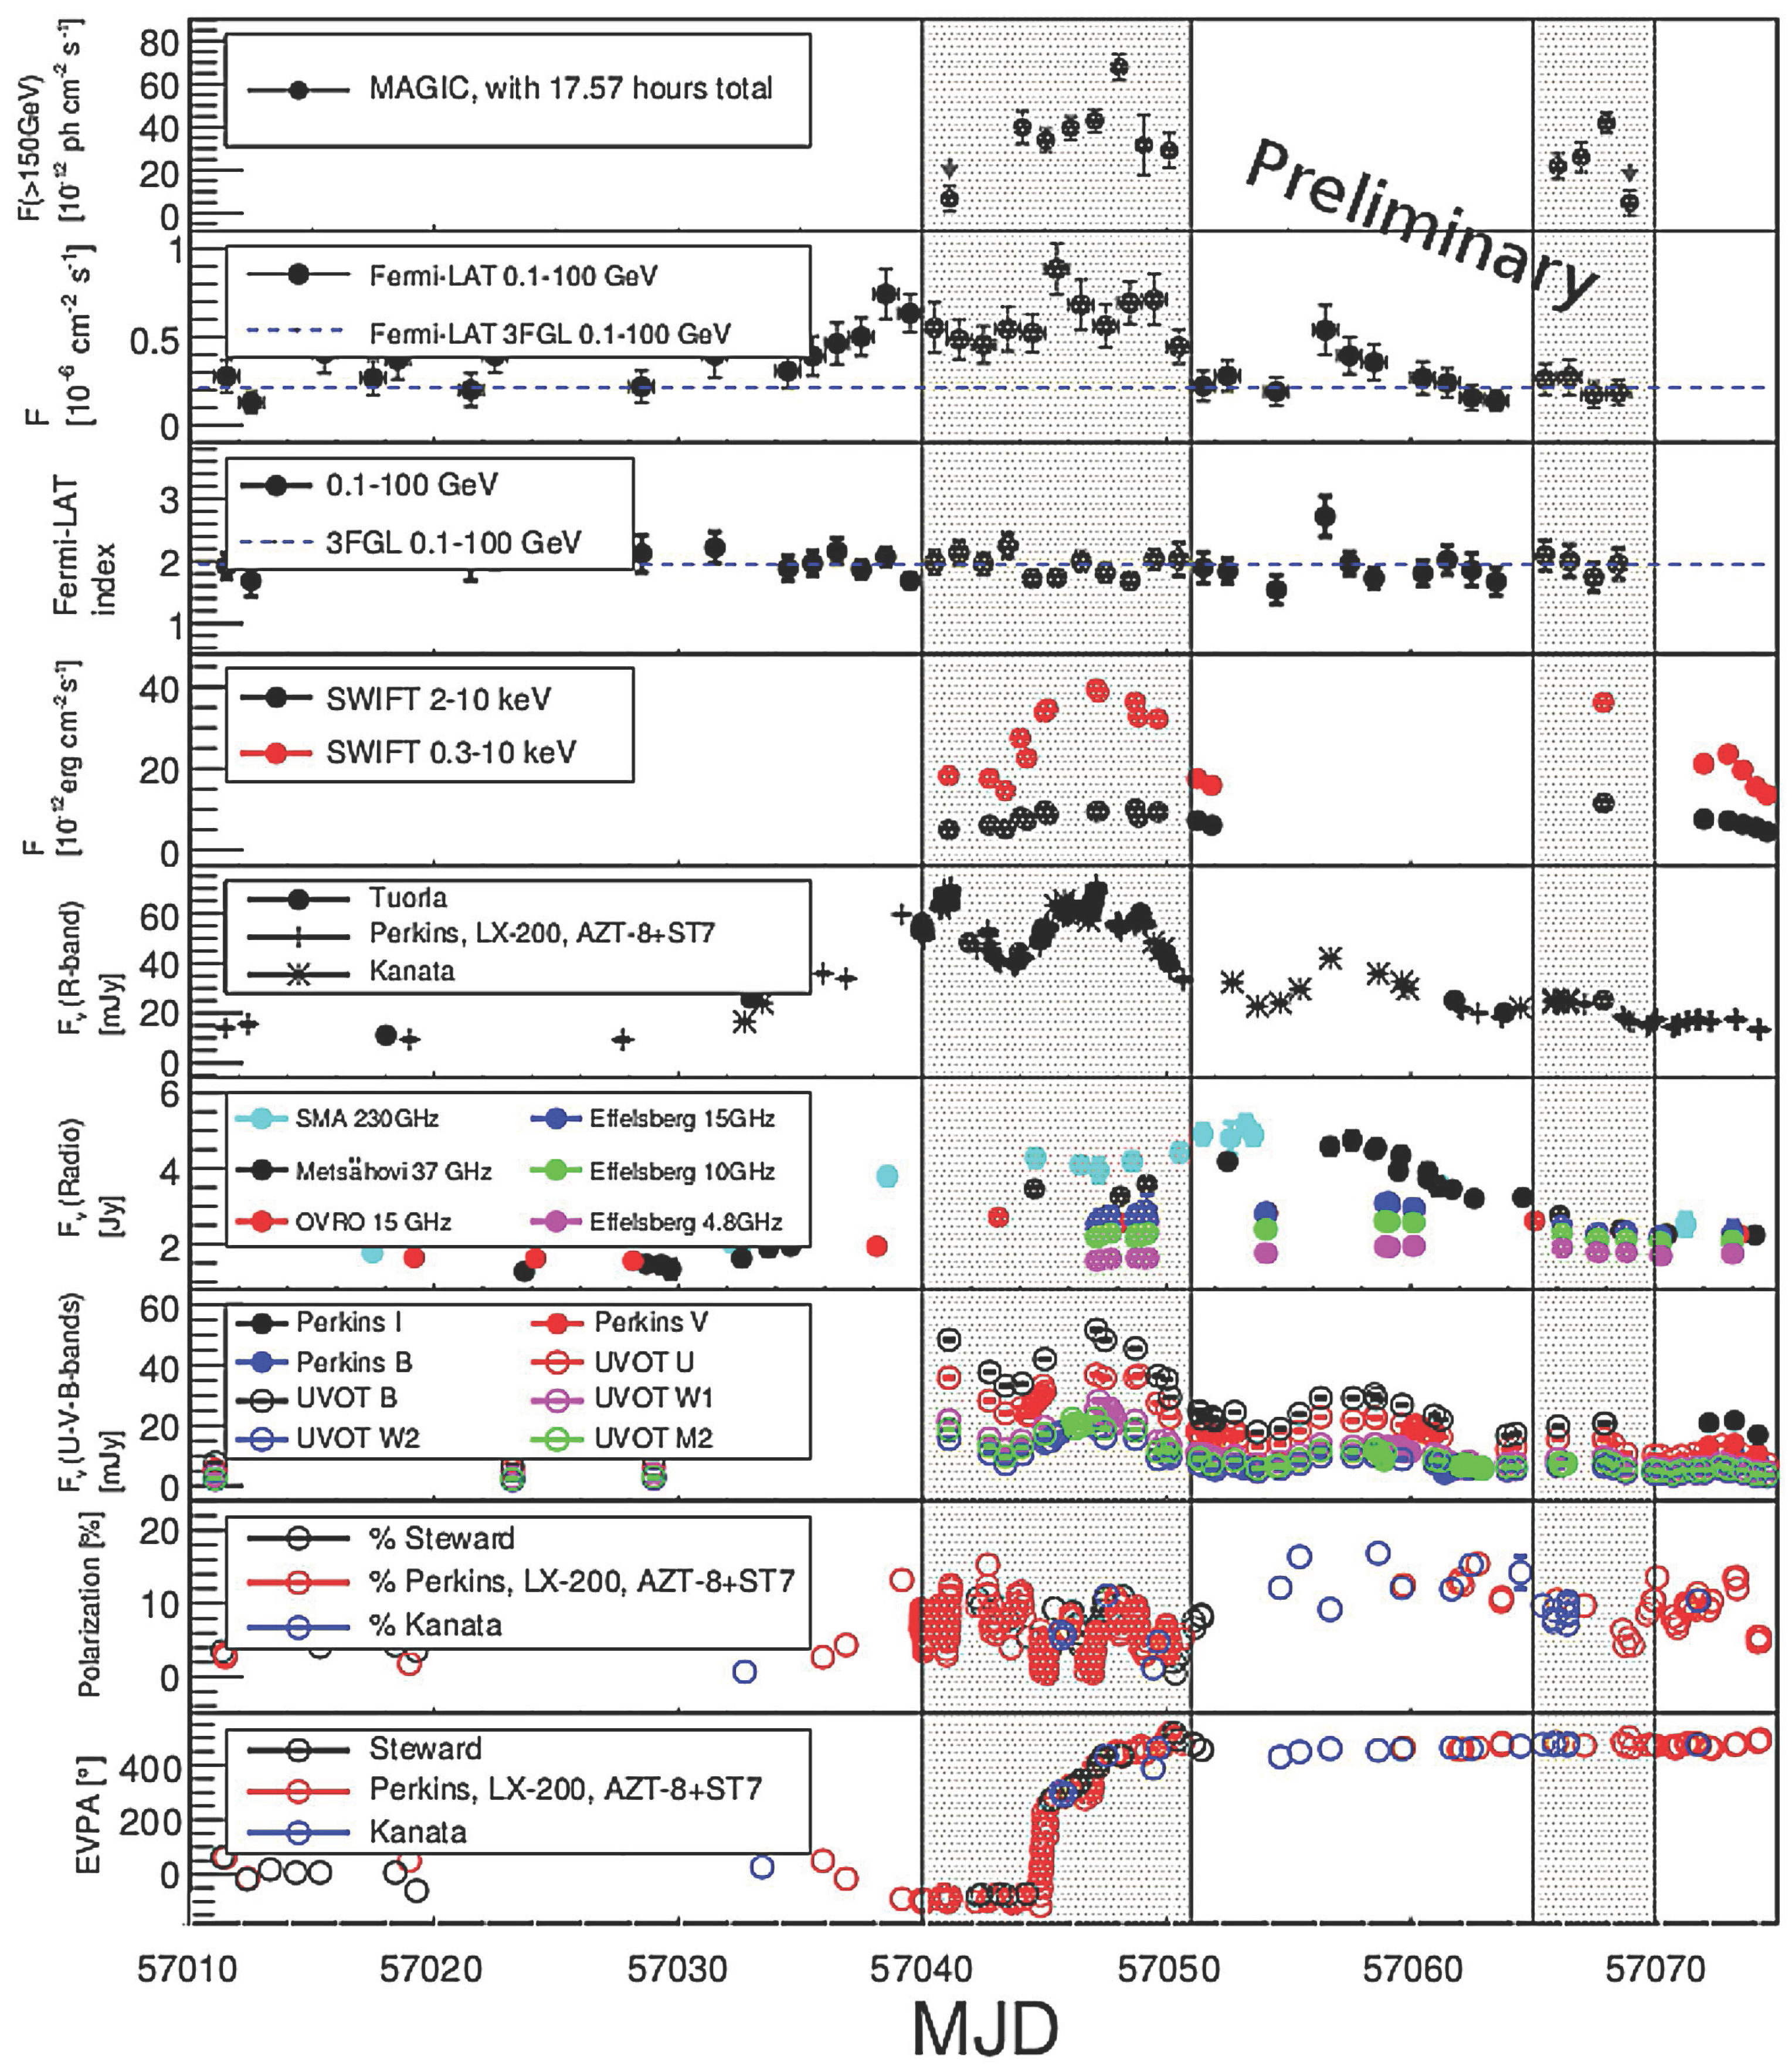
3.3. Multiwavelength Light Curves

The unprecedented outburst of S5 0716+714 was covered in all the wavelengths: such a rich collection of simultaneous data allows us to study with great precision the broadband spectral energy distribution of the source, deeply investigating its nature. Multiwavelength flux light curves of S5 0716+714 during the period from MJD 57010 to MJD 57075 are shown in Figure 2. The top panel shows the MAGIC light curves: in the VHE band, the no-variability hypothesis has been discarded because it resulted in a χ 2 / n d f = 67 / 7 for January and χ 2 / n d f = 22 / 3 for the February data for a constant fit. Intranight variability in VHE was not detected. The shadowed areas indicate Phase A (from MJD 57040 to MJD 57050) and Phase B (from MJD 57066 to MJD 57069), the two high states in VHE, and the corresponding activity in the other bands.
When MAGIC discovered S5 0716+714 in 2008 ([3]) the radio band was in a quiescent level, while here, even if delayed with respect to the optical peak, it is possible to discern a response in the radio frequency. The VHE integral flux measured in 2008 by MAGIC was 10 and six times lower with respect to the one detected during the phase A and phase B outbursts, respectively. The two phases show quite different behavior: phase A is characterized by a high state of the source clearly visible in every energy band, especially in optical where the highest flux ever detected for S5 0716+714 is reported. HE and optical curves show a double peaked structure and the polarization angle undergoes a fast change between the two optical peaks. After an intermediate time period when activity is limited to the radio band, phase B is characterized by VHE and X-ray high flux, while the other bands reached a lower state after the outburst of phase A. The fractional variability of both phases shows an increasing trend with the energy. The phase B flare is clearly visible in the VHE and X-ray band only. Such differences in behaviour between the two activity states is very interesting to study, and together with the jet analysis of the source and the modeling of the broadband spectral energy distribution, which will be presented in [21], it will improve our understanding of the BL Lac emission mechanism [22].

4. Discussion

The unprecedented outburst of the BL Lac object S5 0716+714 in January 2015 was observed in all the wavebands. The MAGIC detection of the source, together with simultaneous data in the HE range from Fermi-LAT, will allow us to constrain the Inverse Compton part of the broadband spectrum. The rich multiwavelength coverage presented here is part of a more comprehensive study of the source in preparation [21]. The impressive activity in phase A was followed by some days of decreasing flux, and then a new high-state was observed in the VHE and X-ray bands (phase B). The structure of the light curve in phase A showed a double-peaked shape, and the electric vector position angle (EVPA) of the linearly polarized optical emission rotated by ∼ 360 in between the two peaks. Such swings in EVPA have been frequently observed in connection with γ-ray flaring epochs (e.g., [23,24,25]). A detailed correlation study and modelling of the spectral energy distribution are in progress.

Acknowledgments

We would like to thank the Instituto de Astrofísica de Canarias for the excellent working conditions at the Observatorio del Roque de los Muchachos in La Palma. The financial support of the German BMBF and MPG, the Italian INFN and INAF, the Swiss National Fund SNF, the he ERDF under the Spanish MINECO (FPA2015-69818-P, FPA2012-36668, FPA2015-68278-P,FPA2015-69210-C6-2-R, FPA2015-69210-C6-4-R, FPA2015-69210-C6-6-R, AYA2013-47447-C3-1-P, AYA2015-71042-P, ESP2015-71662-C2-2-P, CSD2009-00064), and the Japanese JSPS and MEXT is gratefully acknowledged. This work was also supported by the Spanish Centro de Excelencia “Severo Ochoa” SEV-2012-0234 and SEV-2015-0548, and Unidad de Excelencia “María de Maeztu” MDM-2014-0369, by grant 268740 of the Academy of Finland, by the Croatian Science Foundation (HrZZ) Project 09/176 and the University of Rijeka Project 13.12.1.3.02, by the DFG Collaborative Research Centers SFB823/C4 and SFB876/C3, and by the Polish MNiSzW grant 745/N-HESS-MAGIC/2010/0. The Fermi-LAT Collaboration acknowledges support for LAT development, operation and data analysis from NASA and DOE (United States), CEA/Irfu and IN2P3/CNRS (France), ASI and INFN (Italy), MEXT, KEK, and JAXA (Japan), and the K.A. Wallenberg Foundation, the Swedish Research Council and the National Space Board (Sweden). Science analysis support in the operations phase from INAF (Italy) and CNES (France) is also gratefully acknowledged. We thank the Swift team duty scientists and science planners. The Metsähovi team acknowledges the support from the Academy of Finland to our observing projects (numbers 212656, 210338, 121148, and others). The Submillimeter Array is a joint project between the Smithsonian Astrophysical Observatory and the Academia Sinica Institute of Astronomy and Astrophysics and is funded by the Smithsonian Institution and the Academia Sinica. The OVRO 40-m monitoring program is supported in part by NASA grants NNX08AW31G, NNX11A043G and NNX14AQ89G, and NSF grants AST-0808050 and AST-1109911. St.-Petersburg University team was supported by research grant 6.38.335.2015 and RFBR grant 15-02-00949.

Author Contributions

Marina Manganaro, Giovanna Pedaletti and Mireia Nievas performed the MAGIC analysis of the source. Bindu Rani, Denis Bastieri, Dario Gasparrini took care of the Fermi-LAT analysis. This proceeding is part of a joint MAGIC-Fermi-LAT work involving also other multiwavelength authors. The preliminary results here included will be part of a paper in preparation which is led by Marina Manganaro, Marlene Doert and Bindu Rani. All the other authors listed provided the analysis of their data and participated in the discussion of the multiwavelength curve. Elina Lindfors is the PI of the MAGIC program of ToO observations of flaring AGNs based on optical, X-ray and γ-ray triggers. Marina Manganaro wrote this proceeding.

Conflicts of Interest

The authors declare no conflict of interest.

References

  1. Rani, B.; Krichbaum, T.P.; Fuhrmann, L.; Boettcher, M.; Lott, B.; Aller, H.D.; Aller, M.F.; Angelakis, E.; Bach, U.; Bastieri, D.; et al. Radio to gamma-ray variability study of blazar S5 0716+714. Astron. Astrophys. 2013, 552, A11. [Google Scholar] [CrossRef]
  2. Nilsson, K.; Pursimo, T.; Sillanpää, A.; Takalo, L.O.; Lindfors, E. Detection of the host galaxy of S5 0716+714. Astron. Astrophys. 2008, 487, L29–L32. [Google Scholar] [CrossRef]
  3. Anderhub, H. Discovery of very high energy γ-rays from the blazar S5 0716+714. Physics 2009, 704, L129–L133. [Google Scholar] [CrossRef]
  4. Wagner, S.J.; Witzel, A.; Heidt, J.; Krichbaum, T.P.; Qian, S.J.; Quirrenbach, A.; Wegner, R.; Aller, H.; Aller, M.; Anton, K.; et al. Rapid variability in S5 0716+714 across the electromagnetic spectrum. Astron. J. 1996, 111, 2187–2211. [Google Scholar] [CrossRef]
  5. Rani, B.; Gupta, A.C.; Joshi, U.C.; Ganesh, S.; Wiita, P.J. Optical intraday variability studies of 10 low energy peaked blazars. Mon. Not. R. Astron. Soc. 2011, 413, 2157–2172. [Google Scholar] [CrossRef]
  6. Montagni, F.; Maselli, A.; Massaro, E.; Nesci, R.; Sclavi, S.; Maesano, M. The intra-night optical variability of the bright BL Lacertae object S5 0716+714. Astron. Astrophys. 2006, 451, 435–442. [Google Scholar] [CrossRef]
  7. Rani, B.; Krichbaum, T.P.; Marscher, A.P.; Hodgson, J.A.; Fuhrmann, L.; Angelakis, E.; Britzen, S.; Zensus, J.A. Connection between inner jet kinematics and broadband flux variability in the BL Lacertae object S5 0716+714. Astron. Astrophys. 2015, 578, A123. [Google Scholar] [CrossRef]
  8. Abdo, A.A.; Ackermann, M.; Ajello, M.; Atwood, W.B.; Axelsson, M.; Baldini, L.; Ballet, J.; Barbiellini, G.; Bastieri, D.; Bechtol, K.; et al. Spectral Properties of bright Fermi-detected blazars in the gamma-ray band. Astrophys. J. 2010, 710, 1271. [Google Scholar] [CrossRef]
  9. Senturk, G.D.; Errando, M.; Böttcher, M.; Mukherjee, R. Gamma-ray Observational properties of TeV-detected blazars. Astrophys. J. 2013, 764, 119. [Google Scholar] [CrossRef]
  10. Mirzoyan, R. MAGIC Detects Very High Energy Gamma-Rays from S5 0716+714. Available online: http://www.astronomerstelegram.org/?read=6999 (accessed on 21 November 2016).
  11. Aleksić, J.; Ansoldib, S.; Antonellic, L.A.; Antoranzd, P.; Babice, A.; Bangalef, P.; Barcelóa, M.; Barriog, J.A.; Gonzálezh, J.B.; Bednarek, W.; et al. The major upgrade of the MAGIC telescopes, Part II: A performance study using observations of the Crab Nebula. Astropart. Phys. 2016, 72, 76–94. [Google Scholar] [CrossRef]
  12. Atwood, W.B.; Abdo, A.A.; Ackermann, M.; Althouse, W.; Anderson, B.; Axelsson, M.; Baldini, L.; Ballet, J.; Band, D.L.; Barbiellini, G.; et al. The Large Area Telescope on the Fermi Gamma-Ray Space Telescope Mission. Astrophys. J. 2009, 697, 1071. [Google Scholar] [CrossRef]
  13. Hill, J.E.; Burrows, D.N.; Nousek, J.A.; Wells, A.; Turner, M.; Willingale, R.; Holland, A.; Citterio, O.; Chincarini, G.; Campana, S.; et al. The Swift X-ray telescope. Space Sci. Rev. 2005, 120, 165–195. [Google Scholar]
  14. Roming, P.W.A.; Hunsberger, S.D.; Nousek, J.A.; Mason, K.O.; Breeveld, A.A. The Swift Ultra-Violet/Optical Telescope. Space Sci. Rev. 2005, 120, 95–142. [Google Scholar] [CrossRef]
  15. Hagen-Thorn, V.A.; Larionov, V.M.; Efimova, N.V.; Hagen-Thorn, E.I.; Arkharov, A.A.; Di Paola, A.; Dolci, M.; Takalo, L.O.; Sillanpää, A.; Ostorero, L.; et al. Optical and IR monitoring of the BL Lac object S5 0716+714 from 2001–2004. Astr. Rep. 2006, 50, 458–467. [Google Scholar] [CrossRef]
  16. Teräsranta, H.; Tornikoski, M.; Mujunen, A.; Karlamaa, K.; Valtonen, T.; Henelius, N.; Urpo, S.; Lainela, M.; Pursimo, T.; Nilsson, K.; et al. Fifteen years monitoring of extragalactic radio sources at 22, 37 and 87 GHz. Astron. Astrophys. Suppl. 1998, 132, 305–331. [Google Scholar] [CrossRef]
  17. Richards, J.L.; Max-Moerbeck, W.; Pavlidou, V.; King, O.G.; Pearson, T.J.; Readhead, A.C.S.; Reeves, R.; Shepherd, M.C.; Stevenson, M.A.; Weintraub, L.C.; et al. Blazars in the Fermi era: the OVRO 40 m telescope monitoring program. Astrophys. J. Suppl. 2011, 194, 29. [Google Scholar] [CrossRef]
  18. Zanin, R.; Gaug, M.; Carmona, E.; Colin, P.; Delgado, C.; Lombardi, S.; Mazin, D.; Scalzotto, V.; Sitarek, J.; Tescaro, D.; et al. MARS, the MAGIC analysis and reconstruction software. In Proceedings of the 33th International Cosmic Ray Conference (ICRC), Rio de Janeiro, Brazil, 2–9 July 2013; Volume 773.
  19. Mattox, J.R.; Bertsch, D.L.; Chiang, J.; Dingus, B.L.; Digel, S.W.; Esposito, J.A.; Fierro, J.M.; Hartman, R.C.; Hunter, S.D.; Kanbach, G.; et al. The likelyhood analysis of EGRET data. Astrophys. J. 1996, 461, 396–407. [Google Scholar] [CrossRef]
  20. Acero, F.; Ackermann, M.; Ajello, M.; Albert, A.; Atwood, W.B.; Axelsson, M.; Baldini, L.; Ballet, J.; Barbiellini, G.; Bastieri, D.; et al. Fermi Large Area Telescope Third Source Catalog. Astrophys. J. Suppl. 2015, 218, 23. [Google Scholar] [CrossRef]
  21. Ahnen, M.L.; Ahnen, M.L.; Ansoldi, S.; Antonelli, L.A.; Arcaro, C.; Babić, A.; Banerjee, B.; Bangale, P.; Barres de Almeida, U.; Barrio, J.A.; Becerra González, J.; et al. MWL characterization of the blazar S5 0716+714 during an unprecedented outburst phase. 2016. in preparation. [Google Scholar]
  22. Rani, B.; Krichbaum, T.P.; Hodgson, J.A.; Zensus, J.A. Location and origin of gamma-rays in blazars. J. Phys. Conf. Ser. 2016, 718, 052032. [Google Scholar] [CrossRef]
  23. Marscher, A.; Marscher, A.P.; Jorstad, S.G.; Larionov, V.M.; Aller, M.F.; Aller, H.D.; Lähteenmäki, A.; Agudo, I.; Smith, P.S.; Gurwell, M.; et al. Probing the inner jet of the quasar PKS 1510-089 with multi-waveband monitoring during strong gamma-ray activity. Astrophys. J. Lett. 2010, 710, L126–L131. [Google Scholar] [CrossRef]
  24. Aleksić, J.; Ansoldi, S.; Antonelli, L.A.; Antoranz, P.; Babic, A.; Bangale, P.; Barres de Almeida, U.; Barrio, J.A.; Becerra González, J.; Bednarek, W.; Bernardini, E.; et al. MAGIC gamma-ray and multi-frequency observations of flat spectrum radio quasar PKS 1510-089 in early 2012. Astron. Astrophys. 2014, 569, A46. [Google Scholar] [CrossRef]
  25. Blinov, D.; Pavlidou, V.; Papadakis, I.; Kiehlmann, S.; Panopoulou, G.; Liodakis, I.; King, O.G.; Angelakis, E.; Baloković, M.; Das, H.; et al. RoboPol: First season rotations of optical polarization plane in blazars. Mon. Not. R. Astron. Soc. 2015, 453, 1669–1683. [Google Scholar] [CrossRef]
Figure 1. Distribution of the squared angular distance θ 2 between the reconstructed source position and the nominal source position (points) or the background estimation position (shaded area) for S5 0716+714 (a) and VHE skymap of the source (b). The color bar indicates the relative flux. The contours indicate significance in steps of 5 σ .
Galaxies 04 00069 g001
Figure 2. Multiwavelength light curves of S5 0716+714. Shadowed areas indicate Phase A (from MJD 57040 to MJD 57050) and Phase B (from MJD 57066 to MJD 57069) and the respective activities in all the energy bands. Fermi-LAT panels (second and third from the top) show the 3FGL averaged flux and spectral index from the 3FGL Catalog [20], respectively, as blue dashed lines.
Galaxies 04 00069 g002

