
Multi-Frequency Monitoring of the Flat Spectrum Radio Quasar PKS 1222+216 in 2008–2015

 , , , ,
Abstract
:1. Introduction
2. Observations and Data Reduction
3. Results and Discussion
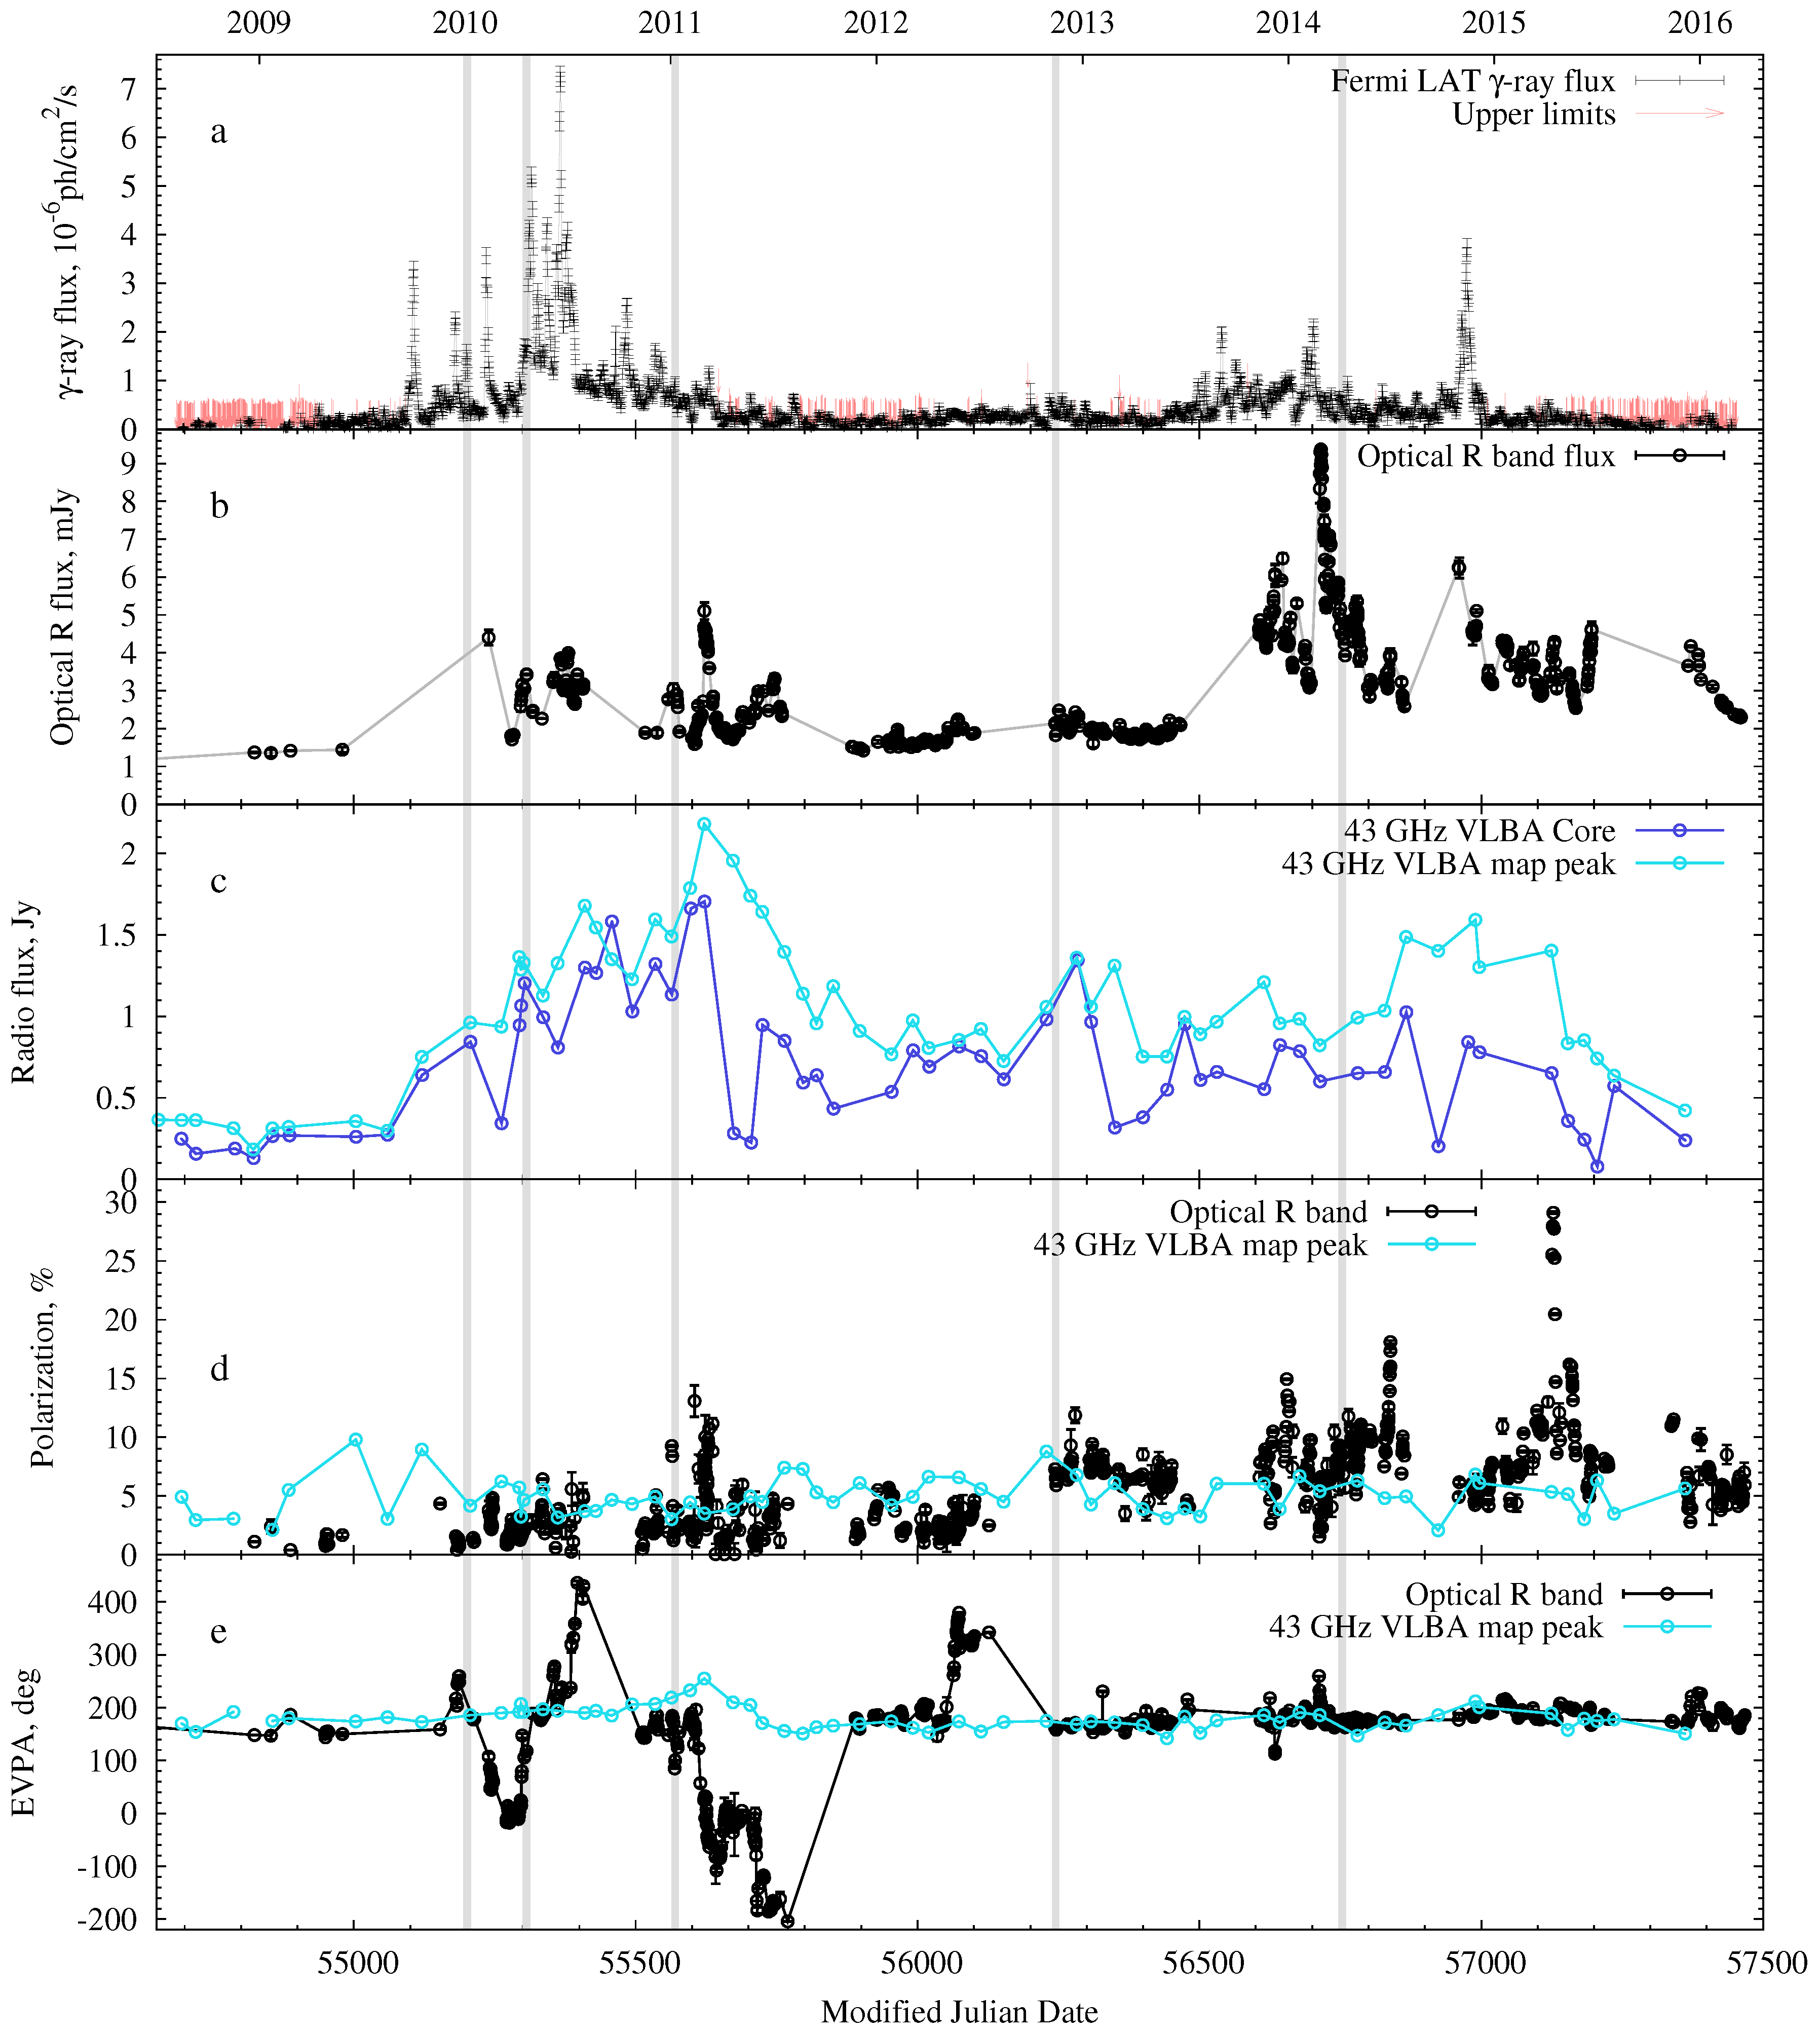
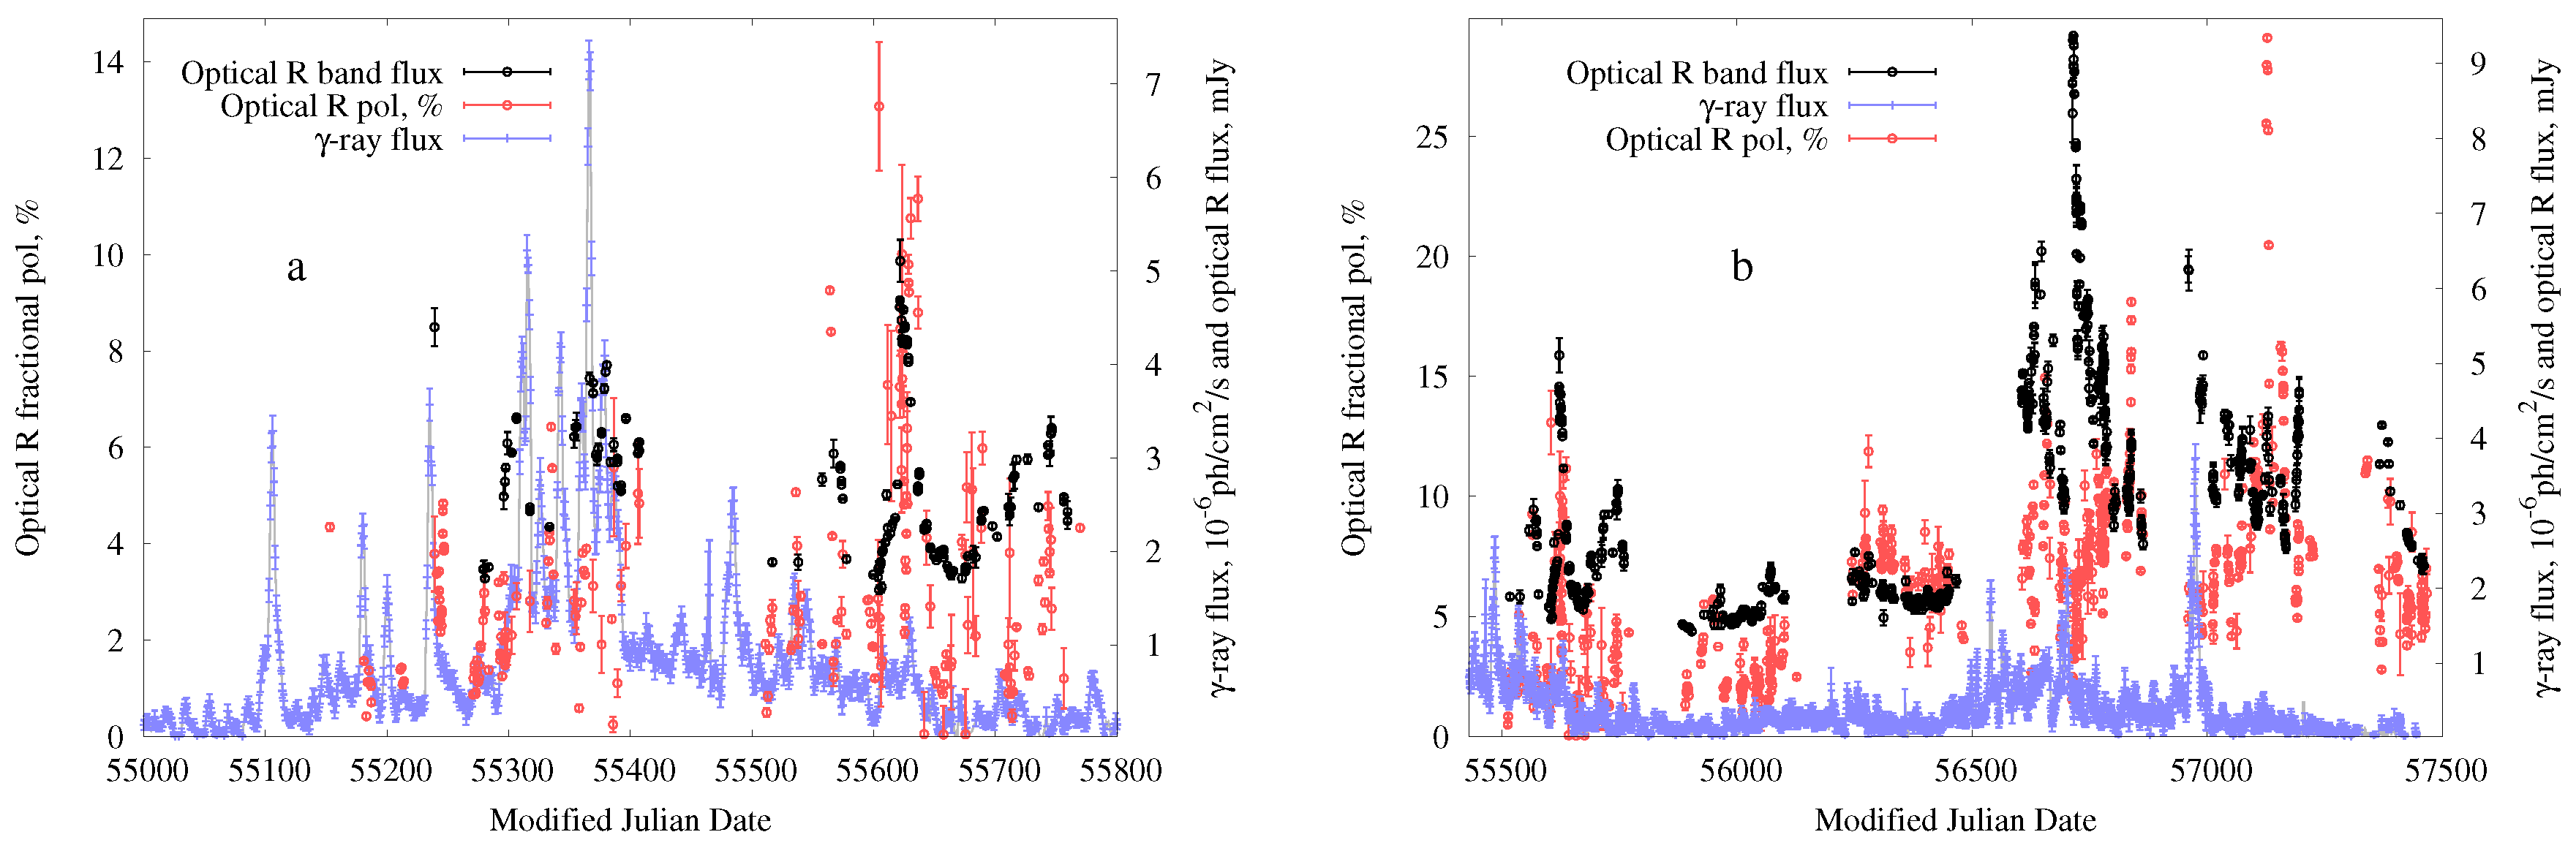
3.1. Light Curves
3.2. Polarization
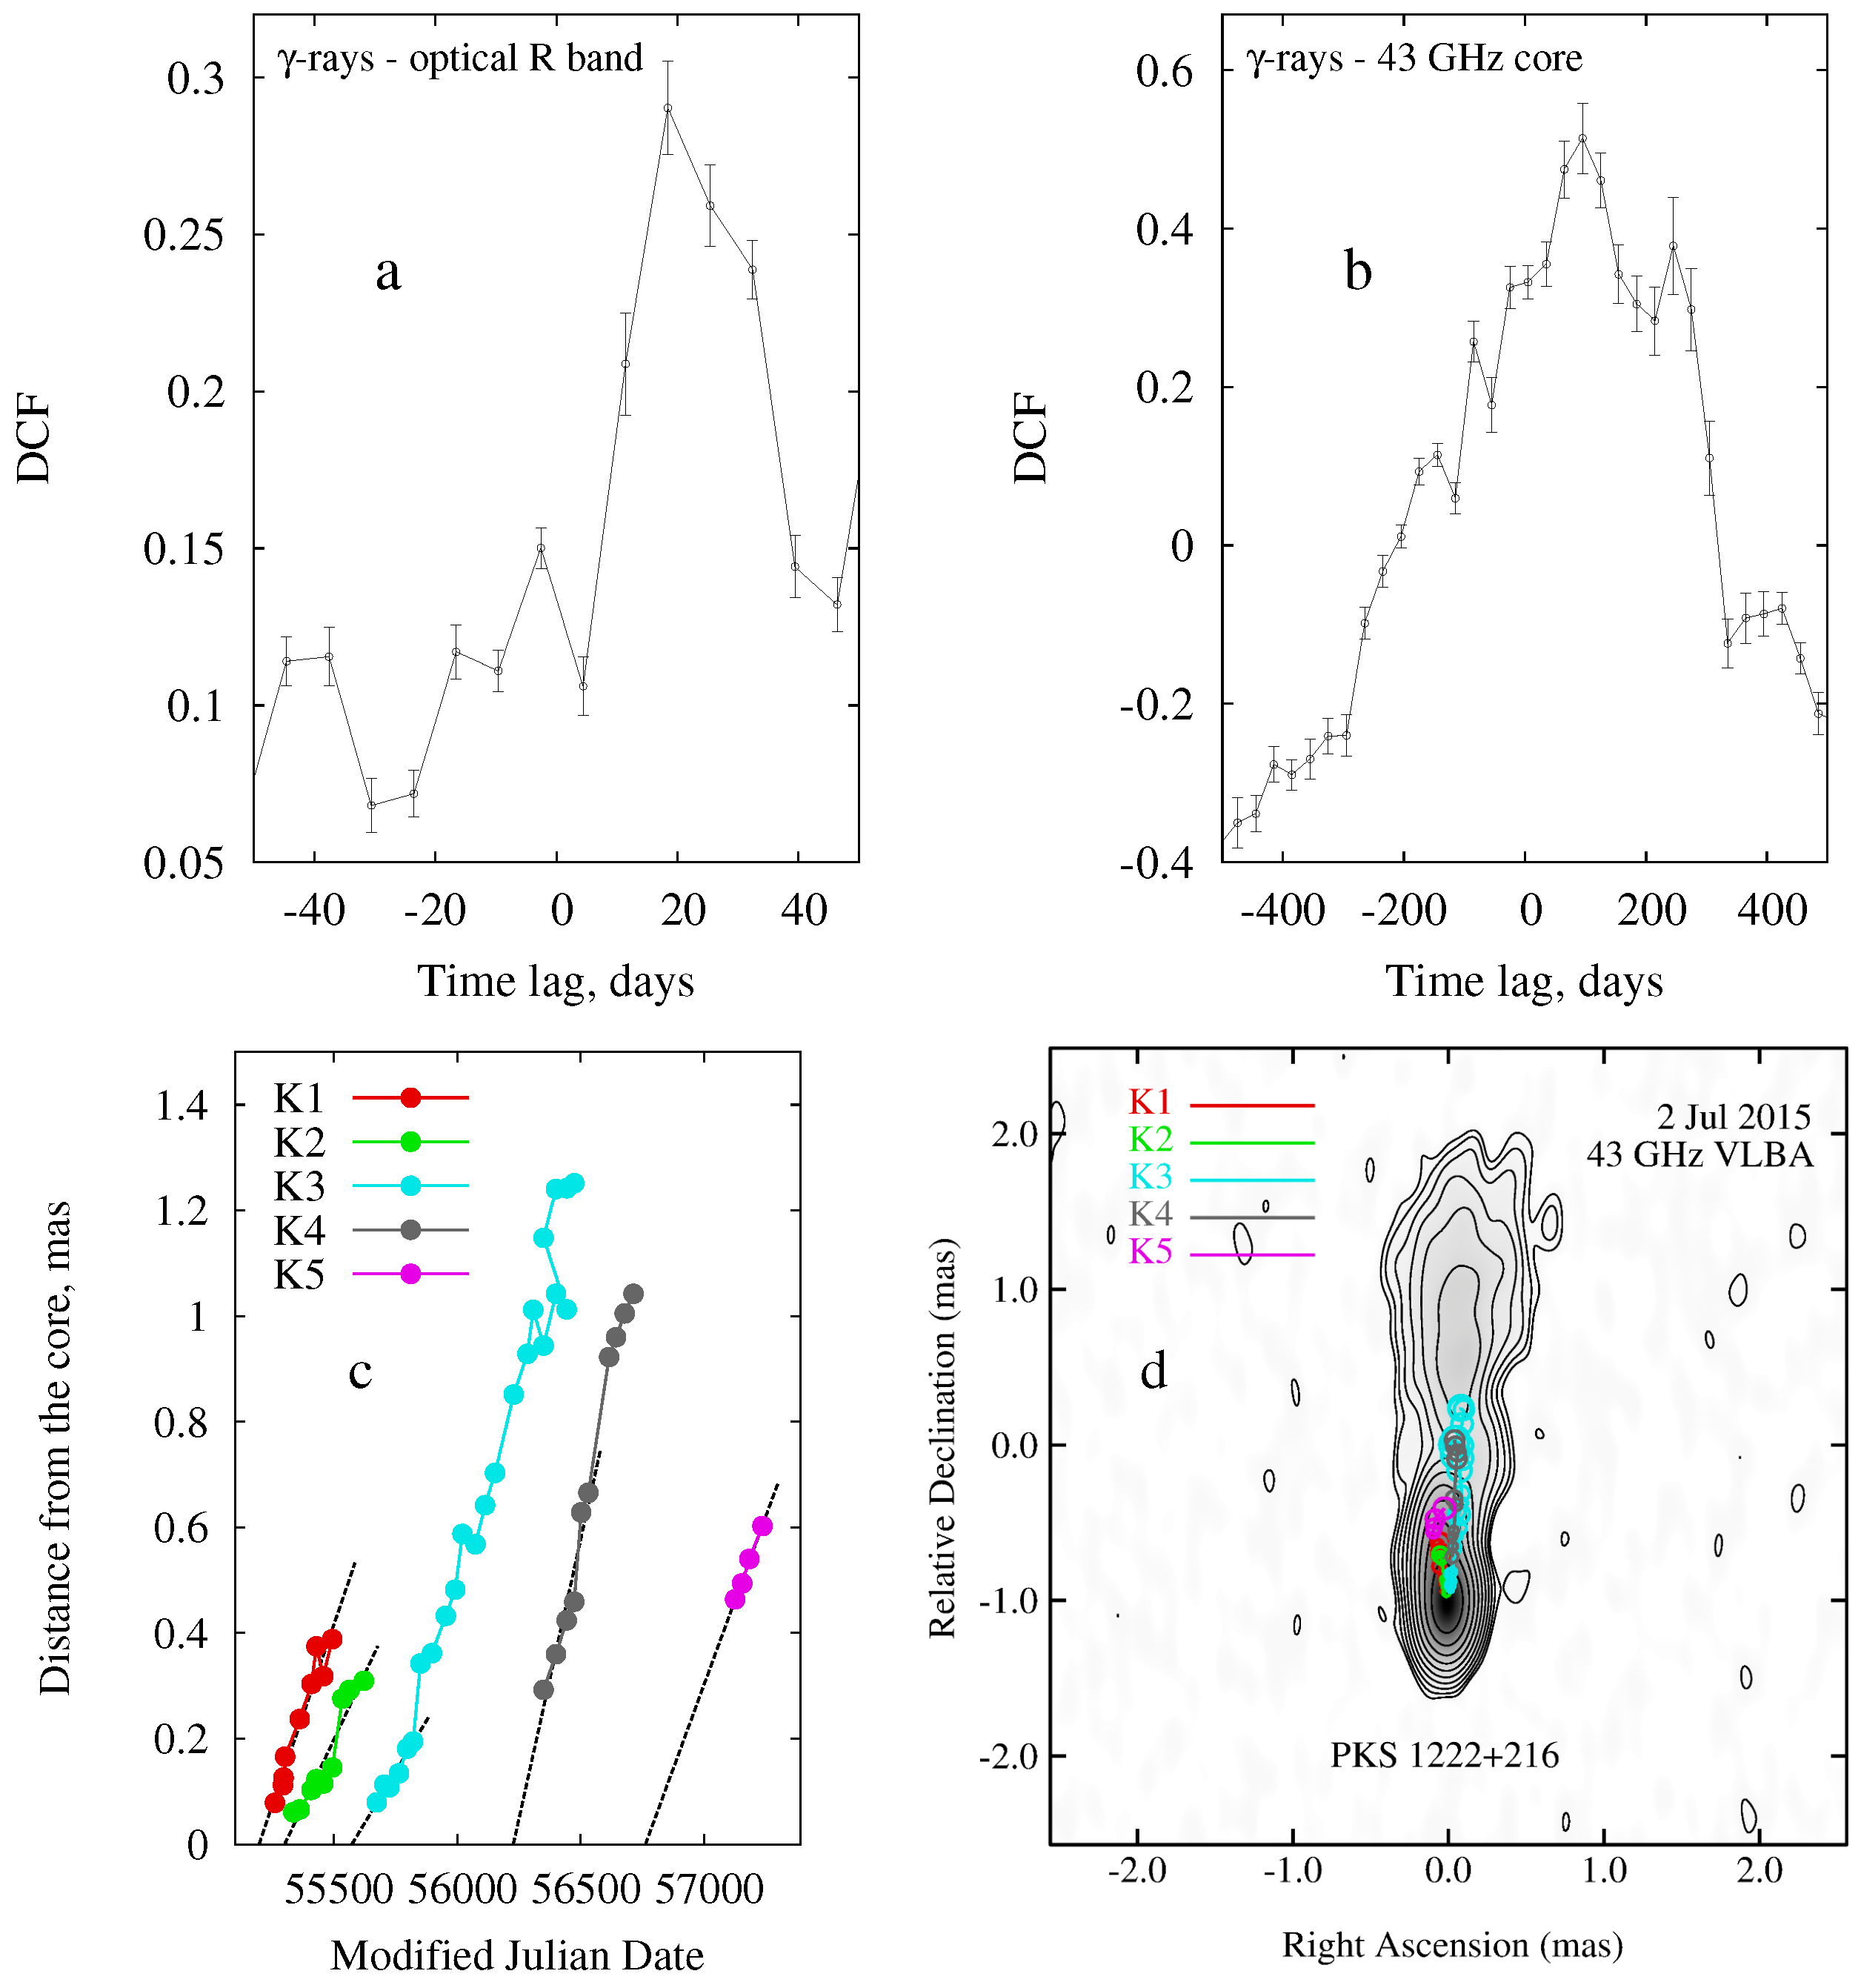
3.3. VLBA Images
4. Conclusions
Acknowledgments
Author Contributions
Conflicts of Interest
References
- Aleksic, J.; Antonelli, L.; Antoranz, P.; Backes, M.; Barrio, J.; Bastieri, D.; Becerra González, J.; Bednarek, W.; Berdyugin, A.; Berger, K.; et al. MAGIC discovery of VHE Emission from the FSRQ PKS 1222+21. Astrophys. J. Lett. 2011, 730, L8. [Google Scholar] [CrossRef]
- Jorstad, S.G.; Marscher, A.P.; Morozova, D.A.; Bala, V.; Agudo, I.; Gomez, J.L.; Lahteenmaki, A.; Larionov, V.M.; Smith, P.S.; Tornikoski, M. The jet of the quasar 4C+21.35 from parsec to kiloparces scales and its role in high energy photon production. Proc. Int. Astron. Union 2015, 10, 33–38. [Google Scholar] [CrossRef]
- Larionov, V.M.; Jorstad, S.G.; Marscher, A.P.; Raiteri, C.M.; Villata, M.; Agudo, I.; Aller, M.F.; Arkharov, A.A.; Asfandiyarov, I.M.; Bach, U.; et al. Results of WEBT, VLBA and RXTE monitoring of 3C 279 during 2006–2007. Astron. Astrophys. 2008, 492, 389–400. [Google Scholar] [CrossRef]
- The VLBA-BU-BLAZAR Program. Available online: http://www.bu.edu/blazars/VLBAproject.html (accessed on 10 July 2016).
- MAPCAT: Monitoring AGN with Polarimetry at the Calar Alto Telescopes. Available online: http://www.iaa.es/~iagudo/research/MAPCAT/MAPCAT.html (accessed on 10 July 2016).
- Ground-based Observational Support of the Fermi Gamma-ray Space Telescope at the University of Arizona. Available online: http://james.as.arizona.edu/~psmith/Fermi (accessed on 10 July 2016).
- Jorstad, S.G.; Marscher, A.P.; Lister, M.L.; Stirling, A.M.; Cawthorne, T.V.; Gear, W.K.; Gómez, J.L.; Stevens, J.A.; Smith, P.S.; Forster, J.R.; et al. Polarimetric Observations of 15 Active Galactic Nuclei at High Frequencies: Jet Kinematics from Bimonthly Monitoring with the Very Long Baseline Array. Astron. J. 2005, 130, 1418–1465. [Google Scholar] [CrossRef]
- Atwood, W.B.; Abdo, A.A.; Ackermann, M.; Althouse, W.; Anderson, B.; Axelsson, M.; Baldini, L.; Ballet, J.; Band, D.L.; Barbiellini, G.; et al. The Large Area Telescope on the Fermi Gamma-Ray Space Telescope Mission. Astrophys. J. 2009, 697, 1071–1102. [Google Scholar] [CrossRef]
- Edelson, R.A.; Krolik, J.H. The discrete correlation function—A new method for analyzing unevenly sampled variability data. Astrophys. J. 1988, 333, 646–659. [Google Scholar] [CrossRef]
- Hughes, P.A.; Aller, H.D.; Aller, M.F. Polarized Radio Outbursts in Bl-Lacertae II. The Flux and Polarization of a Piston-Driven Shock. Astrophys. J. 1985, 298, 301–315. [Google Scholar] [CrossRef]
- Marscher, A.P.; Gear, W.K. Models for high-frequency radio outbursts in extragalactic sources, with application to the early 1983 millimeter-to-infrared flare of 3C 273. Astrophys. J. 1985, 298, 114–127. [Google Scholar] [CrossRef]
- Marscher, A.P. Turbulent, Extreme Multi-Zone Model for Simulating Flux and Polarization Variability in Blazars. Astrophys. J. 2014, 780, 87–97. [Google Scholar] [CrossRef]

© 2016 by the authors; licensee MDPI, Basel, Switzerland. This article is an open access article distributed under the terms and conditions of the Creative Commons Attribution (CC-BY) license (http://creativecommons.org/licenses/by/4.0/).
Share and Cite
Troitskiy, I.; Morozova, D.; Jorstad, S.; Larionov, V.; Marscher, A.; Agudo, I.; Blinov, D.; Smith, P.; Troitskaya, Y. Multi-Frequency Monitoring of the Flat Spectrum Radio Quasar PKS 1222+216 in 2008–2015. Galaxies 2016, 4, 72. https://doi.org/10.3390/galaxies4040072
Troitskiy I, Morozova D, Jorstad S, Larionov V, Marscher A, Agudo I, Blinov D, Smith P, Troitskaya Y. Multi-Frequency Monitoring of the Flat Spectrum Radio Quasar PKS 1222+216 in 2008–2015. Galaxies. 2016; 4(4):72. https://doi.org/10.3390/galaxies4040072
Chicago/Turabian StyleTroitskiy, Ivan, Daria Morozova, Svetlana Jorstad, Valery Larionov, Alan Marscher, Ivan Agudo, Dmitry Blinov, Paul Smith, and Yuliya Troitskaya. 2016. "Multi-Frequency Monitoring of the Flat Spectrum Radio Quasar PKS 1222+216 in 2008–2015" Galaxies 4, no. 4: 72. https://doi.org/10.3390/galaxies4040072