The Globular Cluster System of the Galaxy NGC 6876

1
Facultad de Ciencias Astronómicas y Geofísicas, Universidad Nacional de La Plata, La Plata 1900, Argentina
2
Instituto de Astrofísica de La Plata, CCT La Plata, CONICET-UNLP, La Plata 1900, Argentina
*
Author to whom correspondence should be addressed.
Galaxies 2017, 5(3), 30; https://doi.org/10.3390/galaxies5030030
Submission received: 27 May 2017
/
Revised: 19 July 2017
/
Accepted: 21 July 2017
/
Published: 25 July 2017
(This article belongs to the Special Issue On the Origin (and Evolution) of Baryonic Galaxy Halos)
Abstract
:We present preliminary results of the deep photometric study of the elliptical galaxy NGC 6876, located at the center of the Pavo group, and its globular cluster system. We use images obtained with the GMOS camera mounted on the Gemini South telescope, in the and bands, with the purpose of disentangling the evolutionary history of the galaxy on the basis of its characteristics.
1. Introduction
Globular clusters (GCs) are considered to be among the oldest objects in the Universe, with ages greater than 10 Gyr [1,2]. Because of this, GC systems are widely used as tools to study the first evolutionary stages of the galaxies in which they reside, since they hold a record of both the chemical properties of the environment at the time the galaxy was formed, and of any assembly events that the galaxy has gone through [3]. In bright galaxies, a bimodality in the color distribution of their GC system is usually found, which signals the existence of two sub-populations differentiated by their metallicities [4]. Though all GCs are metal-poor, these sub-populations are refered to as “metal-rich” (red GCs) and “metal-poor” (blue GCs). This bimodality is one of the most studied properties of GC systems, since these sub-populations show distinct intrinsic characteristics such as their spatial distribution and their kinematics.
NGC 6876 is a massive elliptical galaxy situated at the center of the Pavo Group, at an approximate distance of 45 Mpc [5]. This is a moderately massive group, with 13 confirmed members, that appears to be dynamically young considering the several interactions between its members that have been studied. In a recent work by [6], an X-ray trail between NGC 6876 and its spiral neighbor, NGC 6872, was found, hinting at a possible interaction between the two galaxies. This interaction has also been studied in IR and HI [7].
In this work, we present preliminary results for the study of the GC system of NGC 6876, including the color-magnitude diagram, the color distribution, and the spatial, radial and azimuthal distribution for both the entire system and the presumed sub-populations. The long-term aim of this study is to look for evidence of the mentioned interactions with NGC 6872 in the GC population, such as irregularities in the azimuthal distribution, differences between the radial distribution of the sub-populations, etc. [8].
2. Materials and Methods
The images used in this study were obtained in 2013, using the Gemini Multi-Object Spectograph (GMOS) of Gemini South (Cerro Pachón, Chile) and the g′ and i′ filters (Program GS-2013B-Q-37). They were processed using Gemini routines included in IRAF, and bias and flat-field corrections were applied using the appropriate images obtained from the Gemini Observatory Archive (GOA) (https://archive.gemini.edu). The i′ filter showed night-sky fringing, which was corrected using i′ blank sky images, also obtained from the GOA.
The field of standard stars 195940-595000 [9] was observed within the same program, obtaining images of both long and short exposures to allow us to perform photometry on faint and bright stars, respectively. These images were reduced using the same procedure as the science images, and the photometry of the standard stars present in this field was used to calibrate our photometry.
A catalogue of point-like objects was built using the software SExtractor [10] on the images, which detected sources using both a Gaussian filter, and a mexhat one which works as a complement since it is better for detecting sources near the galactic center. Our first selection was then made of detected sources with a “stellarity index” larger than 0.5. The “stellarity index” ranges from 0 to 1, with 0 being the value used for extended objects such as galaxies, and 1 being the value that identifies point-like sources, such as stars. Using DaoPhot tasks, PSF (Point Spread Function) photometry was performed on all objects. The statistic tests provided by these tasks that determine the goodness of the fit ( and sharpness parameters from ALLSTAR) were then used to make a second selection, ending up with 1631 point-like sources.
3. Results
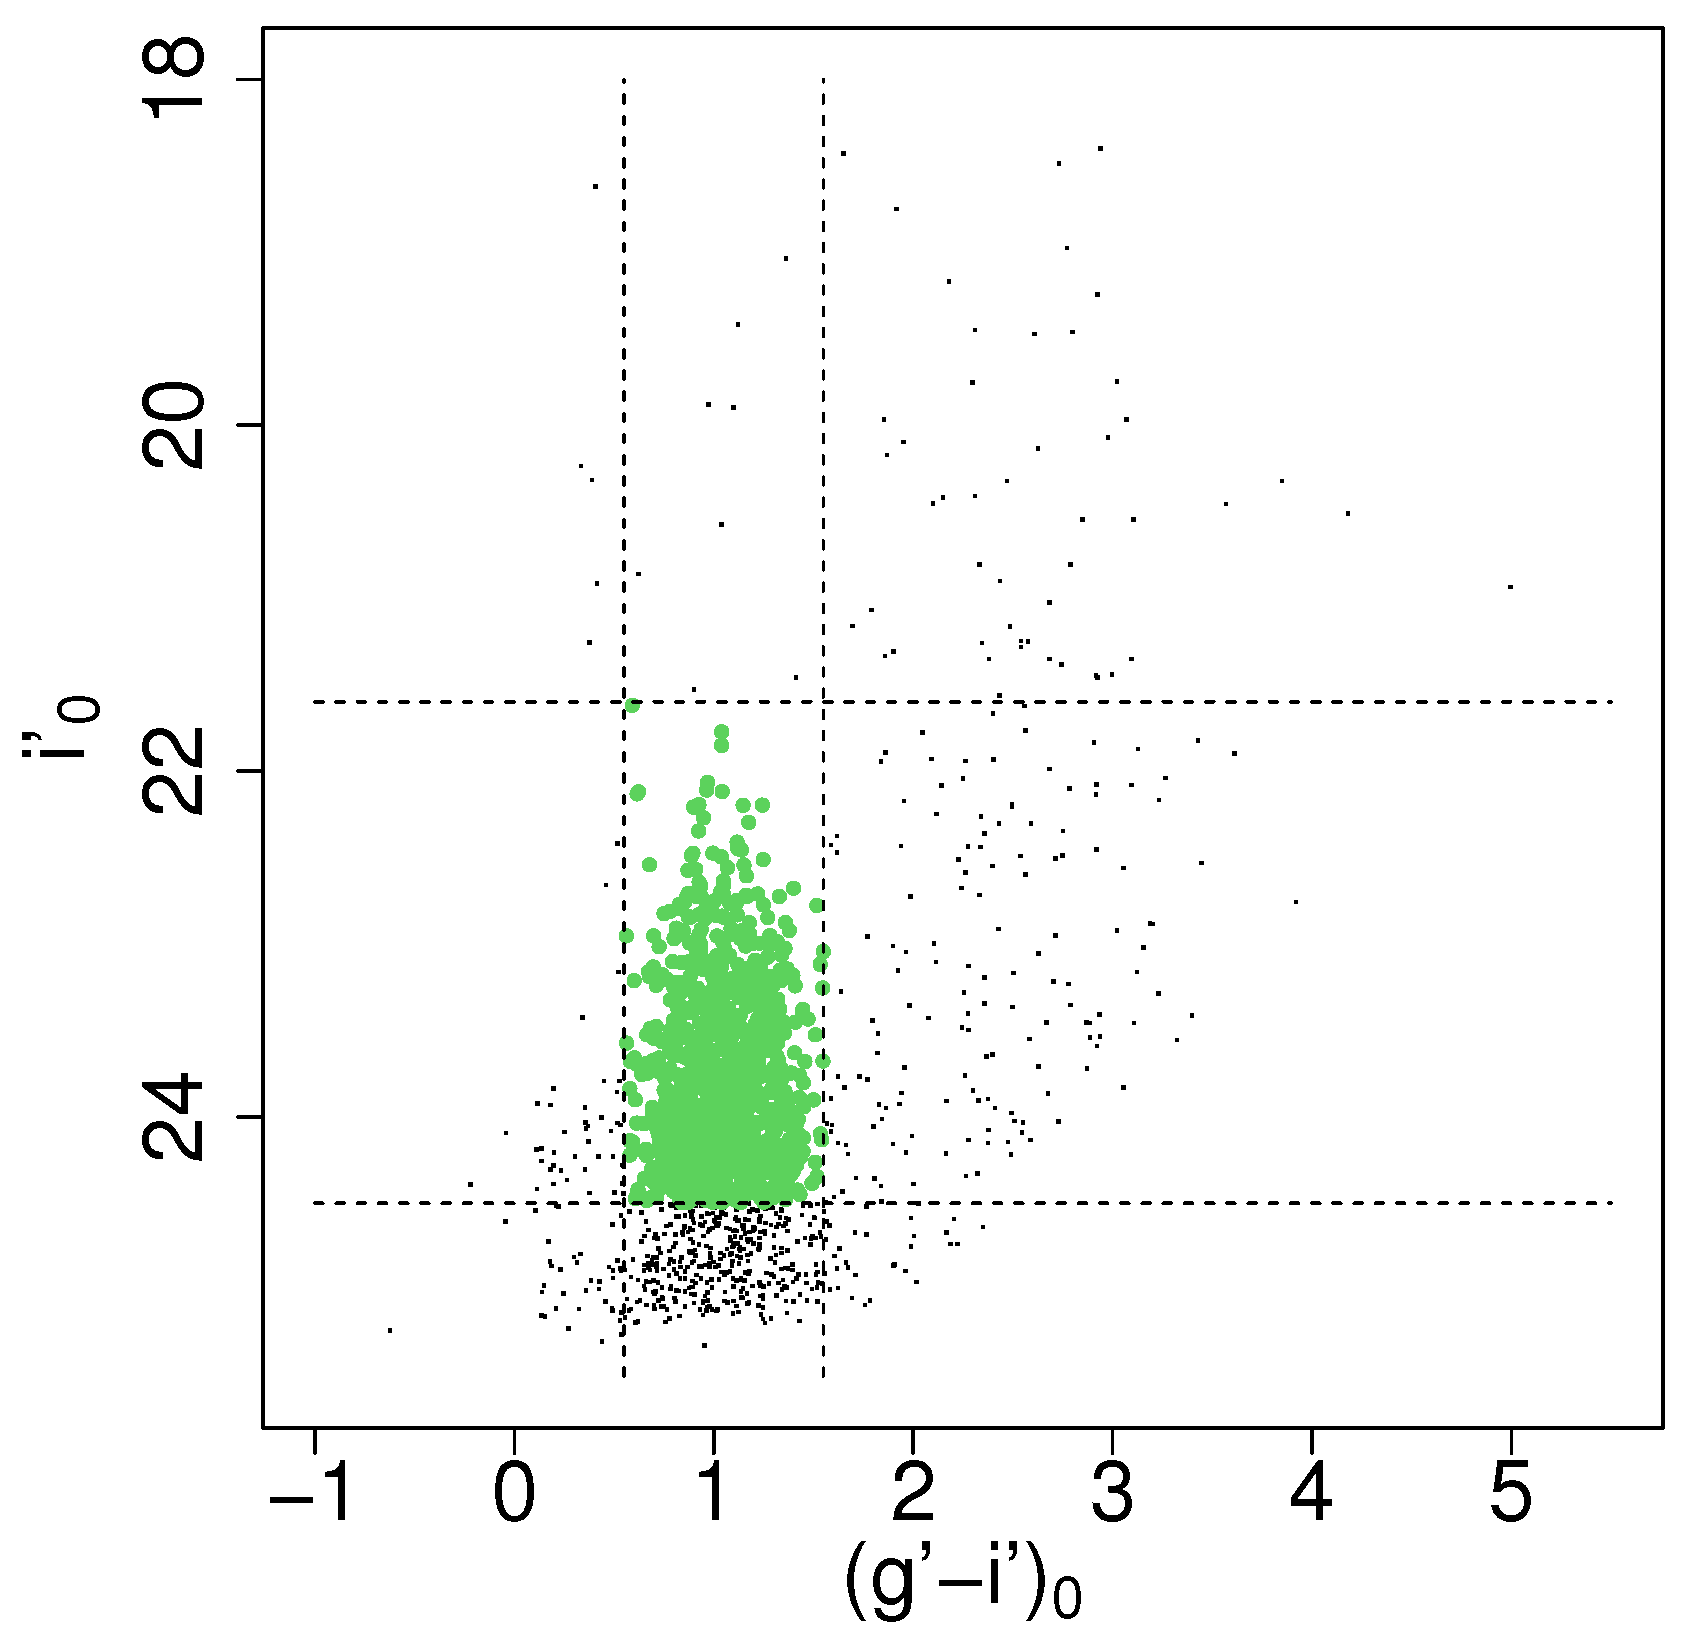
Figure 1 shows the color-magnitude diagram of all point-like sources detected by SExtractor. The limits in color were taken from previous works in the same photometric system [11]. The upper limit in magnitude was also obtained from the literature [12], to separate possible ultra-compact dwarfs (UCDs) which fall in the same range of color as GCs, but are brighter than them. After estimating the completeness, the lower limit was selected so as to ensure a completeness level greater than 80 per cent. With these constraints, our GC system is finally made of ≈917 candidates.
In Figure 2, we present the same four histograms in both panels, each corresponding to a different range of galactocentric distance except for the first one, which shows the entire population. In these histograms, the color distribution of the system is shown with Gaussian functions fitted using GMM [13] for a bimodal distribution (left panel) and a unimodal distribution (right panel). Though it can be seen that in the exterior region and the total population there is a strong tendency towards bimodality, the statistic parameters of these fits (D and the kurtosis) were not conclusive. It is expected that applying the background correction, as we intend to do in the near future, will help produce more definitive results.
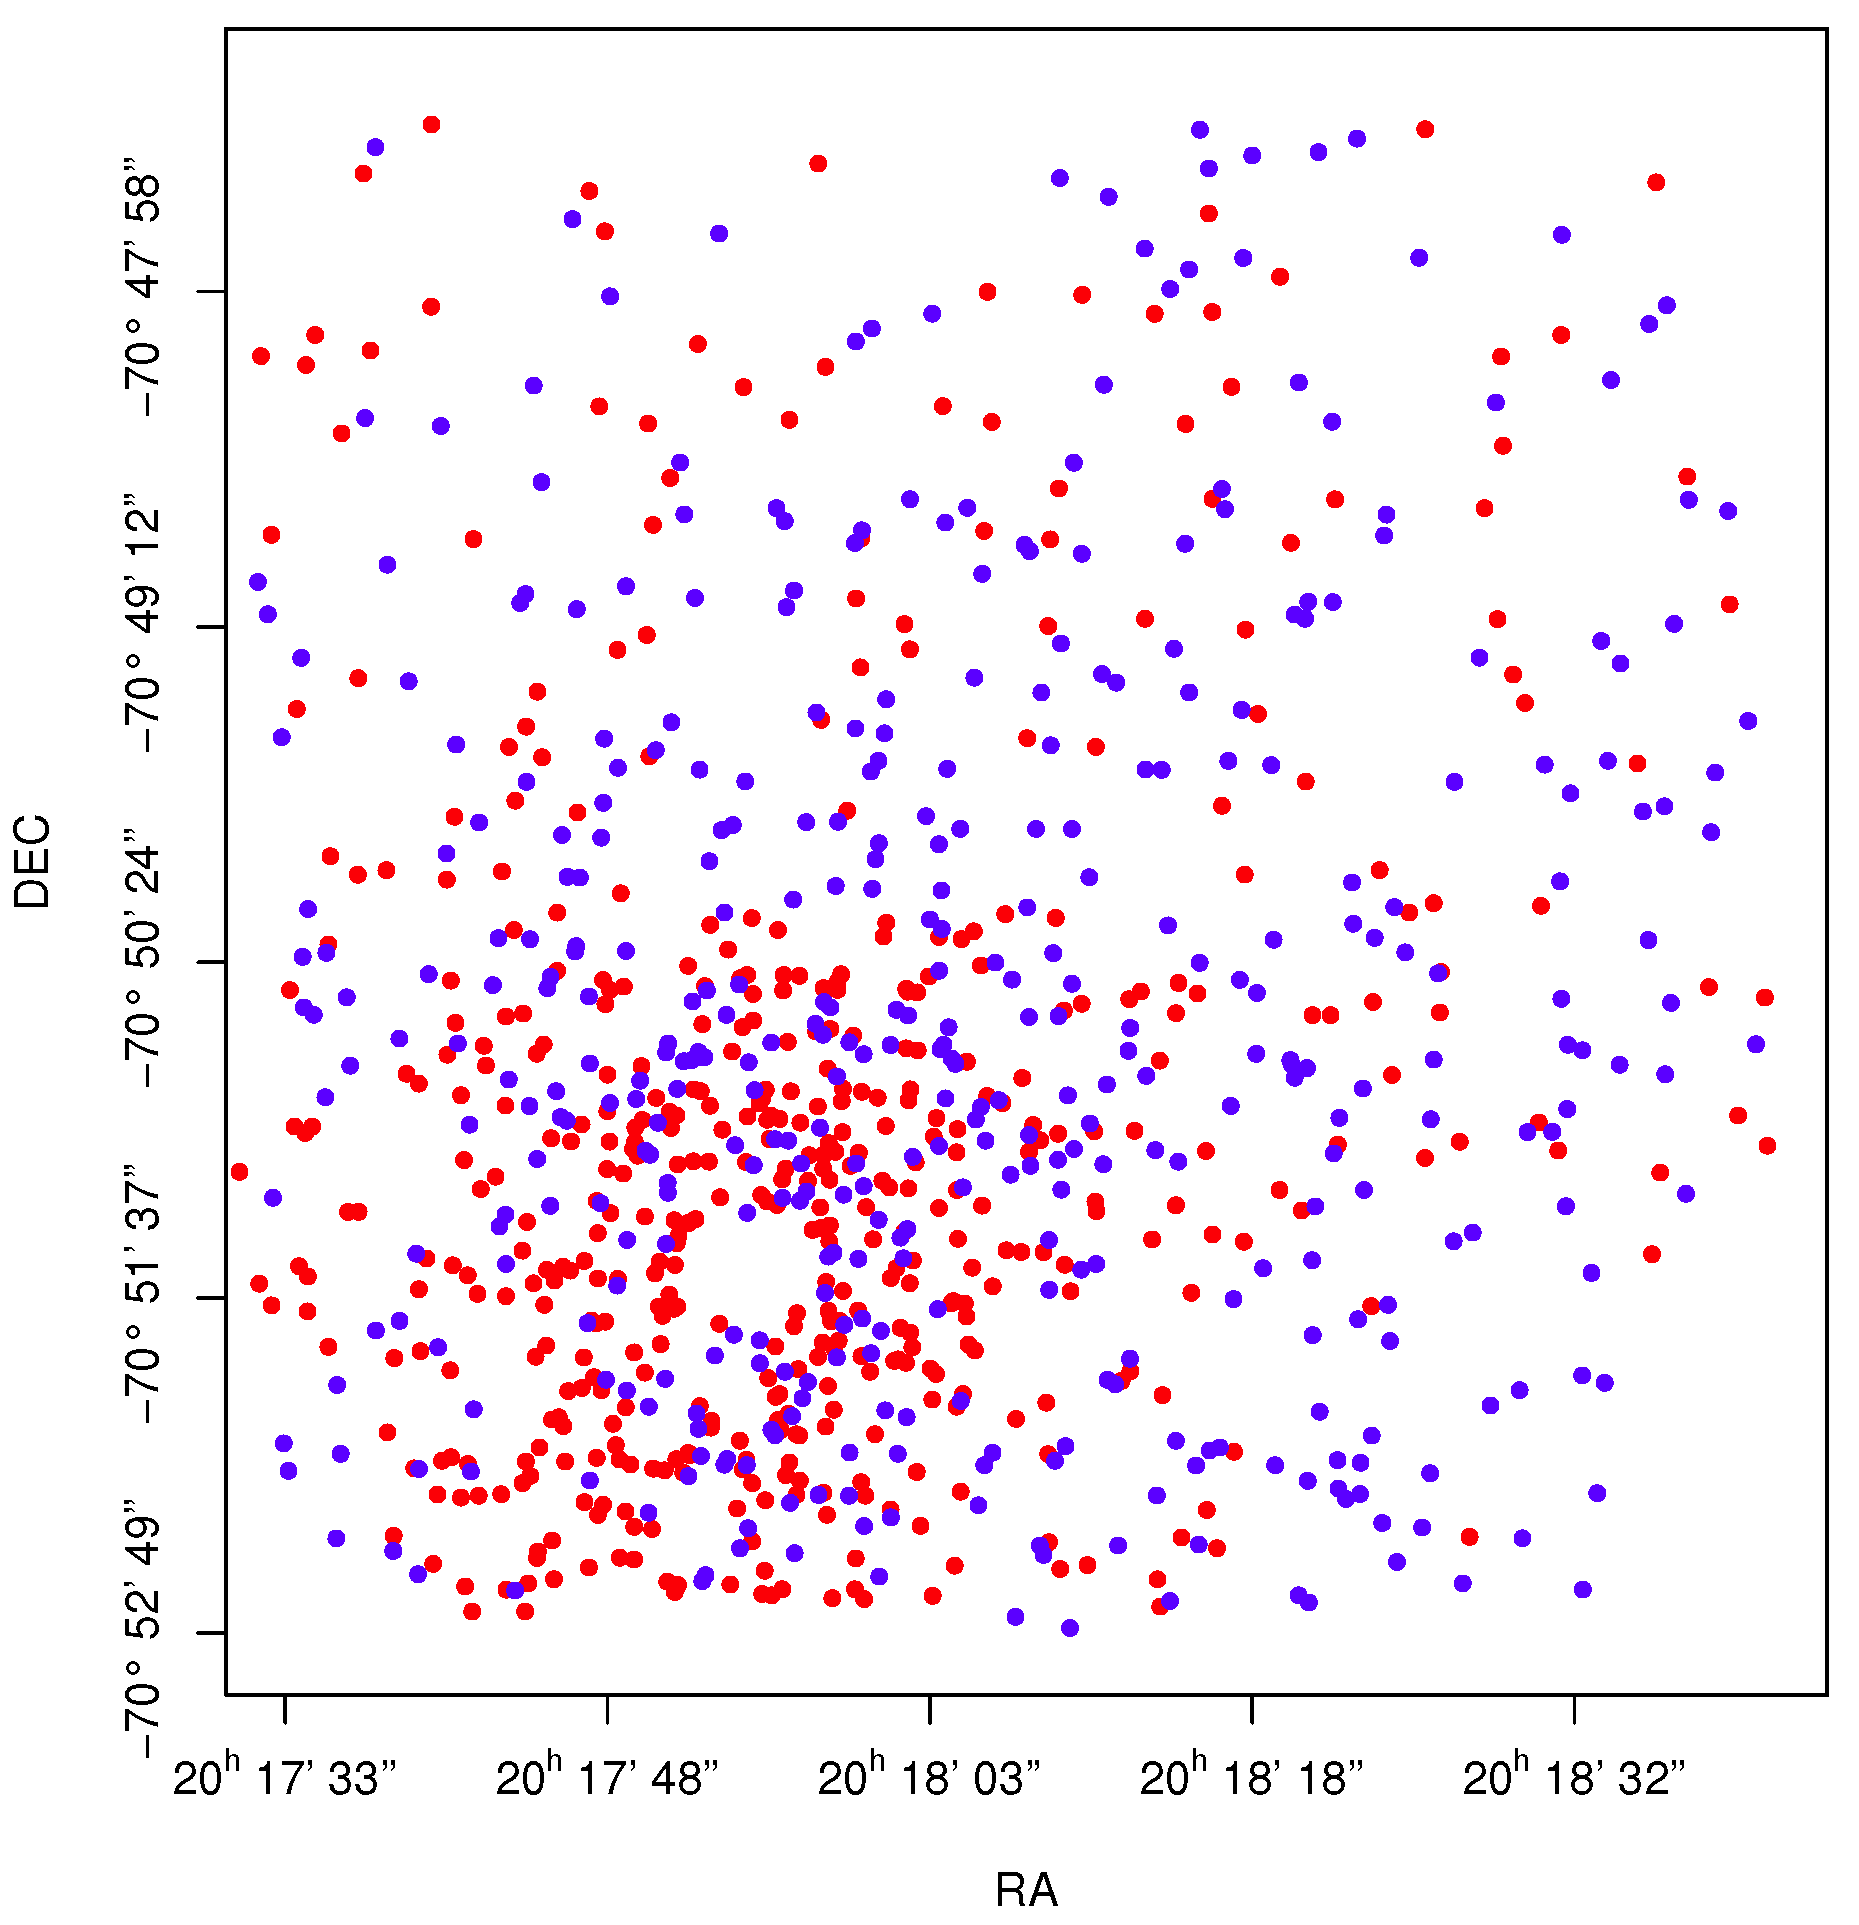
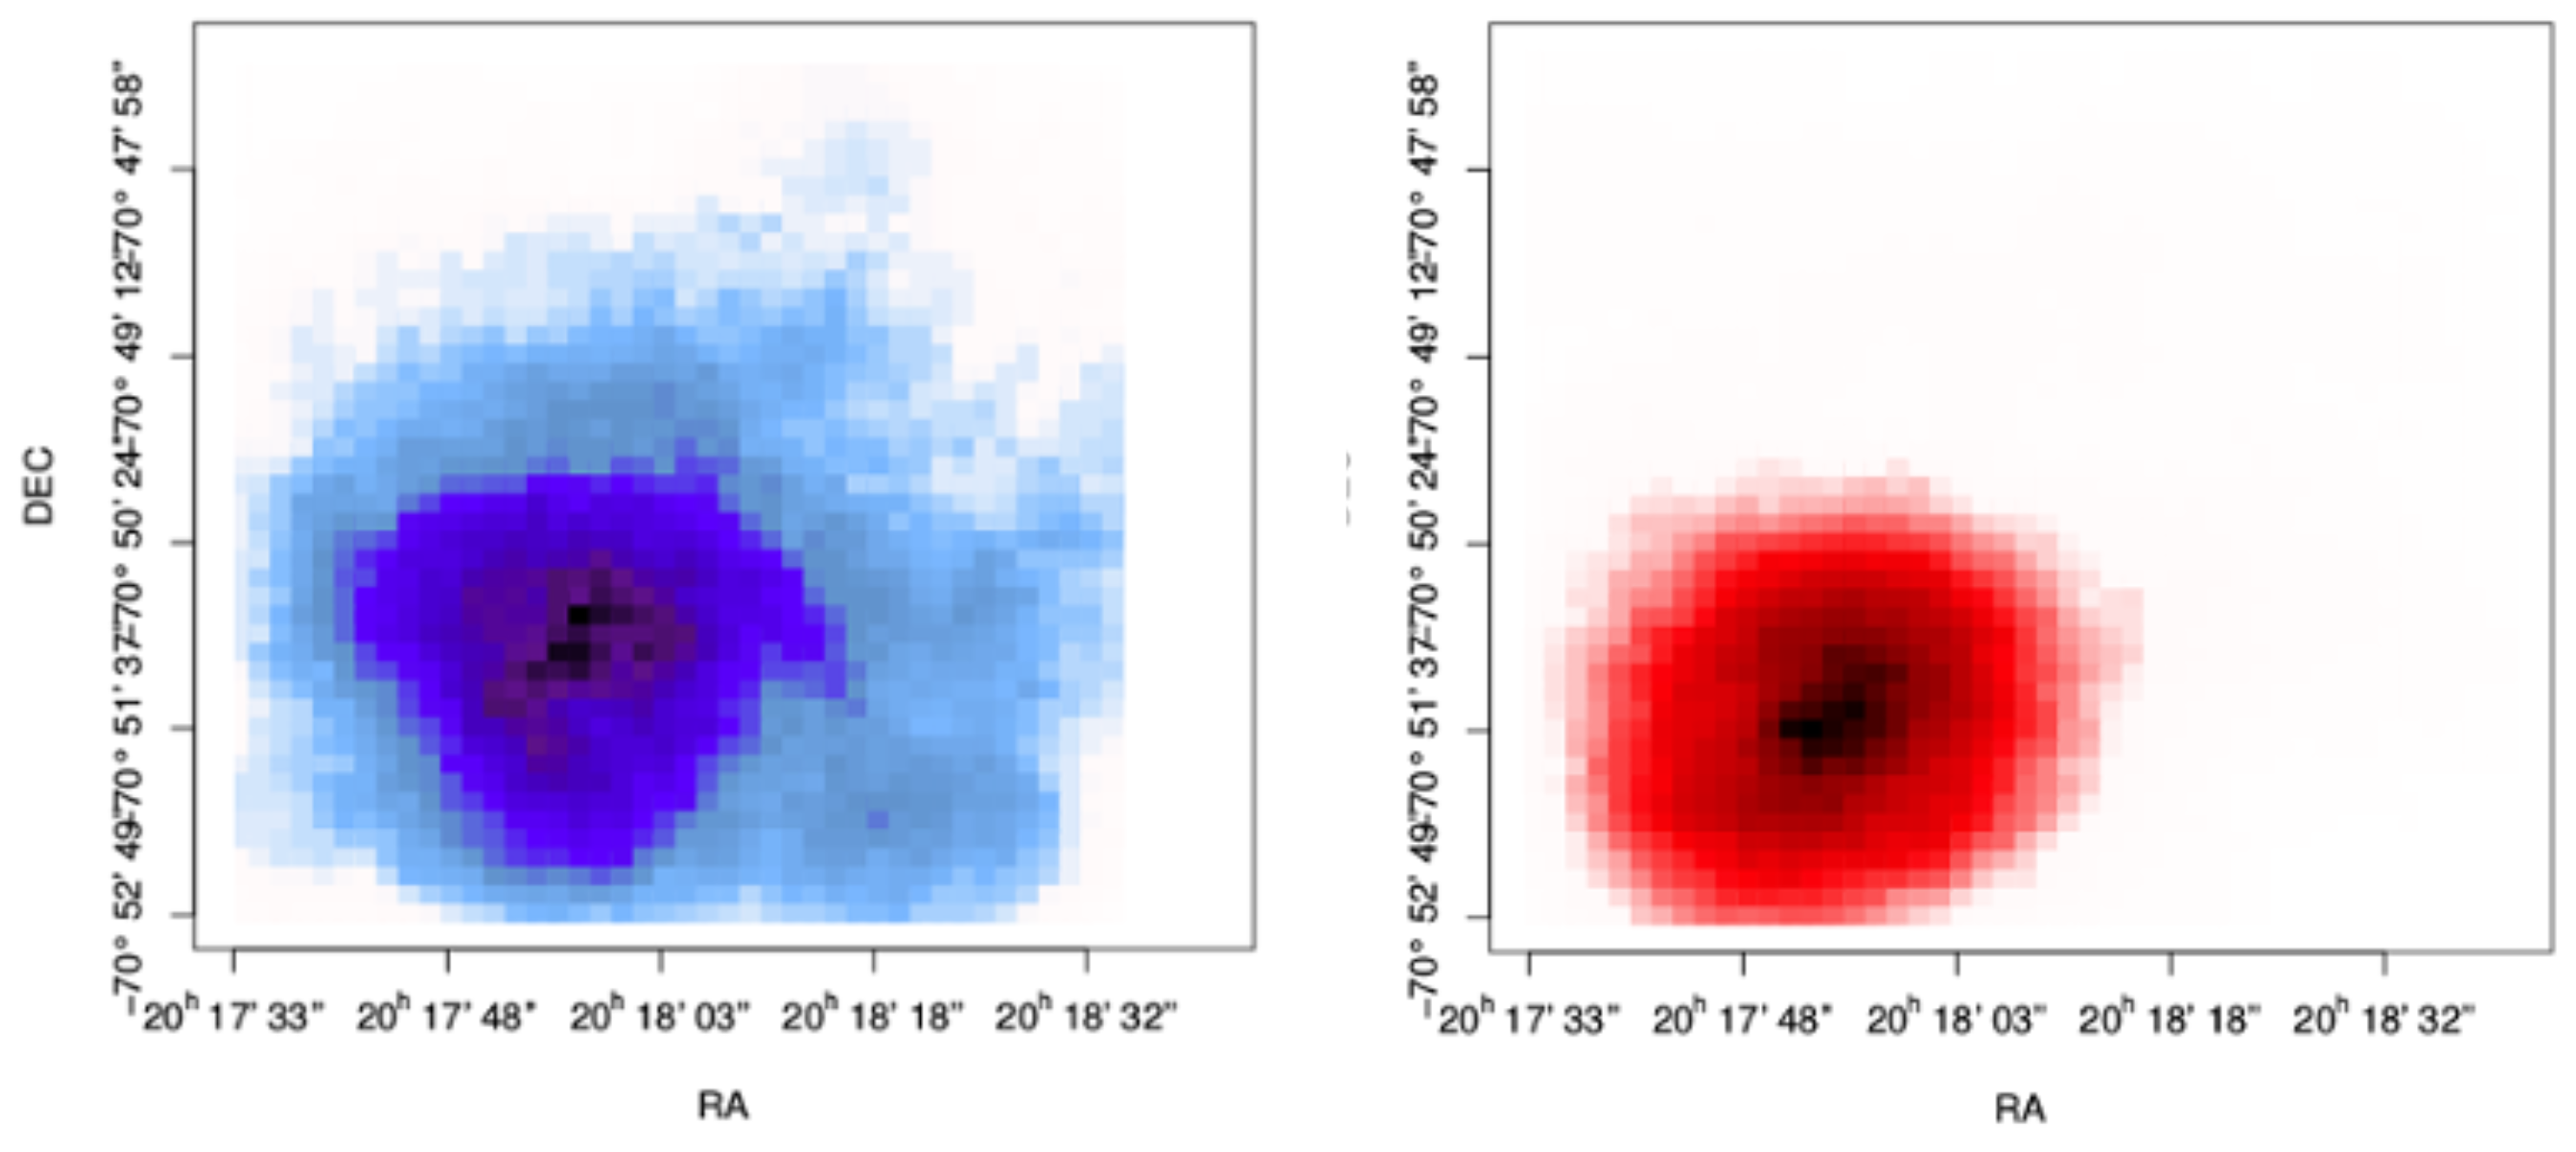
The spatial distribution is shown in Figure 3 and Figure 4 as discrete and smooth distributions, respectively. In both figures, it can be seen that there are GCs up to the borders of the image, indicating that the field does not cover the entirety of the system. From the color distribution, a limit of is taken to separate the richer (redder) and the poorer (bluer) GCs. The sub-populations show different behaviors, since the red sub-population is more concentrated towards the center whereas the blue sub-population is more disperse.
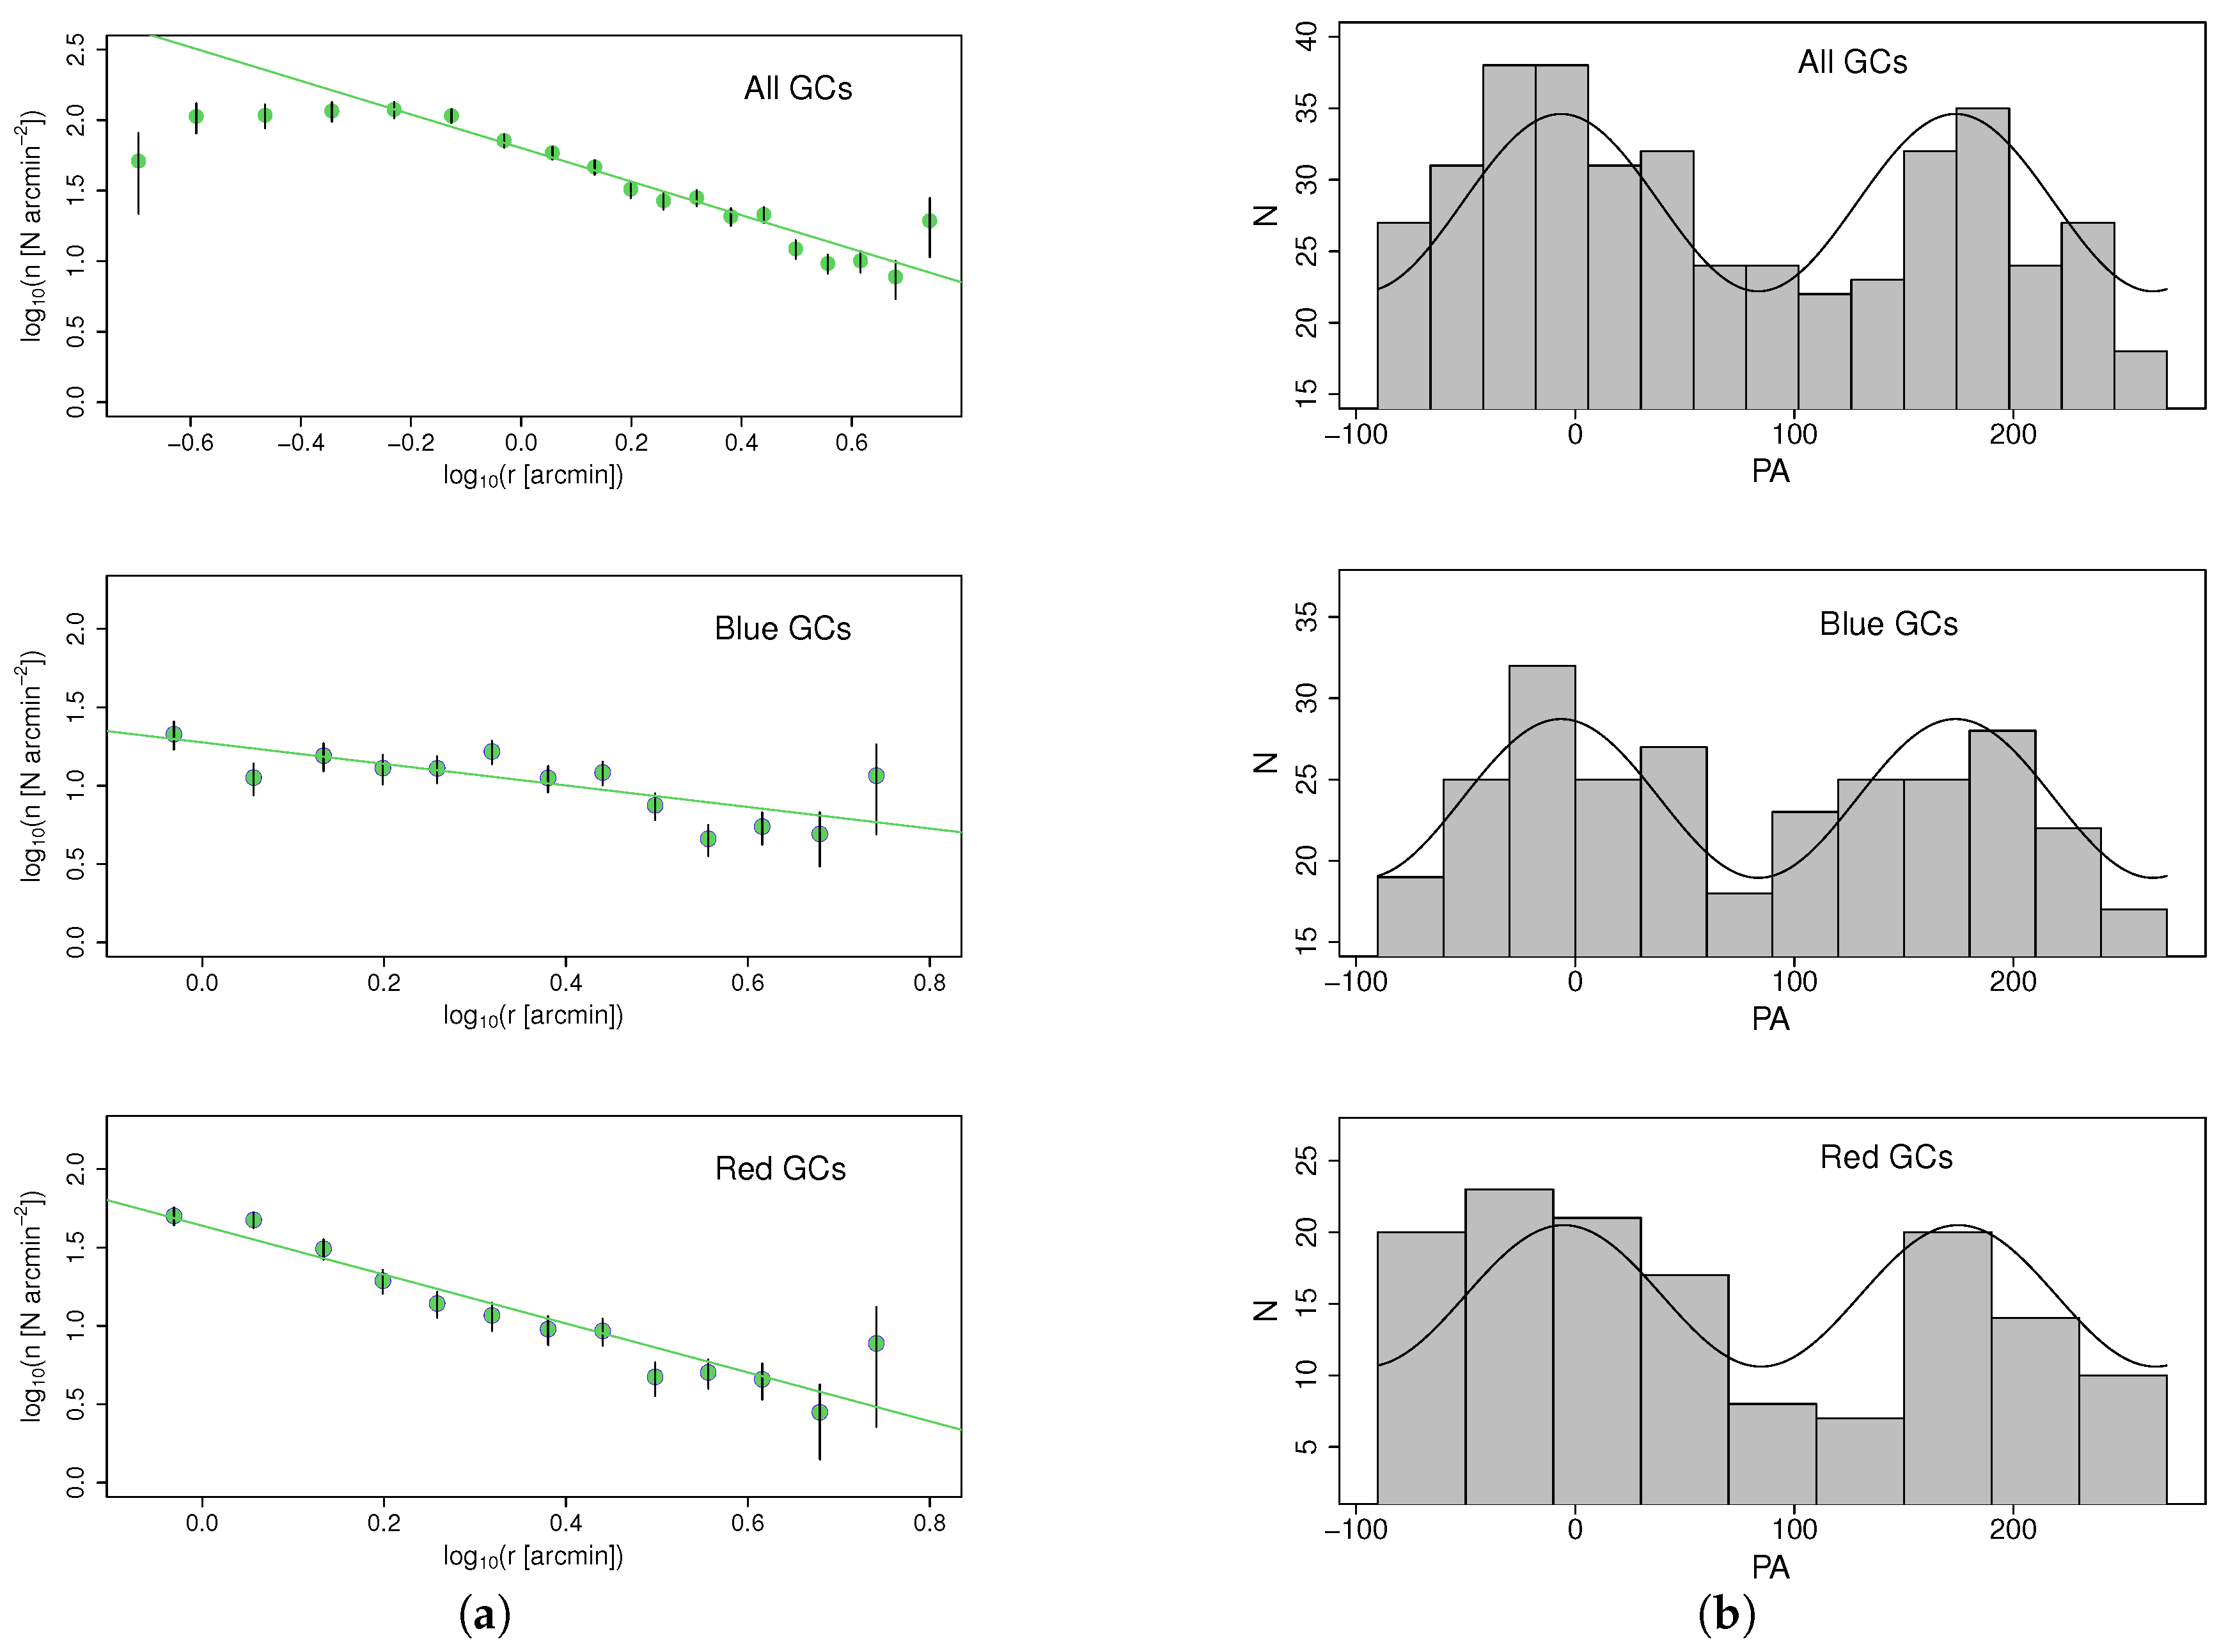
The previous result is confirmed by the radial distribution, shown in Figure 5a. Here, a power law was fitted to the distributions, and the slope obtained for the red sub-population is considerably larger than the one obtained for the blue sub-population and the one for the entire system, indicating that it is more concentrated towards the center. The plot for the totality of the GCs reaches the inner regions of the galaxy, showing that the distribution in this region turns flat. This is both because of the saturation of the images in this area, and because of the disruption of GCs being more frequent closer to the galactic center due to tidal forces being stronger.
In Figure 5b, we show the azimuthal distribution for the entire system and both sub-populations, with sinusoidal functions fitted in order to obtain the position angle of the semi-major axis of the ellipse described by each of them. In all cases, we obtained a position angle of ≈, indicating that both sub-populations are oriented in the same direction as the total system.
Acknowledgments
This work was funded with grants from Consejo Nacional de Investigaciones Científicas y Técnicas de la República Argentina (PIP 112-201101-00393), Agencia Nacional de Promoción Científica y Tecnológica (PICT-2013-0317), and Universidad Nacional de La Plata (UNLP 11-G124), Argentina. Based on observations obtained at the Gemini Observatory, which is operated by the Association of Universities for Research in Astronomy, Inc., under a cooperative agreement with the NSF on behalf of the Gemini partnership: the National Science Foundation (United States), the National Research Council (Canada), CONICYT (Chile), Ministerio de Ciencia, Tecnología e Innovación Productiva (Argentina), and Ministério da Ciência, Tecnologia e Inovação (Brazil). The Gemini programme ID is GS-2013B-Q-37. This research has made use of the NED, which is operated by the Jet Propulsion Laboratory, Caltech, under contract with the National Aeronautics and Space Administration.
Author Contributions
L.P.B. and J.P.C. conceived and designed the observing proposal. A.I.E. performed the data reduction as a part of her “Tesis de Licenciatura” at the UNLP and wrote the paper. All authors contributed to the data analysis.
Conflicts of Interest
The authors declare no conflict of interest.
Abbreviations
The following abbreviations are used in this manuscript:
| GC | Globular Cluster |
| PSF | Point Spread Function |
| GOA | Gemini Observatory Archive |
References
- Mendel, J.T.; Proctor, R.N.; Forbes, D.A. The age, metallicity and α-element abundance of Galactic globular clusters from single stellar population models. Mon. Notic. Roy. Astron. Soc. 2007, 379, 1618–1636. [Google Scholar] [CrossRef]
- Tonini, C. The Metallicity Bimodality of Globular Cluster Systems: A Test of Galaxy Assembly and of the Evolution of the Galaxy Mass-Metallicity Relation. Astrophys. J. 2013, 762, 39. [Google Scholar] [CrossRef]
- Bassino, L.P.; Caso, J.P. The merger remnant NGC 3610 and its globular cluster system: A large-scale study. Mon. Notic. Roy. Astron. Soc. 2017, 466, 4259–4271. [Google Scholar] [CrossRef]
- Brodie, J.P.; Strader, J. Extragalactic Globular Clusters and Galaxy Formation. Annu. Rev. Astron. Astrophys. 2006, 44, 193–267. [Google Scholar] [CrossRef]
- Blakeslee, J.P.; Lucey, J.R.; Barris, B.J.; Hudson, M.J.; Tonry, J.L. A synthesis of data from fundamental plane and surface brightness fluctuation surveys. Mon. Notic. Roy. Astron. Soc. 2001, 327, 1004–1020. [Google Scholar] [CrossRef]
- Machacek, M.E.; Nulsen, P.; Stirbat, L.; Jones, C.; Forman, W.R. XMM-Newton Observation of an X-ray Trail between the Spiral Galaxy NGC 6872 and the Central Elliptical Galaxy NGC 6876 in the Pavo Group. Astrophys. J. 2005, 630, 280–297. [Google Scholar] [CrossRef]
- Machacek, M.; Ashby, M.L.N.; Jones, C.; Forman, W.R.; Bastian, N. A Multiwavelength View of Star Formation in Interacting Galaxies in the Pavo Group. Astrophys. J. 2009, 691, 1921–1935. [Google Scholar] [CrossRef]
- Bassino, L.P.; Faifer, F.R.; Forte, J.C.; Dirsch, B.; Richtler, T.; Geisler, D.; Schuberth, Y. Large-scale study of the NGC 1399 globular cluster system in Fornax. Astron. Astrophys. 2006, 451, 789–796. [Google Scholar] [CrossRef]
- Smith, J.A.; Tucker, D.L.; Kent, S.; Richmond, M.W.; Fukugita, M.; Ichikawa, T.; Hamabe, M. The u’g’r’i’z’ Standard-Star System. Astron. J. 2002, 123, 2121–2144. [Google Scholar] [CrossRef]
- Bertin, E.; Arnouts, S. SExtractor: Software for source extraction. Astron. Astrophys. Suppl. Ser. 1996, 117, 393–404. [Google Scholar] [CrossRef]
- Faifer, F.R.; Forte, J.C.; Norris, M.A.; Bridges, T.; Forbes, D.A.; Zepf, S.E.; Sharples, R.M. Gemini/GMOS imaging of globular cluster systems in five early-type galaxies. Mon. Notic. Roy. Astron. Soc. 2011, 416, 155–177. [Google Scholar] [CrossRef]
- Mieske, S.; Hilker, M.; Infante, L.; Jordán, A. Spectroscopic Metallicities for Fornax Ultracompact Dwarf Galaxies, Globular Clusters, and Nucleated Dwarf Elliptical Galaxies. Astron. J. 2006, 131, 2442–2451. [Google Scholar] [CrossRef]
- Muratov, A.L.; Gnedin, O.Y. Modeling the Metallicity Distribution of Globular Clusters. Astrophys. J. 2010, 718, 1266–1288. [Google Scholar] [CrossRef]
Figure 1.
Color-magnitude diagram for all point-like objects. Green dots represent the globular cluster (GC) candidates.
Figure 1.
Color-magnitude diagram for all point-like objects. Green dots represent the globular cluster (GC) candidates.

Figure 2.
Color distributions for the entire population of GC candidates, and for different ranges of galactocentric distance. The left panel shows a bimodal fit in dashed lines, while the right panel shows a unimodal fit in dashed lines. Solid lines represent smoothed density in both.
Figure 2.
Color distributions for the entire population of GC candidates, and for different ranges of galactocentric distance. The left panel shows a bimodal fit in dashed lines, while the right panel shows a unimodal fit in dashed lines. Solid lines represent smoothed density in both.
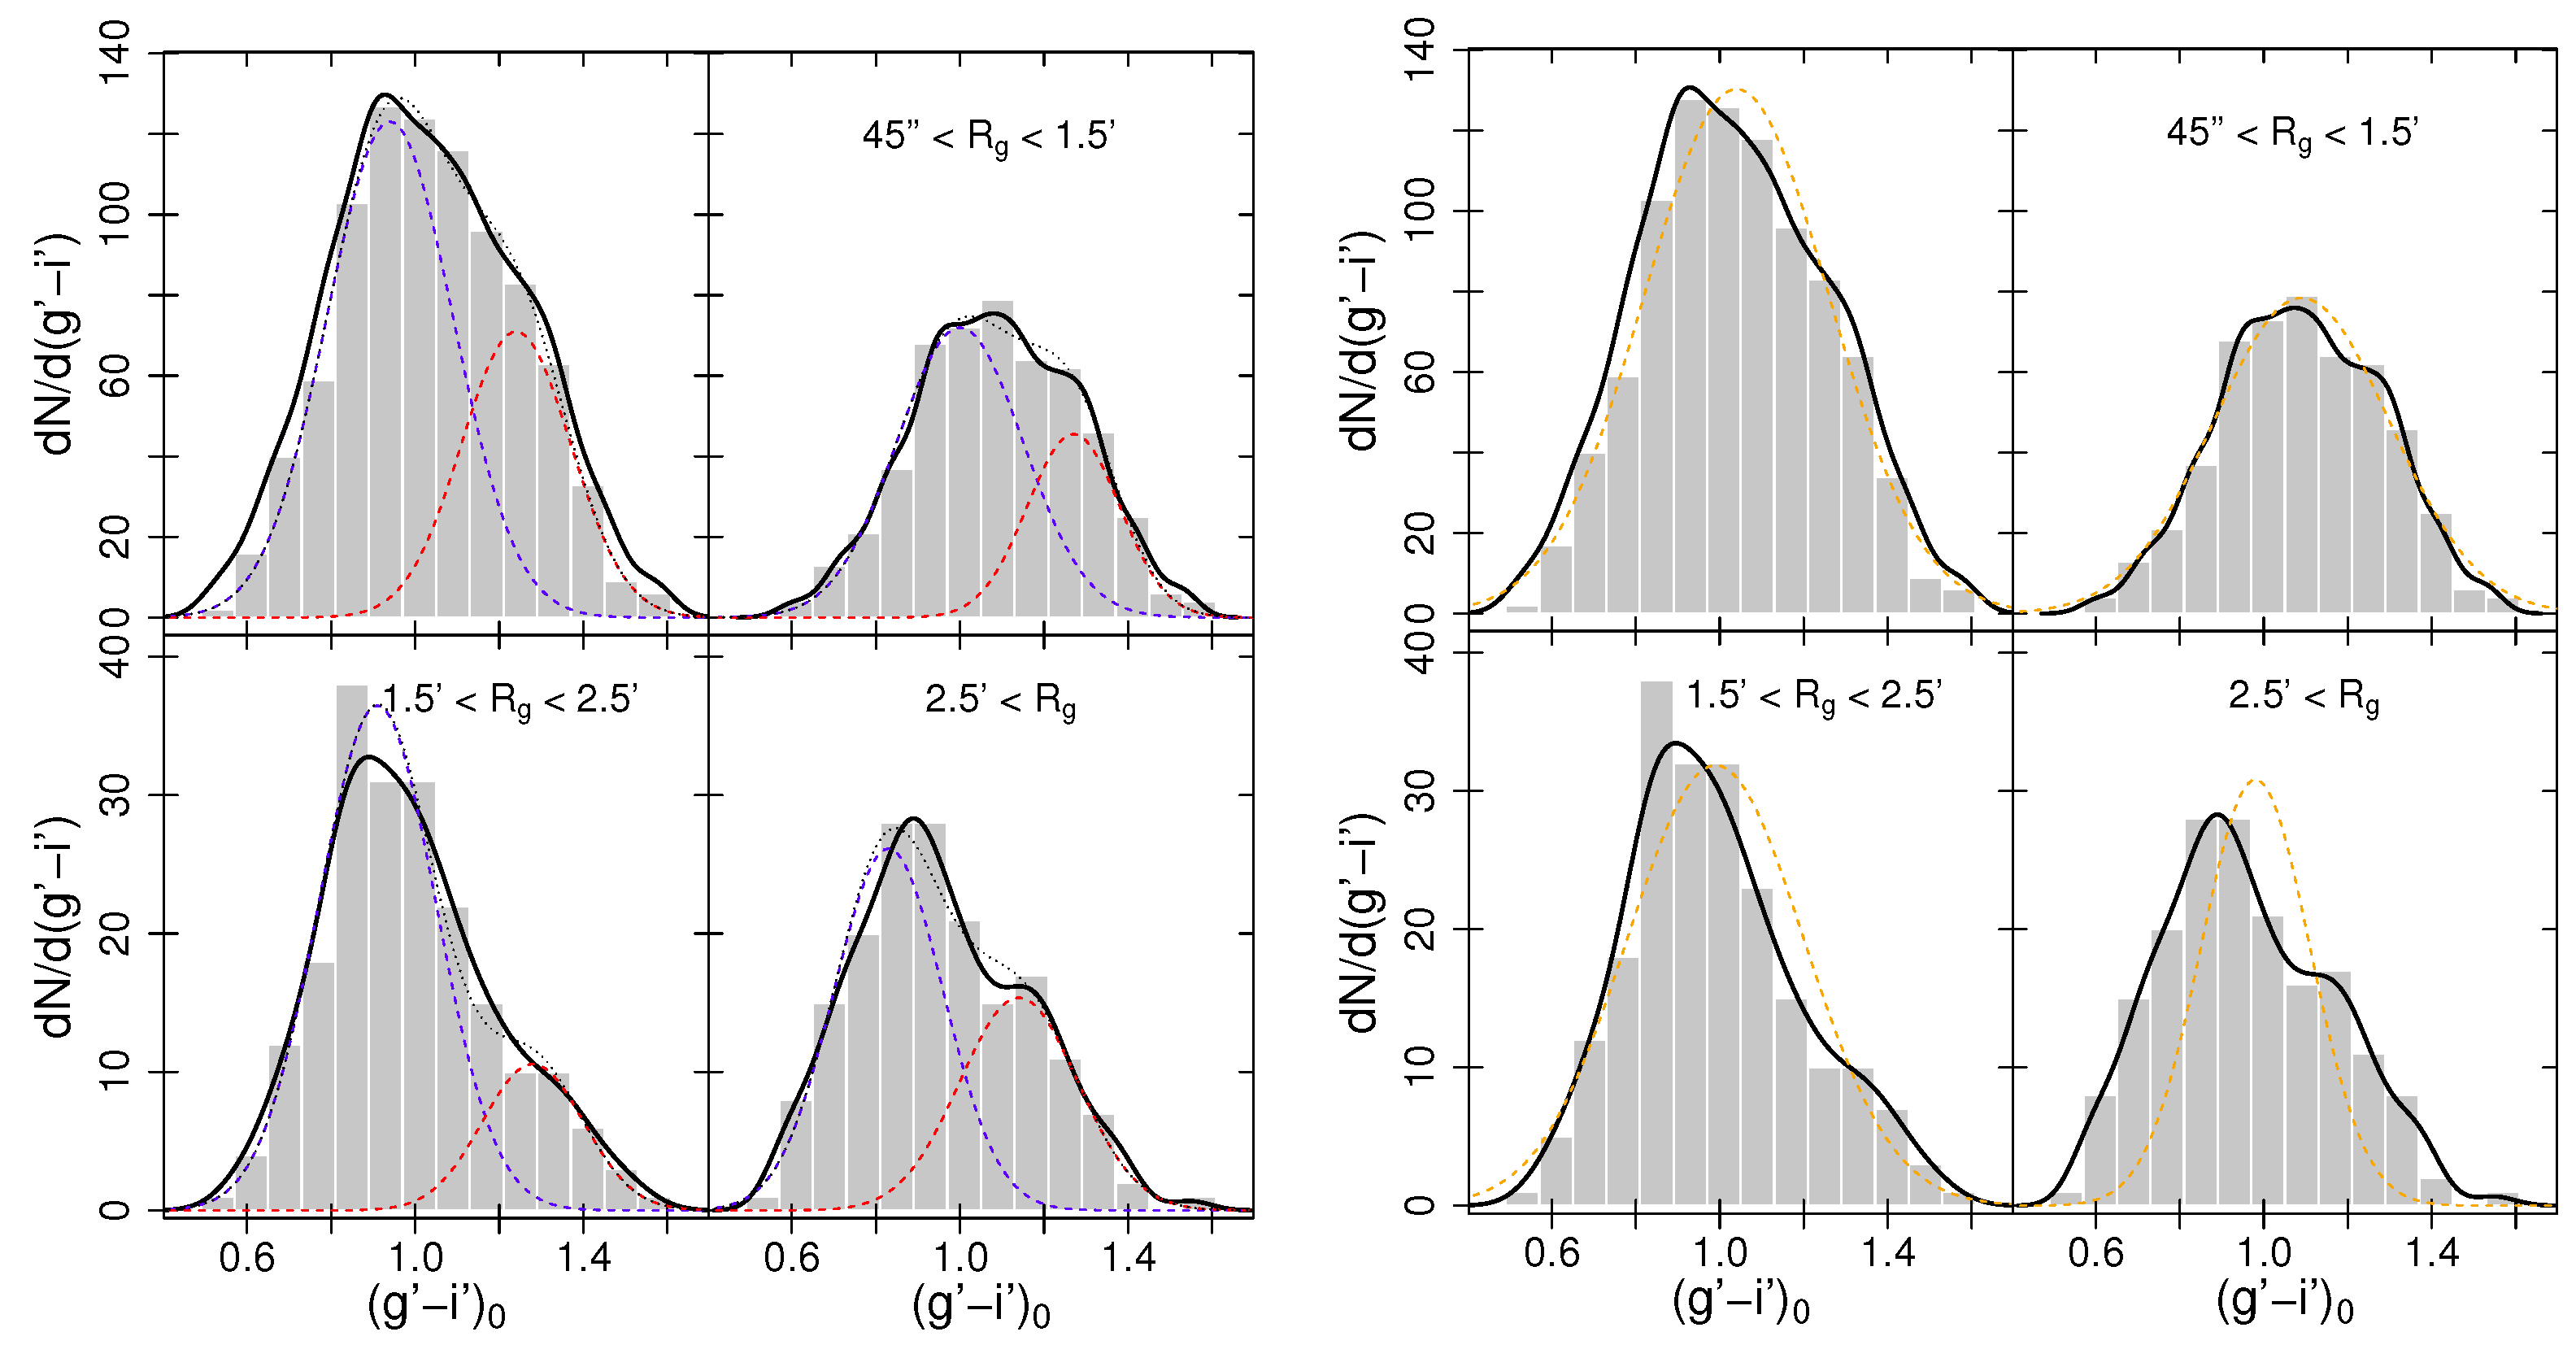
Figure 3.
Spatial distribution for all GCs. Red and blue dots separate the metal-rich and metal-poor sub-populations, with the limit between them (obtained from the color distribution) at .
Figure 3.
Spatial distribution for all GCs. Red and blue dots separate the metal-rich and metal-poor sub-populations, with the limit between them (obtained from the color distribution) at .

Figure 4.
Smoothed spatial distribution for both sub-populations, blue on the left, red on the right.
Figure 4.
Smoothed spatial distribution for both sub-populations, blue on the left, red on the right.

Figure 5.
(a) In the left panel, we have the radial distribution for the entire system and both sub-populations. A power law (solid line) was fitted to the three distributions; (b) In the right panel, the azimuthal distribution for the entire system and both sub-populations is presented. The black line represents the sinusoidal fit.
© 2017 by the authors. Licensee MDPI, Basel, Switzerland. This article is an open access article distributed under the terms and conditions of the Creative Commons Attribution (CC BY) license (http://creativecommons.org/licenses/by/4.0/).
Share and Cite
MDPI and ACS Style
Ennis, A.I.; Bassino, L.P.; Caso, J.P. The Globular Cluster System of the Galaxy NGC 6876. Galaxies 2017, 5, 30. https://doi.org/10.3390/galaxies5030030
AMA Style
Ennis AI, Bassino LP, Caso JP. The Globular Cluster System of the Galaxy NGC 6876. Galaxies. 2017; 5(3):30. https://doi.org/10.3390/galaxies5030030
Chicago/Turabian StyleEnnis, Ana Inés, Lilia Patricia Bassino, and Juan Pablo Caso. 2017. "The Globular Cluster System of the Galaxy NGC 6876" Galaxies 5, no. 3: 30. https://doi.org/10.3390/galaxies5030030
Note that from the first issue of 2016, this journal uses article numbers instead of page numbers. See further details here.