1. Introduction
Theories of galaxy formation within the currently accepted
Cold Dark Matter cosmological paradigm predict that galaxies grow through a combination of in situ star formation and accretion of stars from other galaxies [
1]. The ratio of stellar mass contributed by these two modes of growth is expected to change systematically over the lifetime of a galaxy as its dark matter halo and star formation efficiency evolve (e.g., [
2]). Accreted stars are expected to dominate in the outer parts of galaxies because they have much lower binding energies in the host galaxy than stars formed by dissipative collapse. Since dynamical timescales are long in these outer regions, phase-space substructures related to accretion, such as streams and caustics, can persist over many gigayears.
The structural properties of the outer parts of galaxies and their correlations with stellar mass and other observables might therefore provide ways of testing theoretical predictions of growth by accretion. In this paper we use extremely deep images of six massive early-type galaxies (ETGs) from the VEGAS survey (described below) to constrain the properties of their accreted stellar components.
In ETGs the connections between different mechanisms of mass growth and the ’structural components’ inferred from images are not straightforward. If the bulk of the stars are really accreted, then the accreted component (or ’spheroid’ or ’classical bulge’) should be identified with at least the structural component that dominates the observed stellar mass. However, other empirical ’components’ might also be accreted. In situ stars in ETGs are extremely difficult to distinguish if the also follow a spheroidal, dispersion supported spatial distribution and have old, metal-rich stellar populations resembling those of the dominant accreted component(s) with which they have been thoroughly mixed by violent relaxation.
Cosmological dynamical simulations can help by suggesting plausible interpretations for features in the surface brightness profiles of ETGs in the context of specific galaxy formation theories. In particular, simulated galaxies show evidence of substructure in the form of inflections (’breaks’), at which the surface brightness profile either becomes steeper or shallower (e.g., [
3,
4]). These inflections also correspond to variations in the ratio between individual accreted components as a function of radius [
5,
6,
7].
Using different techniques with observations of different depths, several authors have concluded that the profiles of massive ETGs are not well described by a single Sérsic
law component, once thought to be near universal for spheroidal galaxies. Taking advantage of the wide field of view and high spatial resolution of the VLT Survey Telescope (VST; [
8]) at the ESO Cerro Paranal Observatory (Chile), we carried out deep and detailed photometric mapping of six massive early-type galaxies (ETGs) in the VEGAS sample.
2. The VEGAS Survey
The VST Elliptical GAlaxies Survey (VEGAS, [
9]) is a deep multi-band (g, r, i) imaging survey of early-type galaxies in the southern hemisphere carried out with VST at the ESO Cerro Paranal Observatory (Chile). The large field of view (FOV) of the OmegaCAM mounted on VST (one square degree matched by pixels 0.21 arcsec wide), together with its high efficiency and spatial resolution allows us to map with a reasonable integration time the surface brightness of a galaxy out to isophotes encircling about 95% of the total light.
The expected depths at a signal-to-noise ratio (S/N) of >3 in the g, r, and i bands are 31, 28, and 27 mag/arcsec, respectively. The main science goals of the VEGAS survey are: (1) to study the 2D light distribution out to at least ∼10 effective radii, , focusing on the galaxy structural parameters and the diffuse light component, highlighting the presence of inner substructures as a signature of recent cannibalism events and/or inner discs and bars fuelling the active nucleus that is present in almost all objects of our sample; (2) to map the surface brightness profile and isophote geometry out to 10 or more; (3) to analyse the colour gradients and their connection with galaxy formation theories, also taking advantage of stellar population synthesis techniques; (4) to study the external low surface brightness structures of the galaxies and the connection with the environment; (5) to make a census of small stellar systems (GCs, ultra-compact dwarfs and galaxy satellites) out to ∼20 Re from the main galaxy center, and their photometric properties (e.g., GC luminosity function and colors, and their radial changes out to several Re), allowing us to study the properties of GCs in the outermost “fossil” regions of the host galaxy.
The data used in this work consist of exposures in g and i SDSS bands obtained with VST + OmegaCAM, both in service and visitor mode, for six giant ETGs: NGC 3923, NGC 4365, NGC 5044 and NGC 5846, and those of NGC 4472 and NGC 1399 (published by Capaccioli et al. [
9] and Iodice et al. [
10], respectively). More details about the observing strategy can be found in Spavone et al. [
11] and in
Section 5.
3. Fitting the Light Distribution
Since there is considerable evidence in the literature that the light profiles of many of the most massive ETGs are not well fitted by a single Sérsic law and at least one additional component is needed [
12,
13], our analysis focusses on the fit of projected one-dimensional (ellipsoidally averaged) surface brightness profiles of our sample galaxies (see
Section 5 for details).
We adopt an empirically motivated, two-component approach most common in the literature, as well as an alternative approach, which is motivated by the predictions of numerical simulations, in which we fitted the surface brightness profiles of our galaxies with three components: two dominant Sérsic components and an outer exponential component.
Theoretical models suggest that massive ETGs accumulate the bulk of their stellar mass by accretion. For this reason, the accreted component in these galaxies should be identified with the component dominating the stellar mass. From an observational point of view, it is not straightforward to separate the in situ and the accreted component in ETGs, since they have similar physical properties and are well mixed together. The overall profile is comprised of different contributions and for this reason theory suggests that the surface brightness profile of ETGs should be described by the superposition of different components.
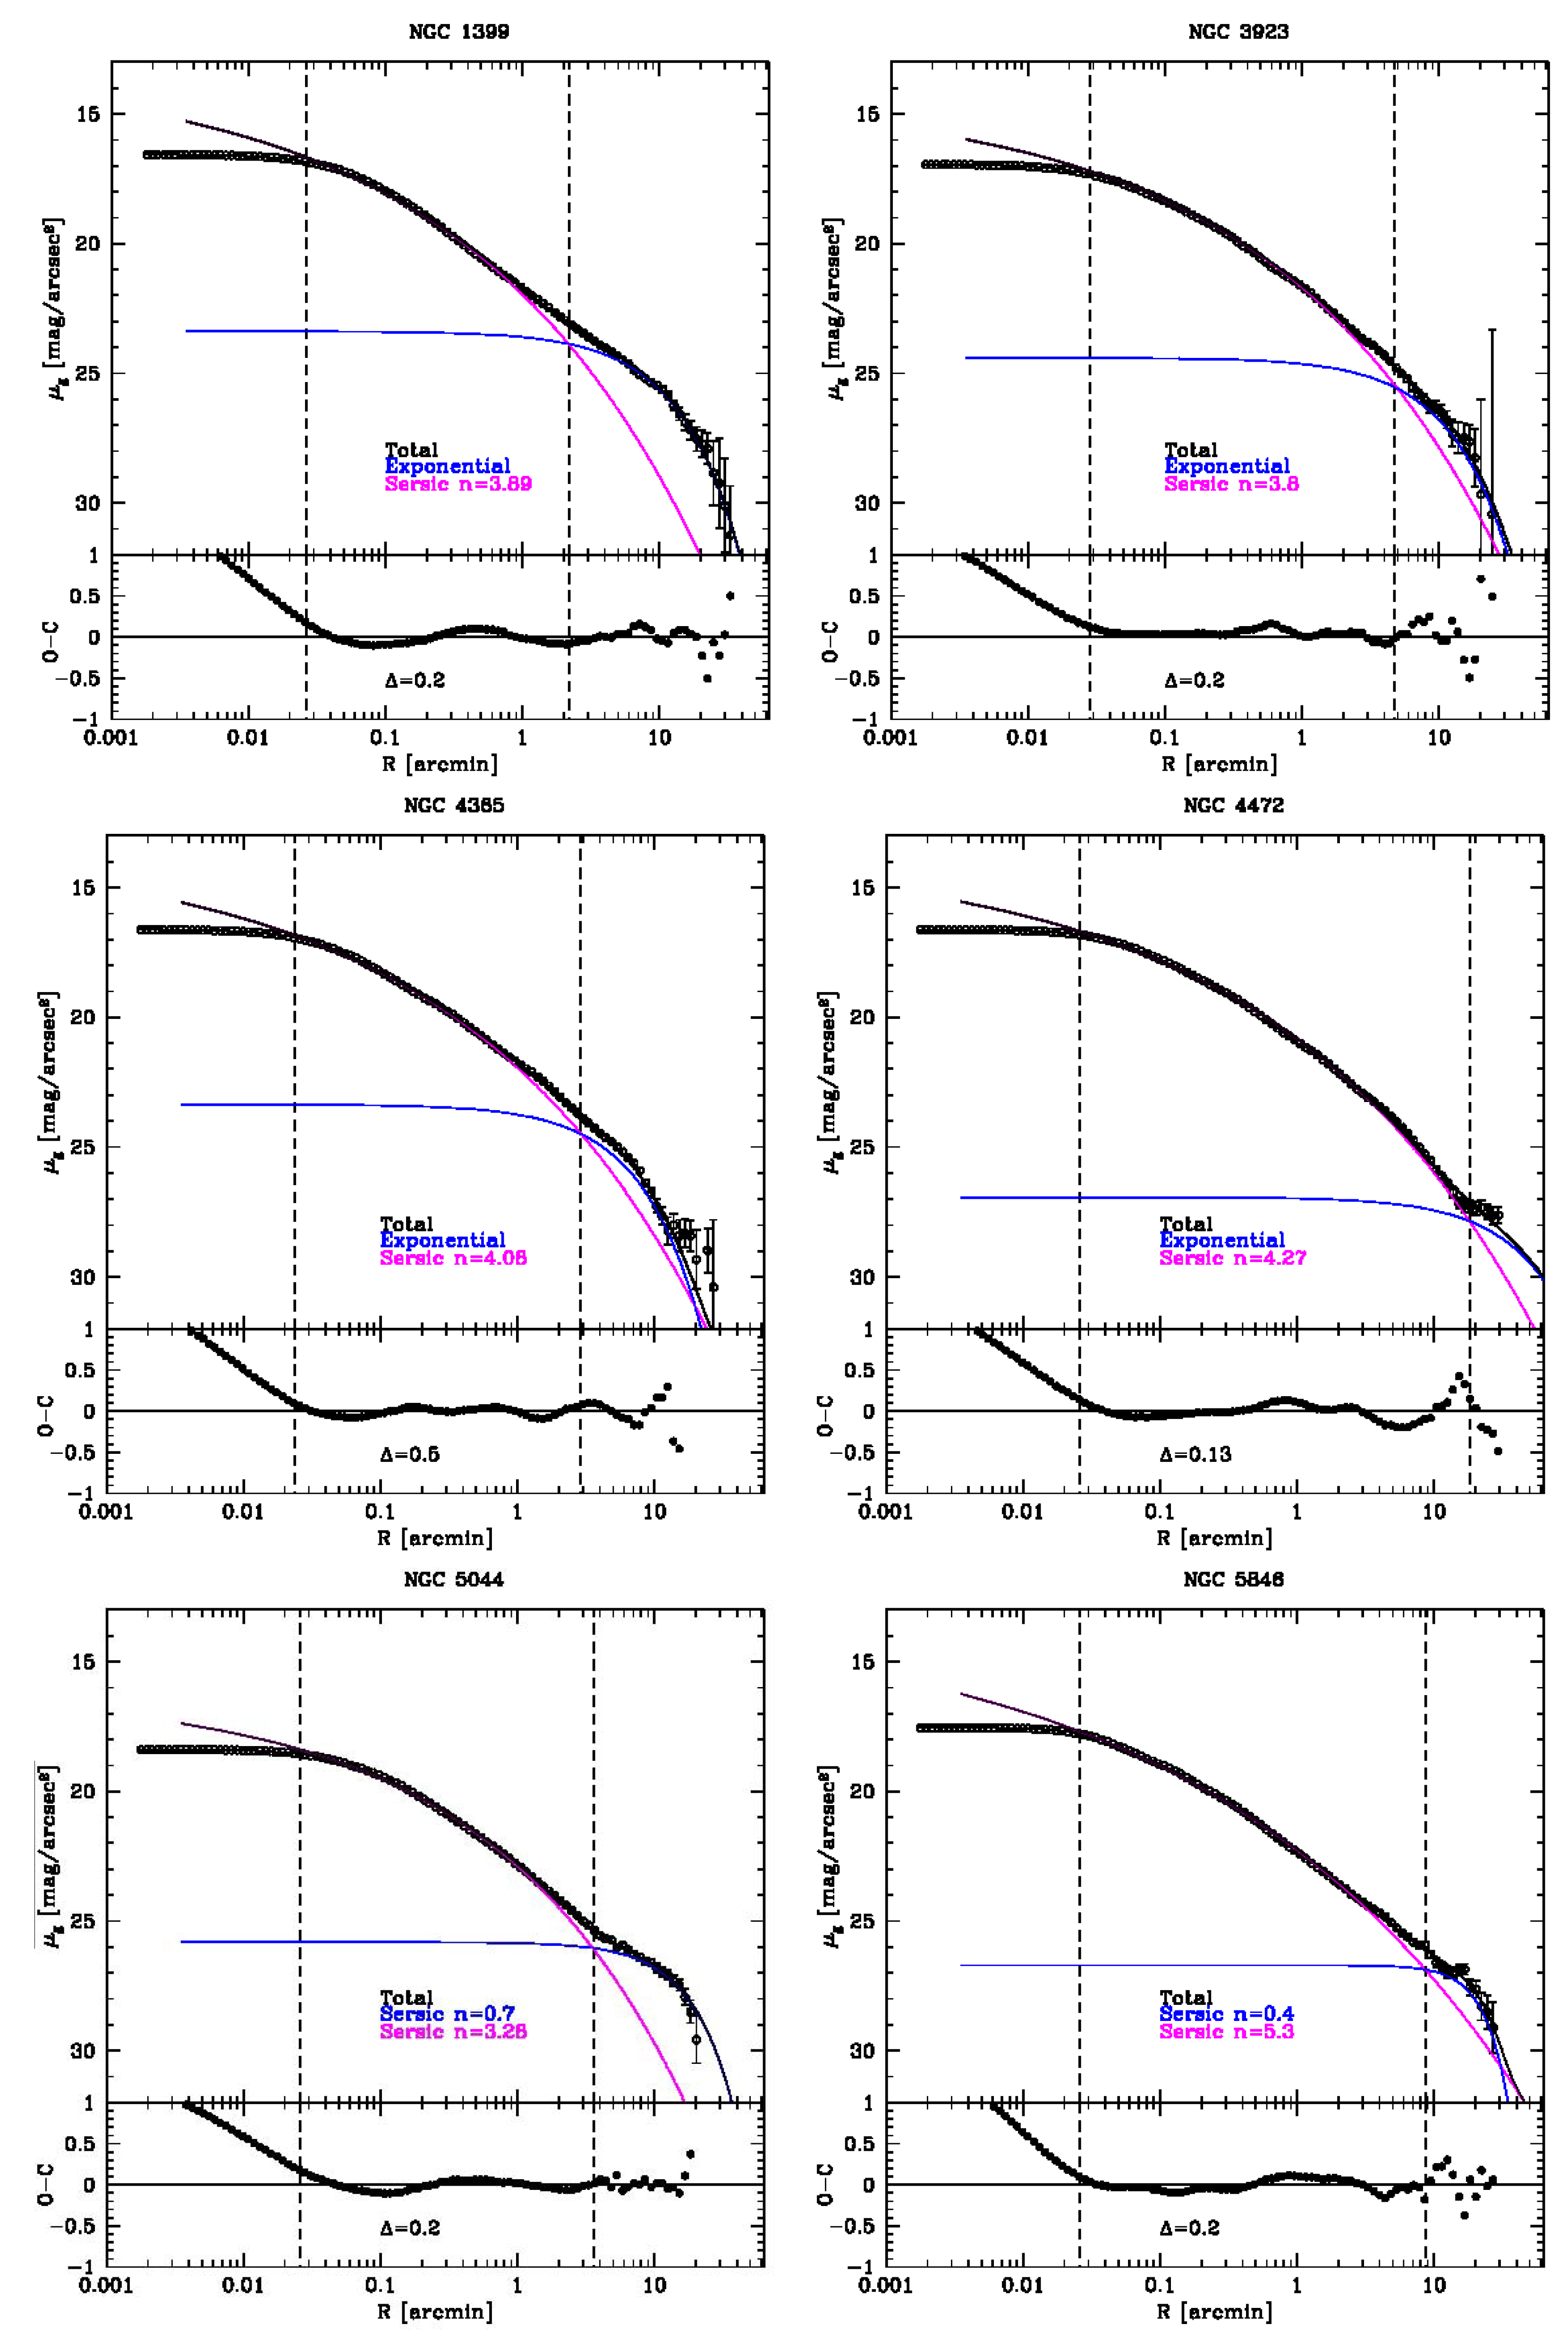
3.1. Two Components Fits
We first present models of the surface brightness profiles of galaxies in our sample with a double Sérsic law [
14,
15],
where
,
R is the galactocentric radius, and
and
are the effective radius and surface brightness. We found that this model converges to a best-fit solution with a physically meaningful value for only two galaxies, NGC5044 and NGC 5846. For the cases in which our double-Sérsic fit did not converge, we imposed an exponential profile
on the outer component, given by the equation
where
and
are the central surface brightness and exponential scale length, respectively. The result of these fits and their residuals are shown in
Figure 1.
We found that the inner components of each fit have effective radii
5–25 kpc (45–202 arcsec), with an average value of
12 kpc, and Sérsic indices
3–6, with an average value of
4.3. These values are consistent with those reported by Gonzalez et al. [
16] and Donzelli et al. [
12], who for their samples of BCGs found
5–15 kpc and
4.4.
The relative contribution of the outer halo with respect to the total galaxy light () estimated from these our two component fits, ranges between 27% to 64%. Since there is no clear reason to believe that in massive elliptical galaxies the outer component in a fit such as this accounts for most of the accreted mass, these halo mass fractions should be considered a lower limit for the total accreted mass.
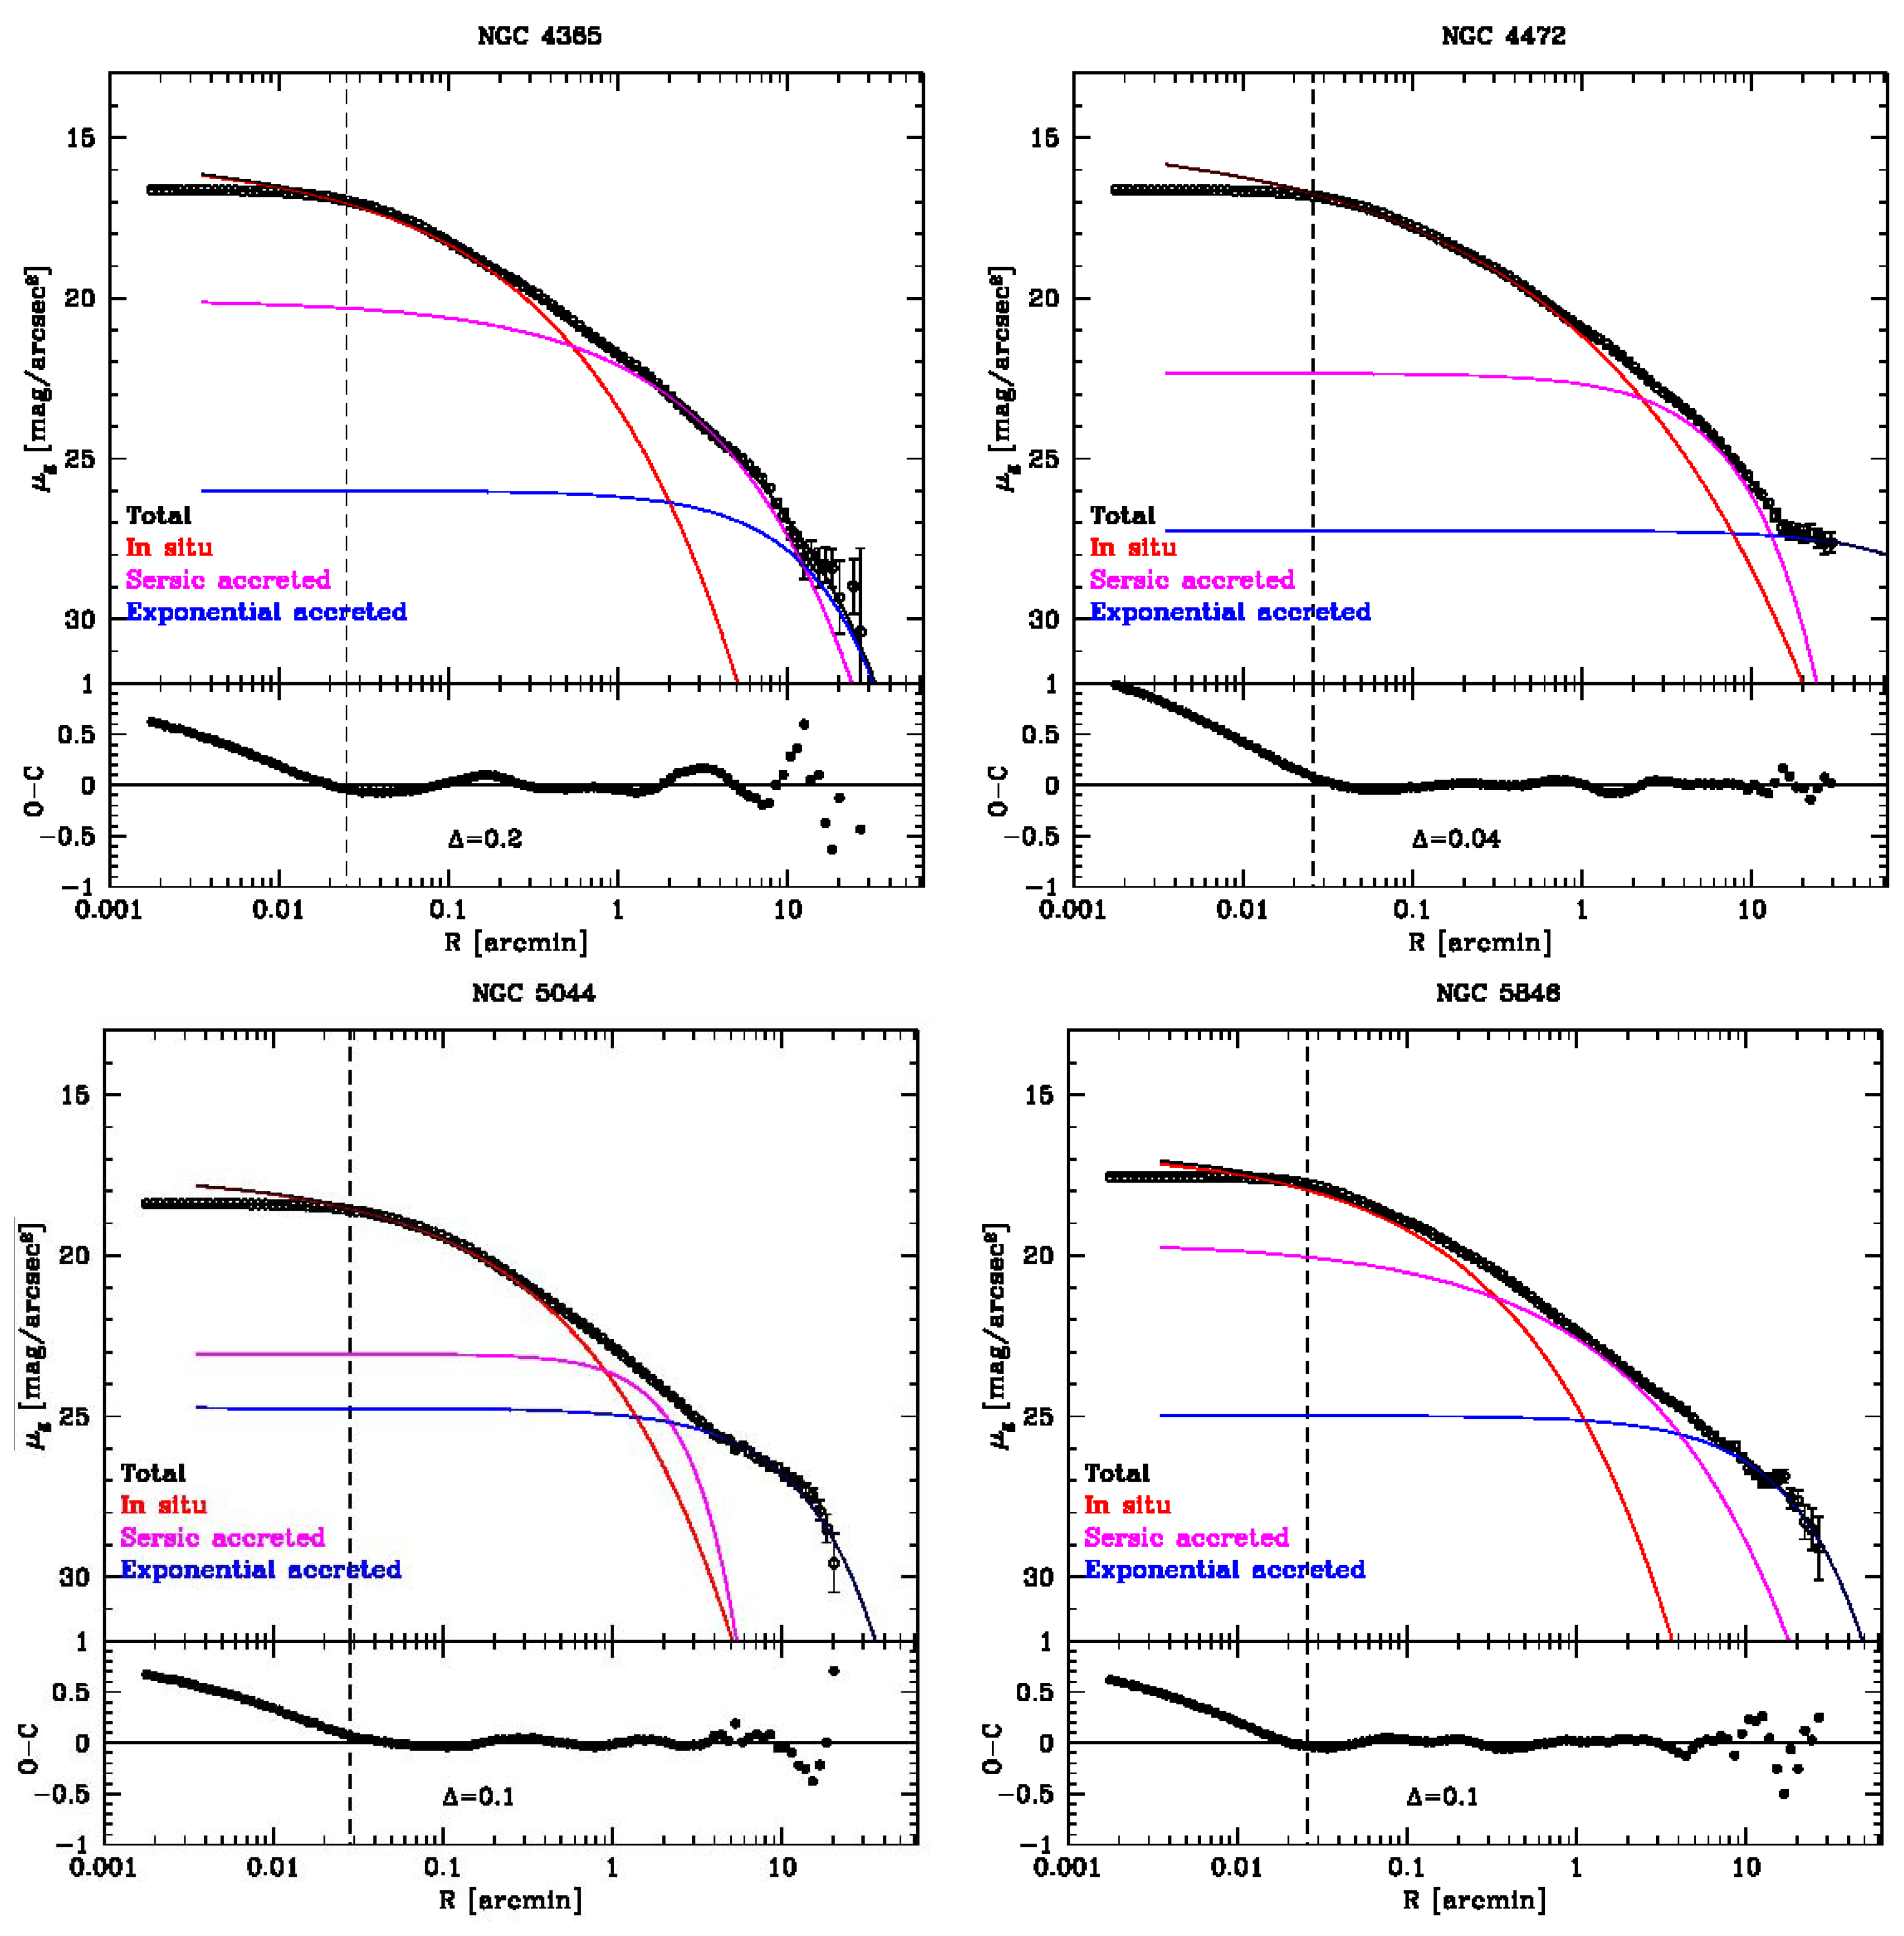
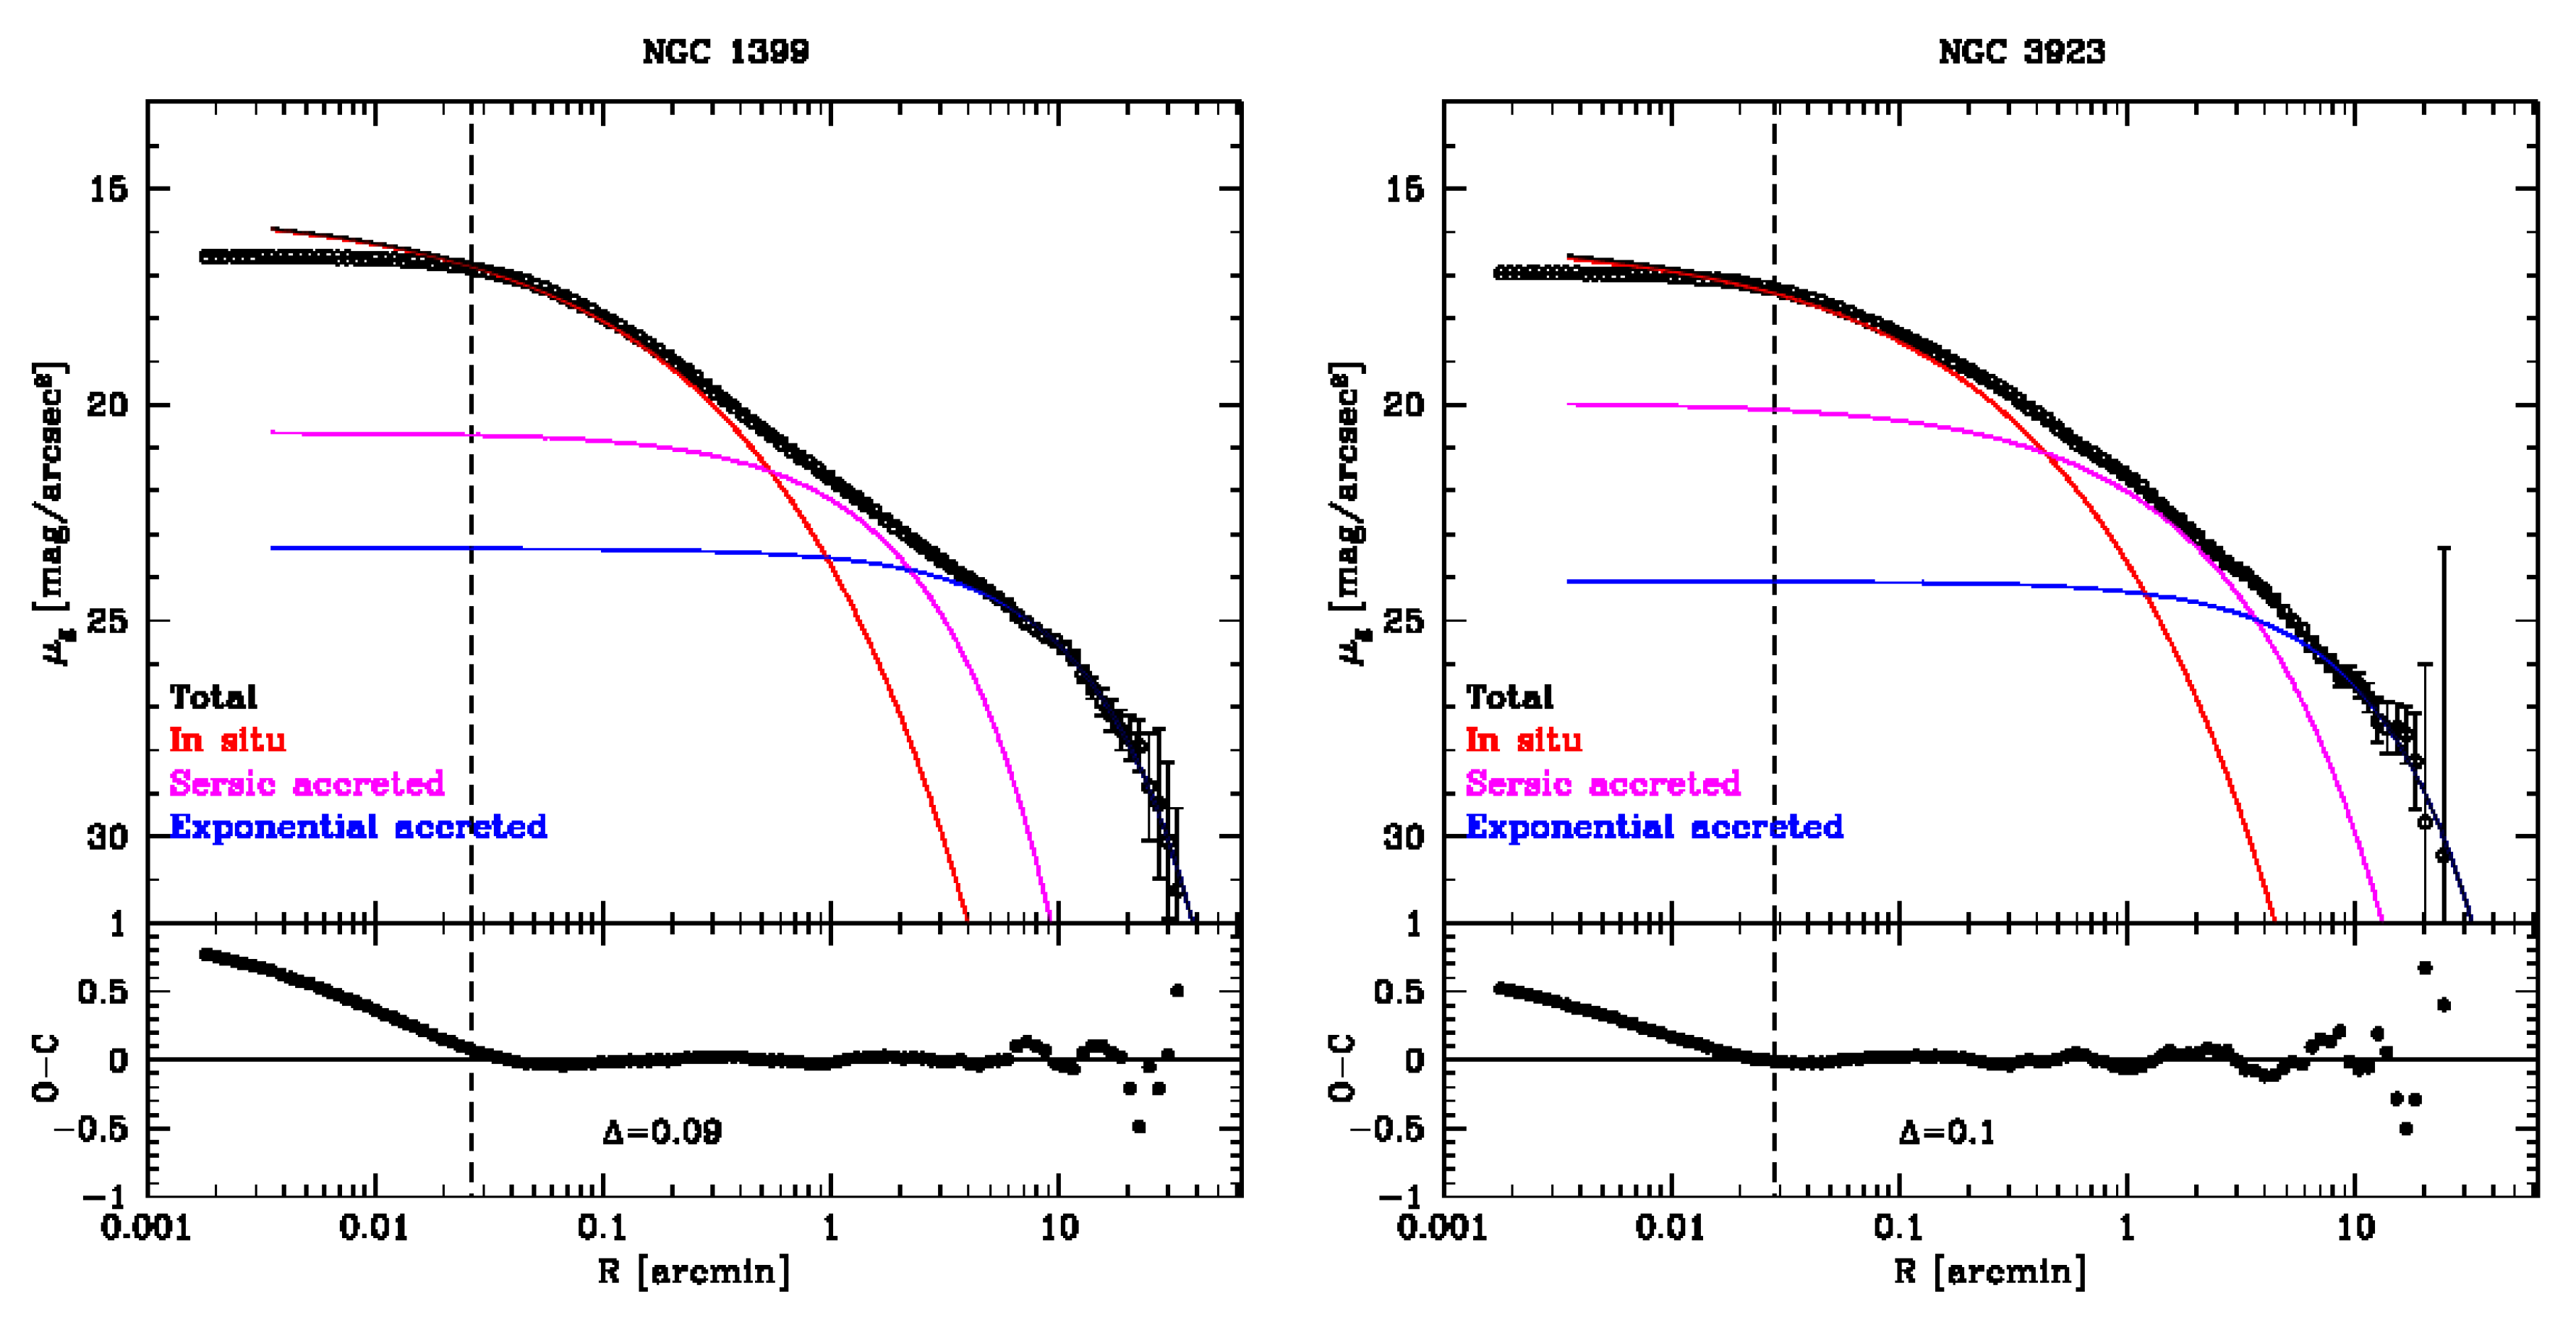
3.2. Three Components Fits
Numerical simulations predict that stars accreted by BCGs account for most of the total galaxy stellar mass (∼90% on average), while in situ stars significantly contribute to the surface brightness profile only out to
10 kpc [
3,
4,
17]. The overall accreted profile is built up by contributions from several significant progenitors. For this reason, theory suggests that the surface brightness profile of an ETG should be well described by the superposition of an inner Sérsic profile representing the (sub-dominant) in situ component in the central regions, another Sérsic profile representing the (dominant) superposition of the relaxed, phase-mixed accreted components, and an outer diffuse component representing unrelaxed accreted material (streams and other coherent concentrations of debris), which does not contribute any significant surface density to the brighter regions of the galaxy.
Following these theoretical predictions, we described the surface brightness profiles of our six galaxies with a three-component model: a Sérsic profile for the centrally concentrated in situ stars, a second Sérsic for the relaxed accreted component, and an exponential component for the diffuse and unrelaxed outer envelope. To mitigate the degeneracy in parameters and provide estimates of accreted components that are closely comparable to the results of numerical simulations, we fixed
2 for the in situ component of our three-component fits [
3]. This value has been chosen because it is a representative value from the simulations. The results of these fits are shown in
Figure 2. Looking at the rms scatter
, of each fit, we can clearly see that by adding the third component we achieve an improvement of at least 10% for each galaxy.
From this plot it appears that, as argued by Cooper et al. [
17], the radius
identified in
Figure 1 marks the transition between different accreted components in different states of dynamical relaxation, rather than that between in situ and accreted stars.
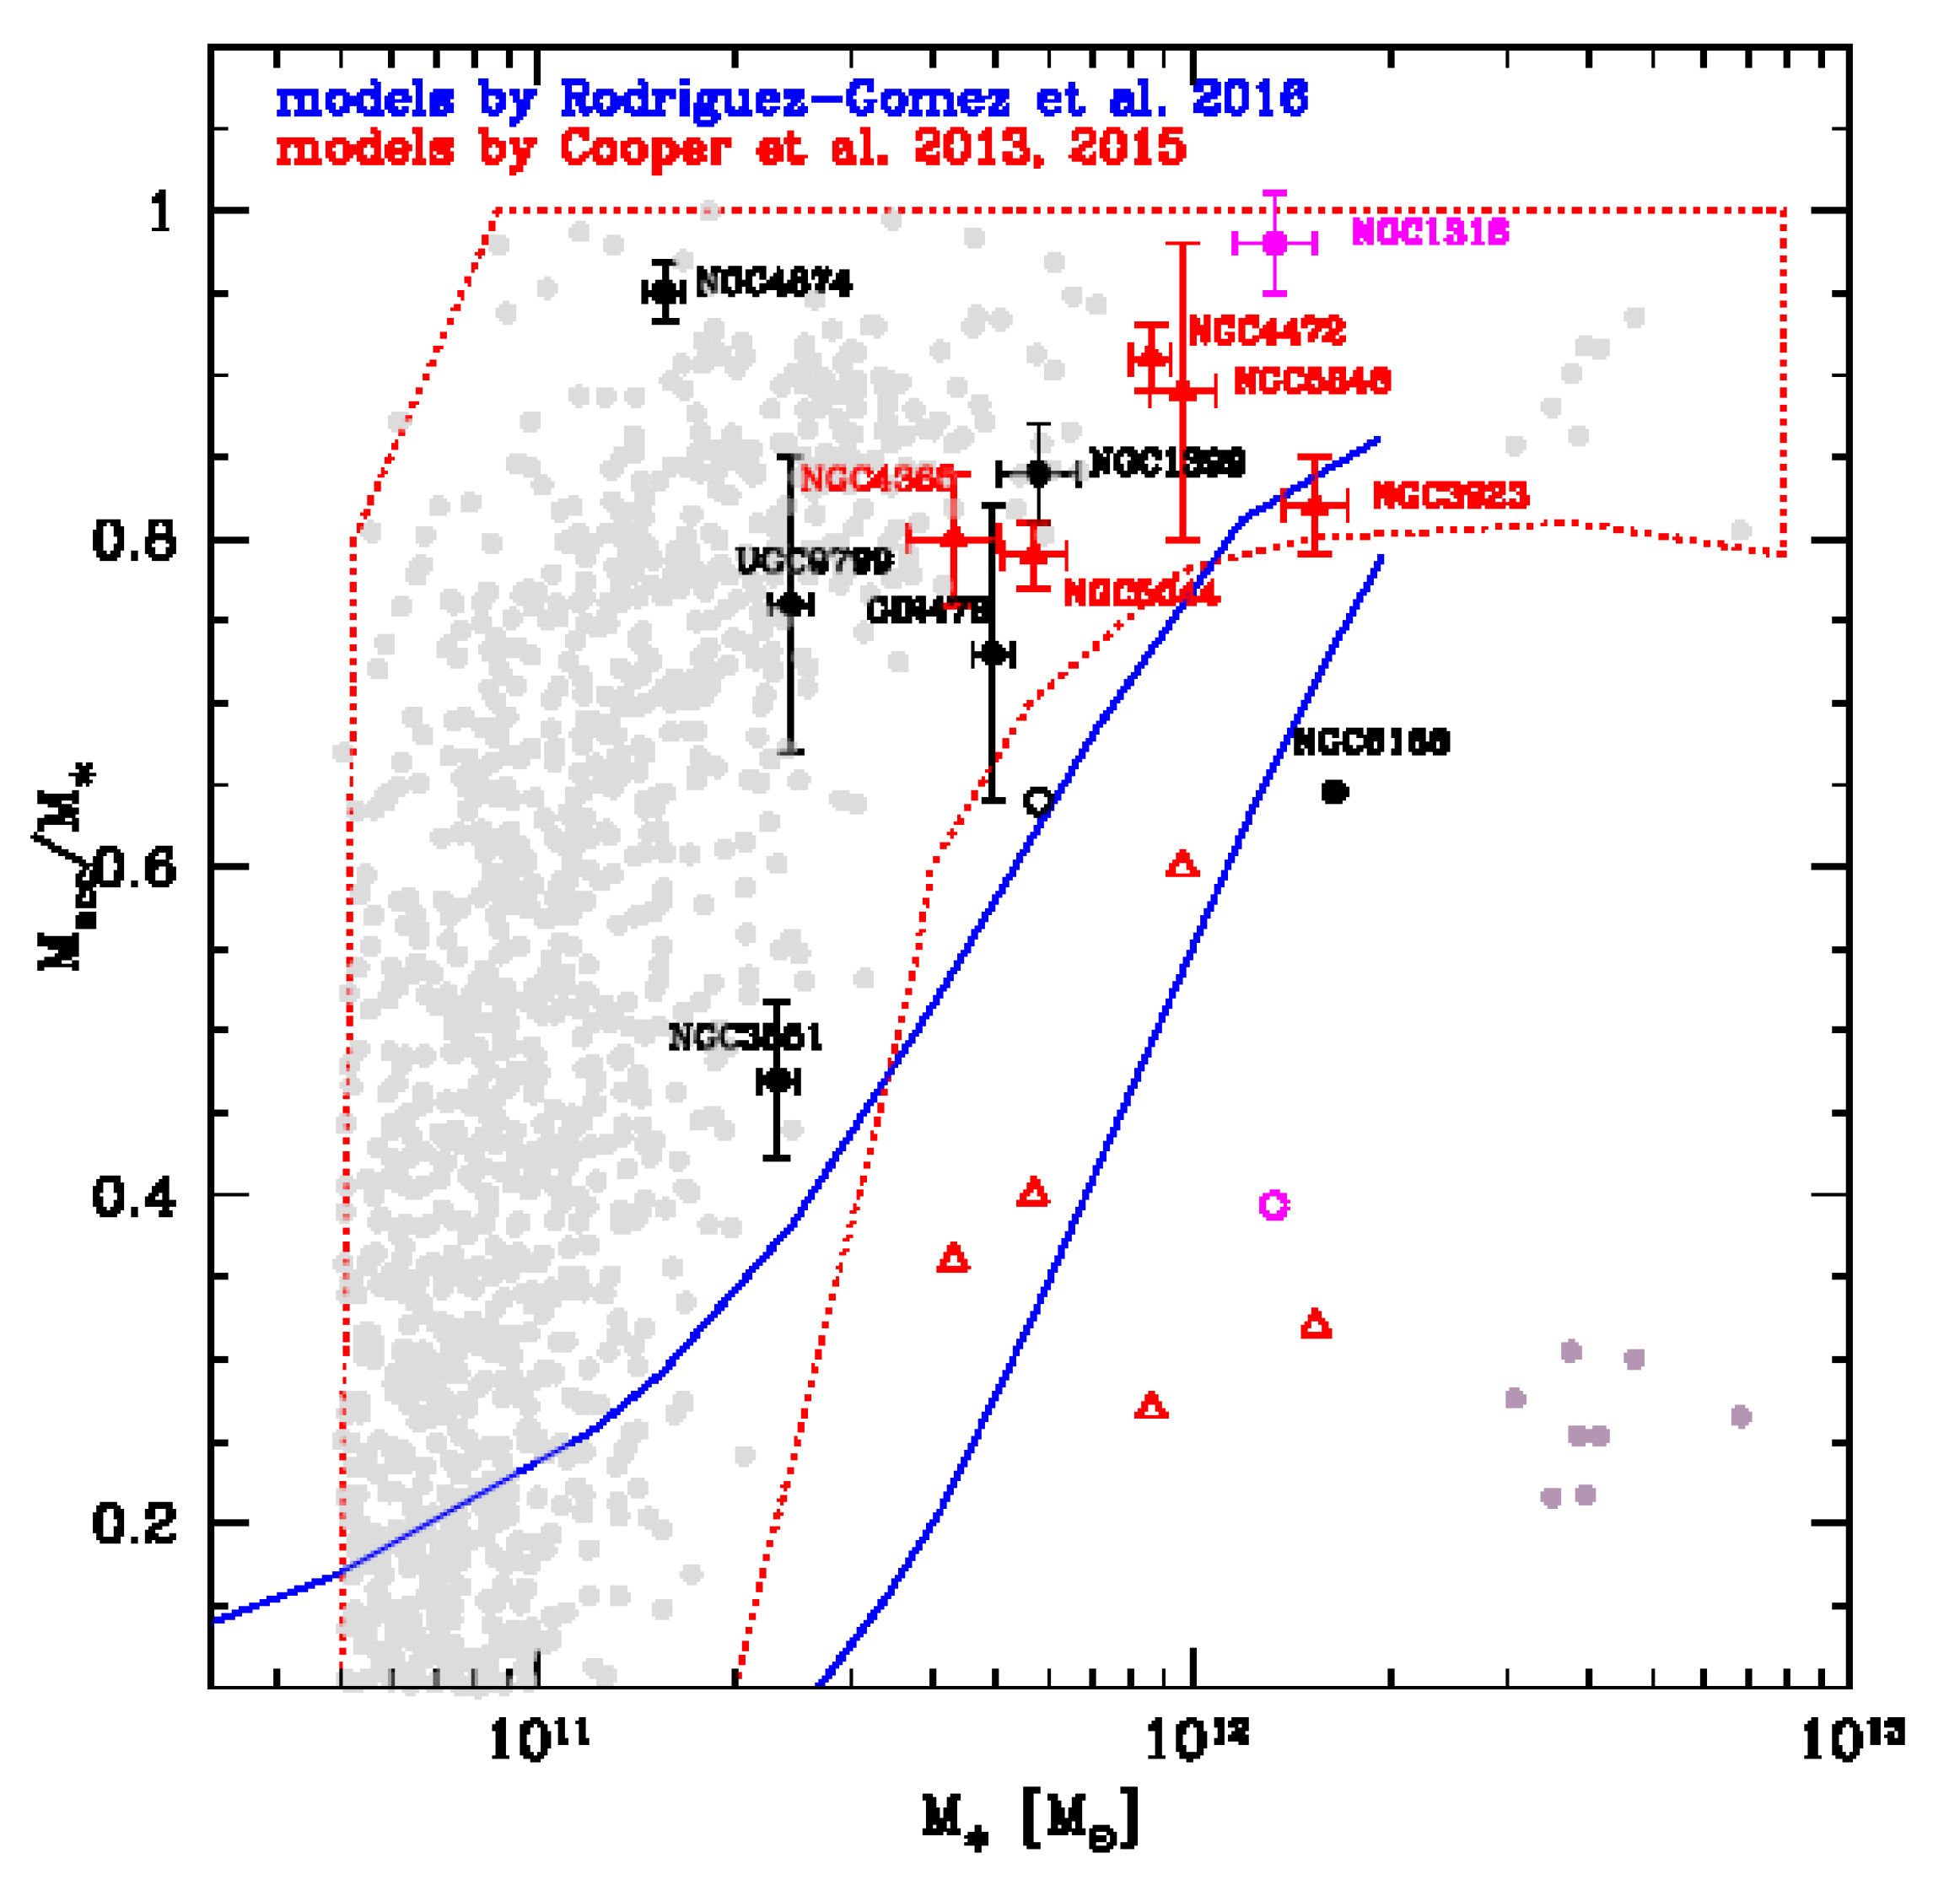
4. Comparison With Theoretical Predictions for Accreted Mass
Fractions
In the previous section, we identified inflections in the surface brightness profiles of galaxies in our sample that may correspond to transitions between regions dominated by debris from different accreted progenitors (or ensembles of progenitors) in different dynamical states. From our fitting procedure, we estimated the contributions of outer exponential ’envelopes’ to the total galaxy stellar mass (derived by using colours), which range from 28% to 60% for the galaxies in our sample, and the fraction of total accreted mass, which range from 83% to 95%.
In
Figure 3 we compare the accreted mass ratios we infer from our observations (filled red triangles) with other observational estimates for BCGs by Seigar et al. [
13], Bender et al. [
18] and Iodice et al. [
10], theoretical predictions from semi-analytic particle-tagging simulations by [
3,
17], and the Illustris cosmological hydrodynamical simulations [
4]. We find that the stellar mass fraction of the accreted component derived for galaxies in our sample is fully consistent both with published data for other BCGs (despite considerable differences in the techniques and assumptions involved) and with the theoretical models by [
3,
17].
In
Figure 3 we also compare the stellar mass fractions obtained for the outermost exponential component of our multicomponent fit (open red triangles) with the mass fraction associated with unbound debris streams from surviving cluster galaxies in the simulations of Cooper et al. [
17]. We found that the mass fraction in this component of our fits is consistent with these values from the simulations, suggesting that such components may give a crude estimate of the mass distribution associated with dynamically unrelaxed components originating from disrupting or recently disrupted galaxies, as argued by Cooper et al. [
17].
5. Materials and Methods
The data used were collected with the VST/OmegaCAM in March and April of 2015 within the Italian Guaranteed Time Observation (GTO). This work is based on visitor mode observations taken at the ESO La Silla Paranal Observatory within the VST Guaranteed Time Observations, Programme IDs 090.B-0414(D), 091.B-0614(A), 094.B-0496(A), 094.B-0496(B), 094.B-0496(D) and 095.B-0779(A).
The VEGAS survey and the data reduction procedure adopted in this work are described in details by Capaccioli et al. [
9] and Spavone et al. [
11]. The background estimate and subtraction is the most critical operation in deep photometric analysis because it affects the ability of detecting and measuring the faint outskirts of galaxies. For this reason we decided to adopt a
step-dither observing strategy for galaxies with large angular extent, consisting of a cycle of short exposures centred on the target and on offset fields (
degree). With such a technique the background can be estimated from exposures taken as close as possible, in space and time, to the scientific images. This ensures better accuracy, reducing the uncertainties at very faint surface brightness levels, as found by Ferrarese et al. [
20]. This observing strategy allowed us to build an average sky background of the night, which was subtracted from each science image.
The isophotal analysis has been performed on the sky-subtracted mosaics in both the
g and
i bands, where all the bright sources have been masked. We used the IRAF
1 task ELLIPSE to extract azimuthally averaged intensity profiles in elliptical annuli out to the edges of the frame.
To fit the light distribution of our galaxies, we adopt the same approach described by Seigar et al. [
13] and performed least-square fits using a Levenberg–Marquardt algorithm, in which the function to be minimized is the rms scatter, defined as
, where
m is the number of data points and
is the
ith residual. In all the fit presented above, the innermost seeing-dominated regions (∼
), indicated with dashed lines, were excluded.
6. Conclusions
We have presented new deep photometry in the g and i bands for six giant ETGs in the VST Early-type Galaxy Survey (VEGAS): NGC 1399, NGC 3923, NGC 4365, NGC 4472, NGC 5044, and NGC 5846. In particular, we studied the shapes of their surface brightness profiles to obtain evidence of structural variations that may constrain their assembly history.
Our analysis suggests that the surface brightness profiles of the galaxies in our study are best reproduced by multicomponent models. We took two approaches to constructing such models. We Adopt an empirically motivated, two-component approach most common in the literature, as well as an alternative approach, which is motivated by the predictions of numerical simulations, in which we fitted the surface brightness profiles of our galaxies with three components: two dominant Sérsic components and an outer exponential component. To mitigate some of the degeneracy in this approach, we fixed the Sérsic index of the inner component to a representative value from simulations. Compared to the traditional empirical fit, this approach allows us to make a more meaningful estimate of the total contribution of accreted stars.
The mass fractions in the exponential components of our two-component profile decompositions are in good agreement with the mass fractions associated with streams from surviving galaxies in the simulations of Cooper et al. [
17]. This suggests these outer exponential components may give a crude estimate of the stellar mass fraction associated with recently disrupted galaxies. We find values for this fraction ranging from 28% to 64%.
For all the galaxies in our study we can identify at least one inflection in the surface brightness profile. These inflections occur at very faint surface brightness levels (
mag/arcsec
). They appear to correlate with changes in the trend of ellipticity, position angle, and colour with radius, where the isophotes become flatter and misaligned and the colours become bluer beyond the inflections (see Spavone et al. [
11] for details). This suggests that these inflections mark transitions between physically distinct components (or ensembles of similar components) in different states of dynamical relaxation.
It is encouraging that we see a variety of profile inflections in our photometric investigation of this small subset of the VEGAS sample and that these are broadly consistent with the expectations of state-of-the-art theoretical models. Our results suggests that with the complete sample of extremely deep surface brightness profiles from the full survey, we will be able to investigate the late stages of massive galaxy assembly statistically, thereby distinguishing dynamically evolved systems from those that are still reaching dynamical equilibrium and probing the balance between in situ star formation and accretion across a wide range of stellar mass. This is a promising route to constraining cosmological models of galaxy formation such as those we have compared with here, which predict fundamental, relatively tight correlations between the present-day structure of massive galaxies and the growth histories of their host dark matter halos.
Acknowledgments
M. Spavone wishes to thank the ESO staff of the Paranal Observatory for their support during the observations at VST. APC is supported by a COFUND/Durham Junior Research Fellowship under EU grant [267209] and acknowledges support from STFC (ST/L00075X/1). The data reduction for this work was carried out with the computational infrastructure of the INAF-VST Center at Naples (VSTceN). This research made use of the NASA/IPAC Extragalactic Database (NED), which is operated by the Jet Propulsion Laboratory, California Institute of Technology, under contract with the National Aeronautics and Space Administration, and has been partly supported by the PRIN-INAF “Galaxy evolution with the VLT Survey Telescope (VST)” (PI A. Grado). NRN, EI, and MP have been supported by the PRIN-INAF 2014 “Fornax Cluster Imaging and Spectroscopic Deep Survey” (PI. N.R. Napolitano). MS, EI, and M. Cantiello acknowledge finacial support from the VST project (P.I. M. Capaccioli).
Author Contributions
M.S. wrote this paper. M.S., M.C., E.I., N.R.N. and A.P.C. conceived and designed the experiments. M.S. performed the experiments. A.G. and L.L. reduced the data. D.A.F., M.Ca., M.P. and P.S. helped to write and revise the paper.
Conflicts of Interest
The authors declare no conflict of interest.
References
- White, S.D.M.; Frenk, C.S. Galaxy formation through hierarchical clustering. Astrophys. J. 1991, 379, 52. [Google Scholar] [CrossRef]
- Guo, Q.; White, S.D.M. Galaxy growth in the concordance LambdaCDM cosmology. Mon. Not. R. Astron. Soc. 2008, 384, 2. [Google Scholar] [CrossRef]
- Cooper, A. P.; D’Souza, R.; Kauffmann, G.; Wang, J.; Boylan-Kolchin, M.; Guo, Q.; Frenk, C.S.; White, S.D.M. Galactic accretion and the outer structure of galaxies in the CDM model. Mon. Not. Roy. Astro. Soc. 2013, 434, 3348. [Google Scholar] [CrossRef]
- Rodriguez-Gomez, V.; Pillepich, A.; Sales, L.V.; Genel, S.; Vogelsberger, M.; Zhu, Q.; Wellons, S.; Nelson, D.; Torrey, P.; Springel, V.; et al. The stellar mass assembly of galaxies in the Illustris simulation: growth by mergers and the spatial distribution of accreted stars. Mon. Not. R. Astron. Soc. 2016, 458, 2371. [Google Scholar] [CrossRef]
- Amorisco, N.C. Contributions to the accreted stellar halo: an atlas of stellar deposition. arXiv, 2015; arXiv:1511.08806. [Google Scholar]
- Cooper, A.P.; Cole, S.; Frenk, C.S.; White, S.D.M.; Helly, J.; Benson, A.J.; De Lucia, G.; Helmi, A.; Jenkins, A.; Navarro, J.F.; et al. Galactic stellar haloes in the CDM model. Mon. Not. R. Astron. Soc. 2010, 406, 744. [Google Scholar] [CrossRef] [Green Version]
- Deason, A.J.; Belokurov, V.; Evans, N.W.; Johnston, K.V. Broken and Unbroken: The Milky Way and M31 Stellar Halos. Astrophys. J. 2013, 763, 113. [Google Scholar] [CrossRef]
- Capaccioli, M.; Schipani, P. The VLT Survey Telescope Opens to the Sky: History of a Commissioning. Messenger 2011, 146, 2. [Google Scholar]
- Capaccioli, M.; Spavone, M.; Grado, A.; Iodice, E.; Limatola, L.; Napolitano, N.R.; Cantiello, M.; Paolillo, M.; Romanowsky, A.J.; Forbes, D.A.; et al. VEGAS: A VST Early-type GAlaxy Survey. I. Presentation, wide-field surface photometry, and substructures in NGC 4472. Astron. Astrophys. 2015, 581, A10. [Google Scholar] [CrossRef]
- Iodice, E.; Capaccioli, M.; Grado, A.; Limatola, L.; Spavone, M.; Napolitano, N.R.; Paolillo, M.; Peletier, R.F.; Cantiello, M.; Lisker, T.; et al. The Fornax Deep Survey with VST. I. The Extended and Diffuse Stellar Halo of NGC 1399 out to 192 kpc. Astrophys. J. 2016, 820, 42. [Google Scholar] [CrossRef]
- Spavone, M.; Capaccioli, M.; Napolitano, N.R.; Iodice, E.; Grado, A.; Limatola, L.; Cooper, A. P.; Cantiello, M.; Forbes, D.A.; Paolillo, M.; Schipani, P. VEGAS: A VST Early-type GAlaxy Survey. II. Photometric study of giant ellipticals and their stellar halos. Astron. Astrophys. 2017, 603, 38. [Google Scholar] [CrossRef]
- Donzelli, C.J.; Muriel, H.; Madrid, J.P. The Luminosity Profiles of Brightest Cluster Galaxies. Astrophys. J. 2011, 195, 15. [Google Scholar] [CrossRef]
- Seigar, M.S.; Graham, A.W.; Jerjen, H. Intracluster light and the extended stellar envelopes of cD galaxies: an analytical description. Mon. Not. R. Astron. Soc. 2007, 378, 1575. [Google Scholar] [CrossRef]
- Caon, N.; Capaccioli, M.; D’Onofrio, M. On the Shape of the Light Profiles of Early Type Galaxies. Mon. Not. R. Astron. Soc. 1993, 265, 1013. [Google Scholar] [CrossRef]
- Sérsic, J.L. Influence of the atmospheric and instrumental dispersion on the brightness distribution in a galaxy. Boletin de la Asociacion Argentina de Astronomia La Plata Argentina 1963, 6, 41. [Google Scholar]
- Gonzalez, A.H.; Zabludoff, A.I.; Zaritsky, D. Structural Properties of Brightest Cluster Galaxies. Astron. Astrophys. 2003, 285, 67. [Google Scholar]
- Cooper, A.P.; Gao, L.; Guo, Q.; Frenk, C.S.; Jenkins, A.; Springel, V.; White, S.D.M. Surface photometry of brightest cluster galaxies and intracluster stars in LambdaCDM. Mon. Not. R. Astron. Soc. 2015, 451, 2703. [Google Scholar] [CrossRef]
- Bender, R.; Kormendy, J.; Cornell, M.E.; Fisher, D.B. Structure and Formation of cD Galaxies: NGC 6166 in ABELL 2199. Astrophys. J. 2015, 807, 56. [Google Scholar] [CrossRef]
- Iodice, E.; Spavone, M.; Capaccioli, M.; Peletier, R.F.; Richtler, T.; Hilker, M.; Mieske, S.; Limatola, L.; Grado, A.; Napolitano, N.R.; et al. The Fornax Deep Survey with VST. II. Fornax A: A Two-phase Assembly Caught in the Act. Astrophys. J. 2017, 839, 21. [Google Scholar] [CrossRef]
- Ferrarese, L.; Côté, P.; Cuillandre, J.C.; Gwyn, S.D.J.; Peng, E.W.; MacArthur, L.A.; Duc, P.; Boselli, A.; Mei, S.; Erben, T.; et al. The Next Generation Virgo Cluster Survey (NGVS). I. Introduction to the Survey. Astrophys. J. 2012, 200, 4. [Google Scholar] [CrossRef]
| 1. | IRAF (Image Reduction and Analysis Facility) is distributed by the National Optical Astronomy Observatories, which is operated by the Associated Universities for Research in Astronomy, Inc. under cooperative agreement with the National Science Foundation. |
© 2017 by the authors. Licensee MDPI, Basel, Switzerland. This article is an open access article distributed under the terms and conditions of the Creative Commons Attribution (CC BY) license (http://creativecommons.org/licenses/by/4.0/).


 ,
, 