
The Outer Halos of Very Massive Galaxies: BCGs and their DSC in the Magneticum Simulations

1
Faculty of Physics, Universitäts-Sternwarte München, Ludwig-Maximilians-Universität, Scheinerstr. 1, D-81679 München, Germany
2
Max Planck Institut for Astrophysics, D-85748 Garching, Germany
*
Author to whom correspondence should be addressed.
Galaxies 2017, 5(3), 49; https://doi.org/10.3390/galaxies5030049
Submission received: 1 August 2017
/
Revised: 24 August 2017
/
Accepted: 28 August 2017
/
Published: 1 September 2017
(This article belongs to the Special Issue On the Origin (and Evolution) of Baryonic Galaxy Halos)
Abstract
:Recent hydrodynamic cosmological simulations cover volumes up to Gpc and resolve halos across a wide range of masses and environments, from massive galaxy clusters down to normal galaxies, while following a large variety of physical processes (star-formation, chemical enrichment, AGN feedback) to allow a self-consistent comparison to observations at multiple wavelengths. Using the Magneticum simulations, we investigate the buildup of the diffuse stellar component (DSC) around massive galaxies within group and cluster environments. The DSC in our simulations reproduces the spatial distribution of the observed intracluster light (ICL) as well as its kinematic properties remarkably well. For galaxy clusters and groups we find that, although the DSC in almost all cases shows a clear separation from the brightest cluster galaxy (BCG) with regard to its dynamic state, the radial stellar density distribution in many halos is often characterized by a single Sérsic profile, representing both the BCG component and the DSC, very much in agreement with current observational results. Interestingly, even in those halos that clearly show two components in both the dynamics and the spatial distribution of the stellar component, no correlation between them is evident.
1. Introduction
Brightest cluster galaxies (BCGs), residing in the centers of galaxy clusters, are the most massive and luminous galaxies in the universe. During their lifetime, they experience frequent interactions with satellite galaxies, and their growth is dominated by merger events. These merger events also lead to the buildup of a diffuse stellar component (DSC), which very likely contains a significant fraction of the total stellar mass of the galaxy clusters (see Murante et al., 2007 [1] and references therein). The velocities of the stars in the BCG and the DSC have distinct kinematic distributions, which can be characterized by two superposed Maxwellian distributions, as demonstrated by Dolag et al., 2010 [2]. While the velocity dispersion of the stars in the BCG represents the central mass of the stars, the velocity dispersion of the DSC is much larger and is comparable to that of the dark matter halo (see, for example, Dolag et al., 2010 [2], Bender et al., 2015 [3], and Longobardi et al., 2015 [4]). More details on this matter can also be found in a recent review by Mihos et al., 2016 [5].
Similarly, early simulations of galaxy clusters found that the density distributions of BCGs in clusters can be described by a superposition of two extended components as well (e.g., Puchwein et al., 2010 [6]). However, more recent simulations find the opposite, namely that in many cases the radial density profiles can be described by a single profile, which is in good agreement with observations. These simulations also indicate that a double-component fit to the radial density profiles is only needed in rare cases. Interestingly, the three-dimensional distribution of these outer stellar halos seems to be described universally by a so-called Einasto profile over a wide range of halo masses, as shown by Remus et al., 2016 [7], where the curvature of the radial profiles appears to be more closely linked to the cluster’s assembly history than the separation of the radial profiles into distinct components.
In this study we analyse the velocity distributions as well as the projected radial surface density profiles of the stellar component in galaxy clusters selected from a state-of-the-art cosmological simulation, and test for possible correlations between these distributions.
2. Simulations
We use galaxy clusters selected from the Magneticum Pathfinder (www.magneticum.org) simulation set. This suite of fully hydrodynamic cosmological simulations comprises a broad range of simulated volumes, with box lengths of to , covering different resolution levels of stellar particle masses from at the lowest resolution level down to particle masses of at the highest resolution level. For this work, we use two different simulations, Box2b and Box4, with the smaller one (Box4) having a higher resolution. The details of these two simulations are summarized in Table 1.
All simulations of the Magneticum Pathfinder simulation suite are performed with an advanced version of the tree-SPH code P-Gadget3 (Springel, 2005 [8]). They include metal-dependent radiative cooling, heating from a uniform time-dependent ultraviolet background, star formation according to Springel & Hernquist, 2003 [9], and the chemo-energetic evolution of the stellar population as traced by SN Ia, SN II, and AGB stars, including the associated feedback from these stars (Tornatore et al., 2007 [10]). Additionally, they follow the formation and evolution of supermassive black holes, including their associated quasar and radio-mode feedback. For a detailed description, see Dolag et al. (in prep), Hirschmann et al., 2014 [11], and Teklu et al., 2015 [12].
Galaxy clusters are chosen according to the total mass of a structure as found by the baryonic SUBFIND algorithm (see Dolag et al., 2009 [13]). For the larger, less resolved volume (Box2b), we classify all structures with masses of as clusters, independent of their dynamical state, and find 890 objects. For the smaller volume (Box4), there are no massive galaxy clusters, but the increased resolution enables us to utilize halos with masses down to , and therefore allows us to add galaxy groups down to the limit of massive field galaxies to this study. Including the three clusters and 35 groups from the smaller volume simulation, we end up with a total sample of 928 objects, which is an unprecedentedly large sample of simulated galaxy clusters and groups for which we here, for the first time, provide a statistically representative analysis of the decomposition of the stellar components into the BCG and the DSC, providing predictions for future observational studies of the ICL and the BCGs.
3. Velocity Distributions and Radial Surface Density Profiles
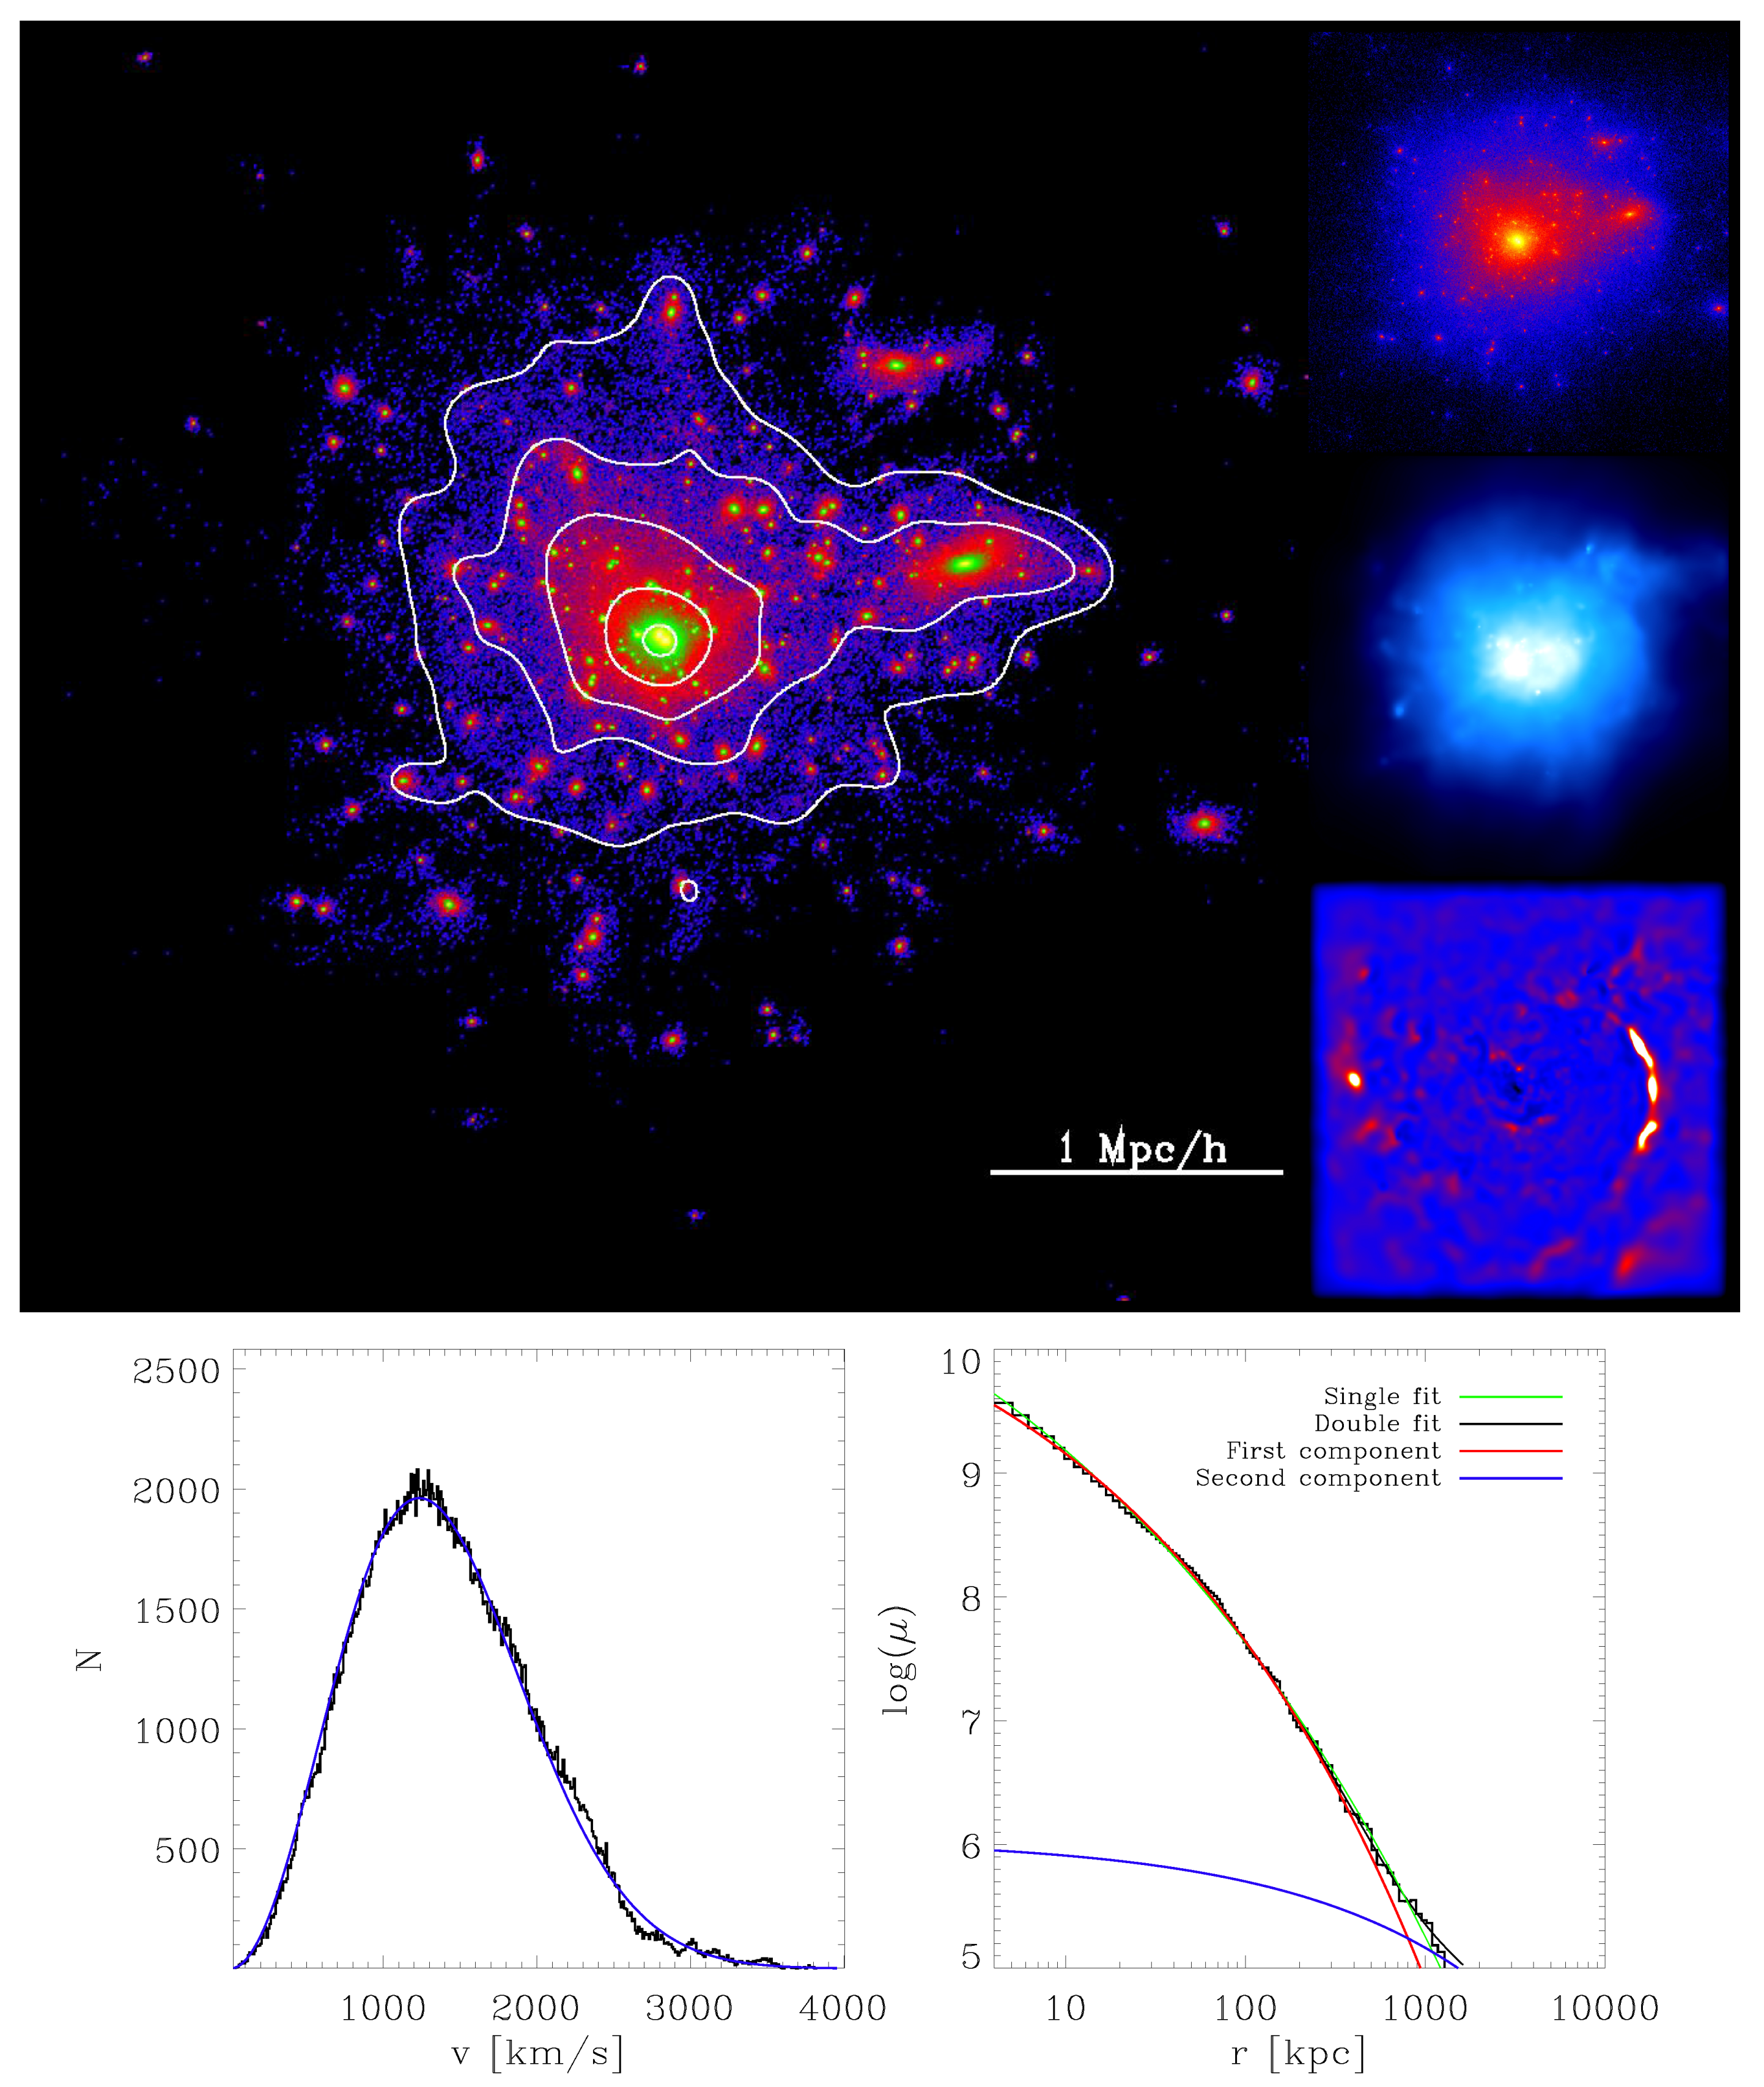
In their detailed study, Dolag et al., 2010 [2] demonstrated that the two dynamical components found in the velocity distribution of the stellar component of galaxy clusters very well represent the stellar component of the BCGs and the DSC, the latter of which is itself a good approximation of the observed ICL in galaxy clusters. Following their approach, we subtract all substructures (identified with SUBFIND) from the stellar component of each cluster and use the remaining stars for this analysis. First, we calculate the velocities of all stellar particles in a cluster and bin them in small equal-width bins of , thereby obtaining the intrinsic 3D velocity distribution of the stars in each cluster. Similarly, we choose a random viewing angle and calculate the projected radius of each stellar particle. Subsequently, we radially bin these particles using equal-particle bins, thus obtaining radial surface density distributions, effectively mimicking the radial surface brightness profiles that are commonly observed for galaxies and galaxy clusters, assuming a constant mass-to-light ratio. Examples of the velocity distributions and surface density profiles obtained by this methods are shown in the lower panels of Figure 1, Figure 2, Figure 3 and Figure 4.
To obtain the different components of BCG and DSC in the simulations, we again follow Dolag et al., 2010 [2]. First, we fit a superposition of two Maxwellian distributions
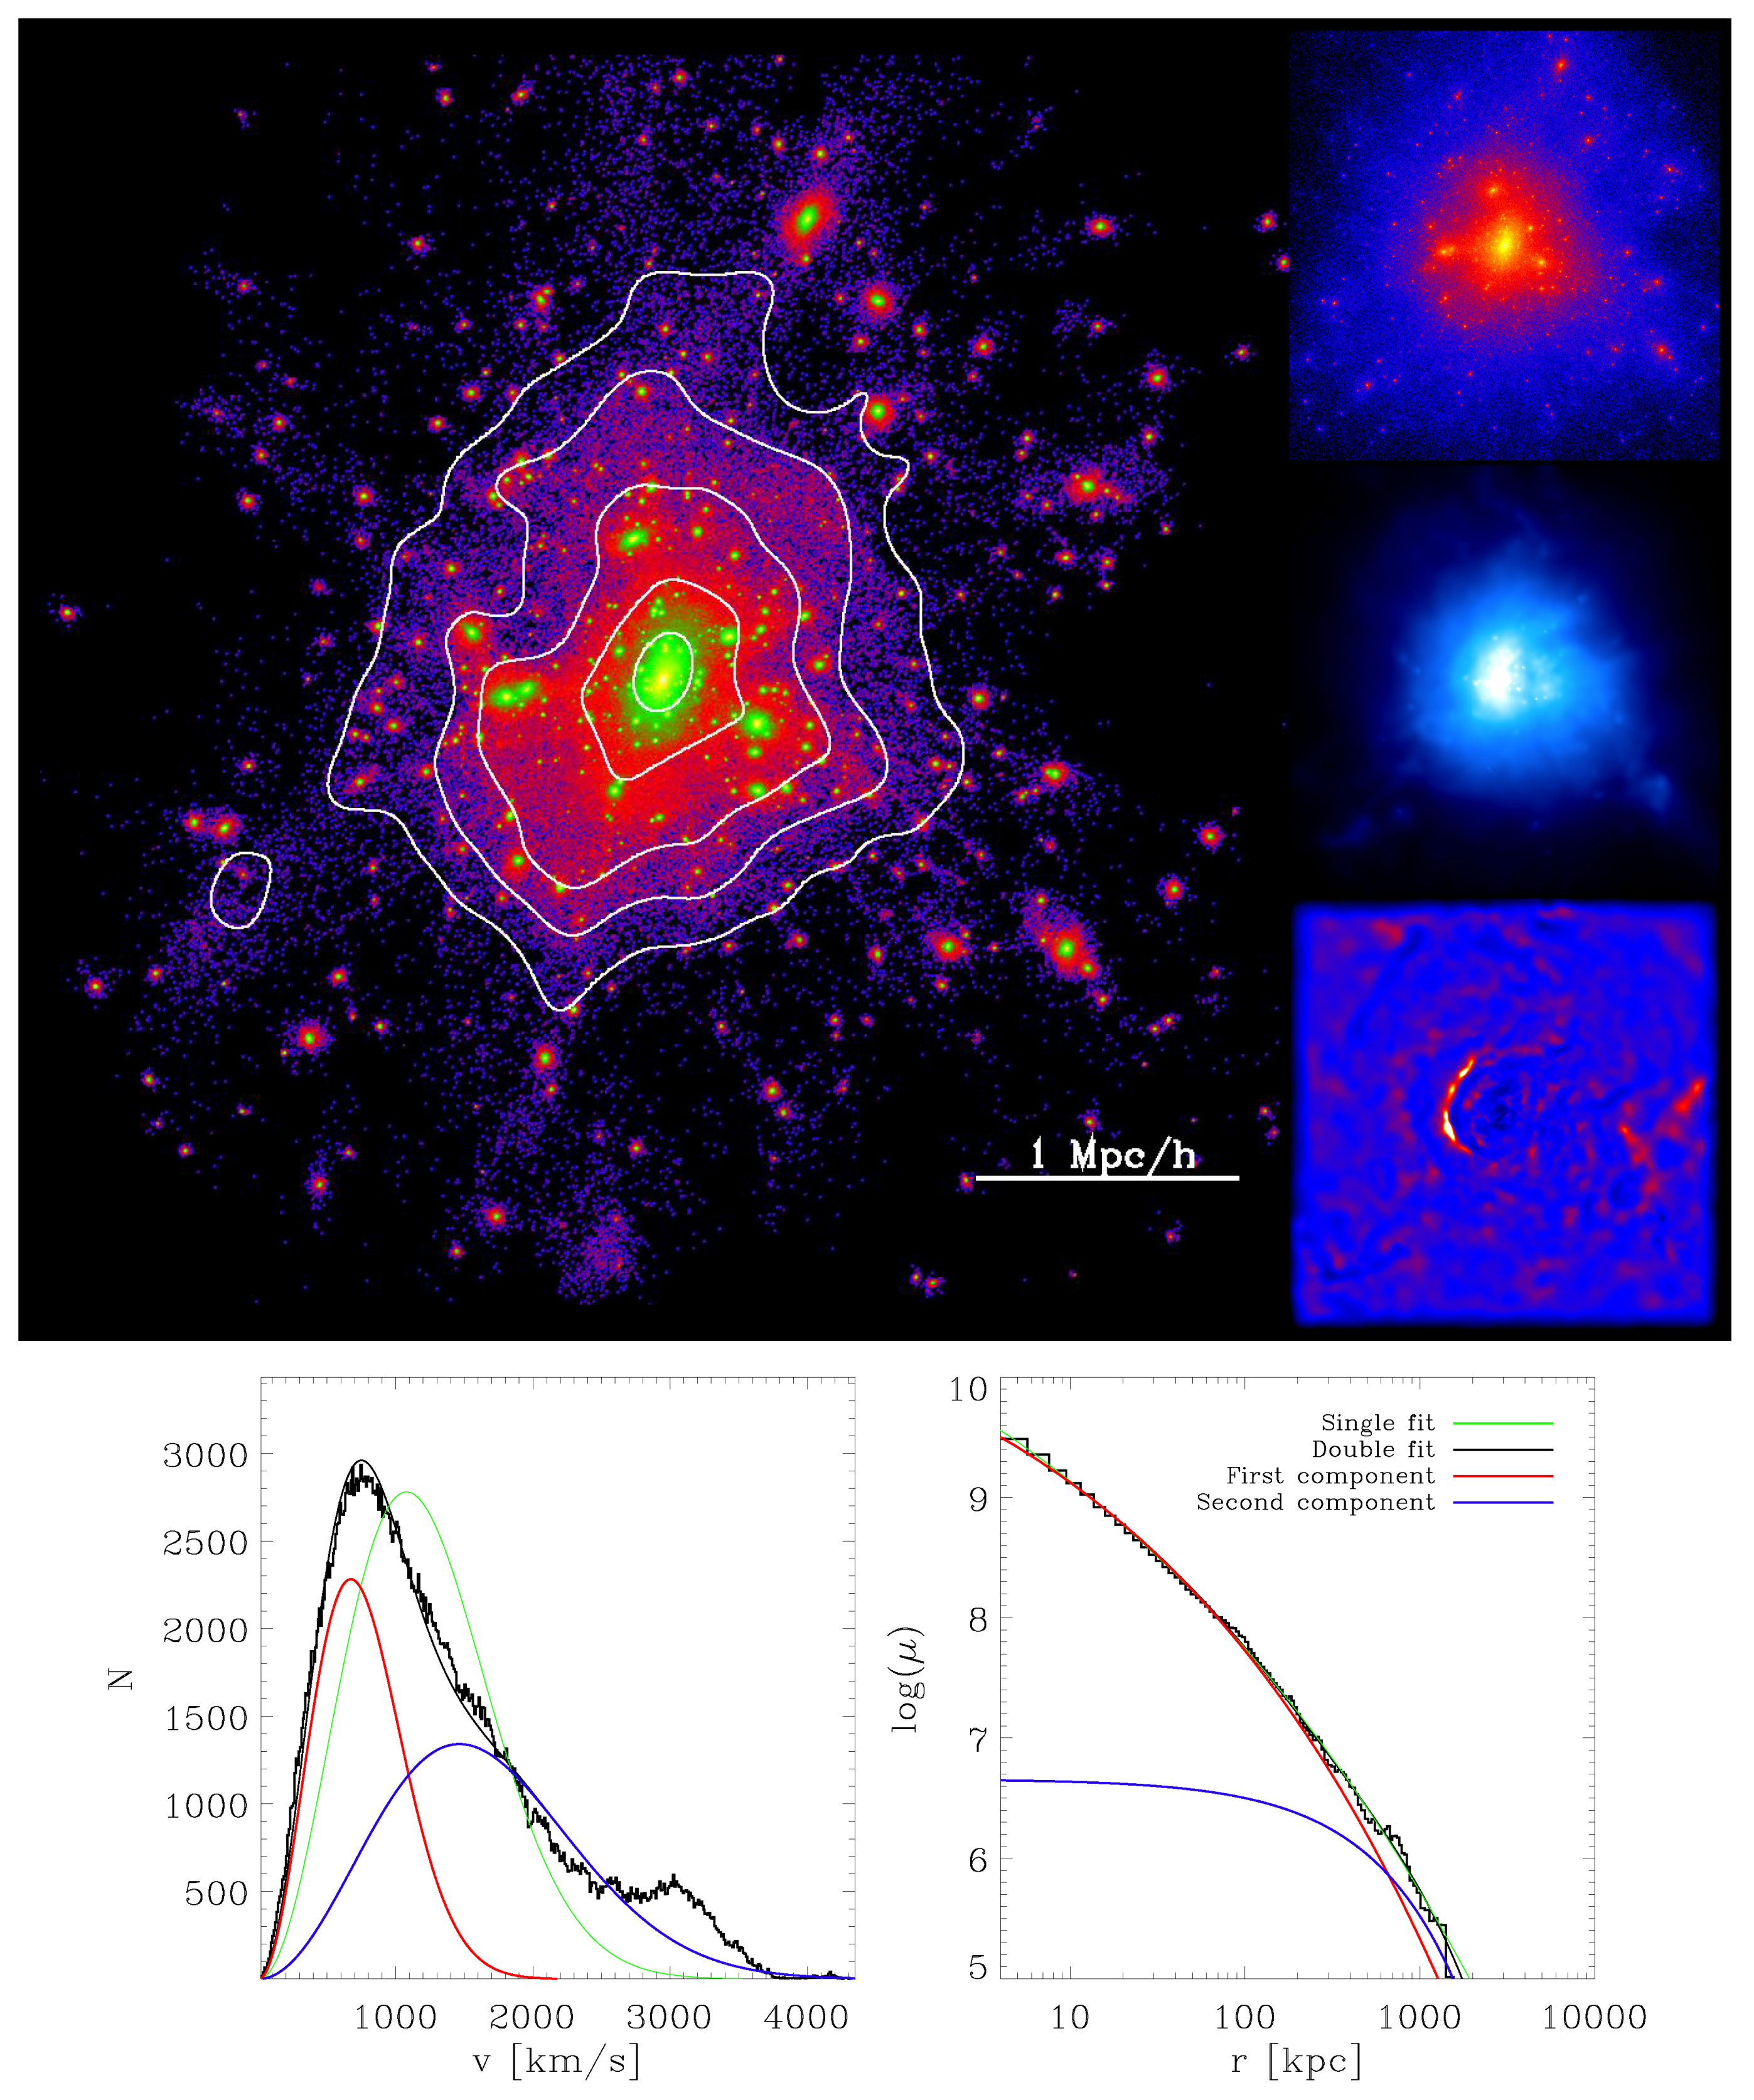
to the velocity distribution of each cluster. Additionally, we fit a single Maxwellian distribution to the velocity distributions for comparison purposes. In most cases, a double-Maxwellian fit is needed to properly represent the underlying velocity distributions, as shown, for example, in the lower left panels of Figure 1 and Figure 2. For comparison, we also show the stellar particle surface density map of the clusters including all substructures in the large image at the top of these figures. The white contours show equal-density lines of the stellar distribution without the substructures. For both clusters shown in Figure 1 and Figure 2, the BCG is clearly visible, but while the velocity distributions can be well described by double-Maxwellian fits in both cases, the morphological appearance of the two clusters is very different: while the cluster shown in Figure 1 is clearly elongated with a massive colliding structure clearly visible even in the dark matter component (upper small image), the other cluster shown in Figure 2 shows no signs of ongoing substantial accretion, and is only slightly elongated. This is true even in the X-ray map (middle small image), where the elongation is clearly visible for the first cluster while the second cluster shows a more compact shape. We also do not find a similarity between these clusters with regard to their shock properties: whereas the cluster shown in Figure 1 has a clearly visible shock front in the upper right area of the cluster, indicating a recent merging event, the cluster shown in Figure 2 shows no clear signs of such a recent merger event in the shock map (bottom small image). This clearly indicates that the velocity distribution of the cluster remembers the merger history of the cluster over a much larger timescale than other tracers like shocks or satellite distributions, which provide information only about the more recent mass assembly history of a cluster.
In some cases, there is no improvement to the description of the velocity distribution of an individual cluster by using a double-Maxwellian distribution for the fit, as the velocity distributions of that particular cluster is already well described by a single Maxwellian distribution (see, for example, the lower left panel of Figure 3). While the single-Maxwellian fit is a good approximation to the velocity distribution of the cluster stellar light, the stellar light map in the large image in the same figure clearly shows that the cluster is currently accreting another, relatively massive, substructure. This can be seen not only in the stellar component but also in the X-ray emission (middle small image) and the shock map (bottom small image). Thus, this clearly shows that the contribution from this merger to the cluster’s DSC is not very large yet and does not show up in the velocity distribution of the cluster as most stars that are brought in through the merger event have been subtracted by SUBFIND. Only in the very-high velocity end of the velocity distribution, the newly accreted component starts to be visible. This also indicates that the DSC of this cluster is very rich, which is caused by a rather diverse accretion history. However, these cases are very rare as we will show later on in this work.
The lower left panel of Figure 4 shows a very interesting albeit rare case for the velocity distribution of a galaxy cluster: for this cluster, a double-Maxwellian fit is still not sufficient and a third superposed component would be needed to actually capture all features visible in the velocity distribution. Interestingly, this new accretion is not strongly visible in the maps in the upper panels of this figure. The stellar component of the merger ongoing in the central part of the cluster—clearly visible through the displacement of the central X-ray emission from the center of mass towards the left as well as through the clearly visible shock moving from the center leftwards—is most likely the third, high velocity component in the velocity distribution. As these cases are rare and need a visual inspection of all 928 clusters to identify them, we will not introduce these objects as a separate class of velocity distributions in this work, and will here simply classify them as double-Maxwellian velocity distributions.
While in this three-dimensional analysis the two different velocity components of the BCG and the DSC are nicely visible, this information cannot be drawn directly from observations. However, observationally, the line-of-sight velocity can be measured and used as a substitute to distinguish the two components: In projection, the measured velocity is not represented by a Maxwellian distribution but by a Gaussian distribution, an example of which is shown in Figure 5, where we plot the line-of-sight velocity distribution of the cluster shown in Figure 1. As for the three-dimensional case, also in the projected case a superposition of two Gaussian fits is needed to represent the velocity distribution profile, clearly indicating the two-component structure of the BCG and the DSC. In case of an ideal spherically symmetric relaxed system, the projected Gaussian fits predict the same mass fractions and velocity dispersions for the BCG component and the DSC as the intrinsic Maxwellian distribution fits, but projection effects, asymmetries as well as distortion effects through accretion events can lead to (slightly) different values. However, we do not investigate these issues further in this work.
For the radial surface density profiles, we use a similar approach as for the velocity distributions. We fit the superposition of two Sérsic profiles
to the radial surface density profiles of each cluster, and, for comparison, we also fit a single Sérsic profile as well.
Examples for the resulting Sérsic fits to the surface density distributions are shown in the lower right panels of Figure 1, Figure 2, Figure 3 and Figure 4. As for the velocity distributions, we also see that there is no clear correlation between the visual appearance of the clusters, neither in the stellar nor the X-ray or the shock appearance, and the necessity of a double-Sérsic fit. Interestingly, we can already see from these four examples that there is also no clear correlation between the presence of a second component in the velocity distribution and the presence of a second component in the radial density profile: as shown in Figure 1, there are clusters that display two components in the velocity distribution but only a single component in the radial surface density profile, while Figure 2 shows a cluster where both distributions have a double structure. In the following, we will study this behaviour in more detail.
Statistical Properties
As we cannot check the properties of all 928 galaxy clusters from our sample individually, we now try to quantify their behaviour in a more statistical way. The biggest issue here is that a double fit with twice as many free parameters as a single fit will always yield a better fit, or one at least as good, according to simple statistical tests like or Komolgorov–Smirnov, if the number of degrees of freedom is much larger than the number of fit parameters (as is the case here). Thus, we need to find a better way to decide which fit adequately characterizes the properties in velocity and surface brightness of a cluster.
One way to do this is to use the double-Maxwell and double-Sérsic fits of a cluster and integrate over each of the two components. This way, assuming that the two components always represent an inner, slower component that describes the BCG and an outer, faster component that describes the DSC, we can obtain the fraction of mass associated with each component, relative to the total stellar mass given by the full velocity distribution and the full radial surface density profile.
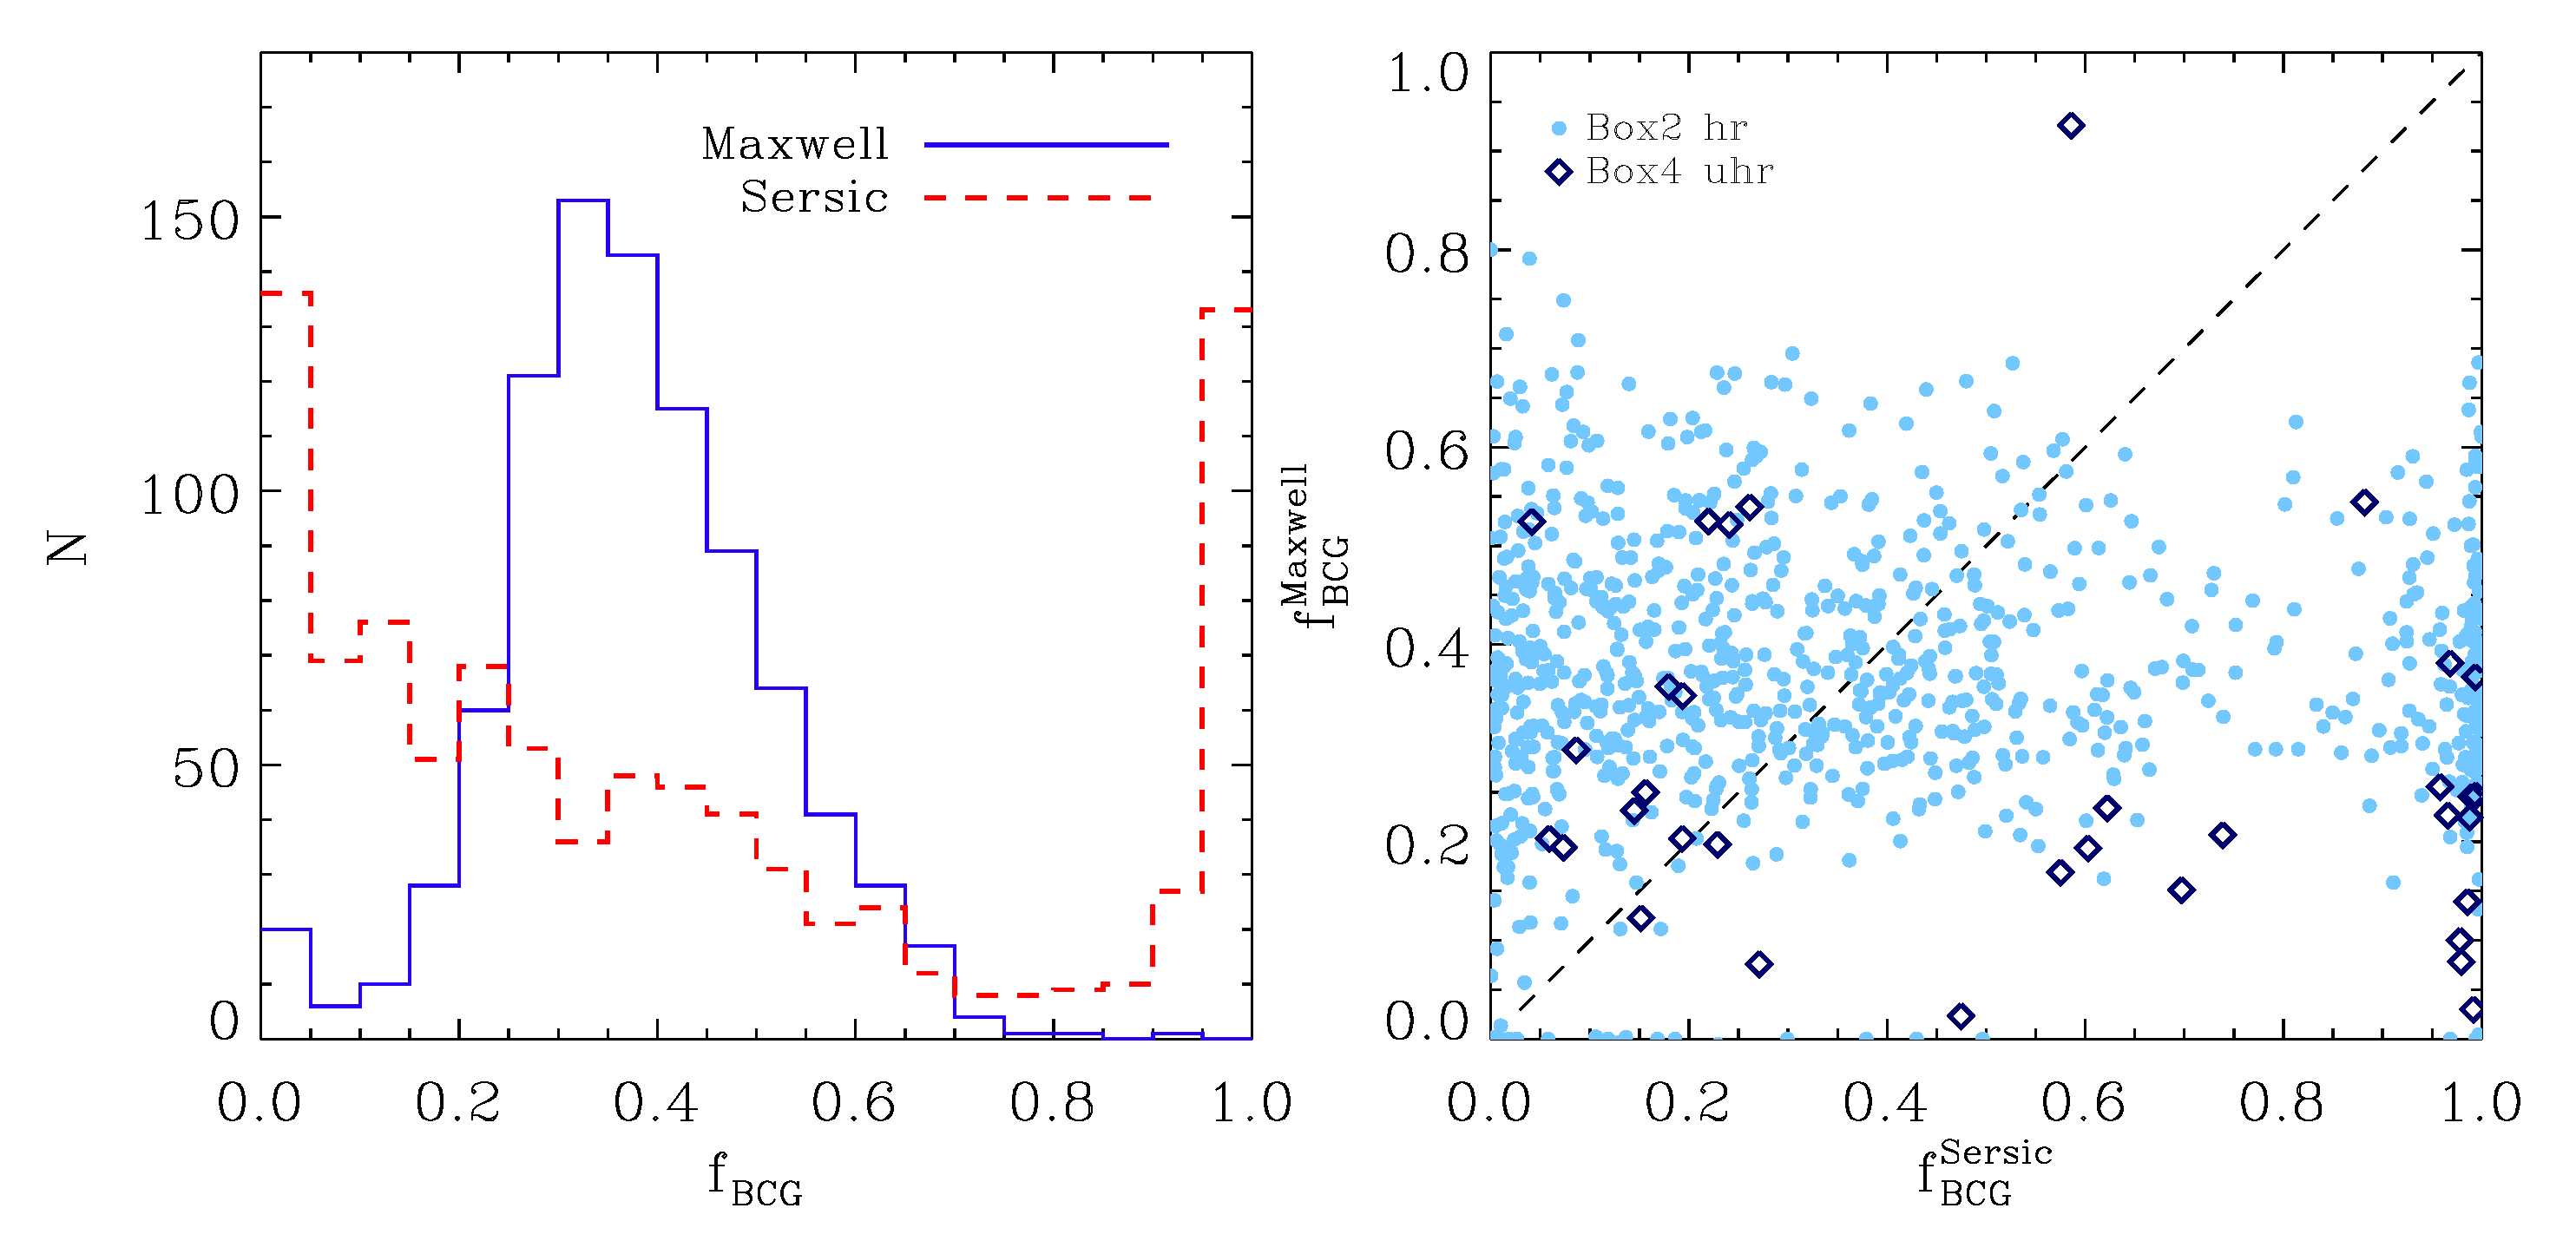
The left panel of Figure 6 shows a histogram of the mass fractions of the BCG, , obtained with both methods for all 928 halos. The blue line shows the distribution found from the double-Maxwell fits, while the red line shows the fractions obtained from the double-Sérsic fits. The right panel of the same figure shows a scatter plot of the BCG mass fractions obtained with both methods. As can clearly be seen, there is no correlation at all between the mass fractions resulting from the two methods: while there is only a small amount of clusters that have BCG mass fractions below 10% and none with BCG mass fractions above 90% according to the double-Maxwell method, the double-Sérsic method results in about half of the clusters having BCG mass fractions of about 0 or 100%, clearly indicating that in those cases a double-Sérsic fit is not necessary and their radial surface density profiles can be well described by a single Sérsic profile.
The latter is in good agreement with observations of radial surface brightness profiles for massive elliptical galaxies, where both single- and double-Sérsic-profiles are observed without a clear correlation to the global dynamical state of the cluster. From the double-Maxwell method, we find BCG mass fractions generally ranging between , but the large mass fractions are rare and most of the BCGs have mass fractions between 30 and 40%, which is in agreement with observational fractions obtained for the BCGs in very massive clusters (e.g., Presotto et al., 2014 [14], Burke et al., 2015 [15]).
We use the BCG mass fractions obtained with both methods to decide whether a double-component fit is needed for the velocity distributions and the surface density profiles or if a single-component fit is sufficient: if the BCG mass fraction obtained through a double-Maxwell fit is below or above , we judge that there is no clear signal of a second component in this fit and we thus classify these clusters as single-Maxwell clusters. If the BCG mass fraction is between these values, i.e., , we gauge the double-Maxwell-fit to be necessary and thus classify the cluster as double-Maxwell cluster. As shown in the upper part of Table 2, the fraction of single-Maxwell clusters is below , and nearly all clusters show velocity distributions that reflect two-component systems. Therefore, we conclude that the typical galaxy cluster shows a two-component behaviour in its velocity distribution, in agreement with recent observations—for example, by Longobardi et al., 2015 [4] and Bender et al., 2015 [3].
Similarly, we classify a galaxy cluster as a single-Sérsic cluster if the BCG mass fraction obtained from the double-Sérsic fit is below or above , while we classify a cluster as double-Sérsic cluster if the BCG mass fraction is between . Here, we clearly see the same split-up that we already saw from Figure 6, i.e., that about half of the clusters are single-Sérsic clusters while the other half are double-Sérsic clusters, with a slight trend towards the latter (see upper part of Table 2).
Using both classifications, we can now test how many clusters show a double-fit-behaviour in both the velocity distribution and the surface density profiles. We find that this is the case for more than half of the galaxy clusters in our sample, as shown in the lower part of Table 2 and Figure 7, while about 40% of the clusters are double-Maxwell but single-Sérsic clusters. The single-Maxwell clusters represent less than 6% of all our clusters; they are roughly evenly distributed between single-Sérsic and double-Sérsic cases.
From these results, we conclude that the velocity distribution of a cluster can still distinguish between the component that belongs to the direct potential of the BCG and the outer component that was accreted onto the cluster and stored in the outer regions of the BCG through stripping and flyby events, building up the DSC component that still retains this memory of the assembly history. On the other hand, the imprint of this assembly history is not always visible in the radial surface density profiles of the cluster BCGs as a separate component, where only in some cases the BCG can be separated from the DSC through the surface density profiles, while, in other cases, this is not possible. Whether the assembly history can be traced from the shape of the outer stellar halo radial density profiles of BCGs and galaxies in general will be part of a forthcoming study (see Remus et al., 2016 [7] for a preview on these results).
4. Mass–Velocity-Dispersion Relation
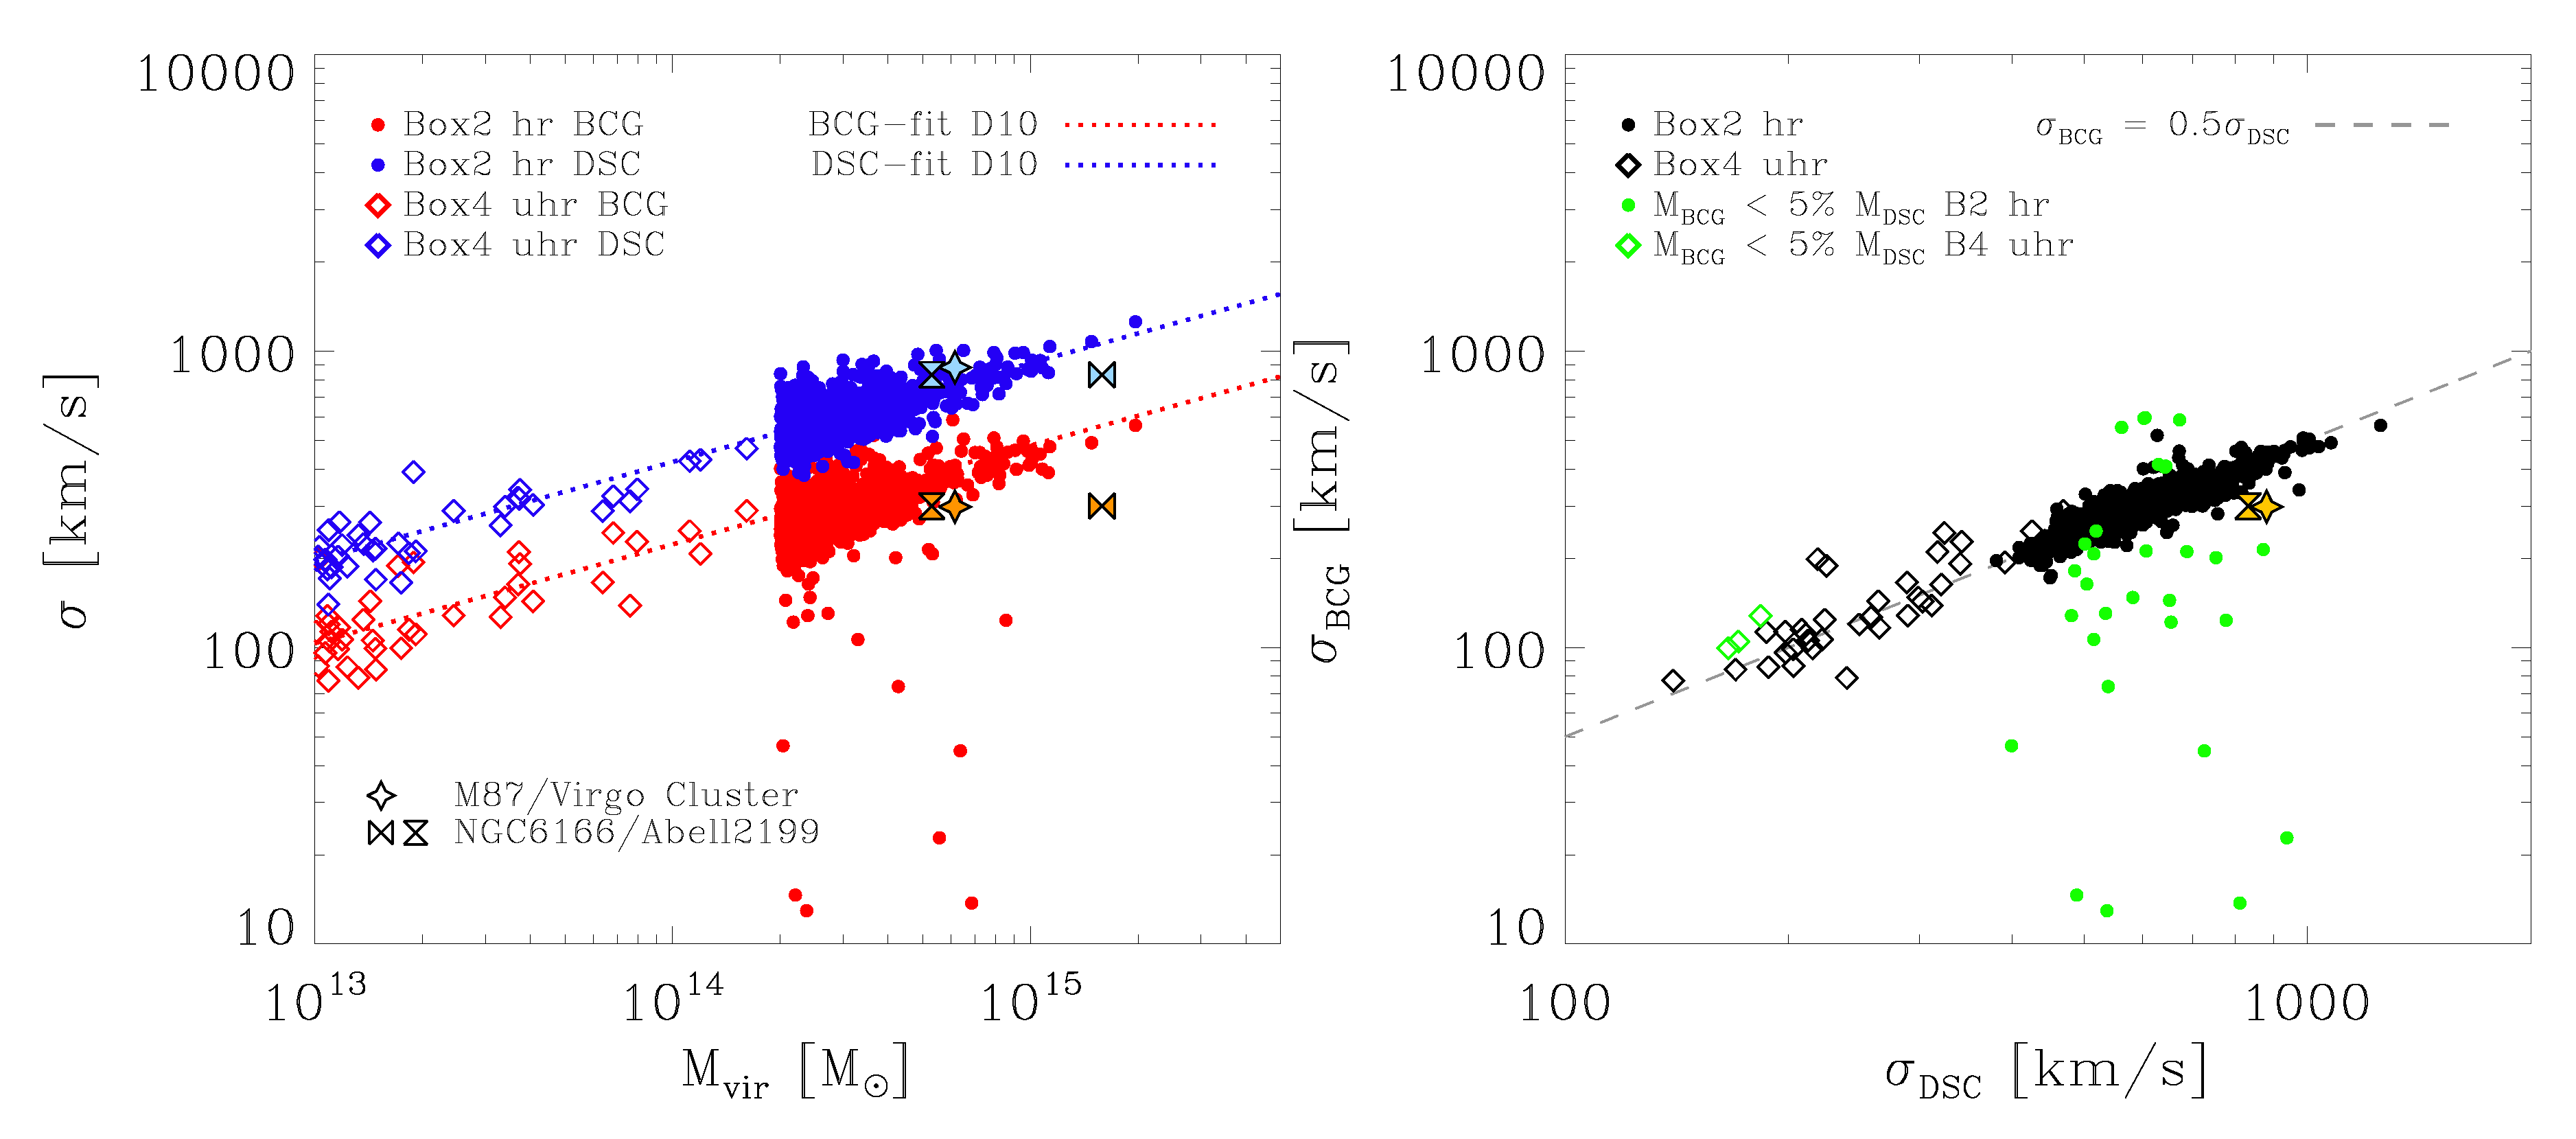
Finally, we want to see if a correlation exists between the velocity dispersion obtained from the Maxwell fits for the BCG and the DSC and the virial mass of the host cluster, as presented by Dolag et al., 2010 [2]. For this purpose, the left panel of Figure 8 shows the velocity dispersion of the BCG component versus the virial mass of the cluster in red, and the velocity dispersion of the DSC versus the virial mass of the cluster in blue. As can clearly be seen, we find a strong correlation for both components with the virial mass of the cluster, and these correlations hold even for the galaxy groups in the lower mass regime, indicating that the split-up between the brightest group galaxies (BGGs) and the Intra-group light (IGL) behaves similarly to that of clusters, clearly hinting at a similar growth mechanism for the IGL through stripping.
The left panel of Figure 8 also shows the fits to the velocity-dispersion–virial-mass relation presented by Dolag et al., 2010 [2] as red and blue dotted lines for the BCGs and the DSC, respectively. Although not fitted to the current simulation set but obtained from a less advanced simulation set of the local universe, these relations perfectly describe the behaviour found for the Magneticum simulation sample of galaxy clusters and galaxy groups, even at the low mass end. This additionally proves that this behaviour is independent of the details of the subgrid models included in the simulations.
As can also be seen from Figure 8, the relation between the velocity dispersion and the virial mass for the BCGs and the DSC has the same slope, with the DSC simply having overall larger velocity dispersions than the BCGs. More precisely, as shown in the right panel of Figure 8, the relation between the velocity dispersions of the BCG and the DSC is very tight and can be described as
Again, this behaviour holds even at the galaxy group mass scale, as indicated by the open diamonds marking the groups selected from the smaller volume Box4 with the higher resolution. In addition, this not only demonstrates that galaxy groups and clusters show a similar behaviour, but it also proves that the correlations presented here are independent of the resolution of the simulation and thus only driven by physical processes like accretion and star formation.
Interestingly, we can also explain the few outliers that can be seen in both the velocity-dispersion–virial-mass relation and the velocity-dispersion relation between the BCGs and their DSC: if we mark all clusters (and groups) where the BCG mass fraction obtained from the double-Maxwellian fit is below 5% (green circles and diamonds in the right panel of Figure 8), all outliers are captured. This clearly indicates that for all galaxy clusters where a double-Maxwellian fit is the better representation of the velocity distribution, the discussed relation between both components and the virial mass of the cluster is present and very tight, and driven by the assembly history of the clusters.
In addition, we also included the observations for NGC 6166 in the cluster Abell 2199 from Bender et al., 2015 [3] and M 87 in the Virgo cluster from Longobardi et al., 2015 [4] in both panels of Figure 8 (for details on the virial mass estimated for these clusters, see the figure caption). Both observations are in excellent agreement with the correlations found in this study, especially with respect to the BCG–DSC velocity dispersion correlation.
5. Discussion and Conclusion
In this work, we presented a detailed and statistically sound analysis of the stellar velocity distributions and the projected stellar radial surface density profiles of galaxy clusters and galaxy groups selected from the Magneticum pathfinder simulation sample. Using two volumes of different sizes and resolutions, we showed that for more than of all 928 clusters and groups in our sample the velocity distributions are represented best by a superposition of two Maxwellian distributions, with the slower component representing the BCG of the cluster and the faster component representing the DSC. We demonstrated that the relative mass fractions of the BCGs found through these fits is in agreement with recent observations. This behaviour in the velocity distribution strongly supports the idea that the DSC is built up from stripping of smaller satellites within the cluster potential close to its center, where the BCG resides.
Furthermore, we found that there is a clear and tight correlation between the velocity dispersions of the two components obtained by these fits and the virial mass of the host clusters, and that this correlation holds down to group-mass scales. We also demonstrated that the velocity dispersions of both components are correlated tightly, with the BCG having about half the velocity dispersion of the DSC, and that the few available observations that distinguish between both components are in excellent agreement with our results.
Additionally, we tested if the same separation into two distinct components is reflected in the projected radial surface density profiles of the cluster. Interestingly, we could only find a separation of the radial profiles into two components in about half of the clusters that exhibit a double-Maxwell imprint in the velocity distribution, clearly showing that the radial profile is not always suitable for distinguishing the two components and that further indicators are needed in the radial stellar profiles to obtain information about the assembly history of galaxy clusters. This issue will be addressed in a forthcoming study.
Lastly, we also tested if we can find a correlation between the velocity distribution behaviour of the DSC and the X-ray or shock properties in the four objects we have examined in detail. No such correlations were evident. On the contrary, we find indications that the X-ray and shock properties describe the very recent assembly history of the cluster, where the presence of shocks and X-ray offsets indicate an ongoing merger event, while the velocity distribution of the stellar component of the galaxy clusters and the BCGs appears to be an indicator for the earlier assembly history of the cluster.
Acknowledgments
We thank the anonymous referees for their helpful comments. The Magneticum Pathfinder simulations were partly performed at the Leibniz-Rechenzentrum with CPU time assigned to the Project “pr86re”. This work was supported by the DFG Cluster of Excellence “Origin and Structure of the Universe”. We are especially grateful for the support by M. Petkova through the Computational Center for Particle and Astrophysics (C2PAP).
Author Contributions
K.D. performed the simulations; R.-S.R. and T.L.H. analysed the data; R.-S.R. wrote the paper.
Conflicts of Interest
The authors declare no conflict of interest.
References
- Murante, G.; Giovalli, M.; Gerhard, O.; Arnaboldi, M.; Borgani, S.; Dolag, K. The importance of mergers for the origin of intracluster stars in cosmological simulations of galaxy clusters. Mon. Not. R. Astron. Soc. 2007, 377, 2–16. [Google Scholar] [CrossRef]
- Dolag, K.; Murante, G.; Borgani, S. Dynamical difference between the cD galaxy and the diffuse, stellar component in simulated galaxy clusters. Mon. Not. R. Astron. Soc. 2010, 405, 1544–1559. [Google Scholar] [CrossRef]
- Bender, R.; Kormendy, J.; Cornell, M.E.; Fisher, D.B. Structure and Formation of cD Galaxies: NGC 6166 in ABELL 2199. Astrophys. J. 2015, 807, 56. [Google Scholar] [CrossRef]
- Longobardi, A.; Arnaboldi, M.; Gerhard, O.; Hanuschik, R. The outer regions of the giant Virgo galaxy M 87: Kinematic separation of stellar halo and intracluster light. Astron. Astrophys. 2015, 579, A135. [Google Scholar] [CrossRef]
- Mihos, J.C. Intragroup and Intracluster Light. In Proceedings of the IAU Symposium 317: The General Assembly of Galaxy Halos: Structure, Origin and Evolution, Honolulu, HI, USA, 3–7 August 2015; Volume 317, pp. 27–34. [Google Scholar]
- Puchwein, E.; Springel, V.; Sijacki, D.; Dolag, K. Intracluster stars in simulations with active galactic nucleus feedback. Mon. Not. R. Astron. Soc. 2010, 406, 936–951. [Google Scholar] [CrossRef]
- Remus, R.S.; Burkert, A.; Dolag, K. A “Universal” Density Profile for the Outer Stellar Halos of Galaxies. ArXiv, 2016; arXiv:1605.0651. [Google Scholar]
- Springel, V. The cosmological simulation code GADGET-2. Mon. Not. R. Astron. Soc. 2005, 364, 1105–1134. [Google Scholar] [CrossRef]
- Springel, V.; Hernquist, L. Cosmological smoothed particle hydrodynamics simulations: A hybrid multiphase model for star formation. Mon. Not. R. Astron. Soc. 2003, 339, 289–311. [Google Scholar] [CrossRef]
- Tornatore, L.; Borgani, S.; Dolag, K.; Matteucci, F. Chemical enrichment of galaxy clusters from hydrodynamical simulations. Mon. Not. R. Astron. Soc. 2007, 382, 1050–1072. [Google Scholar] [CrossRef]
- Hirschmann, M.; Dolag, K.; Saro, A.; Bachmann, L.; Borgani, S.; Burkert, A. Cosmological simulations of black hole growth: AGN luminosities and downsizing. Mon. Not. R. Astron. Soc. 2014, 442, 2304–2324. [Google Scholar] [CrossRef]
- Teklu, A.F.; Remus, R.S.; Dolag, K.; Beck, A.M.; Burkert, A.; Schmidt, A.S.; Schulze, F.; Steinborn, L.K. Connecting Angular Momentum and Galactic Dynamics: The Complex Interplay between Spin, Mass, and Morphology. Astrophys. J. 2015, 812, 29. [Google Scholar] [CrossRef]
- Dolag, K.; Borgani, S.; Murante, G.; Springel, V. Substructures in hydrodynamical cluster simulations. Mon. Not. R. Astron. Soc. 2009, 399, 497–514. [Google Scholar] [CrossRef]
- Presotto, V.; Girardi, M.; Nonino, M.; Mercurio, A.; Grillo, C.; Rosati, P.; Biviano, A.; Annunziatella, M.; Balestra, I.; Cui, W.; et al. Intracluster light properties in the CLASH-VLT cluster MACS J1206.2-0847. Astron. Astrophys. 2014, 565, A126. [Google Scholar] [CrossRef] [Green Version]
- Burke, C.; Hilton, M.; Collins, C. Coevolution of brightest cluster galaxies and intracluster light using CLASH. Mon. Not. R. Astron. Soc. 2015, 449, 2353–2367. [Google Scholar] [CrossRef]
- Tully, R.B. Galaxy Groups: A 2MASS Catalog. Astron. J. 2015, 149, 171. [Google Scholar] [CrossRef]
- Collaboration, P.; Ade, P.A.R.; Aghanim, N.; Arnaud, M.; Ashdown, M.; Aumont, J.; Baccigalupi, C.; Banday, A.J.; Barreiro, R.B.; Barrena, R.; et al. Planck 2015 results. XXVII. The second Planck catalogue of Sunyaev-Zeldovich sources. Astron. Astrophys. 2016, 594, A27. [Google Scholar] [CrossRef]
Figure 1.
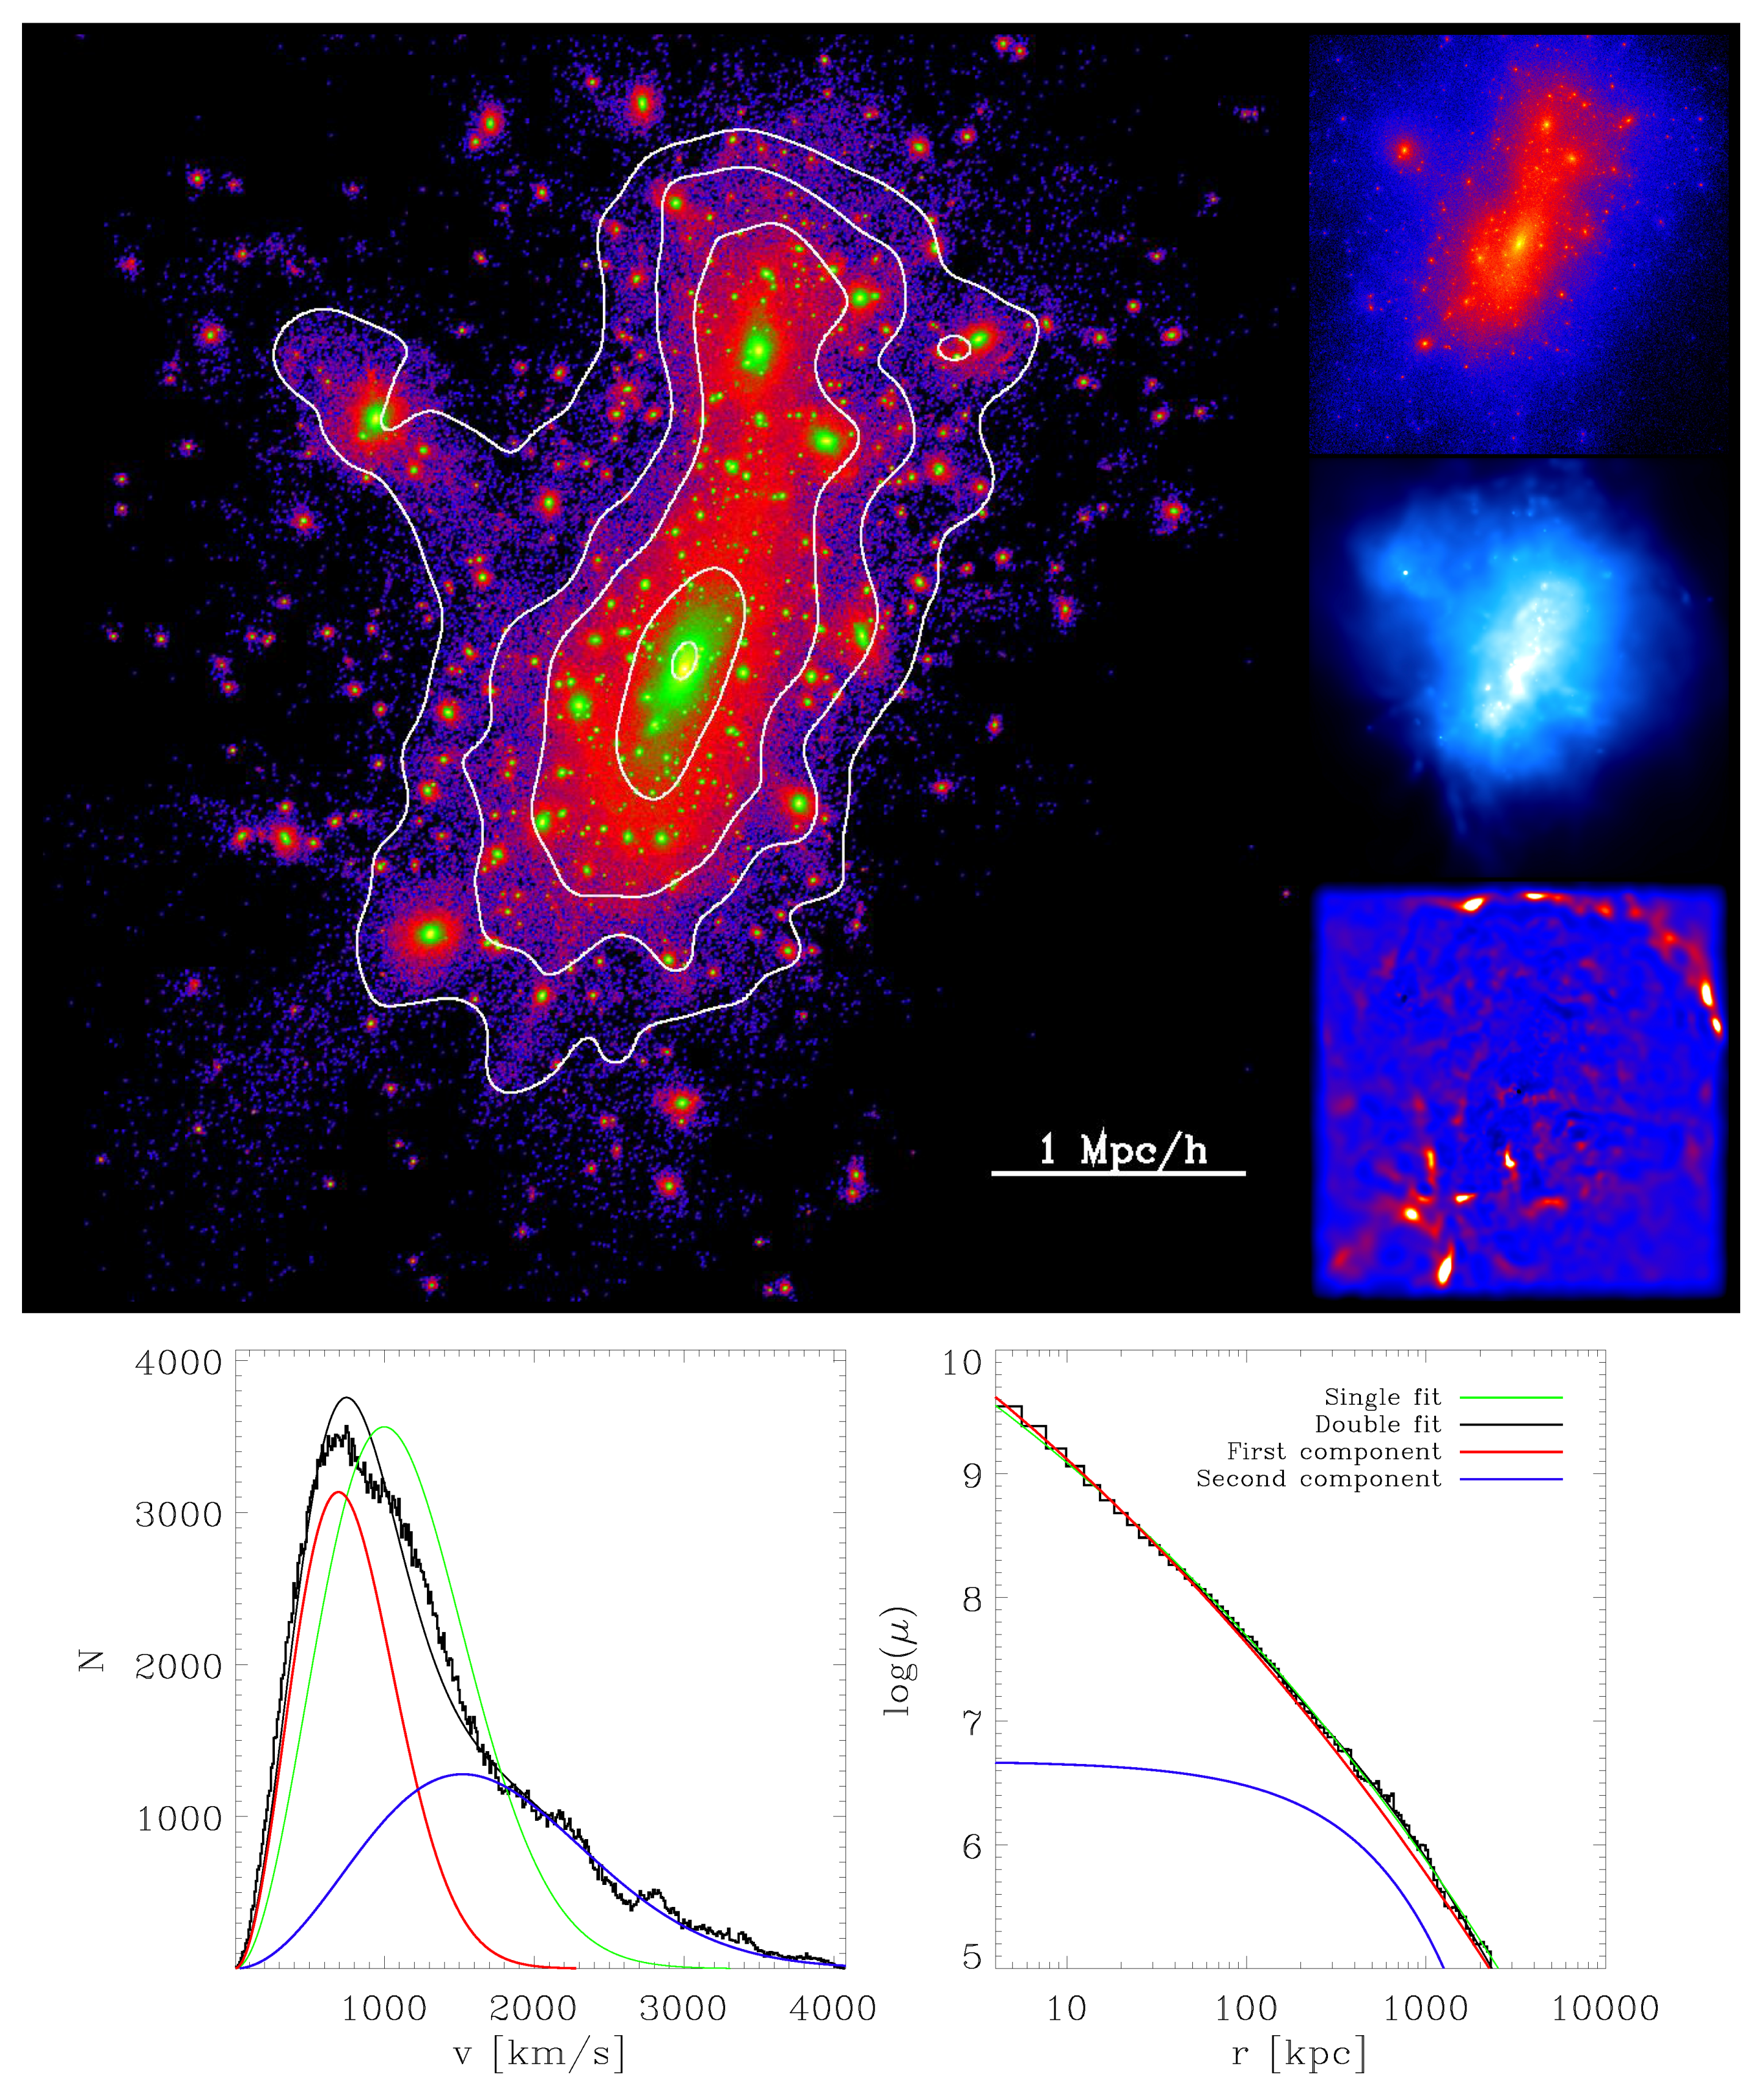
Example of a galaxy cluster where the velocity distribution is best described by a double Maxwellian fit, while the radial surface density profile can be well described by a single Sérsic profile (class d/s). Upper left panel: Stellar particle density map of the cluster, with the densest areas in yellow/green and the least dense areas in blue/black. White contours mark the iso-brightness lines of the DSC with the galaxies subtracted. Upper right panels, from top to bottom: Total matter density map; X-ray surface brightness map; unsharp-masked image of the pressure map to visualize shock fronts, as indicated by the large, arc-like feature in the upper right corner. Lower left panel: Velocity histogram for the stellar particles within the cluster, excluding those from substructures.
Figure 1.
Example of a galaxy cluster where the velocity distribution is best described by a double Maxwellian fit, while the radial surface density profile can be well described by a single Sérsic profile (class d/s). Upper left panel: Stellar particle density map of the cluster, with the densest areas in yellow/green and the least dense areas in blue/black. White contours mark the iso-brightness lines of the DSC with the galaxies subtracted. Upper right panels, from top to bottom: Total matter density map; X-ray surface brightness map; unsharp-masked image of the pressure map to visualize shock fronts, as indicated by the large, arc-like feature in the upper right corner. Lower left panel: Velocity histogram for the stellar particles within the cluster, excluding those from substructures.
(Continued in Figure 2.)
Figure 2.
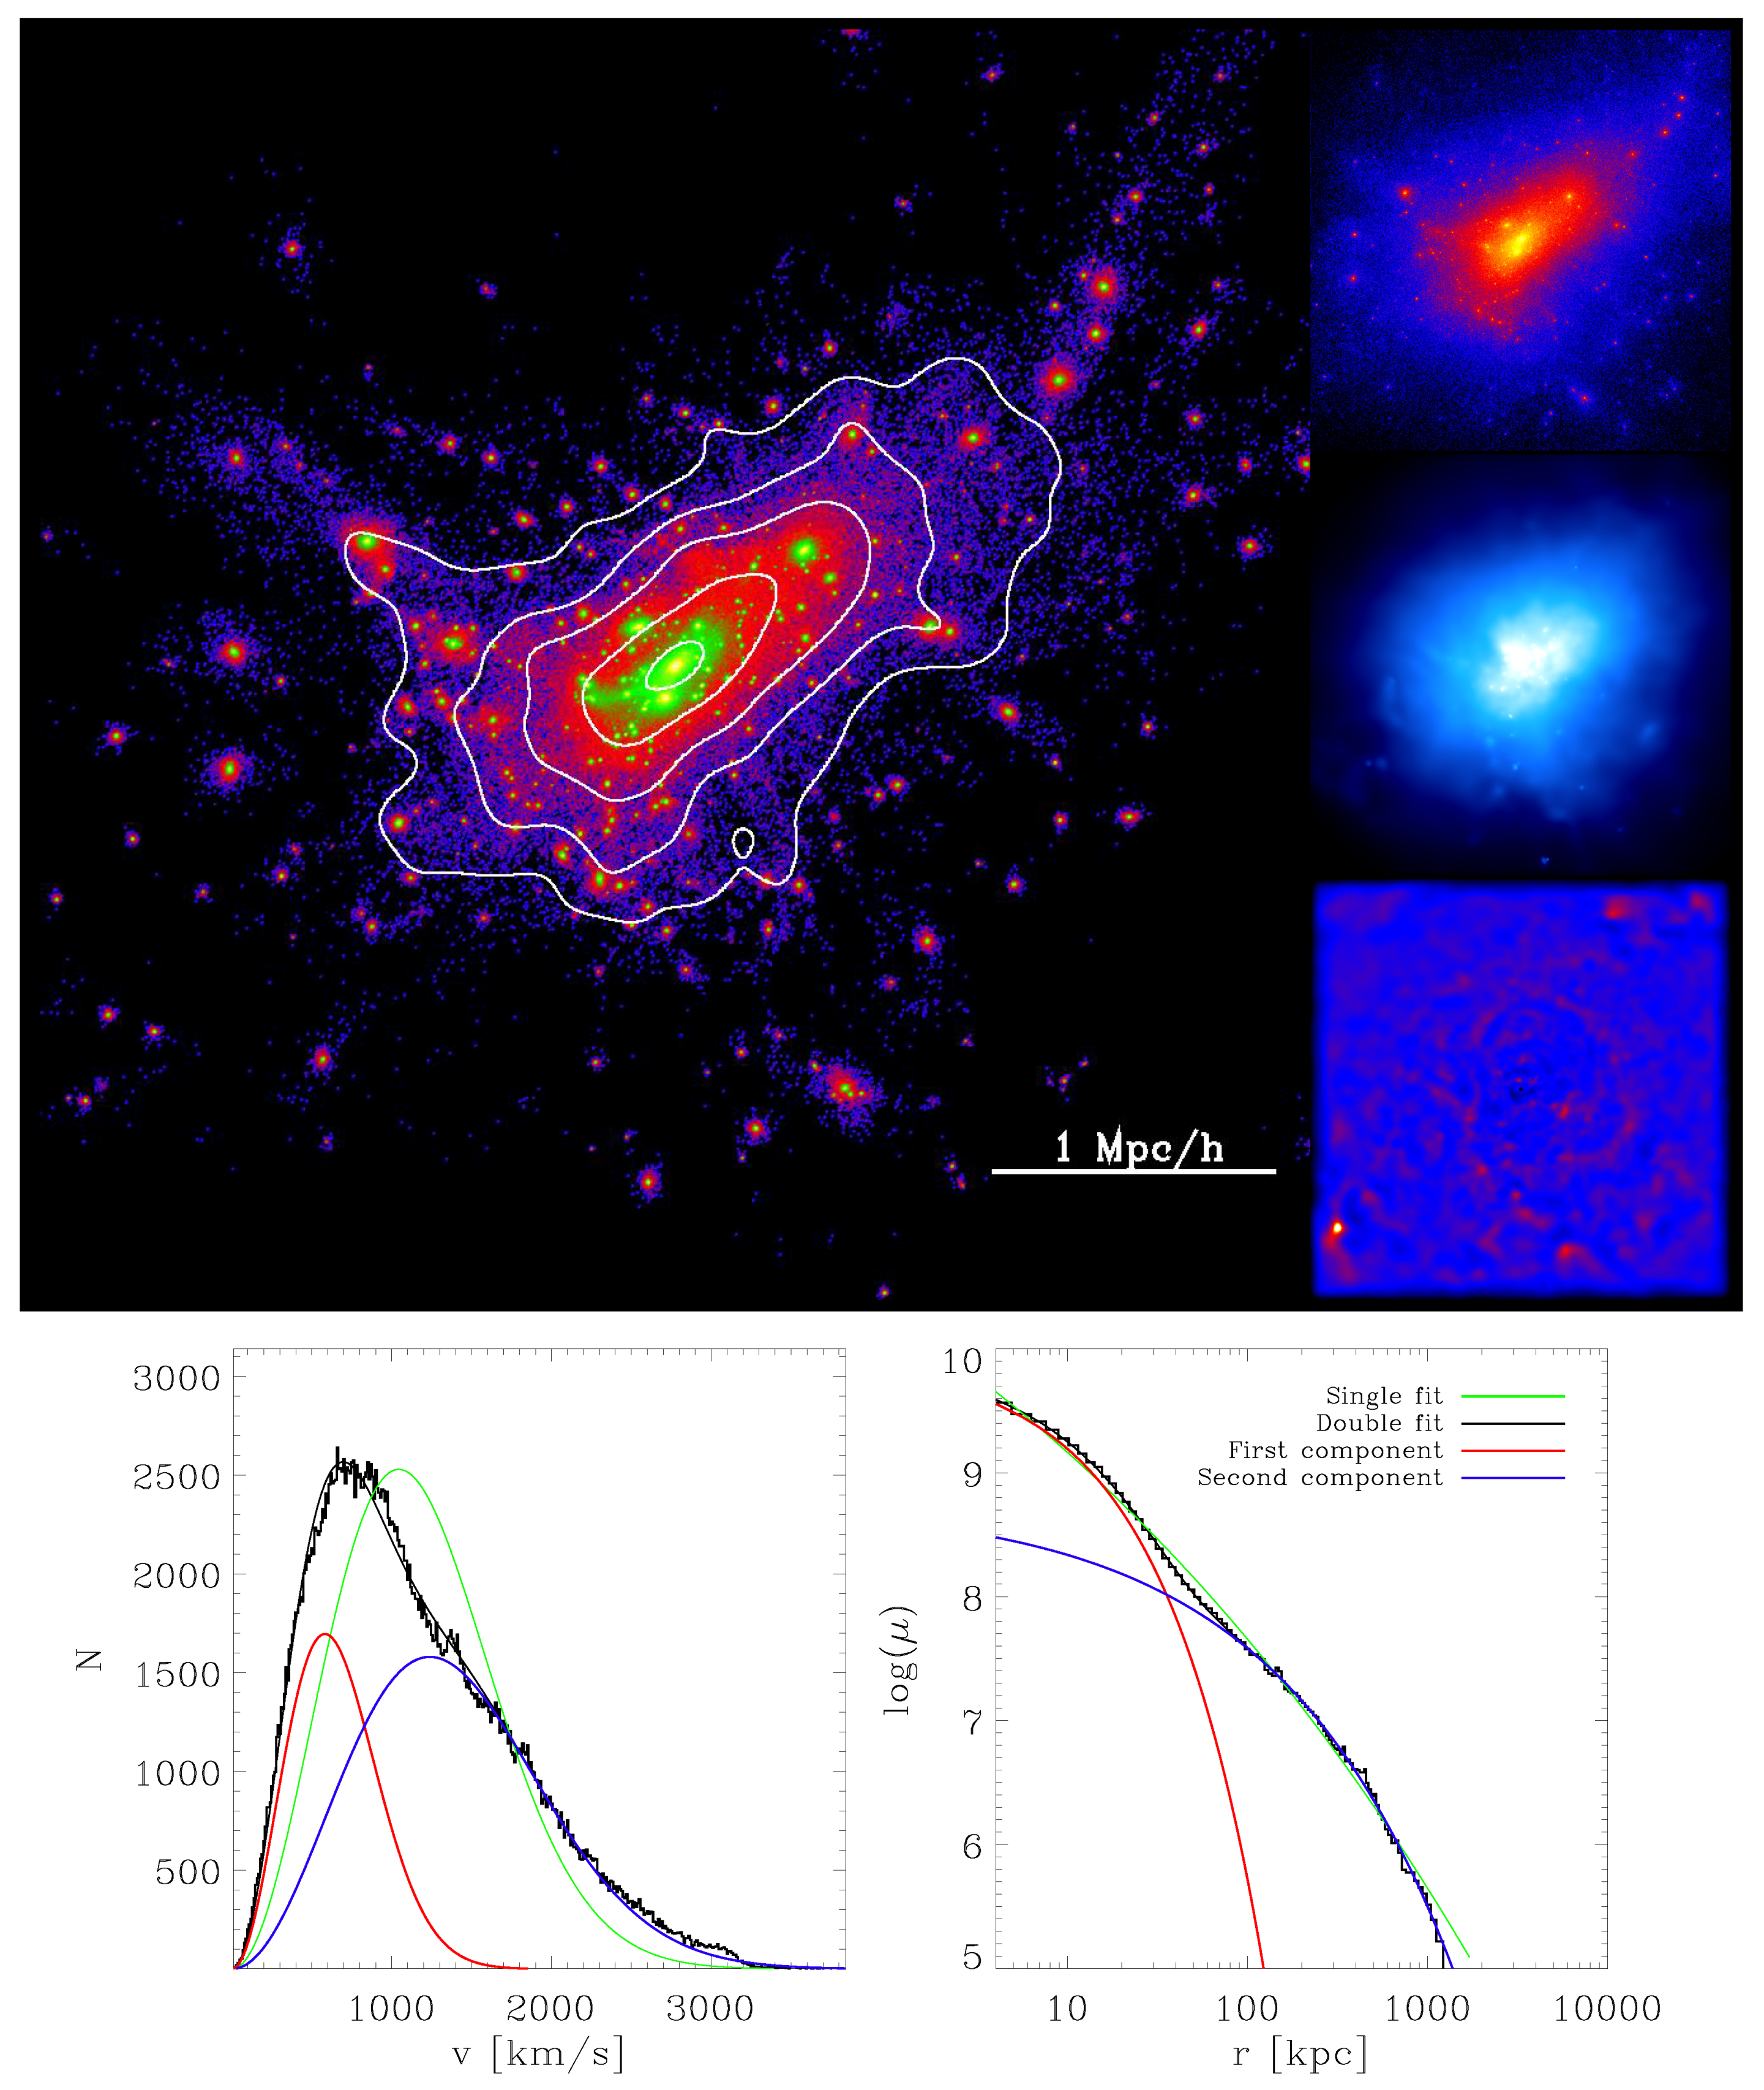
Same as Figure 1 but for a cluster with a double Maxwellian distribution in the velocity and a double Sérsic radial surface density profile as best representation (class d/d). Although the cluster is quite extended, there are no shocks visible, indicating a very late state of the merger.
Figure 2.
Same as Figure 1 but for a cluster with a double Maxwellian distribution in the velocity and a double Sérsic radial surface density profile as best representation (class d/d). Although the cluster is quite extended, there are no shocks visible, indicating a very late state of the merger.

(Continued from Figure 1.) The green line shows the best single-Maxwell fit to the histogram, while the black line shows the best double-Maxwell fit to the histogram with the red and blue lines indicating the individual Maxwellians of the BCG (first) component and the DSC (second) component. Lower right panel: Projected radial stellar surface density profile (with substructures already subtracted) of the cluster centered around the BCG—colours as in the left panel but for the Sérsic fits.
Figure 3.
Same as Figure 1 but for a cluster where the velocity distribution is well described by a single Maxwellian and the radial surface density profile is also well described by a single Sérsic profile (class s/s). Although the outwards-moving substructure to the right has lost all its gas component, the injected shock within the ICM is still clearly visible as a large arc.

Figure 4.
Same as Figure 1 but for a special case where a third component would be needed to describe the velocity distribution, while the radial surface density profile does not show signs of a third component. Since we do not explicitly study these special cases in this work, this cluster is classified as belonging belong to the d/d class, as both the velocity and the radial density clearly are multi-component systems.

Figure 5.
Line-of-sight velocity distributions of the stellar particles (excluding those bound to substructures) of the cluster shown in Figure 1, from a random projection. The green line is the best single Gaussian fit to the distribution, while the black line is the best double-Gaussian fit with its components shown in red and blue.
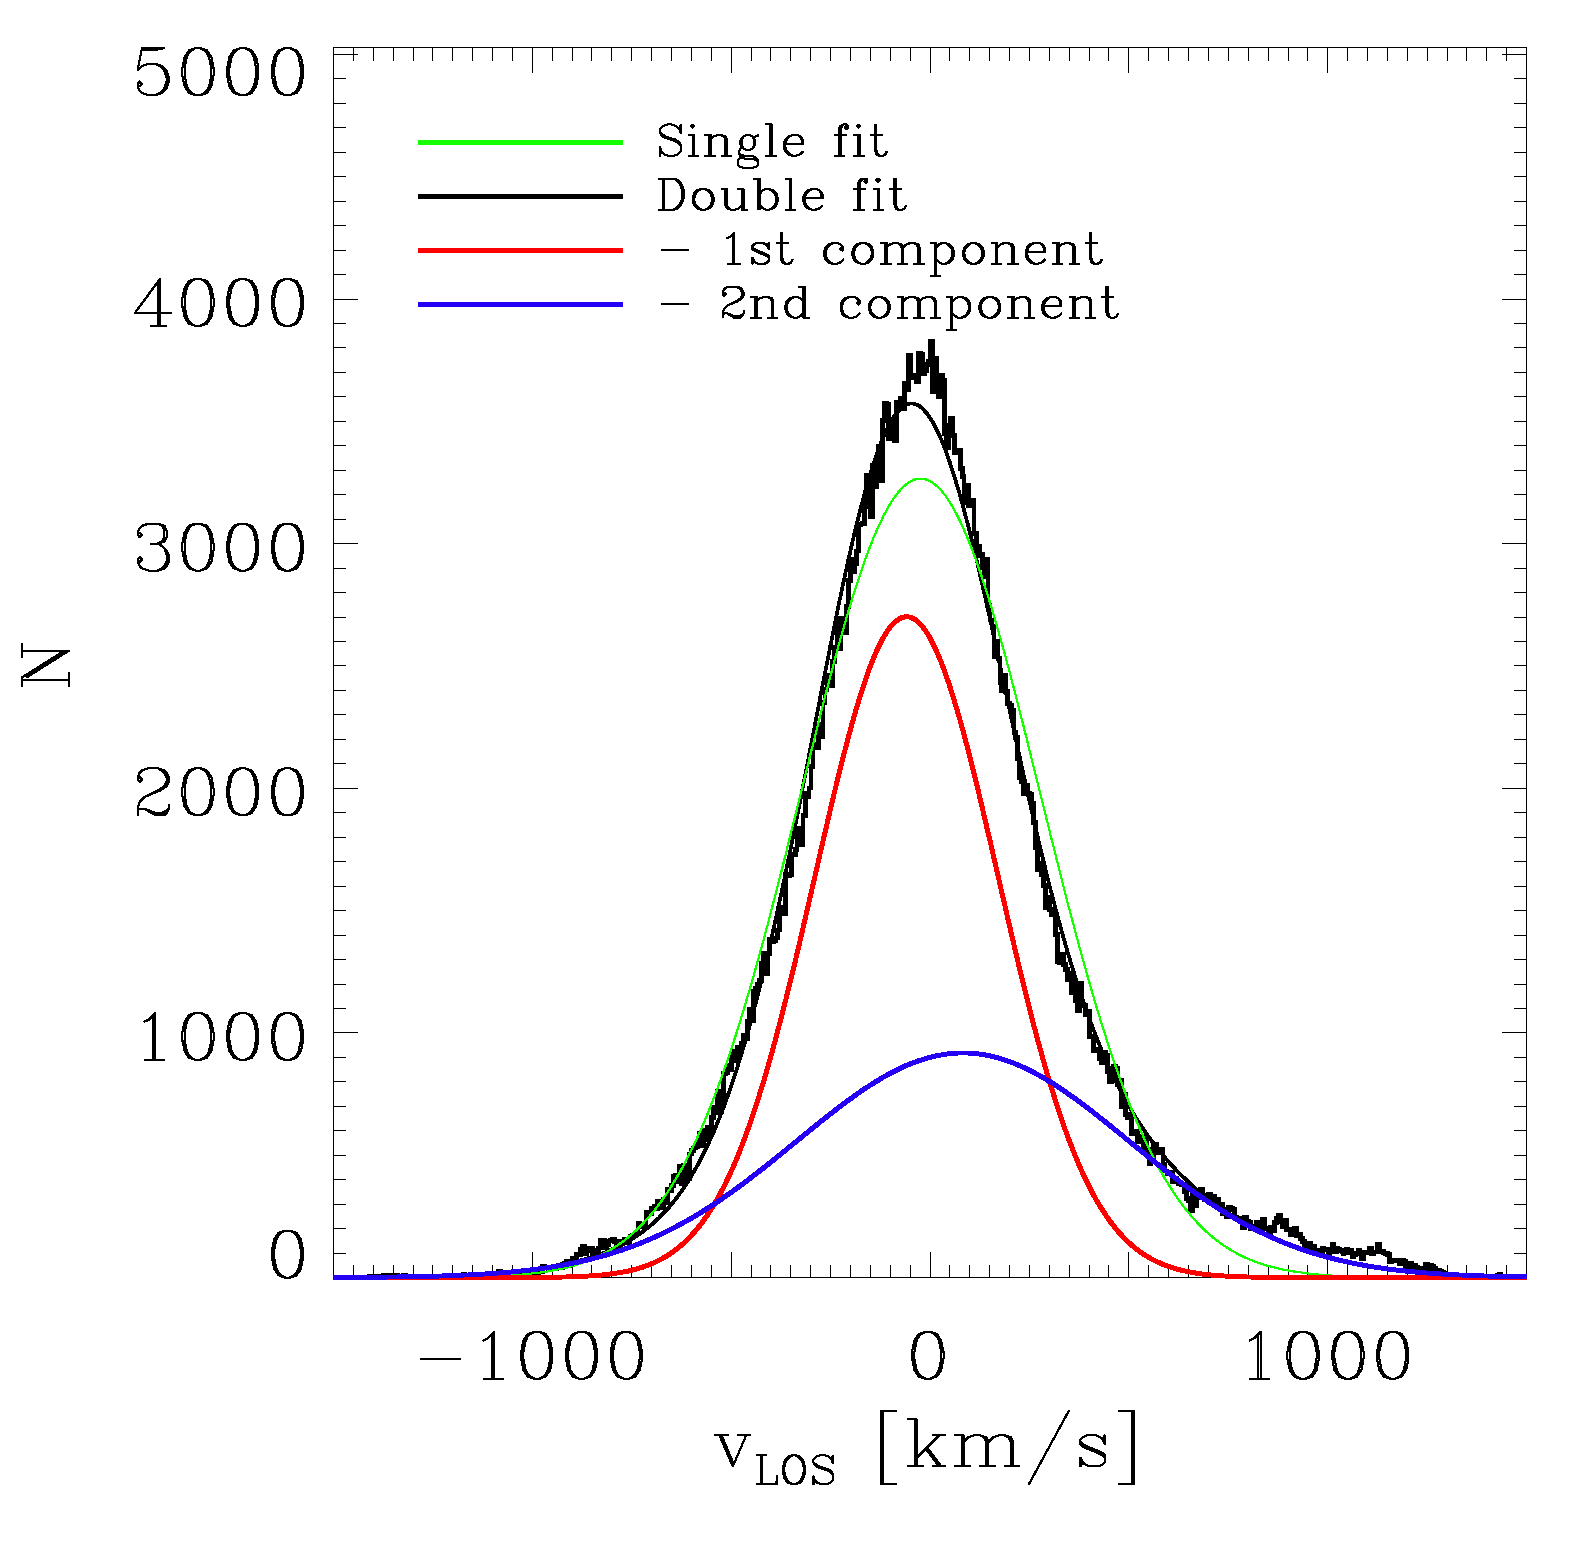
Figure 6.
Left panel: Histogram of the mass fraction ascribed to the BCG according to the double-Maxwell fits (blue) and the double-Sérsic fits (red). The mass ascribed to the BCG is always the mass of the slower (Maxwellian fits) or the innermost (Sérsic fits) component. Right panel: BCG mass fractions obtained from the Maxwell fits versus those obtained with the Sérsic fits. Light blue symbols show the clusters from Box2b, while dark blue open diamonds mark the galaxy groups selected from Box4. There is no evident correlation between the mass partitioning obtained with the two different methods, and there is also no difference between galaxy groups and clusters.

Figure 7.
Fraction of galaxy clusters and groups that can be described best by a single Maxwell distribution and a single Sérsic profile (class s/s; green), a double Maxwell distribution and a single Sérsic profile (class d/s; red), a single Maxwell distribution and a double Sérsic profile (class s/d; yellow), and a double Maxwell distribution and a double Sérsic profile (class d/d; blue).
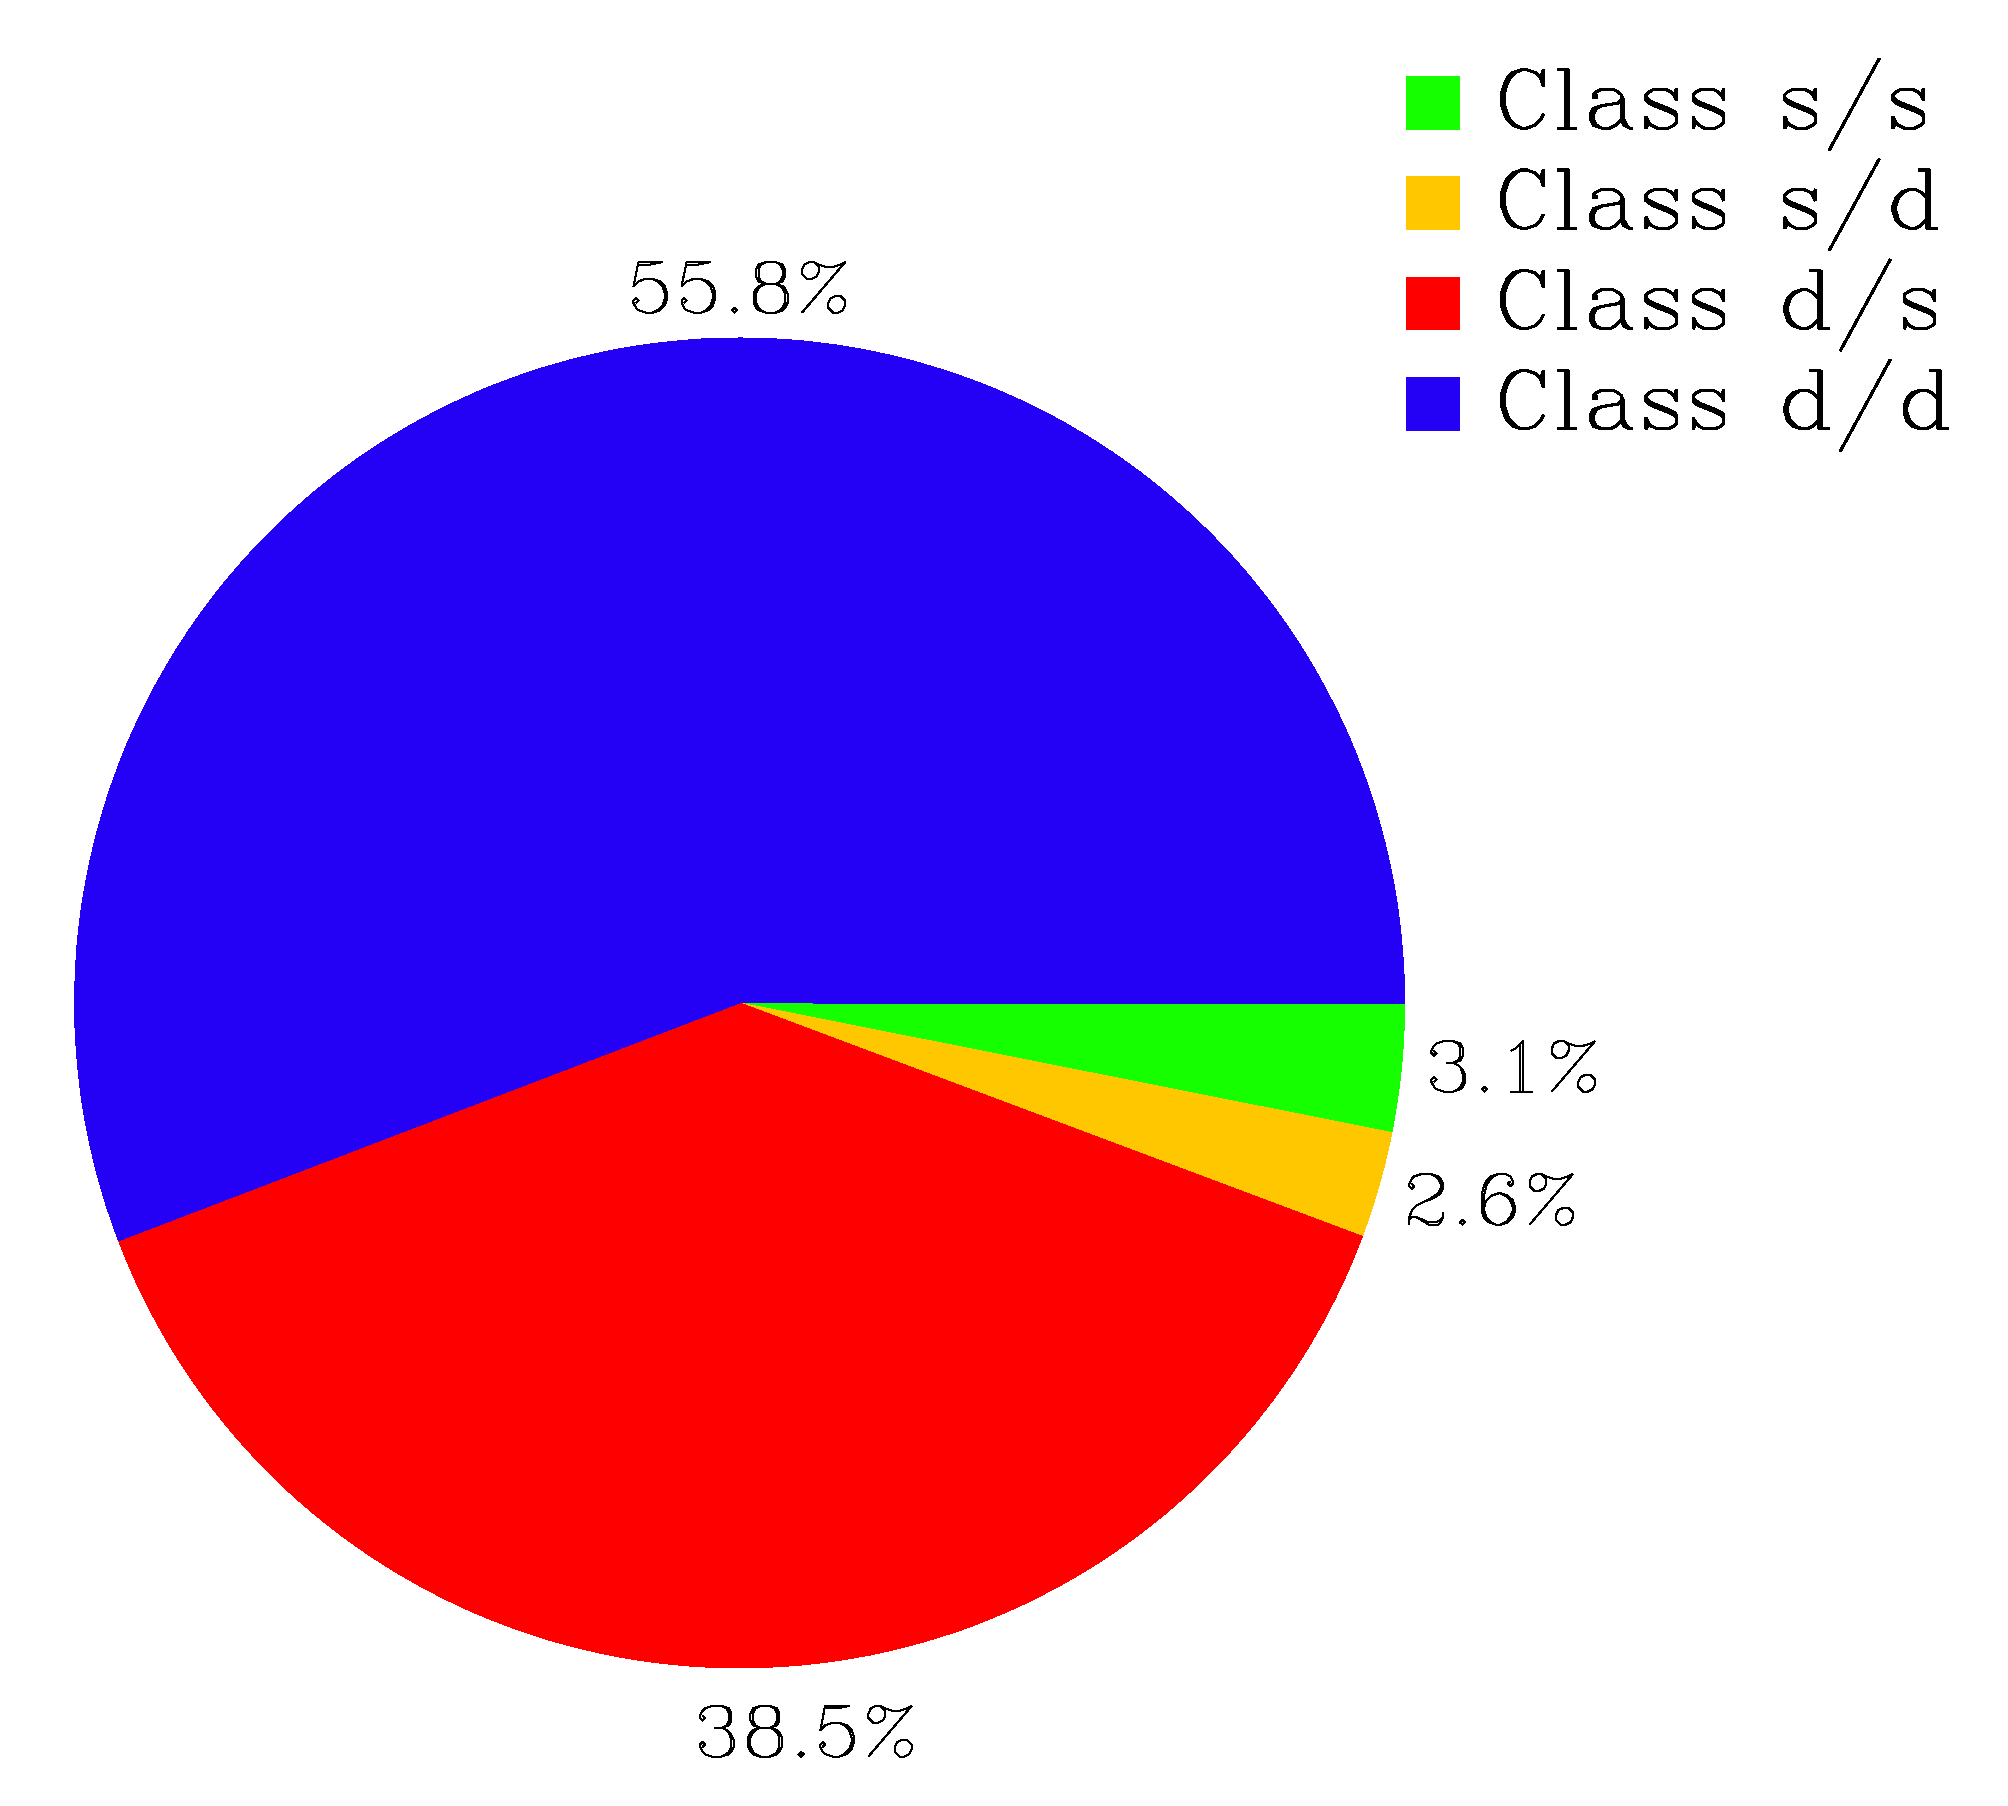
Figure 8.
Left panel: Velocity dispersion obtained from the double-Maxwellian fit versus virial mass for the BCG-component (red) and the DSC-component (blue) for all galaxy clusters in Box2b (filled circles) and all galaxy groups in Box4 (open diamonds). The red and blue lines are not fitted to the data presented here but are those from Dolag et al., 2010 [2]. The orange and light blue symbols show velocity dispersions from observations of NGC 6166 in the cluster Abell 2199 (bowties/hourglasses) from Bender et al., 2015 [3] and of M 87 in the Virgo cluster (stars) from Longobardi et al., 2015 [4]. The virial mass for Virgo is taken from Tully, 2015 [16] using the average of the masses based on the total K-band luminosity and the virial mass inferred from the zero velocity surface. For Virgo, this is in agreement with measurements by PLANCK [17]; for Abell 2199, we included measurements of the virial mass from the PLANCK mission [17] (hourglasses) as they give significantly smaller values than the one inferred by Tully, 2015 [16] (bowties). Right panel: BCG velocity dispersion versus DSC velocity dispersion obtained from the double-Maxwellian fits for the same clusters (filled circles) and groups (open diamonds) as in the left panel. The grey dashed line shows the relation. Green symbols mark all clusters and groups for which the BCG-component has less than of the stellar mass of the total stellar mass of the system, according to the mass partitioning obtained from the double-Maxwellian fit. The yellow symbols show the same observations as in the left panel.


Table 1.
Magneticum simulations used in this work.
| Box Size | ||||
|---|---|---|---|---|
| Box2b hr | 910 Mpc | |||
| Box4 uhr | 68 Mpc |
Table 2.
Relative fractions of the 928 clusters and groups with regard to their Maxwell- and Sérsic-fit properties.
Table 2.
Relative fractions of the 928 clusters and groups with regard to their Maxwell- and Sérsic-fit properties.
| Single Maxwell sufficient | 53 | 5.7 |
| Double Maxwell needed | 875 | 94.3 |
| Single Sérsic sufficient | 386 | 41.6 |
| Double Sérsic needed | 542 | 58.4 |
| Single Maxwell, Single Sérsic (s/s) | 29 | 3.1 |
| Double Maxwell, Single Sérsic (d/s) | 357 | 38.5 |
| Single Maxwell, Double Sérsic (s/d) | 24 | 2.6 |
| Double Maxwell, Double Sérsic (d/d) | 518 | 55.8 |
© 2017 by the authors. Licensee MDPI, Basel, Switzerland. This article is an open access article distributed under the terms and conditions of the Creative Commons Attribution (CC BY) license (http://creativecommons.org/licenses/by/4.0/).
Share and Cite
MDPI and ACS Style
Remus, R.-S.; Dolag, K.; Hoffmann, T.L. The Outer Halos of Very Massive Galaxies: BCGs and their DSC in the Magneticum Simulations. Galaxies 2017, 5, 49. https://doi.org/10.3390/galaxies5030049
AMA Style
Remus R-S, Dolag K, Hoffmann TL. The Outer Halos of Very Massive Galaxies: BCGs and their DSC in the Magneticum Simulations. Galaxies. 2017; 5(3):49. https://doi.org/10.3390/galaxies5030049
Chicago/Turabian StyleRemus, Rhea-Silvia, Klaus Dolag, and Tadziu L. Hoffmann. 2017. "The Outer Halos of Very Massive Galaxies: BCGs and their DSC in the Magneticum Simulations" Galaxies 5, no. 3: 49. https://doi.org/10.3390/galaxies5030049
Note that from the first issue of 2016, this journal uses article numbers instead of page numbers. See further details here.