
High-Sensitivity AGN Polarimetry at Sub-Millimeter Wavelengths

Onsala Space Observatory, Department of Space Earth and Environment, Chalmers University of Technology, 41258 Gothenburg, Sweden
*
Author to whom correspondence should be addressed.
Galaxies 2017, 5(4), 65; https://doi.org/10.3390/galaxies5040065
Submission received: 31 August 2017
/
Revised: 17 September 2017
/
Accepted: 25 September 2017
/
Published: 15 October 2017
(This article belongs to the Special Issue Polarised Emission from Astrophysical Jets)
Abstract
:The innermost regions of radio loud Active Galactic Nuclei (AGN) jets are heavily affected by synchrotron self-absorption, due to the strong magnetic fields and high particle densities in these extreme zones. The only way to overcome this absorption is to observe at sub-millimeter wavelengths, although polarimetric observations at such frequencies have so far been limited by sensitivity and calibration accuracy. However, new generation instruments such as the Atacama Large mm/sub-mm Array (ALMA) overcome these limitations and are starting to deliver revolutionary results in the observational studies of AGN polarimetry. Here we present an overview of our state-of-the-art interferometric mm/sub-mm polarization observations of AGN jets with ALMA (in particular, the gravitationally-lensed sources PKS 1830−211 and B0218+359), which allow us to probe the magneto-ionic conditions at the regions closest to the central black holes.
1. Introduction
Super massive black holes (SMBHs) are among the most exotic objects in the known Universe. Relativistic outflows (jets)—related to accretion discs—form in their immediate neighborhood via processes that are not yet well understood (e.g., [1,2]); processes that directly involve the action of the main pillars of modern physics: from general relativity to quantum mechanics. The study of AGN jets at the highest angular resolutions via mm-wave very long baseline interferometry (VLBI) observations (e.g., Figure 1) provides one of the most important sources of information to understand how relativistic outflows can form and evolve, departing with ultra-relativistic energies (and an extremely high degree collimation) from the vicinity of the SMBH up to distances of many times the size of their host galaxies. The polarized emission from active galactic nuclei (AG)N jets, both in intensity and electric-vector position angle (or polarization angle), EVPA, together with its time evolution and panchromatic correlations, is another important source of information. Changes in the polarized AGN emission have been observed on timescales from days to months, and from optical [3] to radio wavelengths [4]. There is also evidence that the polarization at optical wavelengths correlates with that at radio, especially at high frequencies [5]. Correlations between strong polarization changes and -ray activity have also been reported [4], and the radio-to--ray connection is the subject of extensive observational and theoretical studies (e.g., [6,7,8,9,10]). In addition to the time evolution of the electric vector position angle (EVPA), its wavelength dependence (the so-called rotation measure, ) can also be used to probe the magneto-ionic conditions either internal to the jet and around its immediate neighborhood [11,12,13,14]. To the time domain, the rapid time variability of the EVPA and its eventual correlation with -rays can be explained by shock-compression effects or from pseudo-random variability induced by turbulence, related to the regions of -ray up-scattering (see, e.g., [4,15,16,17] for detailed descriptions of these models). The interaction of turbulent plasma with shocks has been proposed to explain how very rapid variability of -rays can occur parsecs away from the SMBH, as has been observed in some sources (e.g., [18,19]). In any case, the main observational challenge for the study of these different scenarios and models is the detection and monitoring of polarized emission at very high resolutions both in time and space).
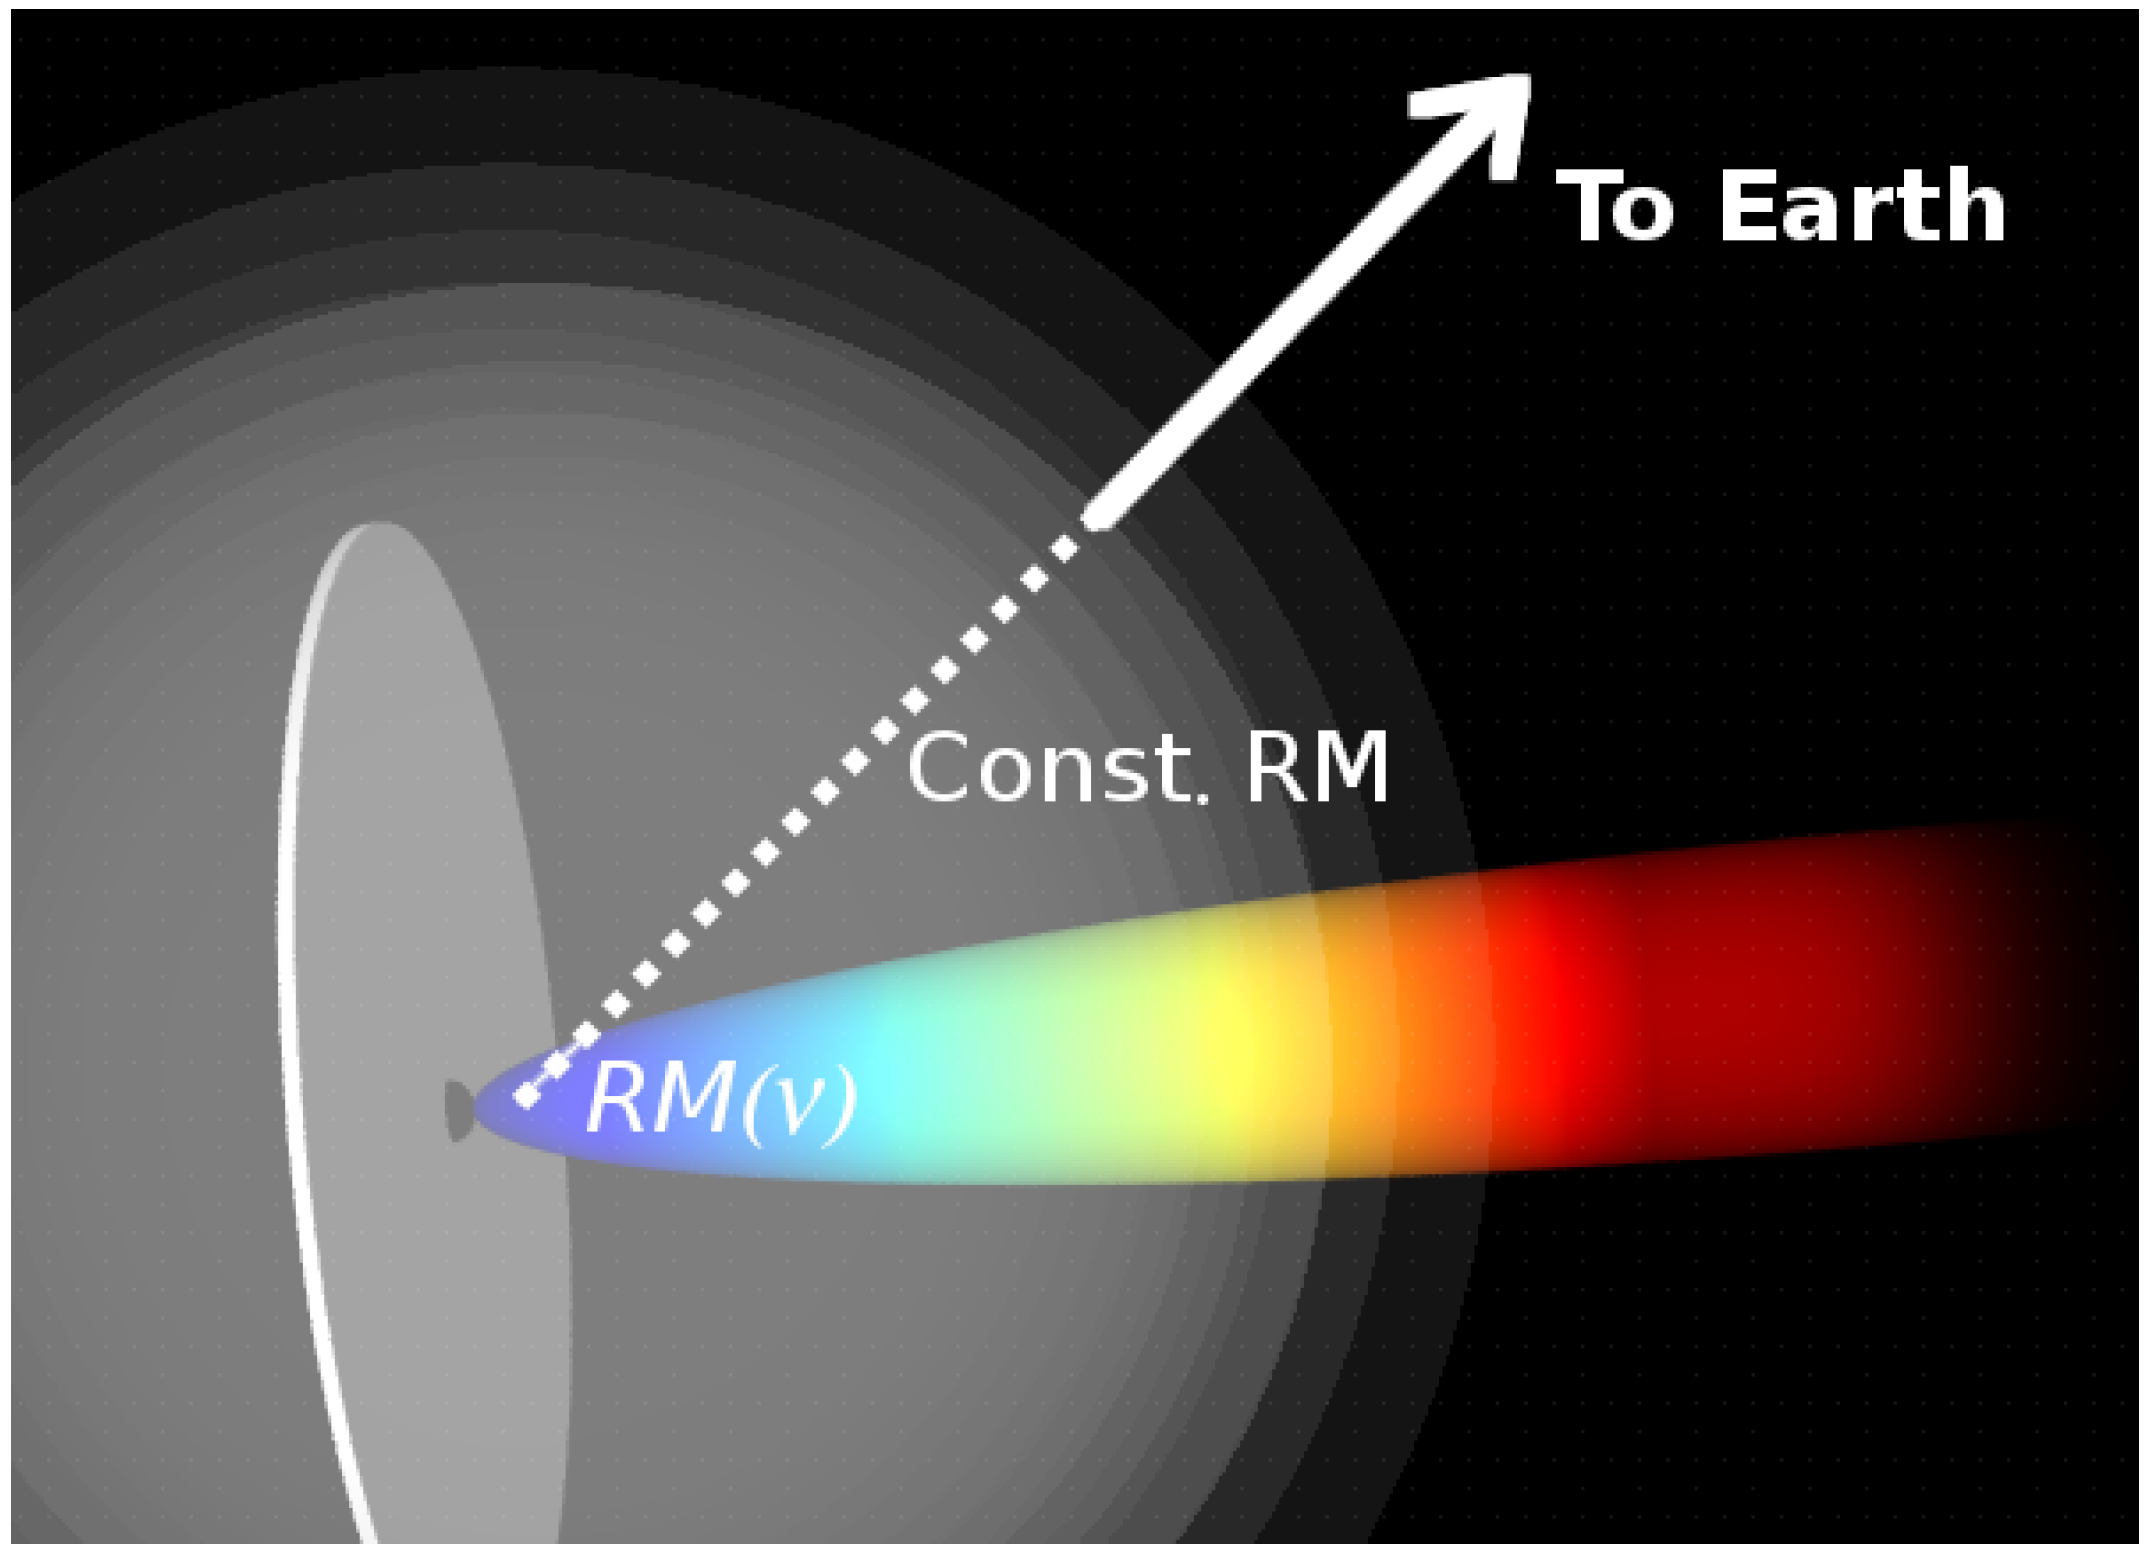
However, the observational limitations are set not only by resolution: the closest regions to the AGN’s central engine are heavily affected by synchrotron self-absorption (SSA) due to the high magnetic fields and particle densities characterising these extreme zones. Therefore, SSA prevents the detection of emission from regions very close to (if not at) the base of the jets at low radio frequencies. Only observations at very high frequencies (submm wavelengths) can probe such extreme regions in AGN (see Figure 2). Little is known (from a purely observational point of view) about the geometry and strength of the magnetic fields in these regions, as well as the density distribution of the material, both in the base of the outflow and in the zone immediately surrounding the central engine. It is needless to say that the eventual detection of RM at submm wavelengths, and the study of its time and frequency dependence, is a precious source of information to probe these elusive regions in radio-loud AGN.
2. High-Sensitivity Submm Observations of AGN: Variability and Polarimetry
Unfortunately, submm polarization observations of AGN (especially at short timescales) have so far been limited by sensitivity and calibration accuracy. However, new instruments (like the Atacama Large mm/submm Array, ALMA) and new receivers and back-ends developed for VLBI (i.e., much wider bandwidths) open a new sensitivity window to mm and sub-mm interferometric observations of AGN.
As an example, the high sensitivity and spatial resolution of ALMA allowed us [10] to detect small changes in contrast (i.e., intensity ratio) between the images of a gravitationally-lensed blazar (source PKS 1830−211) from 100 to 300 GHz, using an advanced Fourier-based modelling software [21]. The changing contrast between lensed images was used as a probe of intra-day (and even intra-hour) variability from the jet base of the underlying lensed source. Such changes in contrast—which also showed a clear frequency dependence (see Figure 3, left)—were ultimately due to the intrinsic blazar variability coupled to the time delay between the lensed images (around 27 days [22]), so that any change in the lensed source appears at different times on each lensed image. Given that the time delay between lensed images is relatively well known, the changes in relative intensity between images can indeed be used to recover (with some limitations) the intrinsic variability of the underlying AGN with a very high sensitivity.
Such changes in contrast could indeed be modeled as due to a weak submm flare at the jet base, which occurred, moreover, close in time to a -ray flare detected by Fermi-Large Area Telescope (LAT) (Figure 3, right). The -ray flare was likely related to Compton up-scattering of the enhanced radiation field produced during the weak submm flare detected with ALMA. Regarding the frequency dependence of the image contrast, we could use it to extract information about the geometry of the jet close to its base, which clearly departs from the standard conical model (i.e., the submm emission originates from the concave magnetically-dominated region at the base of the outflow).
2.1. Submm Differential Polarimetry of PKS 1830−211
The strategy of studying the contrast between gravitationally-lensed images to infer variability episodes in the lensed source has been very fruitful for the case of PKS 1830−211. Given the high sensitivity of our ALMA observations, we could also use a similar strategy (i.e., analysis of the contrast between the two lensed images) to derive polarimetric information from the jet base of this blazar [14].
Given that the source is detected with high dynamic ranges (on the order of several thousands, after integration times of just a few minutes), we can study how the image contrast depends on time for each one of the polarizers of the ALMA antennas (the horizontal dipole, X, and the vertical dipole, Y, in the frame of the antenna mounts). In presence of a time-varying polarized emission from the underlying blazar (Figure 4, top), we expect the contrast between lensed images to be different between the XX and YY polarization products (see Figure 4, bottom). Such a difference should also depend on the parallactic angle of the source, which affects the projection of the EVPA from each lensed image into the dipoles of the ALMA antennas. From the analysis of such a dependence with parallactic angle (and frequency), we estimated a very high RM at 1 mm (see Figure 5 bottom), likely related to strong magnetic fields at the base of the jet [14], as well as strong evidence of frequency dependence of the RM (between 1 mm and 3 mm) and time variation between epochs separated by a few weeks/months [14,23].
We are still observing PKS 1830−211 with ALMA as part of a monitoring program, and have found further evidence of time variability of the polarization angle at mm wavelengths, coupled to changes in flux density (Muller et al., in prep.).
2.2. Polarization of PKS 1830−211 at the Highest Radio Frequencies
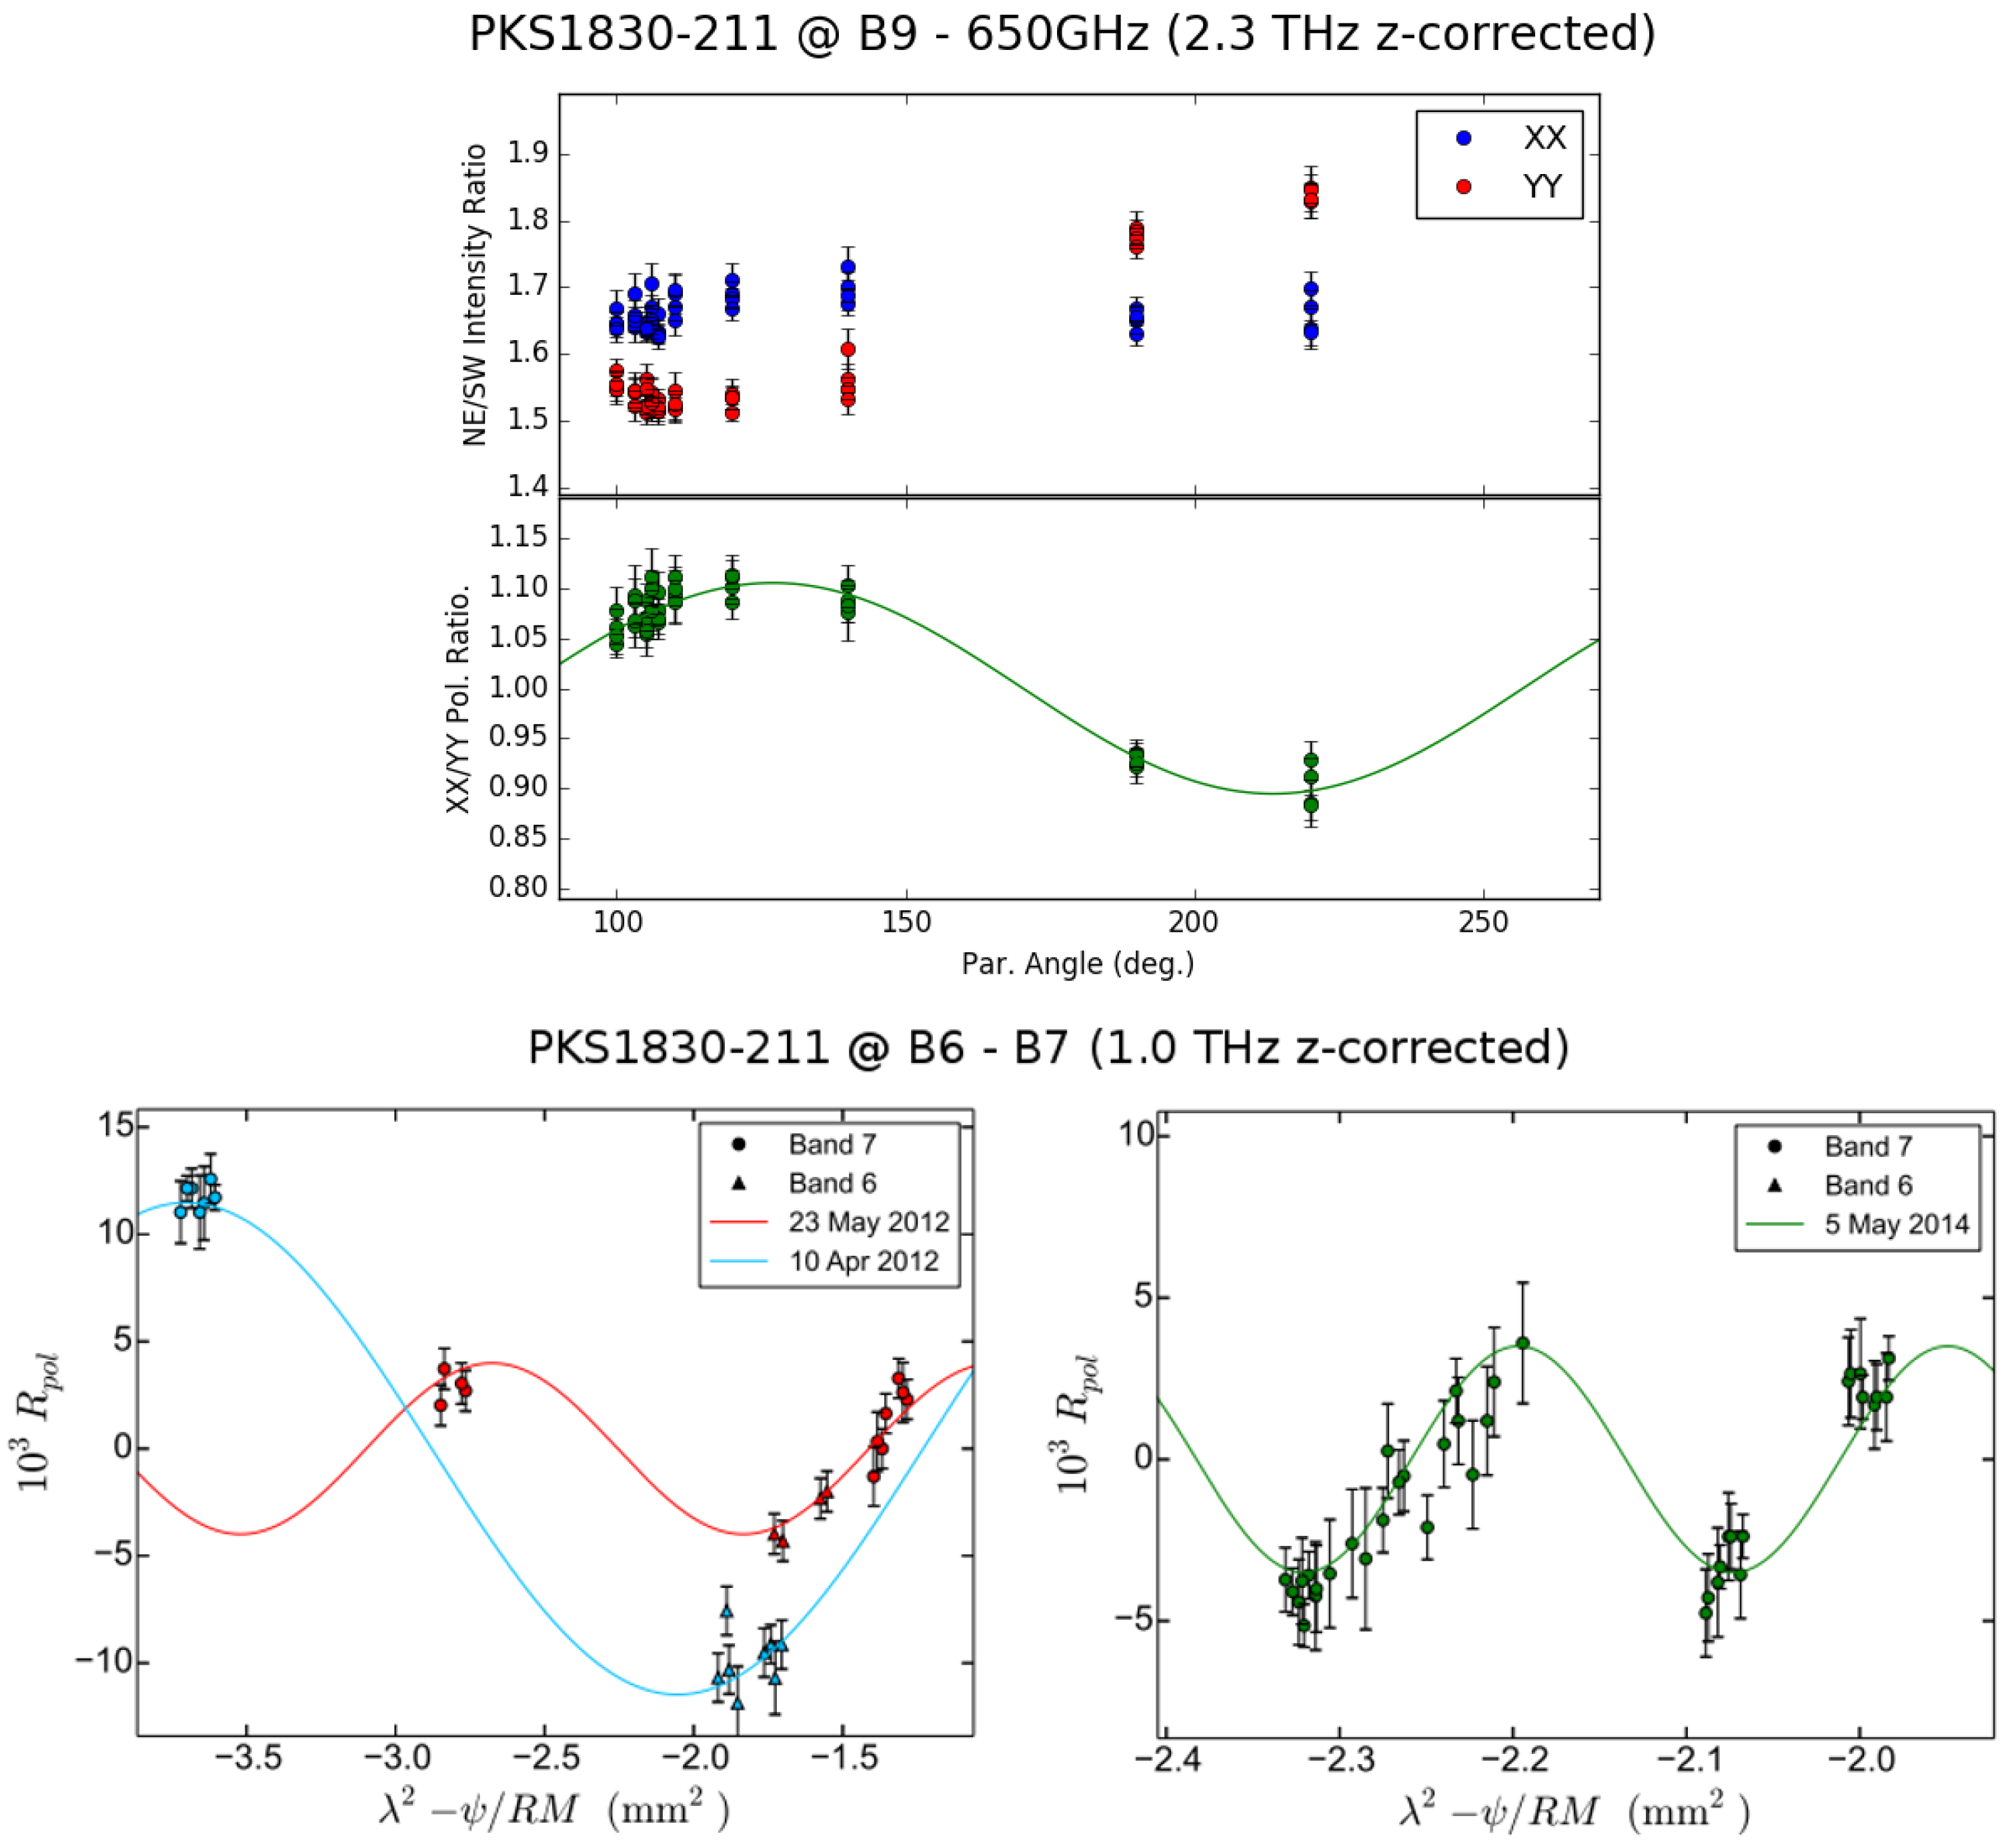
We have also obtained a long integration time of observations of PKS 1830−211 at 0.3 mm (ALMA Band 9), with a parallactic-angle coverage wide enough to allow us to perform a differential-polarimetry analysis between the lensed images at such a short wavelength. Our Band 9 results (at frequencies around 650 GHz) show clear polarization imprints in the image-contrast differences between antenna polarizers (Figure 5, top), which suggest fractional polarizations of the order of 10% at a frequency of 2.3 THz in the rest frame of the source (). This is the highest frequency ever probed in this kind of study. Our results on PKS 1830−211 are, to date, the most sensitive interferometric polarization observations of AGN at mm/submm wavelengths, thanks to the unprecedented ALMA sensitivity and our novel analysis techniques.
2.3. Differential Polarimetry on Another Gravitational Lens
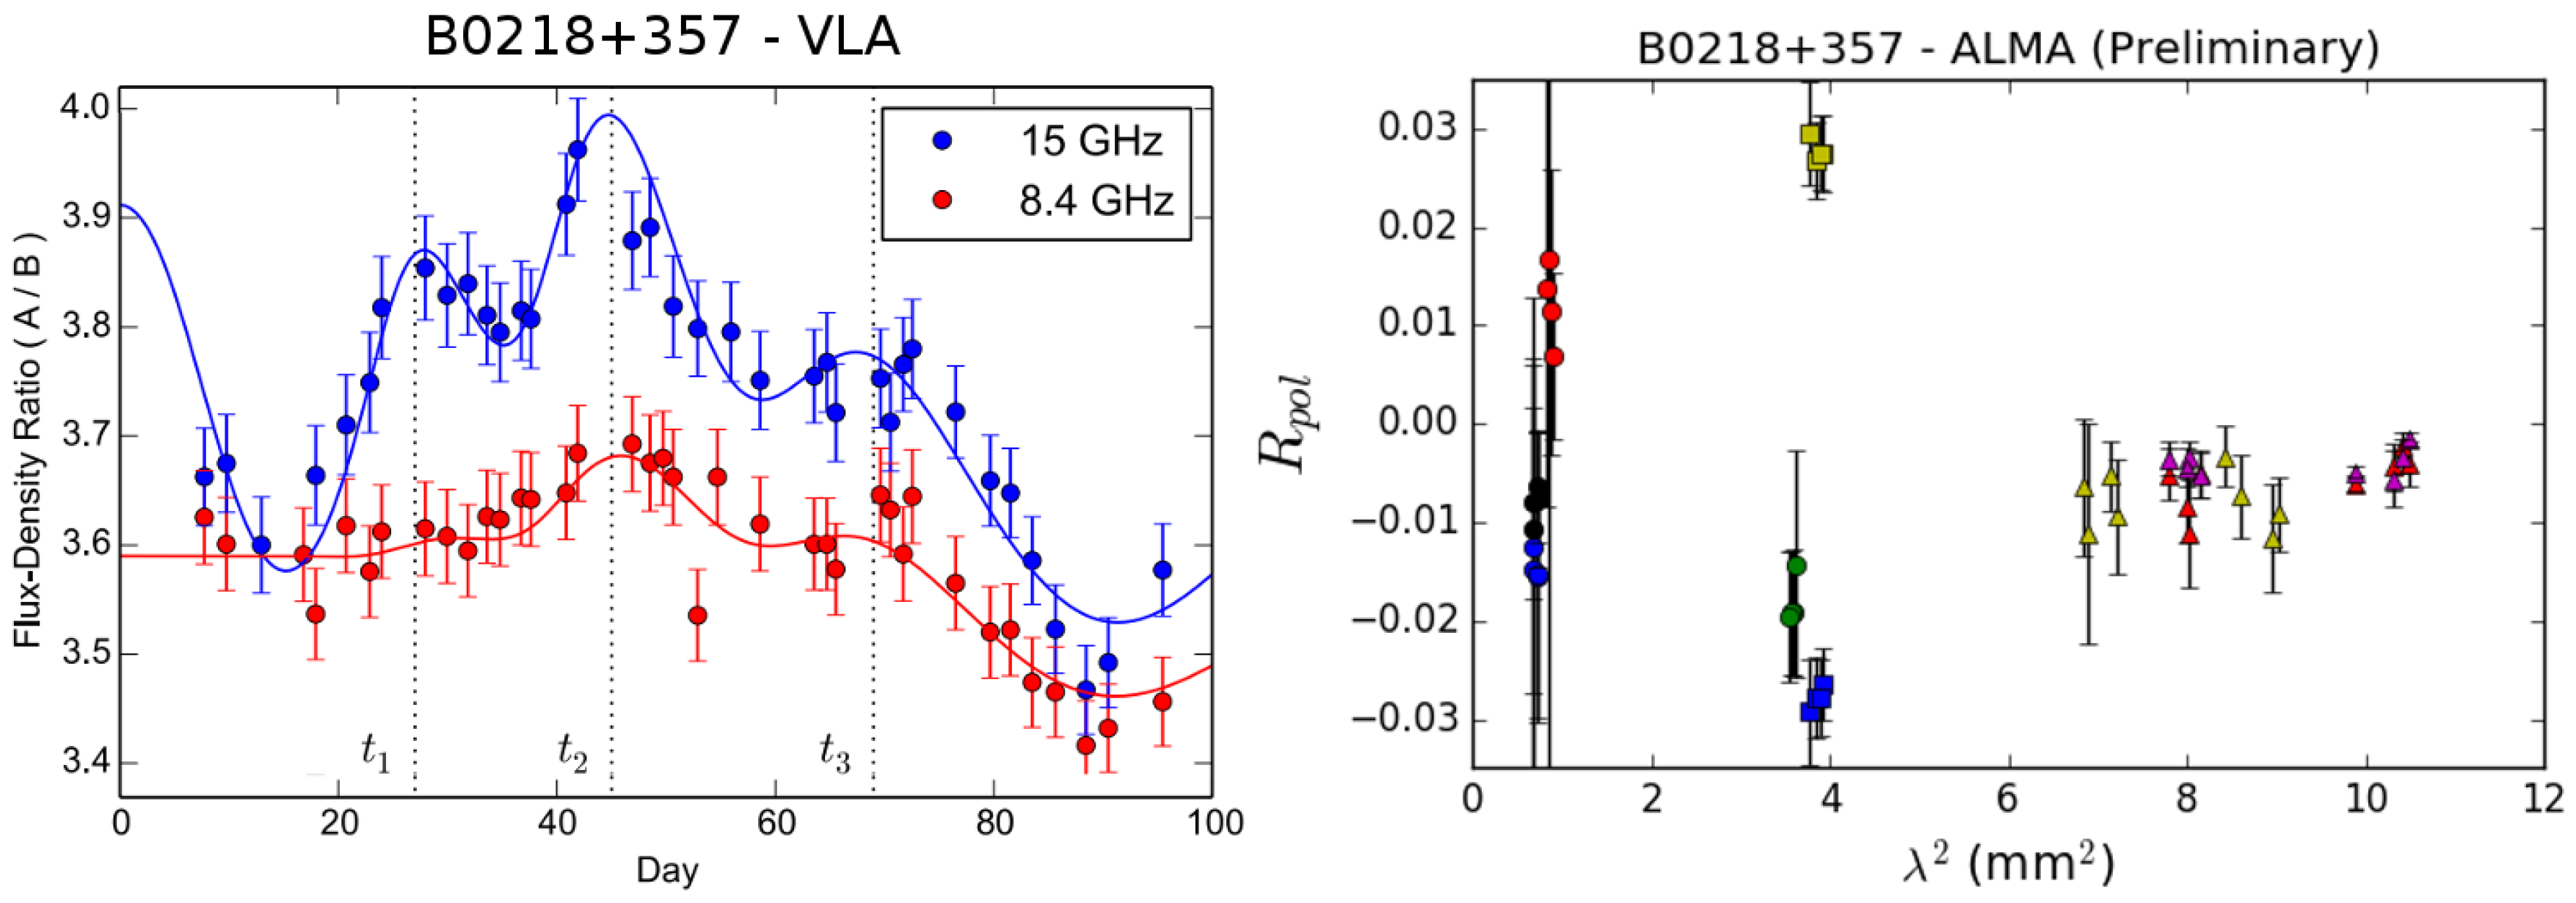
This image-contrast (i.e., intensity-ratio) strategy can be used to infer frequency dependent variability in the underlying sources of other gravitational lenses. For instance, observations of B0218+357 (at ) with the Very Large Array (VLA) at cm wavelengths could be explained with a simple (i.e., one-component) SSA jet emission model (see details in [25]). This source has also been observed by us with ALMA at different bands, and shows clear polarization signals in the contrast between the images at different frequencies (Figure 6 right; Muller et al., in prep). However, the time difference among the observations is too long compared to the time delay between lensed images (and the parallactic-angle coverage of each of these observations is too poor) to find a robust RM estimate from the polarization ratios of this source.
3. Summary
Radio emission from the jets of AGN has been extensively studied for more than 50 years (e.g., [26]), although many aspects of the physics involved in the formation of relativistic jets of AGN are still poorly constrained due to the large distances to these objects and the very small scales (sub-parsec) involved. In particular, the nature of the polarized emission (fractional intensity and electric-vector position angle), its evolution and frequency dependence, and the eventual correlations among the different parts of the electromagnetic spectrum (from radio to -rays) are the greatest challenges in the observational studies of AGN.
The only way to access the radio emitting regions where jets are being formed is to observe the AGN at high frequencies (submm wavelengths). New-generation mm/submm instrumentation like ALMA opens a new sensitivity window that is already revolutionary in this field.
In these proceedings, we have summarized some of our results on mm/submm polarimetry observations of an AGN (the gravitationally-lensed blazar in PKS 1830−211), where high (and frequency-dependent) rotation measures have been detected, together with evidence of time changes possibly coupled to -ray variability. We also report preliminary polarimetry results at 2.3 THz (in the rest frame of the source).
Acknowledgments
This paper makes use of the following ALMA data: ADS/JAO.ALMA#2011.0.00405, ADS/JAO.ALMA#2012.1.00056, ADS/JAO.ALMA#2013.1.00020, ADS/JAO.ALMA#2015.1.00075, and ADS/JAO.ALMA#2016.1.00031. ALMA is a partnership of ESO (representing its member states), NSF (USA) and NINS (Japan), together with NRC (Canada), MOST and ASIAA (Taiwan), and KASI (Republic of Korea), in cooperation with the Republic of Chile. The Joint ALMA Observatory is operated by ESO, AUI/NRAO and NAOJ.
Author Contributions
IMV and SM have equally collaborated in the preparation, calibration and analysis of the ALMA data reported in this publication.
Conflicts of Interest
The authors declare no conflict of interest.
Abbreviations
The following abbreviations are used in this manuscript:
| SMBH | Super Massive Black Hole |
| AGN | Active Galactic Nucleus |
| EVPA | Electric Vector Position Angle |
| RM | Rotation Measure |
| SSA | Synchrotron Self-Absorption |
| mm/sub-mm | millimeter/sub-millimeter |
| ALMA | Atacama Large mm/submm Array |
| VLA | Very Large Array |
| VLBA | Very Long Baseline Array |
| VLBI | Very Long Baseline Interferometry |
References
- Blandford, R.D.; Znajek, R.L. Electromagnetic extraction of energy from Kerr black holes. Mon. Not. Roy. Astron. Soc. 1977, 179, 433–456. [Google Scholar] [CrossRef]
- Komissarov, S.S.; Barkov, M.V.; Vlahakis, N.; Königl, A. Magnetic acceleration of relativistic active galactic nucleus jets. Mon. Not. Roy. Astron. Soc. 2007, 380, 51–70. [Google Scholar] [CrossRef]
- Kikuchi, S.; Mikami, Y.; Inoue, M.; Tabara, H.; Kato, T. A synchronous variation of polarization angle in OJ 287 in the optical and radio regions. Astron. Astrophys. 1988, 190, L8–L10. [Google Scholar]
- Marscher, A.P.; Jorstad, S.G.; D’Arcangelo, F.D.; Smith, P.S.; Williams, G.G.; Larionov, V.M.; Oh, H.; Olmstead, A.R.; Aller, M.F.; Aller, H.D.; et al. The inner jet of an active galactic nucleus as revealed by a radio-to-γ-ray outburst. Nature. 2008, 452, 966–969. [Google Scholar] [CrossRef] [PubMed]
- Algaba, J.C.; Gabuzda, D.C.; Smith, P.S. Search for correlations between the optical and radio polarization of active galactic nuclei—II. VLBA polarization data at 12+15+22+24+43 GHz. Mon. Not. Roy. Astron. Soc. 2012, 411, 85–101. [Google Scholar] [CrossRef]
- Blinov, D.; Pavlidou, V.; Papadakis, I.E.; Hovatta, T.; Pearson, T.J.; Liodakis, I.; Panopoulou, G.V.; Angelakis, E.; Baloković, M.; Das, H.; et al. RoboPol: Optical polarization-plane rotations and flaring activity in blazars. Mon. Not. Roy. Astron. Soc. 2016, 457, 2252–2262. [Google Scholar] [CrossRef]
- Fuhrmann, L.; Larsson, S.; Chiang, J.; Angelakis, E.; Zensus, J.A.; Nestoras, I.; Krichbaum, T.P.; Ungerechts, H.; Sievers, A.; Pavlidou, V.; et al. Detection of significant cm to sub-mm band radio and γ-ray correlated variability in Fermi bright blazars. Mon. Not. Roy. Astron. Soc. 2014, 441, 1899–1909. [Google Scholar] [CrossRef]
- Fuhrmann, L.; Angelakis, E.; Zensus, J.A.; Nestoras, I.; Marchili, N.; Pavlidou, V.; Karamanavis, V.; Ungerechts, H.; Krichbaum, T.P.; Larsson, S.; et al. The F-GAMMA programme: multi-frequency study of active galactic nuclei in the Fermi era. Programme description and the first 2.5 years of monitoring. Astron. Astrophys. 2016, 596, A45. [Google Scholar] [CrossRef]
- Karamanavis, V.; Fuhrmann, L.; Angelakis, E.; Nestoras, I.; Myserlis, I.; Krichbaum, T.P.; Zensus, J.A.; Ungerechts, H.; Sievers, A.; Gurwell, M.A. What can the 2008/10 broadband flare of PKS 1502+106 tell us? Nuclear opacity, magnetic fields, and the location of γ rays. Astron. Astrophys. 2016, 590, A48. [Google Scholar] [CrossRef]
- Martí-Vidal, I.; Muller, S.; Combes, F.; Aalto, S.; Beelen, A.; Darling, J.; Guélin, M.; Henkel, C.; Horellou, C.; Marcaide, J.M.; et al. Probing the jet base of the blazar PKS 1830-211 from the chromatic variability of its lensed images. Serendipitous ALMA observations of a strong gamma-ray flare. Astron. Astrophys. 2013, 558, A123. [Google Scholar] [CrossRef]
- Gabuzda, D.C.; Chernetskii, V.A. Parsec-scale Faraday rotation distribution in the BL Lac object 1803+784. Mon. Not. Roy. Astron. Soc. 2003, 339, 669–679. [Google Scholar] [CrossRef]
- Kuo, C.Y.; Asada, K.; Rao, R.; Nakamura, M.; Algaba, J.C.; Liu, H.B.; Inoue, M.; Koch, P.M.; Ho, P.T.P.; Matsushita, S.; et al. Measuring Mass Accretion Rate onto the Supermassive Black Hole in M87 Using Faraday Rotation Measure with the Submillimeter Array. Astrophys. J. 2014, 783, L33. [Google Scholar] [CrossRef]
- Mahmud, M.; Gabuzda, D.C.; Bezrukovs, V. Surprising evolution of the parsec-scale Faraday Rotation gradients in the jet of the BL Lac object B1803+784. Mon. Not. Roy. Astron. Soc. 2009, 400, 2–12. [Google Scholar] [CrossRef]
- Martí-Vidal, I.; Muller, S.; Vlemmings, W.H.T.; Horellou, C.; Aalto, S. A strong magnetic field in the jet base of a supermassive black hole. Science 2015, 348, 311–314. [Google Scholar] [CrossRef] [PubMed]
- Abdo, A.A.; Ackermann, M.; Ajello, M.; Axelsson, M.; Baldini, L.; Ballet, J.; Barbiellini, G.; Bastieri, D.; Baughman, B.M.; Bechtol, K.; et al. A change in the optical polarization associated with a γ-ray flare in the blazar 3C279. Nature 2010, 463, 919. [Google Scholar] [CrossRef] [PubMed]
- Marscher, A.P. Turbulent, Extreme Multi-zone Model for Simulating Flux and Polarization Variability in Blazars. Astrophys. J. 2014, 780, 87–97. [Google Scholar] [CrossRef]
- Zhang, H.; Chen, X.; Böttcher, M.; Guo, F.; Li, H. Polarization Swings Reveal Magnetic Energy Dissipation in Blazars. Astrophys. J. 2015, 804, 58–69. [Google Scholar] [CrossRef]
- Agudo, I.; Marscher, A.P.; Jorstad, S.G.; Larionov, V.M.; Gómez, J.L.; Lähteenmäki, A.; Smith, P.S.; Nilsson, K.; Readhead, A.C.S.; Aller, M.F.; et al. On the Location of the γ-Ray Outburst Emission in the BL Lacertae Object AO 0235+164 Through Observations Across the Electromagnetic Spectrum. Astrophys. J. 2011, 735, L10–L17. [Google Scholar] [CrossRef]
- Agudo, I.; Jorstad, S.G.; Marscher, A.P.; Larionov, V.M.; Gómez, J.L.; Lähteenmäki, A.; Gurwell, M.; Smith, P.S.; Wiesemeyer, H.; Thum, C.; et al. Location of γ-ray Flare Emission in the Jet of the BL Lacertae Object OJ287 More than 14 pc from the Central Engine. Astrophys. J. 2011, 726, L13–L19. [Google Scholar] [CrossRef]
- Martí-Vidal, I.; Krichbaum, T.P.; Marscher, A.P.; Alef, W.; Bertarini, A.; Bach, U.; Schinzel, F.K.; Rottmann, H.; Anderson, J.M.; Zensus, J.A.; et al. On the calibration of full-polarization 86 GHz global VLBI observations. Astron. Astrophys. 2012, 542, A107. [Google Scholar] [CrossRef]
- Martí-Vidal, I.; Muller, S.; Vlemmings, W.H.T.; Casey, S. UVMULTIFIT: A versatile tool for fitting astronomical radio interferometric data. Astron. Astrophys. 2014, 563, A136. [Google Scholar] [CrossRef]
- Barnacka, A.; Glicenstein, J.-F.; Moudden, Y. First evidence of a gravitational lensing-induced echo in gamma rays with Fermi LAT. Astron. Astrophys. 2011, 528, L3. [Google Scholar] [CrossRef]
- Martí-Vidal, I.; Vlemmings, W.H.T.; Muller, S. Dual differential polarimetry. A technique to recover polarimetric information from dual-polarization observations. Astron. Astrophys. 2016, 593, A61. [Google Scholar] [CrossRef]
- Garrett, M.A.; Leppaenen, K.; Porcas, R.W.; Patnaik, A.R.; Nair, S.; Teraesranta, H. PKS 1830-211: VLBA lambda 7mm Polarization Observations. Proceedings of the Radio Emission from Galactic and Extragalactic Compact Sources 313–314. [CrossRef]
- Martí-Vidal, I.; Muller, S. Using gravitationally lensed images to investigate the intrinsic AGN variability. Astron. Astrophys. 2016, 590, A83. [Google Scholar] [CrossRef]
- Edge, D.O.; Shakeshaft, J.R.; McAdam, W.B.; Baldwin, J.E.; Archer, S. A survey of radio sources at a frequency of 159 Mc/s. Mon. Not. Roy. Astron. Soc., 1959, 68, 37–60. [Google Scholar]
Figure 1.
Global mm-VLBI Array (GMVA) image (at 3 mm, left) and Very Long Baseline Array (VLBA) image (at 7 mm, right) of 3C 345 (adapted from [20]; reproduced with permission from A&A, ESO). Notice how the higher GMVA resolution allows us to disentangle several compact polarized components across the jet, with a polarization rotation towards the core.
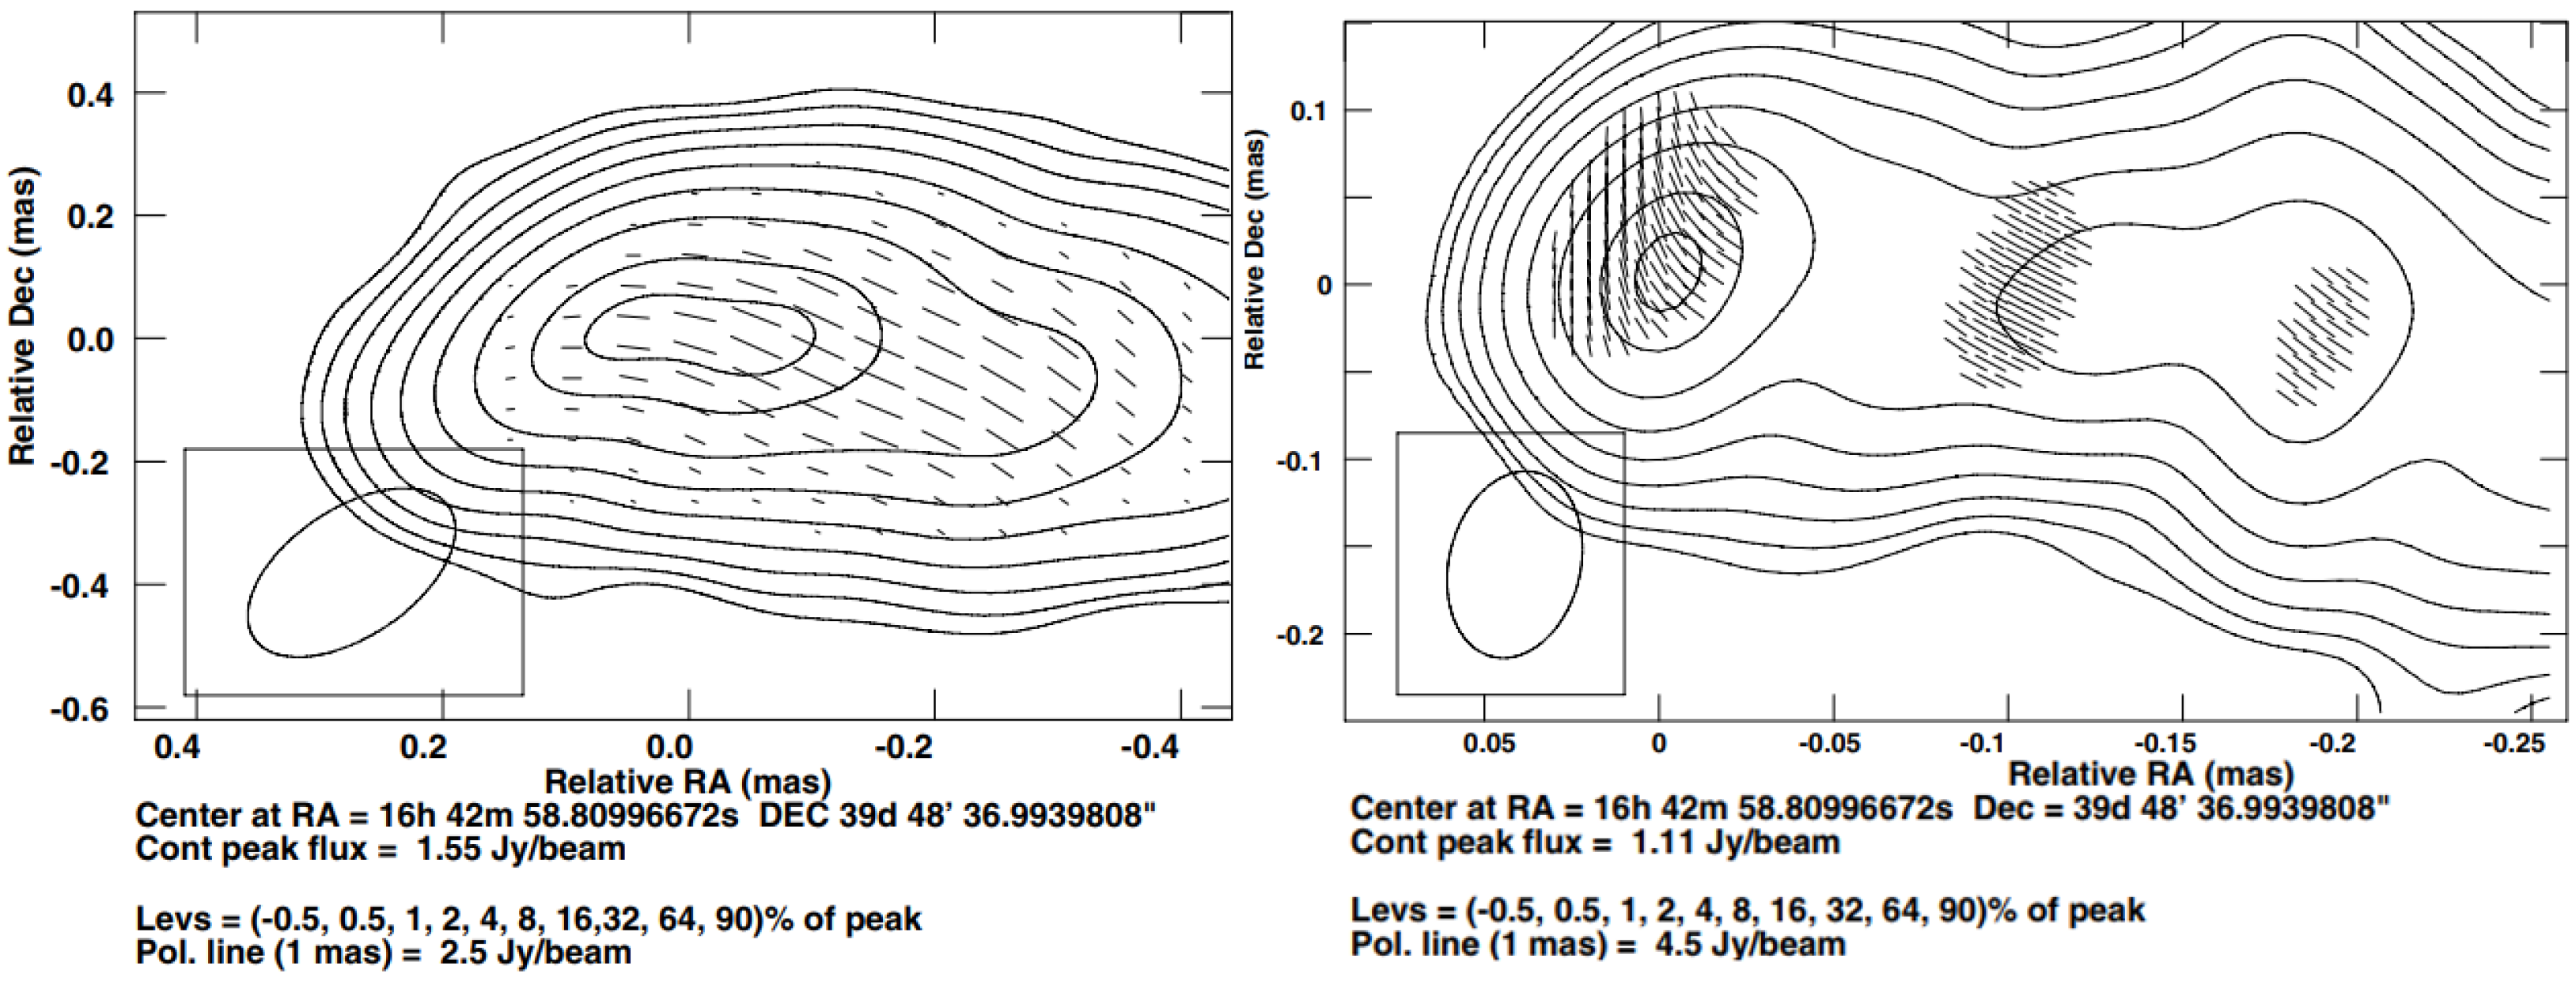
Figure 2.
Sketch of the jet morphology close to the base of the outflow (not in scale). Only emission at high frequencies (blue) can escape from the jet base. The rotation measure (RM) from these regions can either be internal to the jet or from a shear around it, or be induced by a screen of infalling material. In the former case, RM would depend on frequency, ; in the latter, it would rather be constant in the submm spectral region.

Figure 3.
Top left: Image contrast (i.e., intensity ratio) between the two lensed images of the blazar in PKS 1830−211. Bottom left: Total intensity of the North-East (NE) lensed image. Notice the clear frequency dependence of the contrast at each epoch (related to the synchrotron opacity at the jet base) and the fast variability (intra-hour) around days 44.75−45 (magenta). The lines correspond to a jet model fitted to the data [10]. Right: -ray light curve from the Fermi-Large Area Telescope (LAT), with a time binning of 7 days. The shadowed region is the time window of our ALMA observations. The dashed line is the onset of the flare, as estimated from our model to the ALMA data. Figures adapted from [10] and reproduced with permission from A&A, ESO.
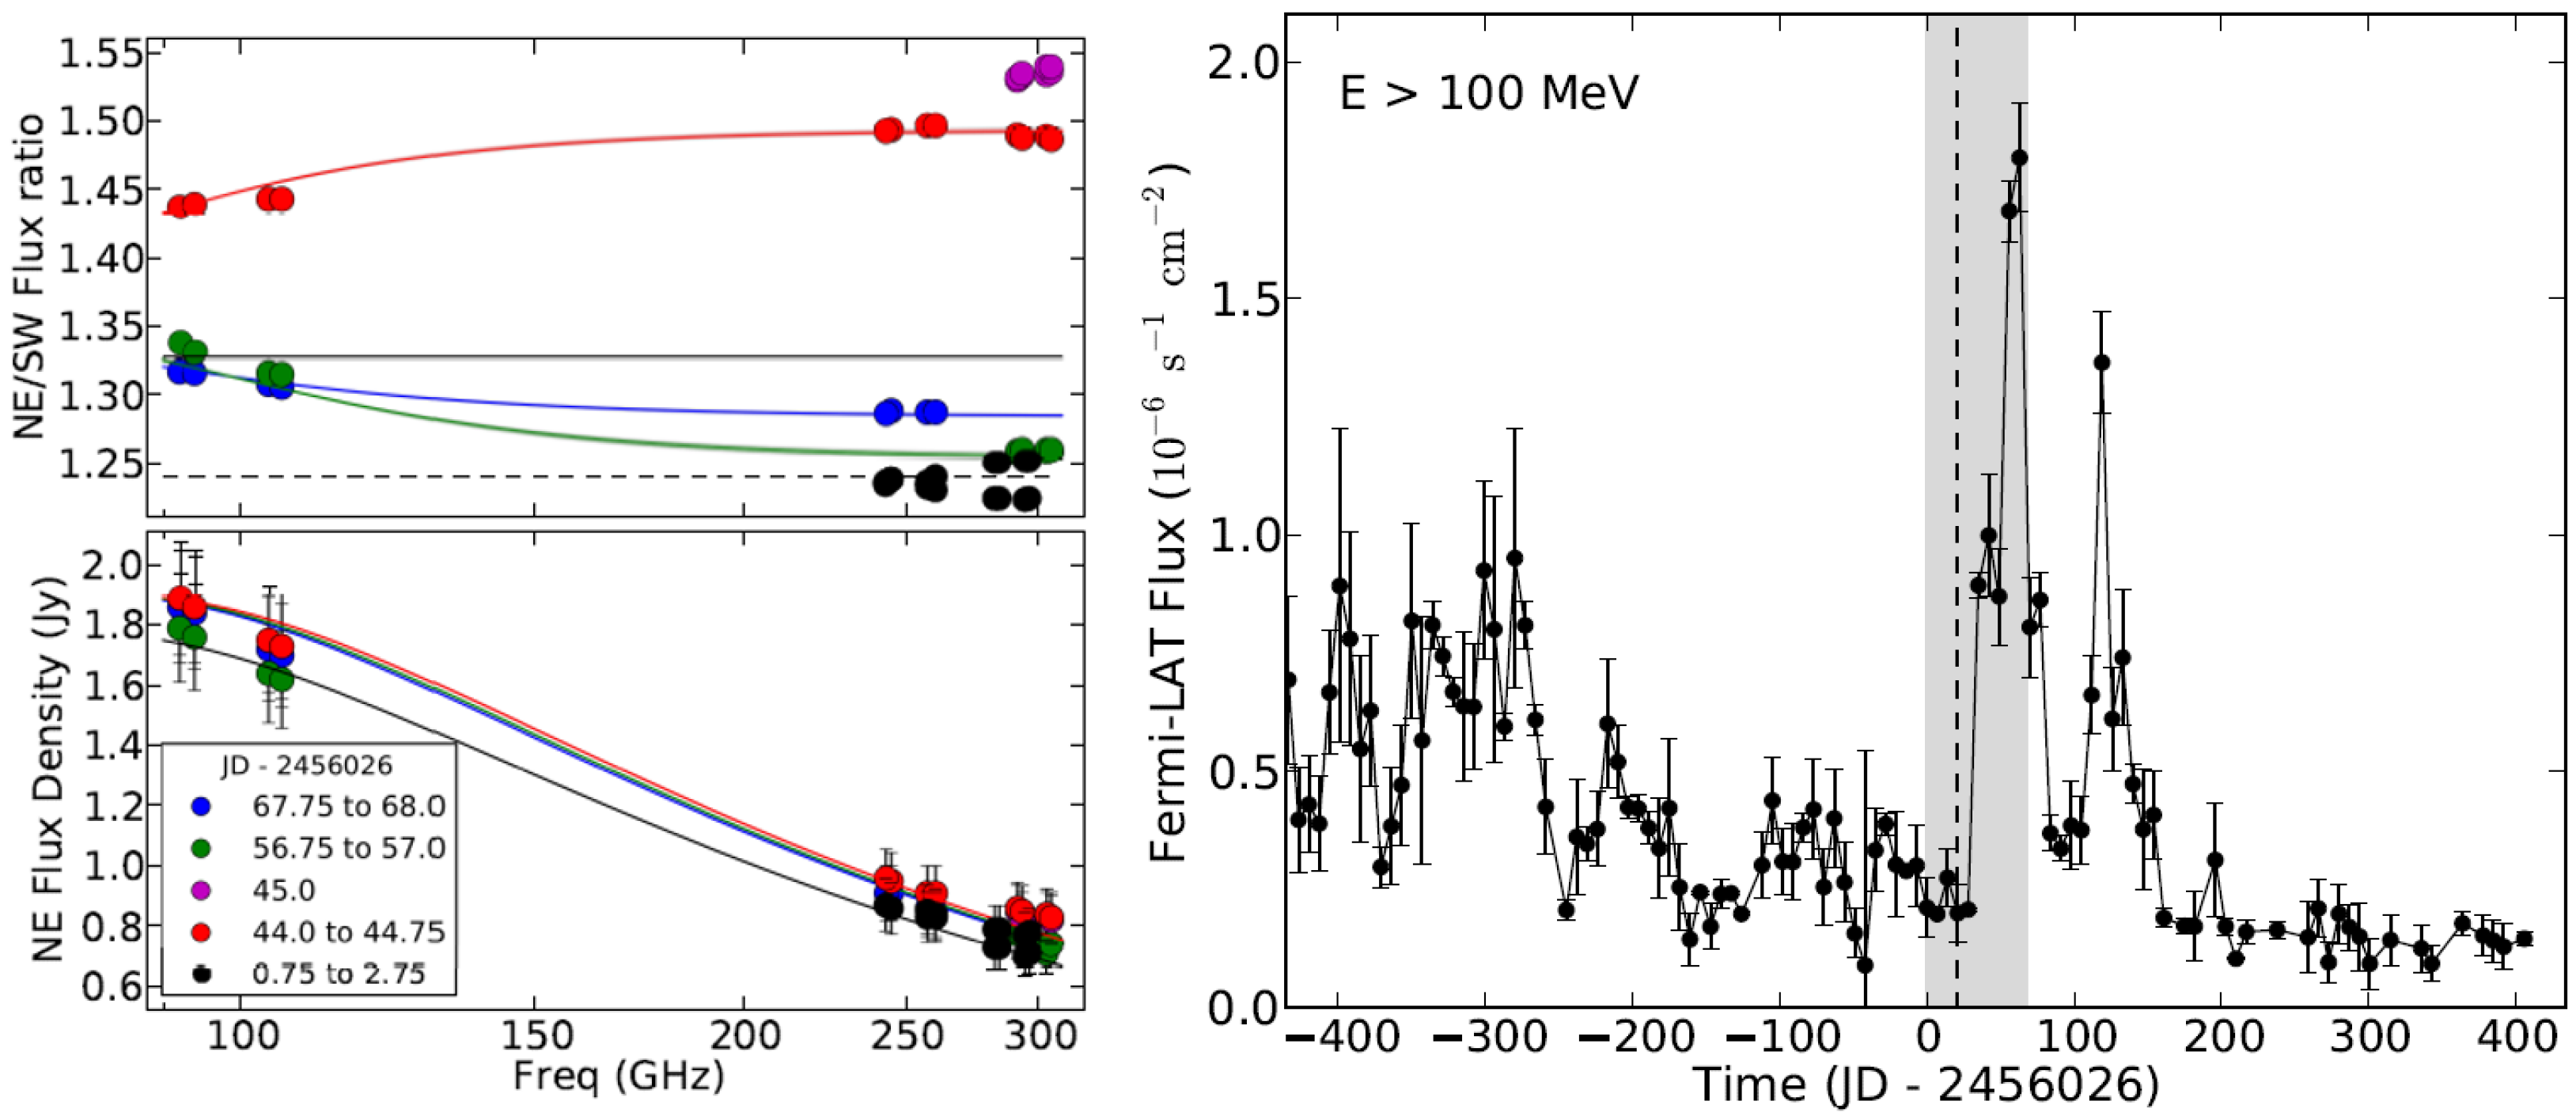
Figure 4.
Top: VLBA images of the lensed images (labeled NE and SW) of PKS 1830−211 at 7 mm (taken from [24]; reproduced with the author’s permission). Notice the different polarization angle of the images, mainly due to the source variability, coupled to the time delay between images. Bottom: Two images of PKS 1830−211 as seen by ALMA, at 1 mm wavelength, in different polarization directions (similar to the results reported in [14]). Notice how the different polarizations produce a (time-varying) different contrast in the XX and YY images (image YY−XX).
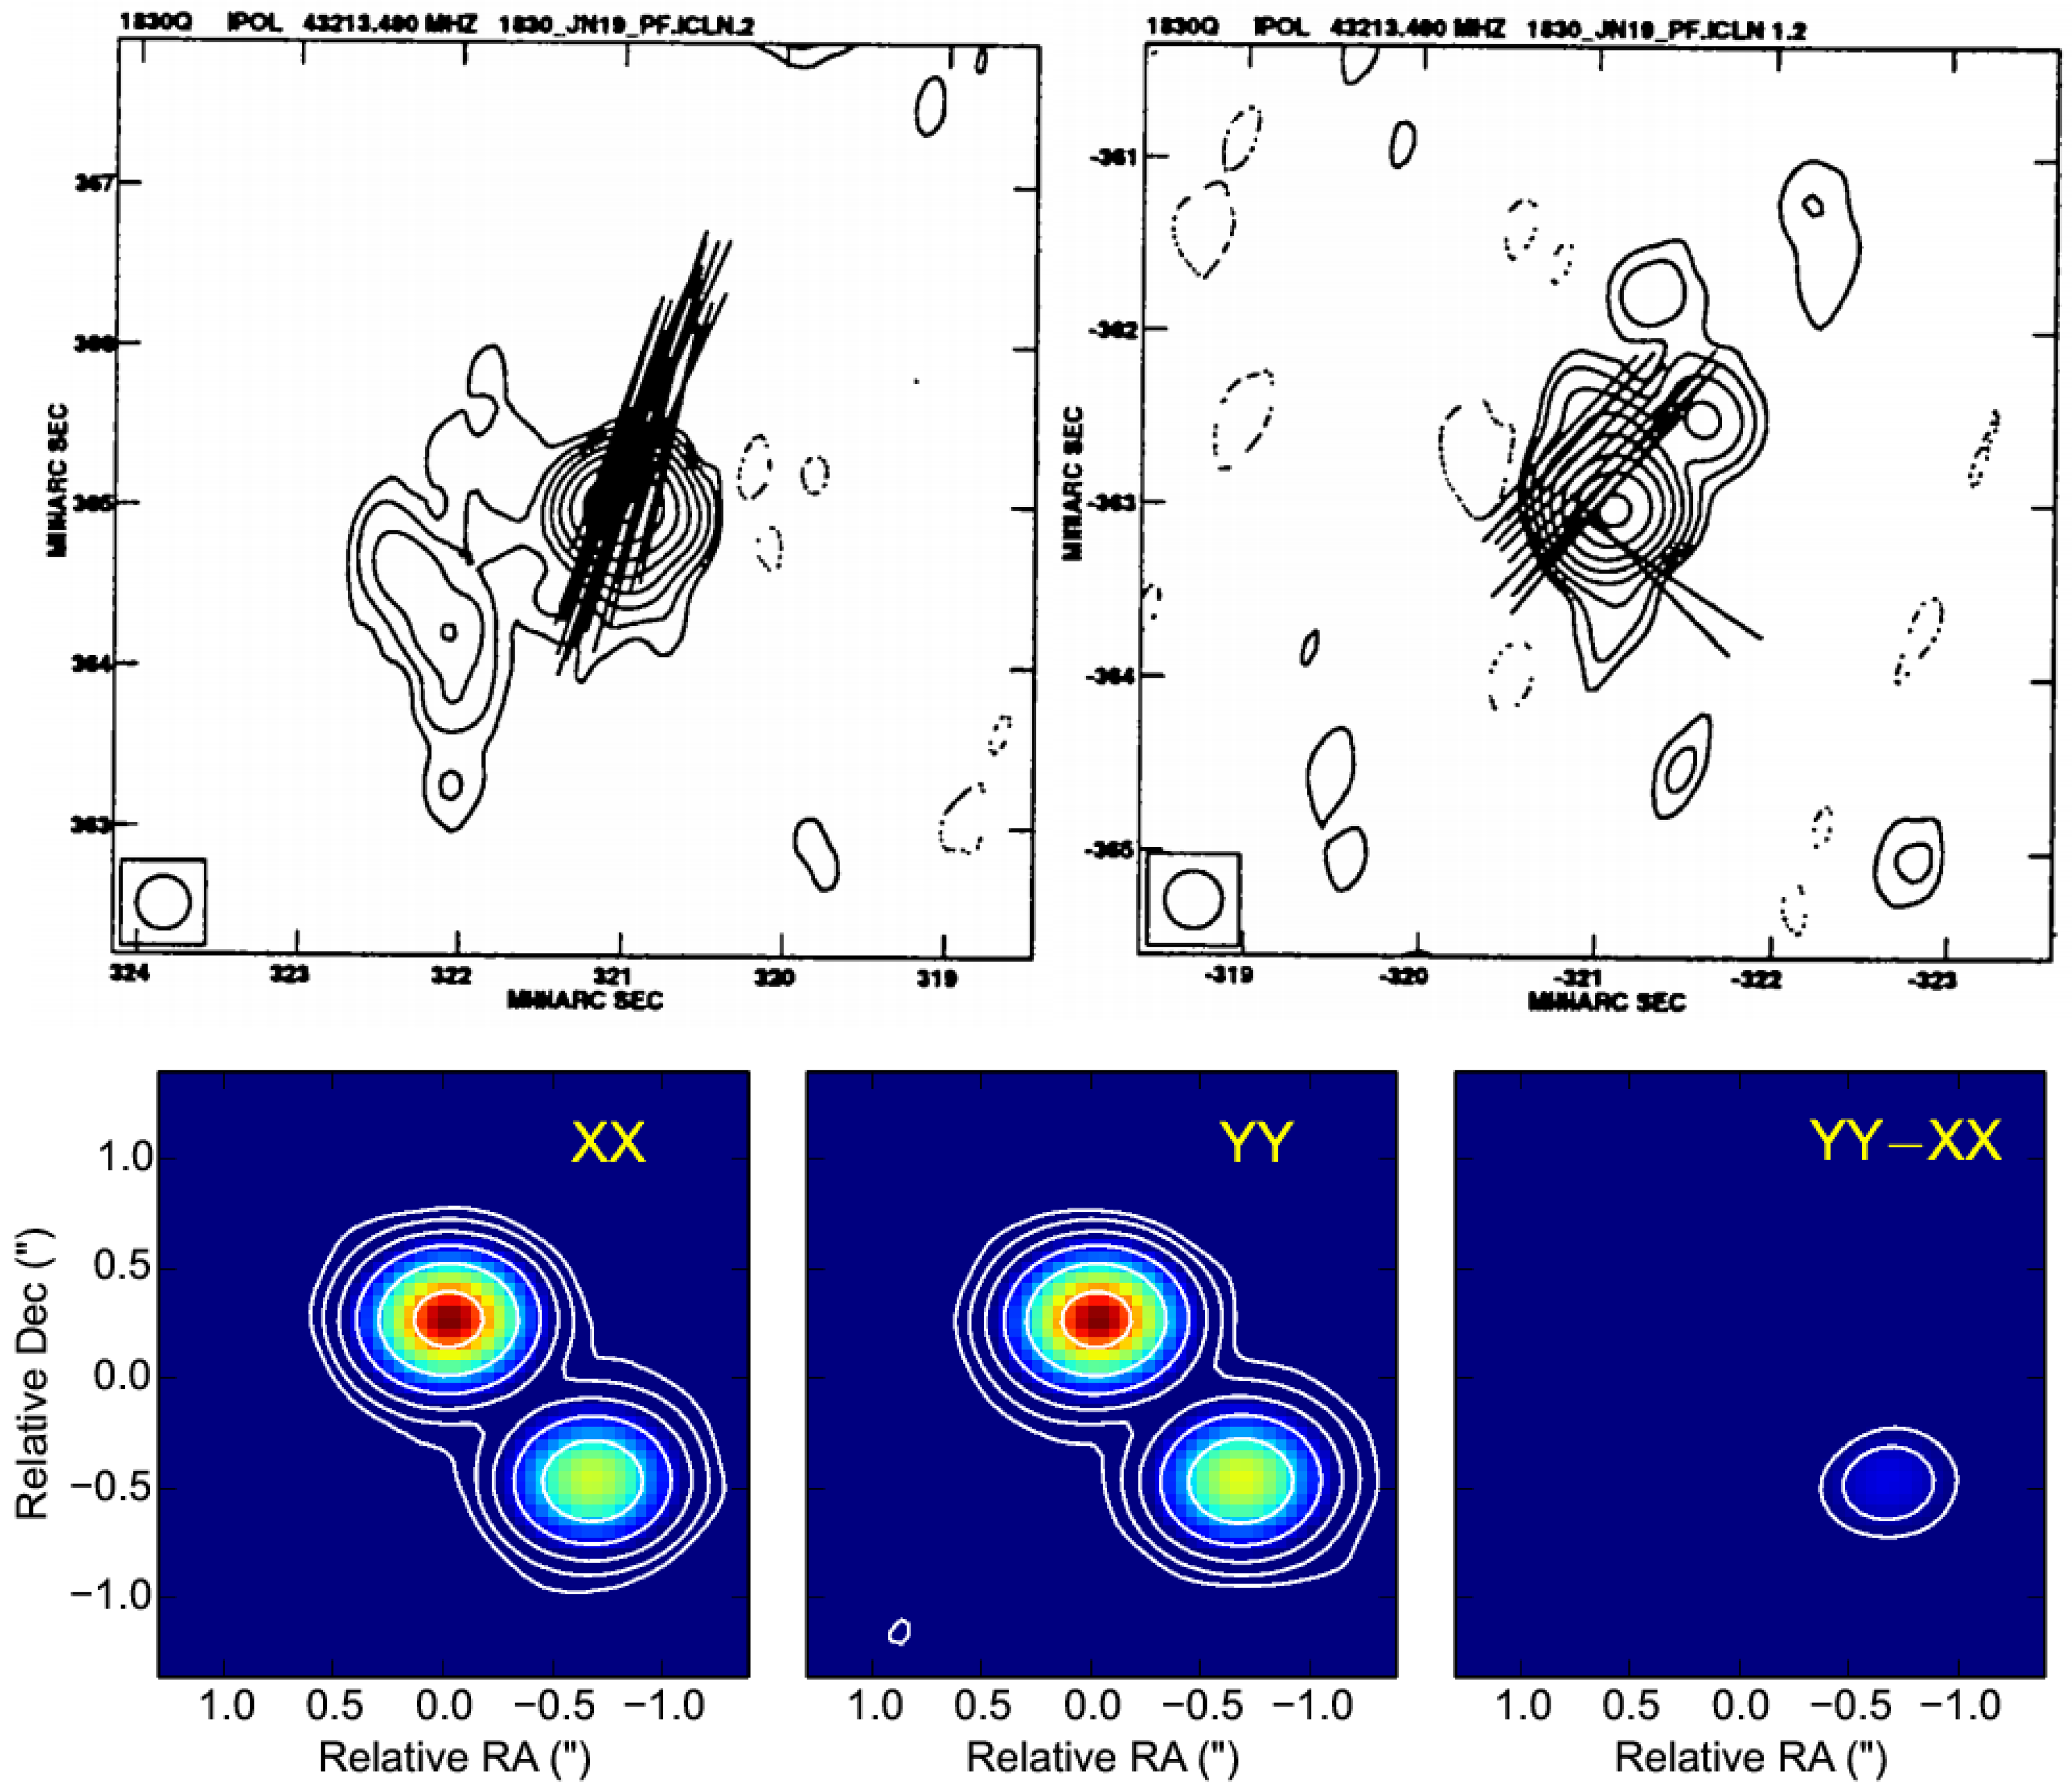
Figure 5.
Top: polarization ratios of the image contrast of PKS 1830−211 in Band 9 (Muller et al., in prep). Notice the clear sinusoidal dependence of the ratio as a function of parallactic angle. Bottom: Polarization ratios of the image contrast of PKS 1830−211 around 1 mm (adapted from [23], which is an update of [14]). Notice how the sinusoid depends on parallactic angle and frequency.

Figure 6.
Left: Time evolution of the intensity ratios between the gravitationally-lensed images (named A and B) of B0218+359 at 8.4 and 15 GHz (taken from [25]; reproduced with permission from A&A, ESO). These ratios can be described with a simple (one-component) synchrotron self-absorption (SSA) jet emission model. Right: Polarization ratios of the contrast between the images (Muller et al., in prep.). The signal encoded in these ratios is related to the fractional polarization and EVPA from the underlying AGN. Different colors and symbols correspond to different observing epochs (with typical time lags on the order of a week among epochs).
© 2017 by the authors. Licensee MDPI, Basel, Switzerland. This article is an open access article distributed under the terms and conditions of the Creative Commons Attribution (CC BY) license (http://creativecommons.org/licenses/by/4.0/).
Share and Cite
MDPI and ACS Style
Martí-Vidal, I.; Muller, S. High-Sensitivity AGN Polarimetry at Sub-Millimeter Wavelengths. Galaxies 2017, 5, 65. https://doi.org/10.3390/galaxies5040065
AMA Style
Martí-Vidal I, Muller S. High-Sensitivity AGN Polarimetry at Sub-Millimeter Wavelengths. Galaxies. 2017; 5(4):65. https://doi.org/10.3390/galaxies5040065
Chicago/Turabian StyleMartí-Vidal, Ivan, and Sébastien Muller. 2017. "High-Sensitivity AGN Polarimetry at Sub-Millimeter Wavelengths" Galaxies 5, no. 4: 65. https://doi.org/10.3390/galaxies5040065
Note that from the first issue of 2016, this journal uses article numbers instead of page numbers. See further details here.