
Radio Polarisation Study of High Rotation Measure AGNs


1
Max-Planck-Institut für Radioastronomie, Auf dem Hügel 69, 53121 Bonn, Germany
2
Department of Astronomy, University of California, Berkeley, CA 94720-3411, USA
3
Dunlap Institute for Astronomy and Astrophysics, The University of Toronto, 50 St. George Street, Toronto, ON M5S 3H4, Canada
*
Author to whom correspondence should be addressed.
Galaxies 2017, 5(4), 66; https://doi.org/10.3390/galaxies5040066
Submission received: 14 September 2017
/
Revised: 3 October 2017
/
Accepted: 6 October 2017
/
Published: 16 October 2017
(This article belongs to the Special Issue Polarised Emission from Astrophysical Jets)
Abstract
:As radio polarised emission from astrophysical objects traverse through foreground magnetised plasma, the physical conditions along the lines of sight are encrypted in the form of rotation measure (RM). We performed broadband spectro-polarimetric observations of high rotation measure () sources away from the Galactic plane () selected from the NVSS RM catalogue. The main goals are to verify the NVSS RM values, which could be susceptible to -ambiguity, as well as to identify the origin of the extreme RM values. We show that of our sample suffer from -ambiguity in the NVSS RM catalogue. There are also hints of RM variabilities over ∼20 years epoch for most of our sources, as revealed by comparing the RM values of the two studies in the same frequency ranges after correcting for -ambiguity. At last, we demonstrate the possibility of applying QU-fitting to study the ambient media of AGNs.
1. Introduction
Cosmic magnetic fields are important in numerous astrophysical processes. For example, star formation rates in galaxies are regulated by magnetic pressures. The propagation of cosmic ray particles is constrained by magnetic fields in galaxies. Magnetic fields can also promote outflows of hot gas from galaxies by providing the necessary pressure. However, fundamental questions of cosmic magnetism, such as the large-scale magnetic field geometry in the disk of the Milky Way, are not completely understood (e.g., [1]).
One way to characterise cosmic magnetic fields is to use the Faraday rotation experienced by emission from polarised sources. The emission is said to originate from a certain Faraday depth (FD; ) if it experiences a rotation of the polarisation angle (PA; rad) of
where ℓ (pc) is the distance of the emission region from the observer, (cm) is the electron density, (G) is the magnetic field strength along the line of sight (s; pc), and (m) is the observed wavelength. The physical conditions in the foreground magneto-ionised media, in particular and , can thus be revealed by measuring the FD values of background polarised sources.
For the case in which the polarised emission from a source originates from a single FD, the source is “Faraday simple”. Sometimes, the sources are implicitly assumed to be Faraday simple because of observational constraints such as limited coverages in space. In both situations, the FD is equivalent to the rotation measure (RM), which is the slope of the PA against . The traditional way to obtain RM values of astrophysical objects is to measure PAs at two or more different wavelengths and perform a linear fit to the PA as a function of . For the simplest case of PA measurements at only two bands (denoted by subscripts 1 and 2), the RM is given by
where n is an integer corresponding to the -ambiguity. This arises because the PAs measured by our instruments can only fall within . This restricts the relative Faraday rotation () to , although in reality it can fall outside of this range. The term removes this limitation but also introduces an ambiguity in the determination of RMs. In general, this ambiguity can be eliminated by having more PA measurements at different wavelengths. The broadband capabilities of modern radio interferometers (e.g., the Karl G. Jansky Very Large Array (VLA) and the Australia Telescope Compact Array (ATCA)) allow spectro-polarimetric observations with a continuous frequency coverage over a wide bandwidth (e.g., 1–2 GHz in L-band and 2–4 GHz in S-band for the VLA), which allows for the determination of FDs without ambiguities (e.g., [2]).
The NVSS RM catalogue [3] contains RM values of 37,543 polarised radio sources at about 1400 MHz. It covers the sky at and serves as an invaluable tool for the study of Galactic magnetism—including studies of the magnetic fields in Galactic H ii regions (e.g., [4,5]) and the Galactic halo (e.g., [6]). The catalogue is based on the original NVSS catalogue [7], with the survey conducted in two bands centred at 1364.9 and 1435.1 MHz with bandwidths of 42 MHz each. This leaves open the possibility of -ambiguity affecting some of the NVSS RM sources. An algorithm was adopted by [3] to minimise the effect of -ambiguity in the RM catalogue, by considering (1) the observed Faraday bandwidth depolarisation of each source, and (2) the median RM values of the surrounding sources. However, the effectiveness of this algorithm is not clear. One way to test this is to observe a small fraction of the NVSS RM sources again and compare the true FD values from new broadband observations with the corresponding RM values listed in the NVSS RM catalogue.
Here, we report the results from our broadband observations of 20 NVSS sources with the VLA. These sources are believed to be prone to -ambiguity. The FD values obtained from our new observations are directly compared to the RMs in the NVSS RM catalogue. The observations and data reduction procedures are outlined in Section 2. We present the preliminary results in Section 3. In Section 4, we discuss the implications of our study, and demonstrate the potential of using the broadband data to study the ambient media surrounding our target sources, presumably radio active galactic nuclei (AGNs). The study is summarised in Section 5.
2. Observations and Data Reduction
2.1. Source Selection
We observed a sample of 20 sources from the NVSS RM catalogue [3]; all of these were situated off the Galactic plane (). These are considered the prime candidates of -ambiguity in the catalogue, with most having high reported RM magnitudes (≳300 ). For comparison, the majority (∼99%) of sources in the same region have much lower |RM|s (<150 ). It is therefore possible that their high |RM| values simply stem from -ambiguity.
2.2. Observational Setup and Data Reduction
The observations were performed with the VLA in the L-band (1–2 GHz) with D array configuration on 3 July 2014. We adopted the standard snapshot polarisation observation strategy for data calibration. The on-source time was about 3–4 min per source. The Common Astronomy Software Applications (CASA) package [8] was used for all the data reduction procedures. Radio image cubes in Stokes I, Q, and U were formed at a 4 MHz interval with the observed frequency, giving a typical rms noise of about in Stokes I and in Stokes Q and U. From these data cubes, we extracted the flux densities in Stokes I, Q, and U of our target sources for further analysis.
3. Results
3.1. RM Synthesis
We applied the RM-synthesis technique [2] to obtain the FD values of our target sources. Q/I and U/I values as a function of were used to construct the Faraday spectra (polarisation fraction as a function of FD). A Python-based RM-synthesis code1 was used to perform this analysis. The resulting Faraday spectra were deconvolved with the RM-Clean algorithm (e.g., [9]), and then the top seven points of each spectrum were fitted with a parabola to extract the FD of the respective source (e.g., [9,10]). This means we took the FD of the Faraday component with the highest polarisation fraction as the source’s FD. Nonetheless, we argue that the FD values obtained this way could still be reasonably compared with the NVSS RM values, and we will demonstrate the ability to apply QU-fitting (e.g., [11]) to our data to unveil the Faraday complexities (e.g., [11,12]) of our sources in Section 3.3.
The FD values obtained from new VLA observations are compared with the RM values from the NVSS RM catalogue (Figure 1, Left). We find that 12 sources had FD/RM values that agreed with each other in the two measurements within about , while eight had differences in the FD/RM values by about . Because the frequency coverage of the two observations were vastly different, Faraday complexities could cause deviations of the PA from the simple linear relationship with , and for such cases, the FD/RM values determined could vary depending on the frequency coverages (e.g., [12]). More care is needed to facilitate a direct comparison between our broadband data and the narrowband NVSS data.
3.2. Direct Comparison with NVSS RM Catalogue
We formed a separate set of images from our new VLA data using only the frequency coverage of the NVSS survey. The RM values from the two observations were then derived from the images using identical methods, with the -ambiguity removed using the broadband FD values we obtained in Section 3.1. The comparison of the RM values between the two observations in the same frequency ranges are shown in Figure 1 (Right). The differences in the RM of our sources had a mean of and a maximum of , with most () of them having RM differences of more than , where is the RM uncertainty of the two studies added in quadrature.
3.3. QU-Fitting
The technique of QU-fitting (e.g., [11]) attempts to capture the behaviour of Stokes Q and U as a function of by fitting them with different Faraday rotation models. For our study, we tried models including single/double Faraday simple sources, single/double Burn slab(s), and a single Burn slab with a foreground Faraday screen [13,14].
In Figure 2, we show our preliminary QU-fitting results of NVSS J190255+315942 to demonstrate the capability of broadband spectro-polarimetry. The best-fit model, judged by the reduced value, consists of two Faraday simple components, with polarisation fractions of and , and FDs of and , respectively.
4. Discussion
4.1. -Ambiguity in the NVSS RM Catalogue
We showed in Section 3.1 that some of the sources had erroneous values in the RM catalogue [3] as a result of -ambiguity. It is unclear how many of the total of 37,543 RMs may have had the same issue, as we only observed a small sample of sources that we considered likely to suffer from -ambiguity. The algorithm used for constructing the NVSS RM catalogue is likely to become less effective within |RM| ranges of <50 , >520 , and near [3]. Another possible reason for erroneous RM values is Faraday complexity (e.g., [15]), as this can cause the PA to deviate from the linear relationship with . Future broadband radio polarisation surveys, such as the Very Large Array Sky Survey (VLASS) in the S-band, could verify all the NVSS RM values.
4.2. Possible RM Variabilities
By comparing the narrowband RM values computed using our new VLA data to those from the NVSS RM images within the same frequency ranges, we found that the RM values of most sources did not agree within the measurement uncertainties between the two epochs. Such discrepancies could stem from systematic errors yet to be accounted for. For instance, while all the targets were placed at the pointing centres in our observations, NVSS data were taken with multi-pointing mosaic observations with our target sources not necessarily placed on-axis. This could result in significant polarisation leakage that is not easy to characterise (e.g., [16]). The polarisation leakage component could potentially change the observed PAs, causing the NVSS RM values to deviate from the true values. The RM differences between the two studies could also be attributed to true RM variabilities over the two epochs. If this was indeed the case, higher cadence campaigns of these sources could reveal the physical characteristics of the magneto-ionised media giving rise to such variabilities.
4.3. QU-Fitting as Probe of Vicinities of AGN Jets
We showed the QU-fitting results of one of our target sources in Section 3.3. Despite that it was not spatially resolved in our radio images (synthesised beam ), we could still “resolve” it into two Faraday components by broadband spectro-polarimetric observations and QU-fitting. One way to apply this result is to the study of the ambient media of the target source, presumably a radio-loud AGN. NVSS J190255+315942 could be resolved into two Faraday simple components with a difference in the FD of between them. Such a large difference in the FD is not expected from the Milky Way within (e.g., [10,17]), especially off the Galactic plane. One possibility is to attribute the two Faraday components to two radio lobes, with the jet axis tilted with respect to the plane of the sky. In this picture, emission from the further lobe has to travel through extra magneto-ionised material surrounding the AGN, which is analogous to the Laing–Harrington effect [18,19], and the difference in the FD of the two components could originate from this extra material.
5. Summary
In these proceedings, we presented our study of high-|RM| sources from the NVSS RM catalogue with new broadband spectro-polarimetric data. We found that of our targets had erroneous RM values in the RM catalogue. This can potentially impact studies of cosmic magnetism that utilise the catalogue. There are also hints of RM time variabilities in most of our sources, which can be verified by future broadband polarisation monitoring. Finally, we demonstrated the possibility of applying the QU-fitting technique on broadband spectro-polarimetric data to study the ambient media of AGNs.
Acknowledgments
We thank Jeroen Stil for providing us with the NVSS RM cutout images. We thank Rainer Beck, Shane O’Sullivan, and Jeroen Stil for helpful discussion on this work. YKM was supported for this research by the International Max Planck Research School (IMPRS) for Astronomy and Astrophysics at the University of Bonn and Cologne. YKM acknowledges partial support through the Bonn-Cologne Graduate School of Physics and Astronomy. The National Radio Astronomy Observatory is a facility of the National Science Foundation operated under cooperative agreement by Associated Universities, Inc.
Author Contributions
Sui Ann Mao, Carl Heiles and Jennifer West planned the observations; Yik Ki Ma analysed the data and wrote this article; Aritra Basu developed the QU-fitting script.
Conflicts of Interest
The authors declare no conflict of interest.
References
- Beck, R. Magnetic fields in spiral galaxies. Astron. Astrophys. Rev. 2016, 24, 4. [Google Scholar] [CrossRef]
- Brentjens, M.A.; de Bruyn, A.G. Faraday rotation measure synthesis. Astron. Astrophys. 2005, 441, 1217–1228. [Google Scholar] [CrossRef]
- Taylor, A.R.; Stil, J.M.; Sunstrum, C. A Rotation Measure Image of the Sky. Astrophys. J. 2009, 702, 1230. [Google Scholar] [CrossRef]
- Harvey-Smith, L.; Madsen, G.J.; Gaensler, B.M. Magnetic Fields in Large-diameter H II Regions Revealed by the Faraday Rotation of Compact Extragalactic Radio Sources. Astrophys. J. 2011, 736, 83. [Google Scholar] [CrossRef]
- Purcell, C.R.; Gaensler, B.M.; Sun, X.H.; Carretti, E.; Bernardi, G.; Haverkorn, M.; Kesteven, M.J.; Poppi, S.; Schnitzeler, D.H.F.M.; Staveley-Smith, L. A Radio-Polarisation and Rotation Measure Study of the Gum Nebula and Its Environment. Astrophys. J. 2015, 804, 22. [Google Scholar] [CrossRef]
- Terral, P.; Ferrière, K. Constraints from Faraday rotation on the magnetic field structure in the Galactic halo. Astron. Astrophys. 2017, 600, A29–A51. [Google Scholar] [CrossRef]
- Condon, J.J.; Cotton, W.D.; Greisen, E.W.; Yin, Q.F.; Perley, R.A.; Taylor, G.B.; Broderick, J.J. The NRAO VLA Sky Survey. Astron. J. 1998, 115, 1693. [Google Scholar] [CrossRef]
- McMullin, J.P.; Waters, B.; Schiebel, D.; Young, W.; Golap, K. CASA Architecture and Applications. In Astronomical Data Analysis Software and Systems XVI ASP Conference Series, Proceedings of 16th annual conference on Astronomical Data Analysis Software and Systems (ADASS XVI), Tucson, AZ, USA, 15–18 October 2006; Shaw, R.A., Hill, F., Bell, D.J., Eds.; Publications of the Astronomical Society of the Pacific: San Francisco, CA, USA, 2007; Volume 376, p. 127. [Google Scholar]
- Heald, G.; Braun, R.; Edmonds, R. The Westerbork SINGS survey. II Polarization, Faraday rotation, and magnetic fields. Astron. Astrophys. 2009, 503, 409–435. [Google Scholar] [CrossRef]
- Mao, S.A.; Gaensler, B.M.; Haverkorn, M.; Zweibel, E.G.; Madsen, G.J.; McClure-Griffiths, N.M.; Shukurov, A.; Kronberg, P.P. A Survey of Extragalactic Faraday Rotation at High Galactic Latitude: The Vertical Magnetic Field of the Milky Way Toward the Galactic Poles. Astrophys. J. 2010, 714, 1170. [Google Scholar] [CrossRef]
- O’Sullivan, S.P.; Brown, S.; Robishaw, T.; Schnitzeler, D.H.F.M.; McClure-Griffiths, N.M.; Feain, I.J.; Taylor, A.R.; Gaensler, B.M.; Landecker, T.L.; Harvey-Smith, L.; et al. Complex Faraday depth structure of active galactic nuclei as revealed by broad-band radio polarimetry. Mon. Not. R. Astron. Soc. 2012, 421, 3300–3315. [Google Scholar] [CrossRef]
- Anderson, C.S.; Gaensler, B.M.; Feain, I.J. A Study of Broadband Faraday Rotation and Polarization Behavior over 1.3–10 GHz in 36 Discrete Radio Sources. Astrophys. J. 2016, 825, 59. [Google Scholar] [CrossRef]
- Burn, B.J. On the depolarization of discrete radio sources by Faraday dispersion. Mon. Not. R. Astron. Soc. 1966, 133, 67–83. [Google Scholar] [CrossRef]
- Sokoloff, D.D.; Bykov, A.A.; Shukurov, A.; Berkhuijsen, E.M.; Beck, R.; Poezd, A.D. Depolarization and Faraday effects in galaxies. Mon. Not. R. Astron. Soc. 1998, 299, 189–206. [Google Scholar] [CrossRef]
- Oppermann, N.; Junklewitz, H.; Robbers, G.; Bell, M.R.; Enßlin, T.A.; Bonafede, A.; Braun, R.; Brown, J.C.; Clarke, T.E.; Feain, I.J.; et al. An improved map of the Galactic Faraday sky. Astron. Astrophys. 2012, 542, A93–A106. [Google Scholar] [CrossRef]
- Jagannathan, P.; Bhatnagar, S.; Rau, U.; Taylor, A.R. Direction-dependent Corrections in Polarimetric Radio Imaging. I. Characterizing the Effects of the Primary Beam on Full-Stokes Imaging. Astron. J. 2017, 154, 56. [Google Scholar] [CrossRef]
- Haverkorn, M.; Brown, J.C.; Gaensler, B.M.; McClure-Griffiths, N.M. The Outer Scale of Turbulence in the Magnetoionized Galactic Interstellar Medium. Astrophys. J. 2008, 680, 362. [Google Scholar] [CrossRef]
- Laing, R.A. The sidedness of jets and depolarization in powerful extragalactic radio sources. Nature 1988, 331, 149–151. [Google Scholar] [CrossRef]
- Garrington, S.T.; Leahy, J.P.; Conway, R.G.; Laing, R.A. A systematic asymmetry in the polarization properties of double radio sources with one jet. Nature 1988, 331, 147–149. [Google Scholar] [CrossRef]
| 1 | Available on http://www.github.com/mrbell/pyrmsynth. |
Figure 1.
Left Faraday depths (FDs) from new Very Large Array (VLA) observations plotted against the rotation measure (RM) values in the NVSS RM catalogue. The data points should lie near the red line if FD/RM values from the two studies agree with each other (i.e., they are truly high-RM sources), or near one of the blue lines if they suffer from -ambiguity in the NVSS RM catalogue. Right RM from our new VLA observations using only the NVSS frequency bands against that obtained from NVSS RM cutout images. Both sets of RM values are obtained from performing the traditional fit, with -ambiguity resolved using the broadband FD values.
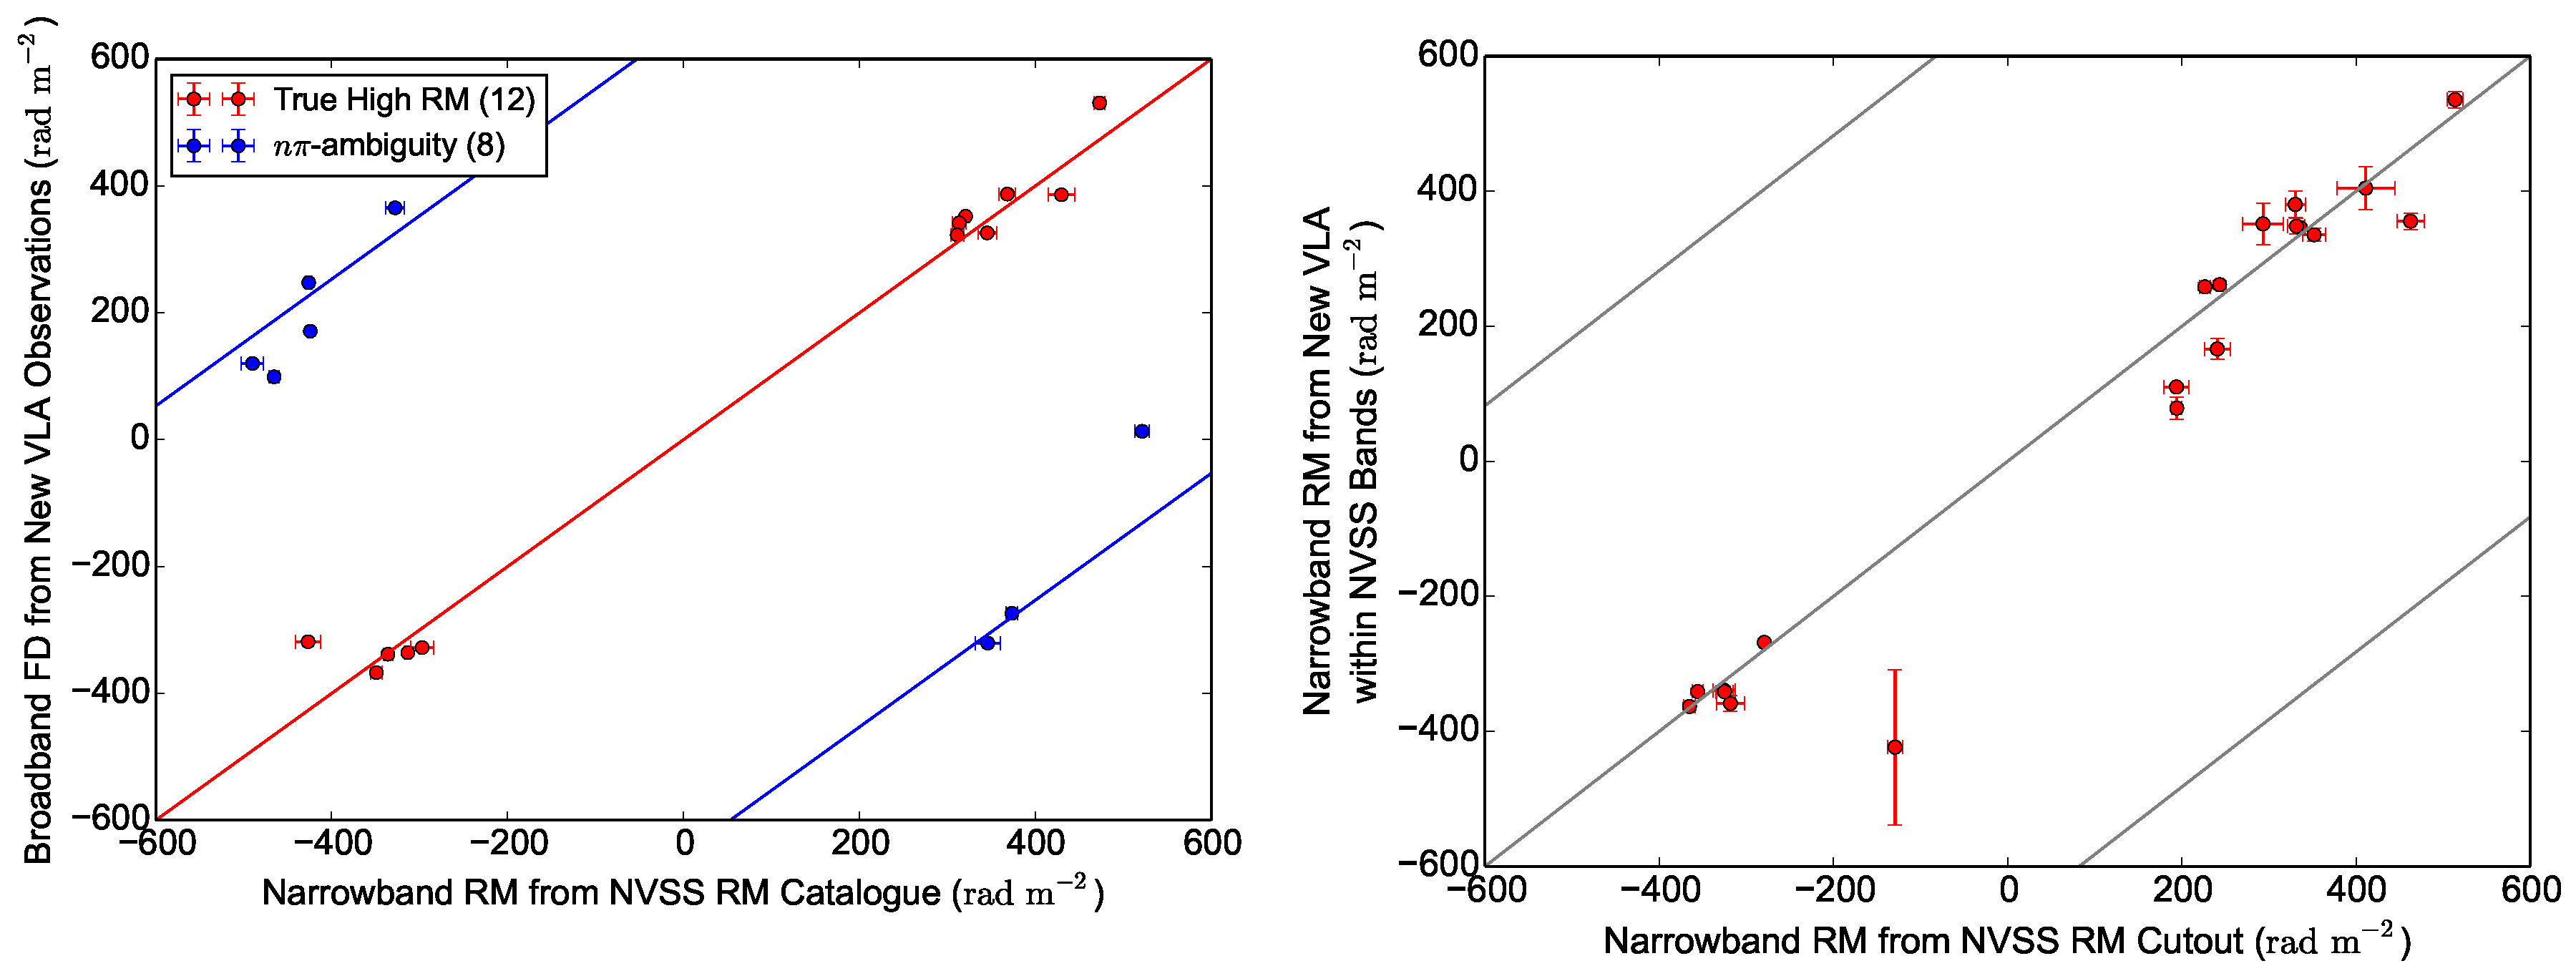
Figure 2.
QU-fitting results of NVSS J190255+315942, with (a) Q/I and U/I against , (b) polarisation fraction against , and (c) polarisation angle (PA) against . The dotted lines represent the best-fit model for the source (see text).
Figure 2.
QU-fitting results of NVSS J190255+315942, with (a) Q/I and U/I against , (b) polarisation fraction against , and (c) polarisation angle (PA) against . The dotted lines represent the best-fit model for the source (see text).

© 2017 by the authors. Licensee MDPI, Basel, Switzerland. This article is an open access article distributed under the terms and conditions of the Creative Commons Attribution (CC BY) license (http://creativecommons.org/licenses/by/4.0/).
Share and Cite
MDPI and ACS Style
Ma, Y.K.; Mao, S.A.; Basu, A.; Heiles, C.; West, J. Radio Polarisation Study of High Rotation Measure AGNs. Galaxies 2017, 5, 66. https://doi.org/10.3390/galaxies5040066
AMA Style
Ma YK, Mao SA, Basu A, Heiles C, West J. Radio Polarisation Study of High Rotation Measure AGNs. Galaxies. 2017; 5(4):66. https://doi.org/10.3390/galaxies5040066
Chicago/Turabian StyleMa, Yik Ki, Sui Ann Mao, Aritra Basu, Carl Heiles, and Jennifer West. 2017. "Radio Polarisation Study of High Rotation Measure AGNs" Galaxies 5, no. 4: 66. https://doi.org/10.3390/galaxies5040066
Note that from the first issue of 2016, this journal uses article numbers instead of page numbers. See further details here.