
Polarization Monitoring of the Lens System JVAS B0218+357


1
European Southern Observatory, Karl-Schwarzschild-Straße 2, D-85748 Garching bei München, Germany
2
Jodrell Bank Centre for Astrophysics, Alan Turing Building, School of Physics & Astronomy, The University of Manchester, Oxford Road, M13 9PL Manchester, UK
*
Author to whom correspondence should be addressed.
Galaxies 2017, 5(4), 69; https://doi.org/10.3390/galaxies5040069
Submission received: 15 September 2017
/
Revised: 2 October 2017
/
Accepted: 6 October 2017
/
Published: 18 October 2017
(This article belongs to the Special Issue Polarised Emission from Astrophysical Jets)
Abstract
:Monitoring of the lens system JVAS B0218+357 with the Fermi Gamma-ray Space Telescope measured a different time delay to that derived from radio observations. We have re-analysed three months of archival Very Large Array data to produce variability curves with an average sampling of one epoch per day in total flux, polarized flux and polarization position angle (PPA) at 15, 8.4 and 5 GHz. The variability is particularly strong in polarized flux. Dense sampling and improved subtraction of the Einstein ring has allowed us to produce superior variability curves and a preliminary analysis has resulted in a time delay (11.5 days) which agrees well with the -ray value. Both images of 0218+357 are subject to strong Faraday rotation and depolarization as a result of the radio waves passing through the interstellar medium of the spiral lens galaxy. Our data reveal frequency-dependent variations in the PPA that are different in each image and which must therefore result from variable Faraday rotation in the lens galaxy on timescales of a few days. Our analysis has revealed systematic errors in the polarization position angle measurements that strongly correlate with hour angle. Although we have been able to correct for these, we caution that all VLA polarization observations are potentially affected.
1. Introduction
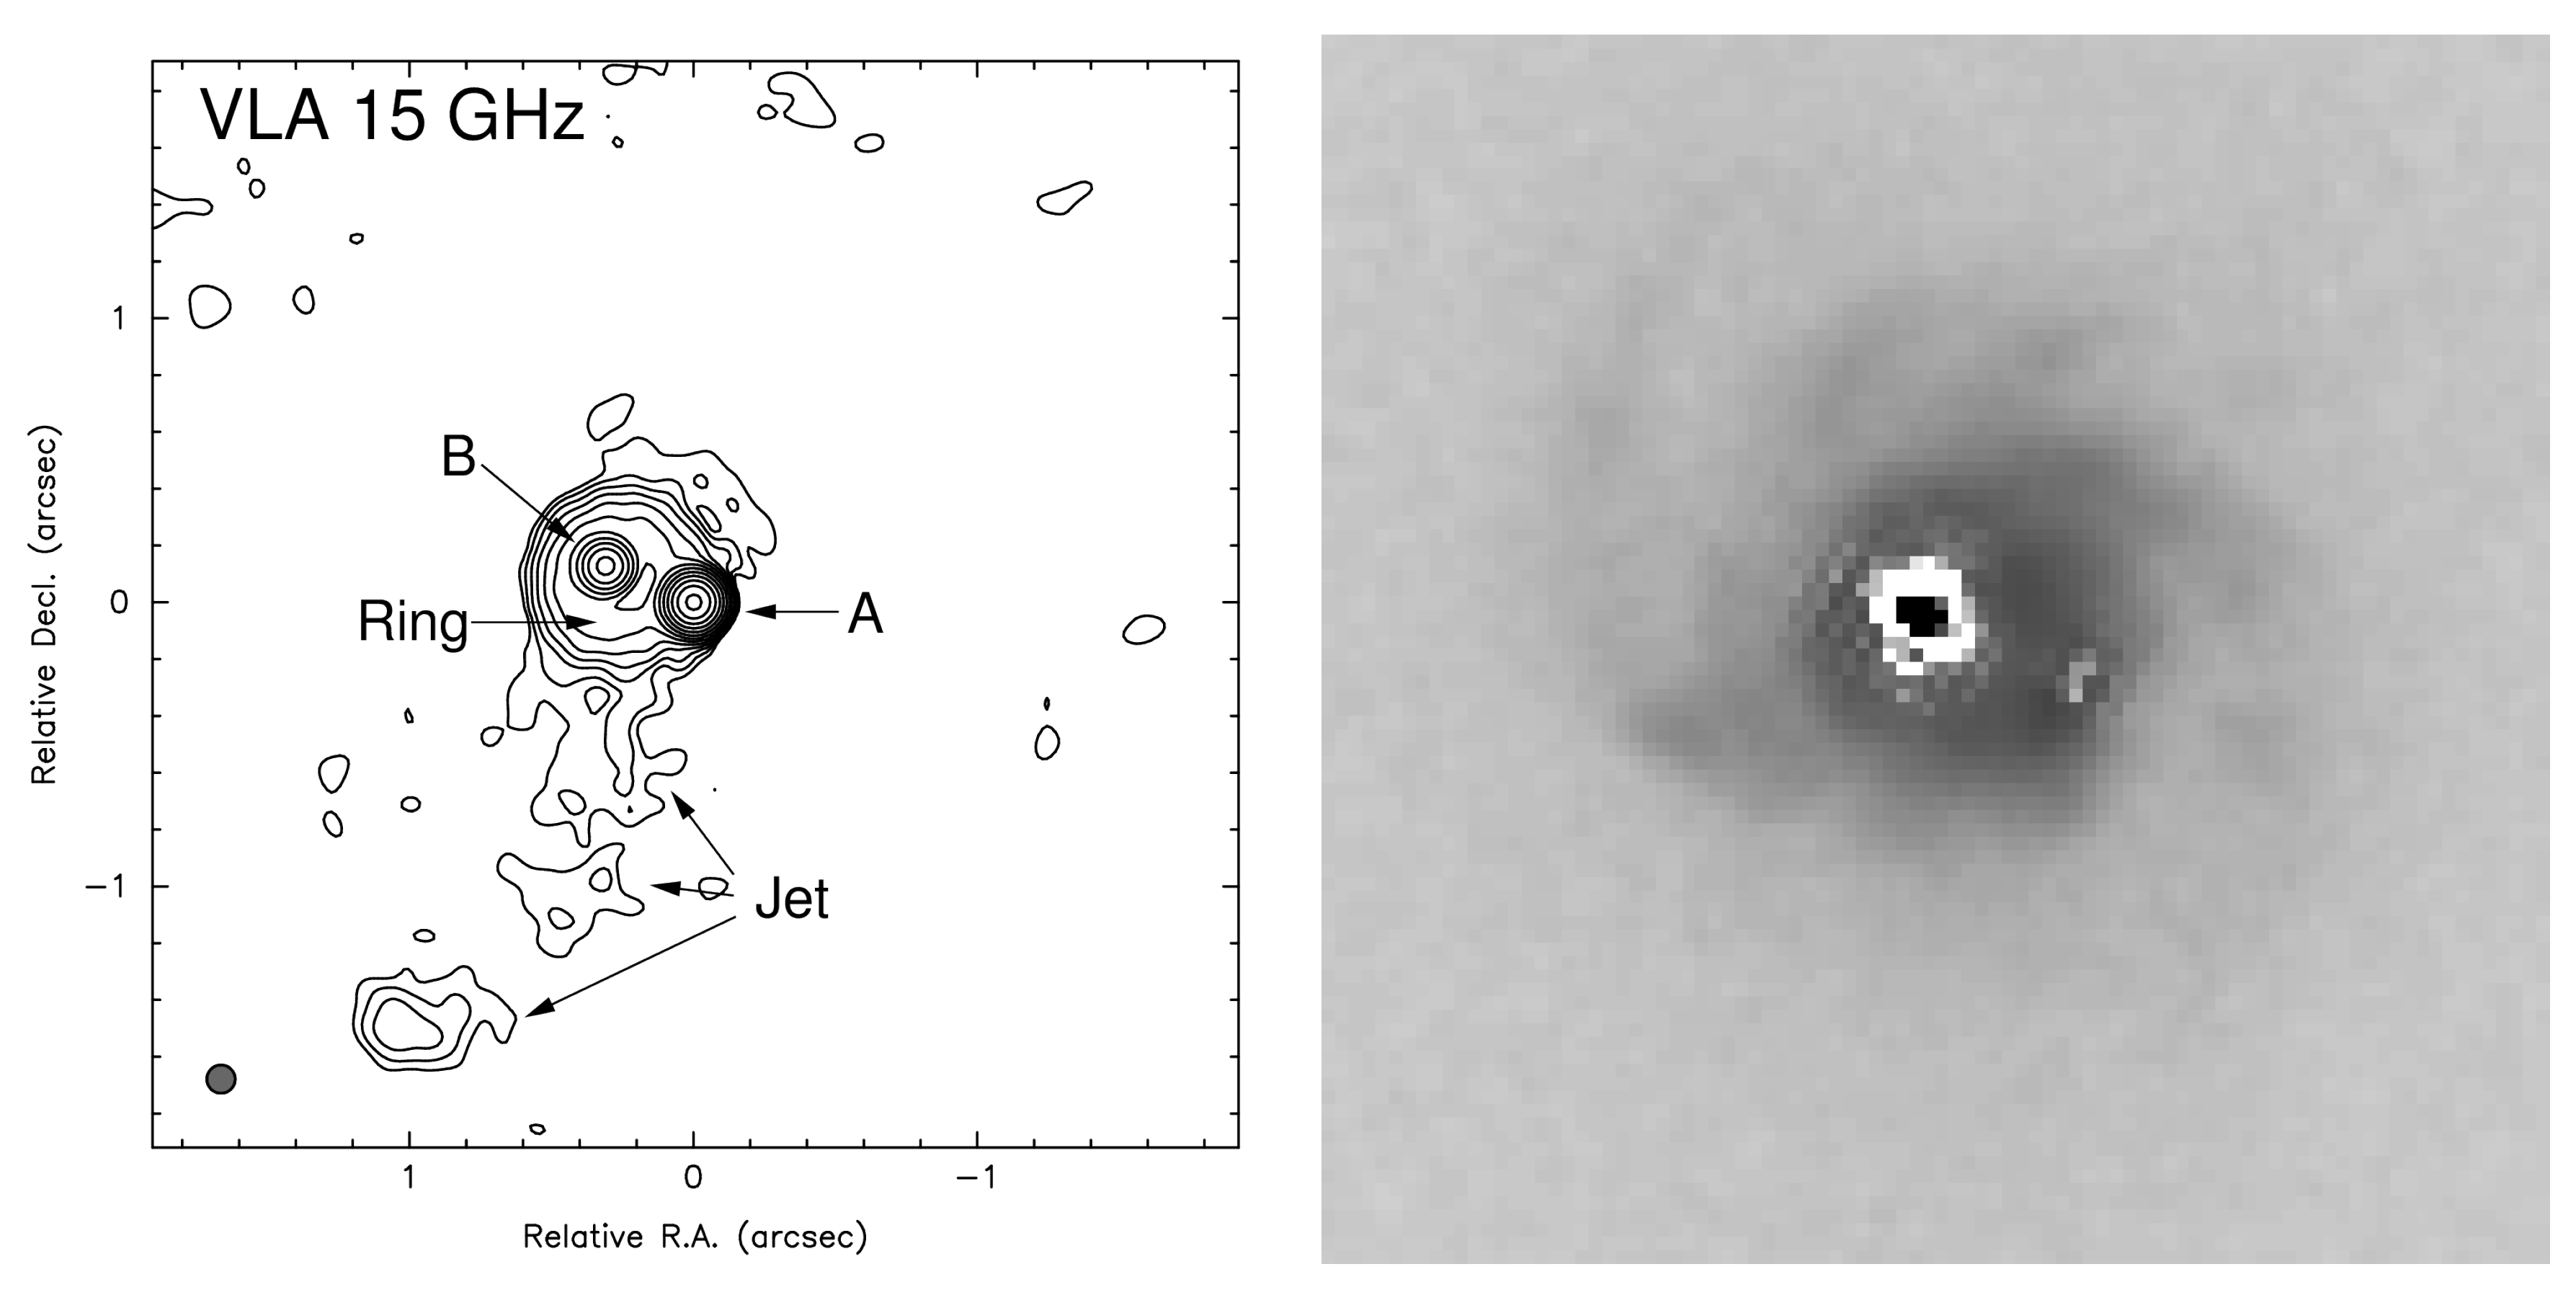
B0218+357 [1] is a two-image lens system, one of six discovered during the course of the Jodrell Bank/VLA astrometric survey [2]. With a separation of only 334 mas between the two lensed images, B0218+357 remains the smallest lens system discovered to date. A number of properties of this lens make it an excellent system for measuring the Hubble constant, , via a measurement of the time delay between the two images [3]—the redshifts to the lens and lensed source are both known, an Einstein ring and VLBI substructure provide constraints on the mass model [4], the spiral lensing galaxy is an isolated field galaxy (greatly simplifying the mass model) and the lensed source (a blazar) is highly variable. Radio (VLA 15-GHz) and optical (HST I-band) images of B0218+357 are shown in Figure 1.
An additional property of B0218+357 that makes it particularly suitable for time-delay studies is that the lensed images are highly polarized, ≤10 per cent at high (≥15 GHz) frequencies. Therefore, the time delay can also potentially be measured in both polarized flux density and polarization position angle (PPA) and allow higher accuracy in the time-delay determination. This system has been monitored over the course of several campaigns with the VLA and B0218+357 remains the only lens to date for which a time delay ( days) has been measured using polarization data [5]. A similar time delay ( days—not including polarization data) has also been published [6] using data taken during the same season in which [5] were monitoring.
The issue of the time delay in B0218+357 seemed settled until recent monitoring with the Fermi Gamma-ray Space Telescope. Although the angular resolution of this instrument is not sufficient to separate the two lensed images A and B, it was still possible to identify individual flares and their delayed counterparts in the summed (A + B) time series. The resulting time delay [8] was longer than the previous determinations ( days − 1 ) and statistically inconsistent with the [5] value.
The apparent difference in the radio and -ray delays has been interpreted as a position shift between the radio- and -ray-emitting regions [8,9] and to confirm this we have decided to perform a combined analysis of the VLA monitoring data separately published by [5,6]. The greater number of epochs and the increased sampling alone should produce a more accurate time delay, but we have also used improved data-reduction techniques that have allowed more accurate variability curves to be derived, particularly in polarization.
2. Materials and Methods
The data used in our reanalysis correspond to VLA projects AB809 and AH593. Both were observed at 8.4 and 15 GHz in A configuration (producing angular resolutions of ∼200 and 120 mas respectively) from October 1996 to January 1997 for a total of 106 epochs. All calibration was carried out using NRAO’s AIPS.
The observational strategies followed by each project were significantly different. For AH593, the flux-density of each epoch was calibrated using the flux-density standard 3C 48, whilst AB809 tied its flux scale to 3C 119, a compact steep-spectrum source (CSS) which contains a very weak core. In both cases the polarization leakage (D-terms) was calculated using short scans of the unpolarized source 3C 84, whilst the PPA was calibrated using 3C 119 for AB809 and 3C 48 for AH593.
Comparing the PPA calibration corrections (R-L phase difference) found using 3C 48 and 3C 119 reveals an interesting systematic effect that is a function of the hour angle of 3C 48 (Figure 2). The observed trend agrees well with the expected offset in the source parallactic angle for an error in the antenna latitude of 10 arcmin. Although no such error in the VLA system has been identified, the effect is real and can be corrected using the fit. The parallactic-angle offset is most pronounced for sources close to the zenith which is why it is so obvious with 3C 48 (J0137+331—the VLA latitude is 34), but we have also corrected the B0218+357 data as this also passes near the zenith.
The flux densities of images A and B were calculated by modelfitting to the data in Difmap [10]. An important consideration here is the Einstein ring, which if not dealt with will lead to poor modelfits and systematic offsets in the Stokes I, Q and U flux densities. This is particularly the case at 8.4 GHz where the steep-spectrum ring is brighter and the angular resolution poorer. The simplest approach is to only include data with spatial frequencies as this removes the majority of the extended ring emission. However, this can cause up to 50 per cent of the data to be excluded and thus we followed a hybrid approach whereby the flux densities found using the -exclusion technique were first subtracted from the data at each epoch. The ring-only datasets were then combined and sensitive maps of the Einstein ring made in all three Stokes parameters. The clean components corresponding to these maps were then subtracted from each epoch and the A and B flux densities measured using the full range. This technique greatly improved the quality of the B0218+357 variability curves.
3. Results
3.1. Variability Curves
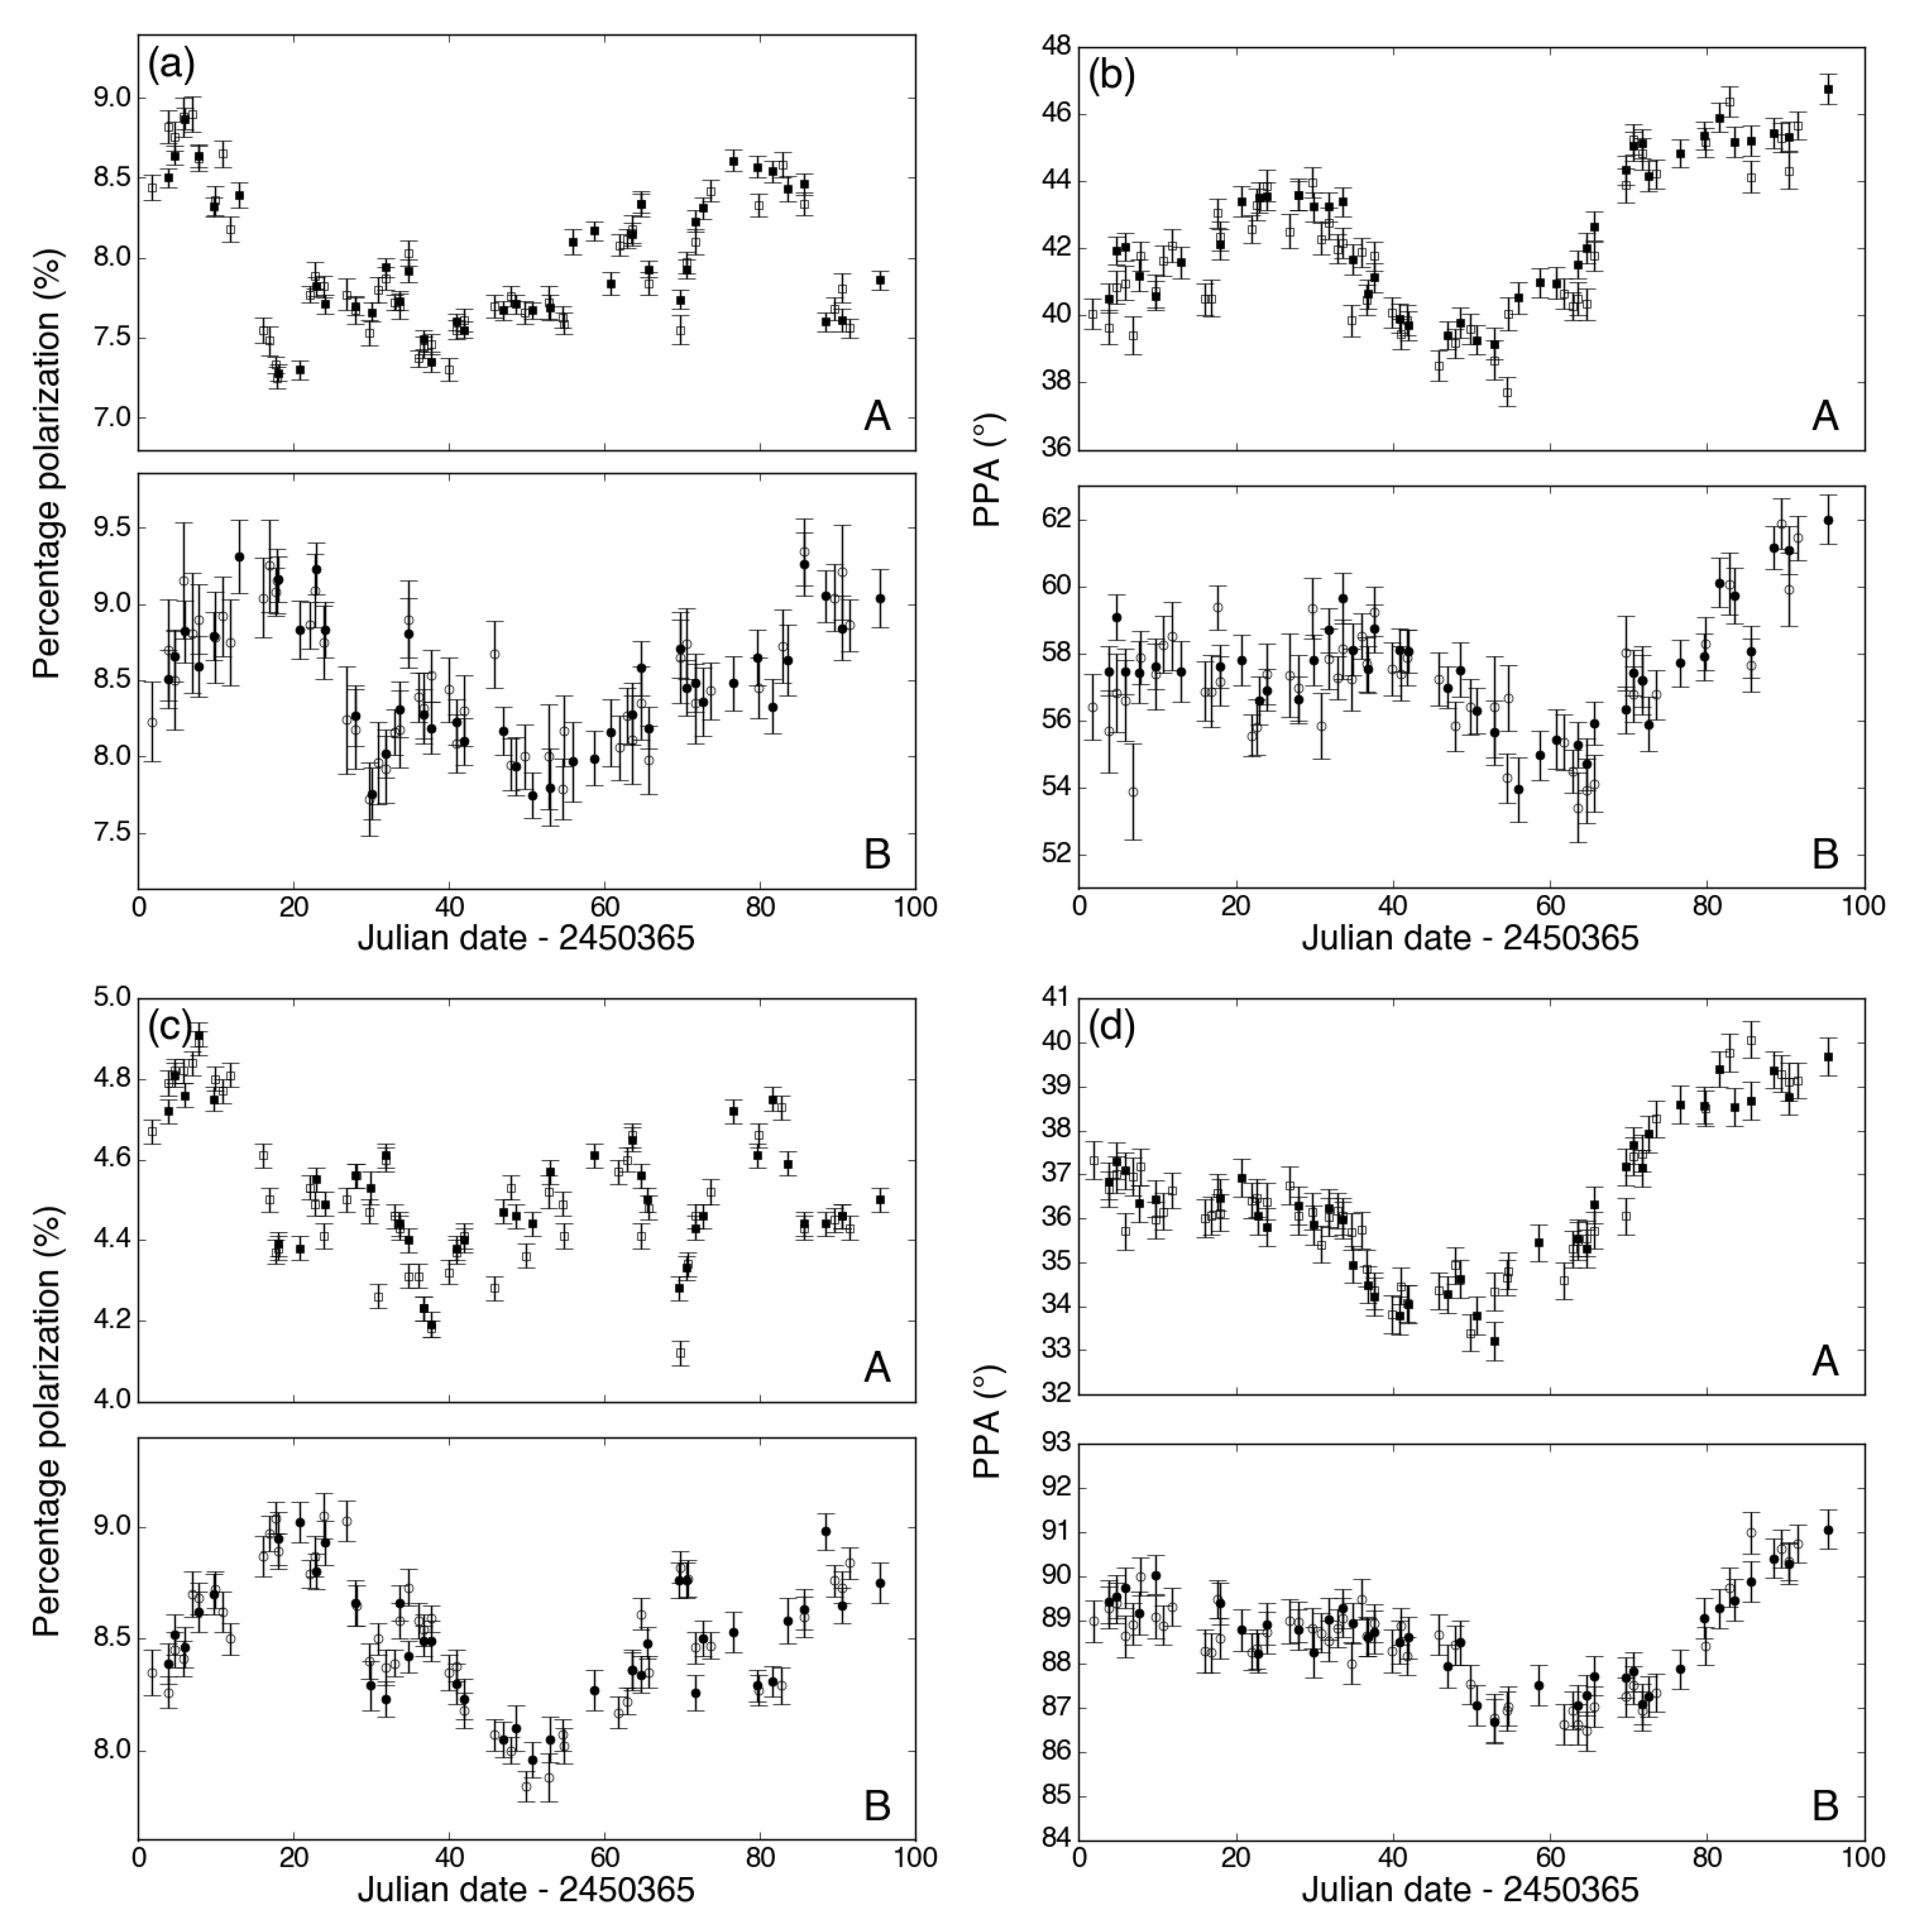
The 8.4- and 15-GHz polarization variability curves are shown in Figure 3. At 15 GHz, the variations are similar to those reported by [5] (Cohen et al. [6] did not show the polarization curves), but with improved sampling. The polarization measurements are more accurate and the uncertainties are smaller due to the reduction of systematic effects such as the PPA offsets discussed in Section 2 and the use of detailed models for the Einstein ring. At 8.4 GHz, the improvement is impressive. Biggs et al. [5] were unable to use the 8.4-GHz variability curves in their time-delay analysis as they were completely dominated by systematic errors, but our new reduction has reduced these to such an extent that the intrinsic variability is clearly visible.
It is perhaps most obvious in the PPA curves that the variations in image B are delayed with respect to image A.
3.2. Time-Delay Analysis
Determining a time delay from the variability curves is at an early stage, but it is clear that the time delay is significantly higher than that reported by [5] and seems to be consistent with the -ray value of 11.5 days. We have used a number of different techniques to derive the time delay including interpolation-based techniques (cross-correlation, chi-squared minimisation) as well as the “dispersion” technique of [11] that avoids the need to interpolate between epochs. Applied to the various datasets, all give similar values around 11.5 days and exclude delays below 11.0 days at high significance. Derivation of the final time delay and related uncertainty from the combined radio data is currently being undertaken.
3.3. Faraday Effects
An additional interesting aspect of B0218+357 is the Faraday rotation and depolarization of both images [1,12] in the interstellar medium of the spiral lensing galaxy. The depolarization is particularly prominent in image A—the AB809 campaign also included short scans at 5 GHz and our ring-subtraction technique has allowed us to determine polarizations of ∼1 and 6 per cent for A and B respectively.
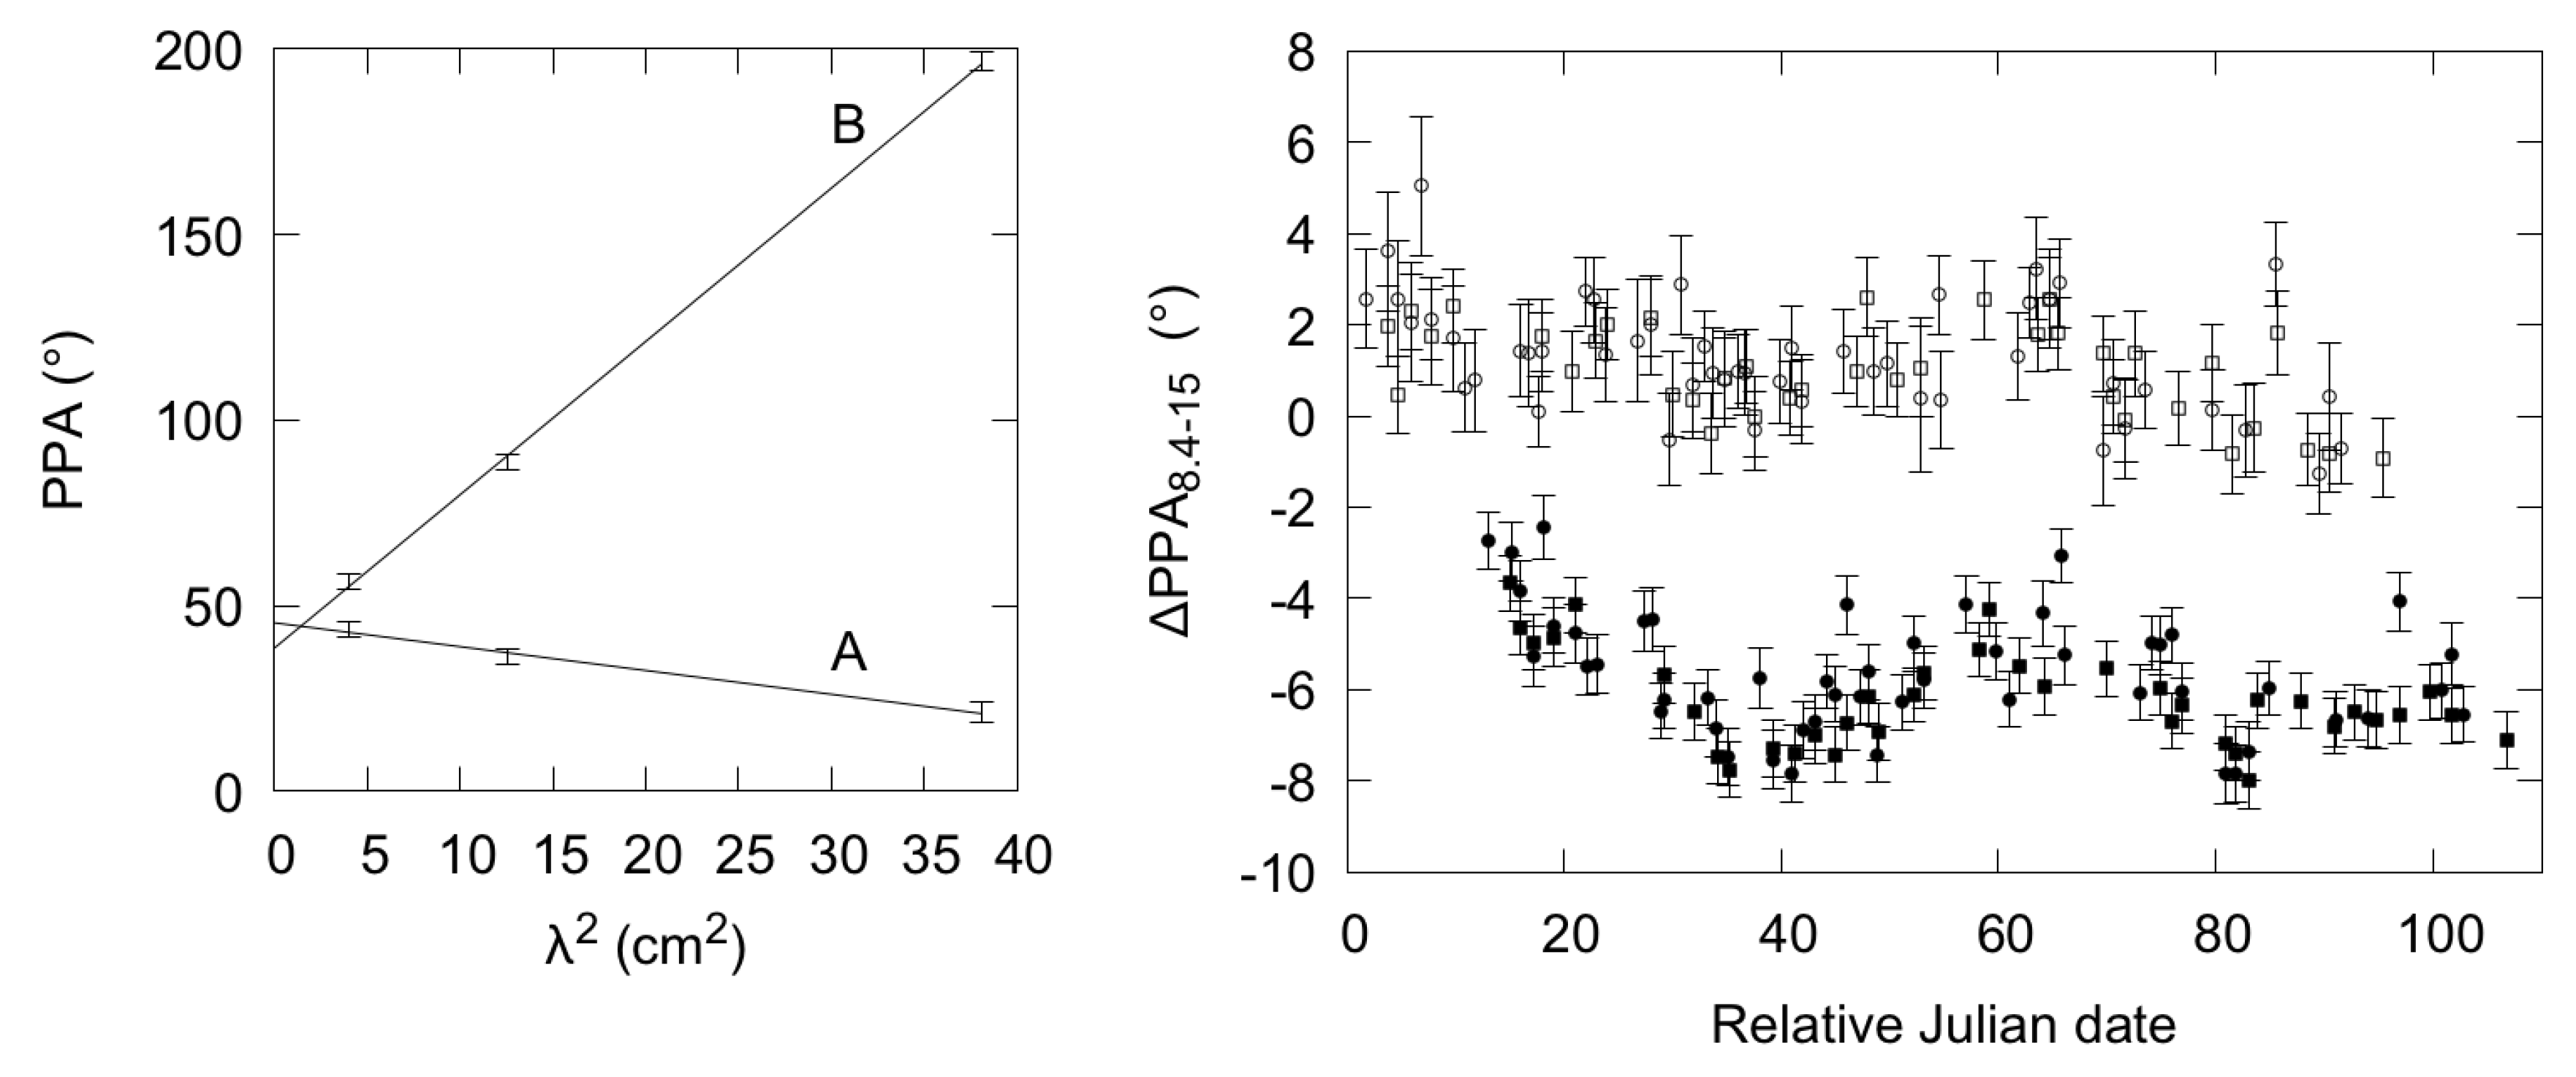
Measurements of the Faraday rotation by various authors have, to date, not been consistent and in particular it was not clear whether the sign of the rotation measure (RM) was the same in each image. Our new three-frequency monitoring reduction finally resolves this issue and has allowed us to show definitively that the rotation measures do have opposite signs and we measure and rad m (left panel of Figure 4). The sign reversal signifies that the components of the magnetic field along the line of sight at the locations of A and B in the lensing galaxy have opposite directions.
It is possible to produce additional variability curves by combining the data at 8.4 and 15 GHz, e.g., to derive the spectral index of A and B at each epoch. For total and polarized flux density and percentage polarization (not shown), the time delay is clearly visible in the resulting curves, but this is not the case for the curve (right panel of Figure 4) which is effectively a plot of the RM of each image as a function of time. In this case, the image A and B variations look different, particularly during the first third of the monitoring. Image-dependent differences of this nature possibly indicate that changes in the lensed source cause each image to move relative to the Faraday screen in the lensing galaxy.
4. Discussion
The main finding of our new combined analysis of the VLA B0218+357 monitoring data is that the individual time delays previously published using these data were too low and that the radio data are in fact consistent with the recently published -ray value. One conclusion from this is that there is no significant offset between the radio and -ray emitting regions in the lensed source.
The main point of measuring gravitational lens time delays is to derive the expansion rate of the Universe. The previously measured value of 10.5 days combined with the model of [4] resulted in km s Mpc (2 ) which is high compared to the currently accepted values found from studying the power spectrum of the Cosmic Microwave Background [ km s Mpc]—[13] and Cepheids [ km s Mpc]—[14]. However, the longer time delays returned by the -ray monitoring and the new radio reduction reduce the value of measured using B0218+357 to ∼72 km s Mpc (for a delay of 11.5 days). A final time delay and estimate will appear elsewhere.
Acknowledgments
The National Radio Astronomy Observatory is a facility of the National Science Foundation operated under cooperative agreement by Associated Universities, Inc.
Author Contributions
Andrew Biggs performed the data analysis and wrote the manuscript. Ian Browne contributed to the scientific discussion.
Conflicts of Interest
The authors declare no conflict of interest.
References
- Browne, I.W.A.; Patnaik, A.R.; Walsh, D.; Wilkinson, P.N. The Redshift of the Lensing Galaxy in the Gravitationally Lensed System B0218+35.7. Mon. Not. R. Astron. Soc. 1993, 263, L32–L36. [Google Scholar] [CrossRef]
- King, L.J.; Browne, I.W.A.; Marlow, D.R.; Patnaik, A.R.; Wilkinson, P.N. Gravitationally lensed radio sources in the Jodrell Bank-VLA Astrometric Survey. Mon. Not. R. Astron. Soc. 1999, 307, 225–235. [Google Scholar] [CrossRef]
- Refsdal, S. On the possibility of determining Hubble’s parameter and the masses of galaxies from the gravitational lens effect. Mon. Not. R. Astron. Soc. 1964, 128, 307–310. [Google Scholar] [CrossRef]
- Wucknitz, O.; Biggs, A.D.; Browne, I.W.A. Models for the lens and source of B0218+357: A LENSCLEAN approach to determine H0. Mon. Not. R. Astron. Soc. 2004, 349, 14–30. [Google Scholar] [CrossRef]
- Biggs, A.D.; Browne, I.W.A.; Helbig, P.; Koopmans, L.V.E.; Wilkinson, P.N.; Perley, R.A. Time delay for the gravitational lens system B0218+357. Mon. Not. R. Astron. Soc. 1999, 304, 349–358. [Google Scholar] [CrossRef]
- Cohen, A.S.; Hewitt, J.N.; Moore, C.B.; Haarsma, D.B. Further Investigation of the Time Delay, Magnification Ratios, and Variability in the Gravitational Lens 0218+357. Astrophys J. 2000, 545, 578–590. [Google Scholar] [CrossRef]
- York, T.; Jackson, N.; Browne, I.W.A.; Wucknitz, O.; Skelton, J.E. The Hubble constant from the gravitational lens CLASS B0218+357 using the Advanced Camera for Surveys. Mon. Not. R. Astron. Soc. 2005, 357, 124–134. [Google Scholar] [CrossRef]
- Cheung, C.C.; Larsson, S.; Scargle, J.D.; Amin, M.A.; Blandford, R.D.; Bulmash, D.; Chiang, J.; Ciprini, S.; Corbet, R.H.D.; Falco, E.E.; et al. Fermi Large Area Telescope Detection of Gravitational Lens Delayed γ-Ray Flares from Blazar B0218+357. Astrophys J. 2014, 782, L14. [Google Scholar] [CrossRef]
- Barnacka, A.; Geller, M.J.; Dell’Antonio, I.P.; Zitrin, A. The Structure of the Strongly Lensed Gamma-Ray Source B2 0218+35. Astrophys J. 2016, 821, 58. [Google Scholar] [CrossRef]
- Shepherd, M.C. Difmap: An Interactive Program for Synthesis Imaging; Astronomical Society of the Pacific: San Francisco, CA, USA, 1997; Volume 125, p. 77. [Google Scholar]
- Pelt, J.; Kayser, R.; Refsdal, S.; Schramm, T. The light curve and the time delay of QSO 0957+561. Astron. Astrophys. 1996, 305, 97–106. [Google Scholar]
- O’Dea, C.P.; Baum, S.A.; Stanghellini, C.; Dey, A.; van Breugel, W.; Deustua, S.; Smith, E.P. Radio and optical observations of 0218+357—The smallest Einstein ring? Astron. J. 1992, 104, 1320–1330. [Google Scholar] [CrossRef]
- Planck Collaboration; Ade, P.A.R.; Aghanim, N.; Arnaud, M.; Ashdown, M.; Aumont, J.; Baccigalupi, C.; Banday, A.J.; Barreiro, R.B.; Bartlett, J.G.; et al. Planck 2015 results. XIII. Cosmological parameters. Astron. Astrophys. 2016, 594, A13. [Google Scholar] [CrossRef]
- Riess, A.G.; Macri, L.M.; Hoffmann, S.L.; Scolnic, D.; Casertano, S.; Filippenko, A.V.; Tucker, B.E.; Reid, M.J.; Jones, D.O.; Silverman, J.M.; et al. A 2.4% Determination of the Local Value of the Hubble Constant. Astrophys J. 2016, 826, 56. [Google Scholar] [CrossRef]
Figure 1.
Left: VLA 15-GHz image of B0218+357 illustrating the main features of this lens system—two images (A and B) of a blazar core and an Einstein ring. The ring diameter is similar to the separation of the two lensed images (334 mas). Right: HST I-band image taken using the Advanced Camera for Surveys (Figure 7 of [7]). The lensed images have been removed to reveal the underlying galaxy more clearly. Note the prominent spiral arms. The images are on different scales.

Figure 2.
Polarization position angle (PPA) of 3C 48 relative to that of 3C 119. A very clear systematic effect is visible which is a function of the hour angle of 3C 48. The solid line is the theoretical error expected in the parallactic angle of the source for a latitude error of 10 arcmin. The origin of this effect remains unclear, but the fit can be used to correct the PPA calibration based on 3C 48 and the measured PPA of B0218+357.
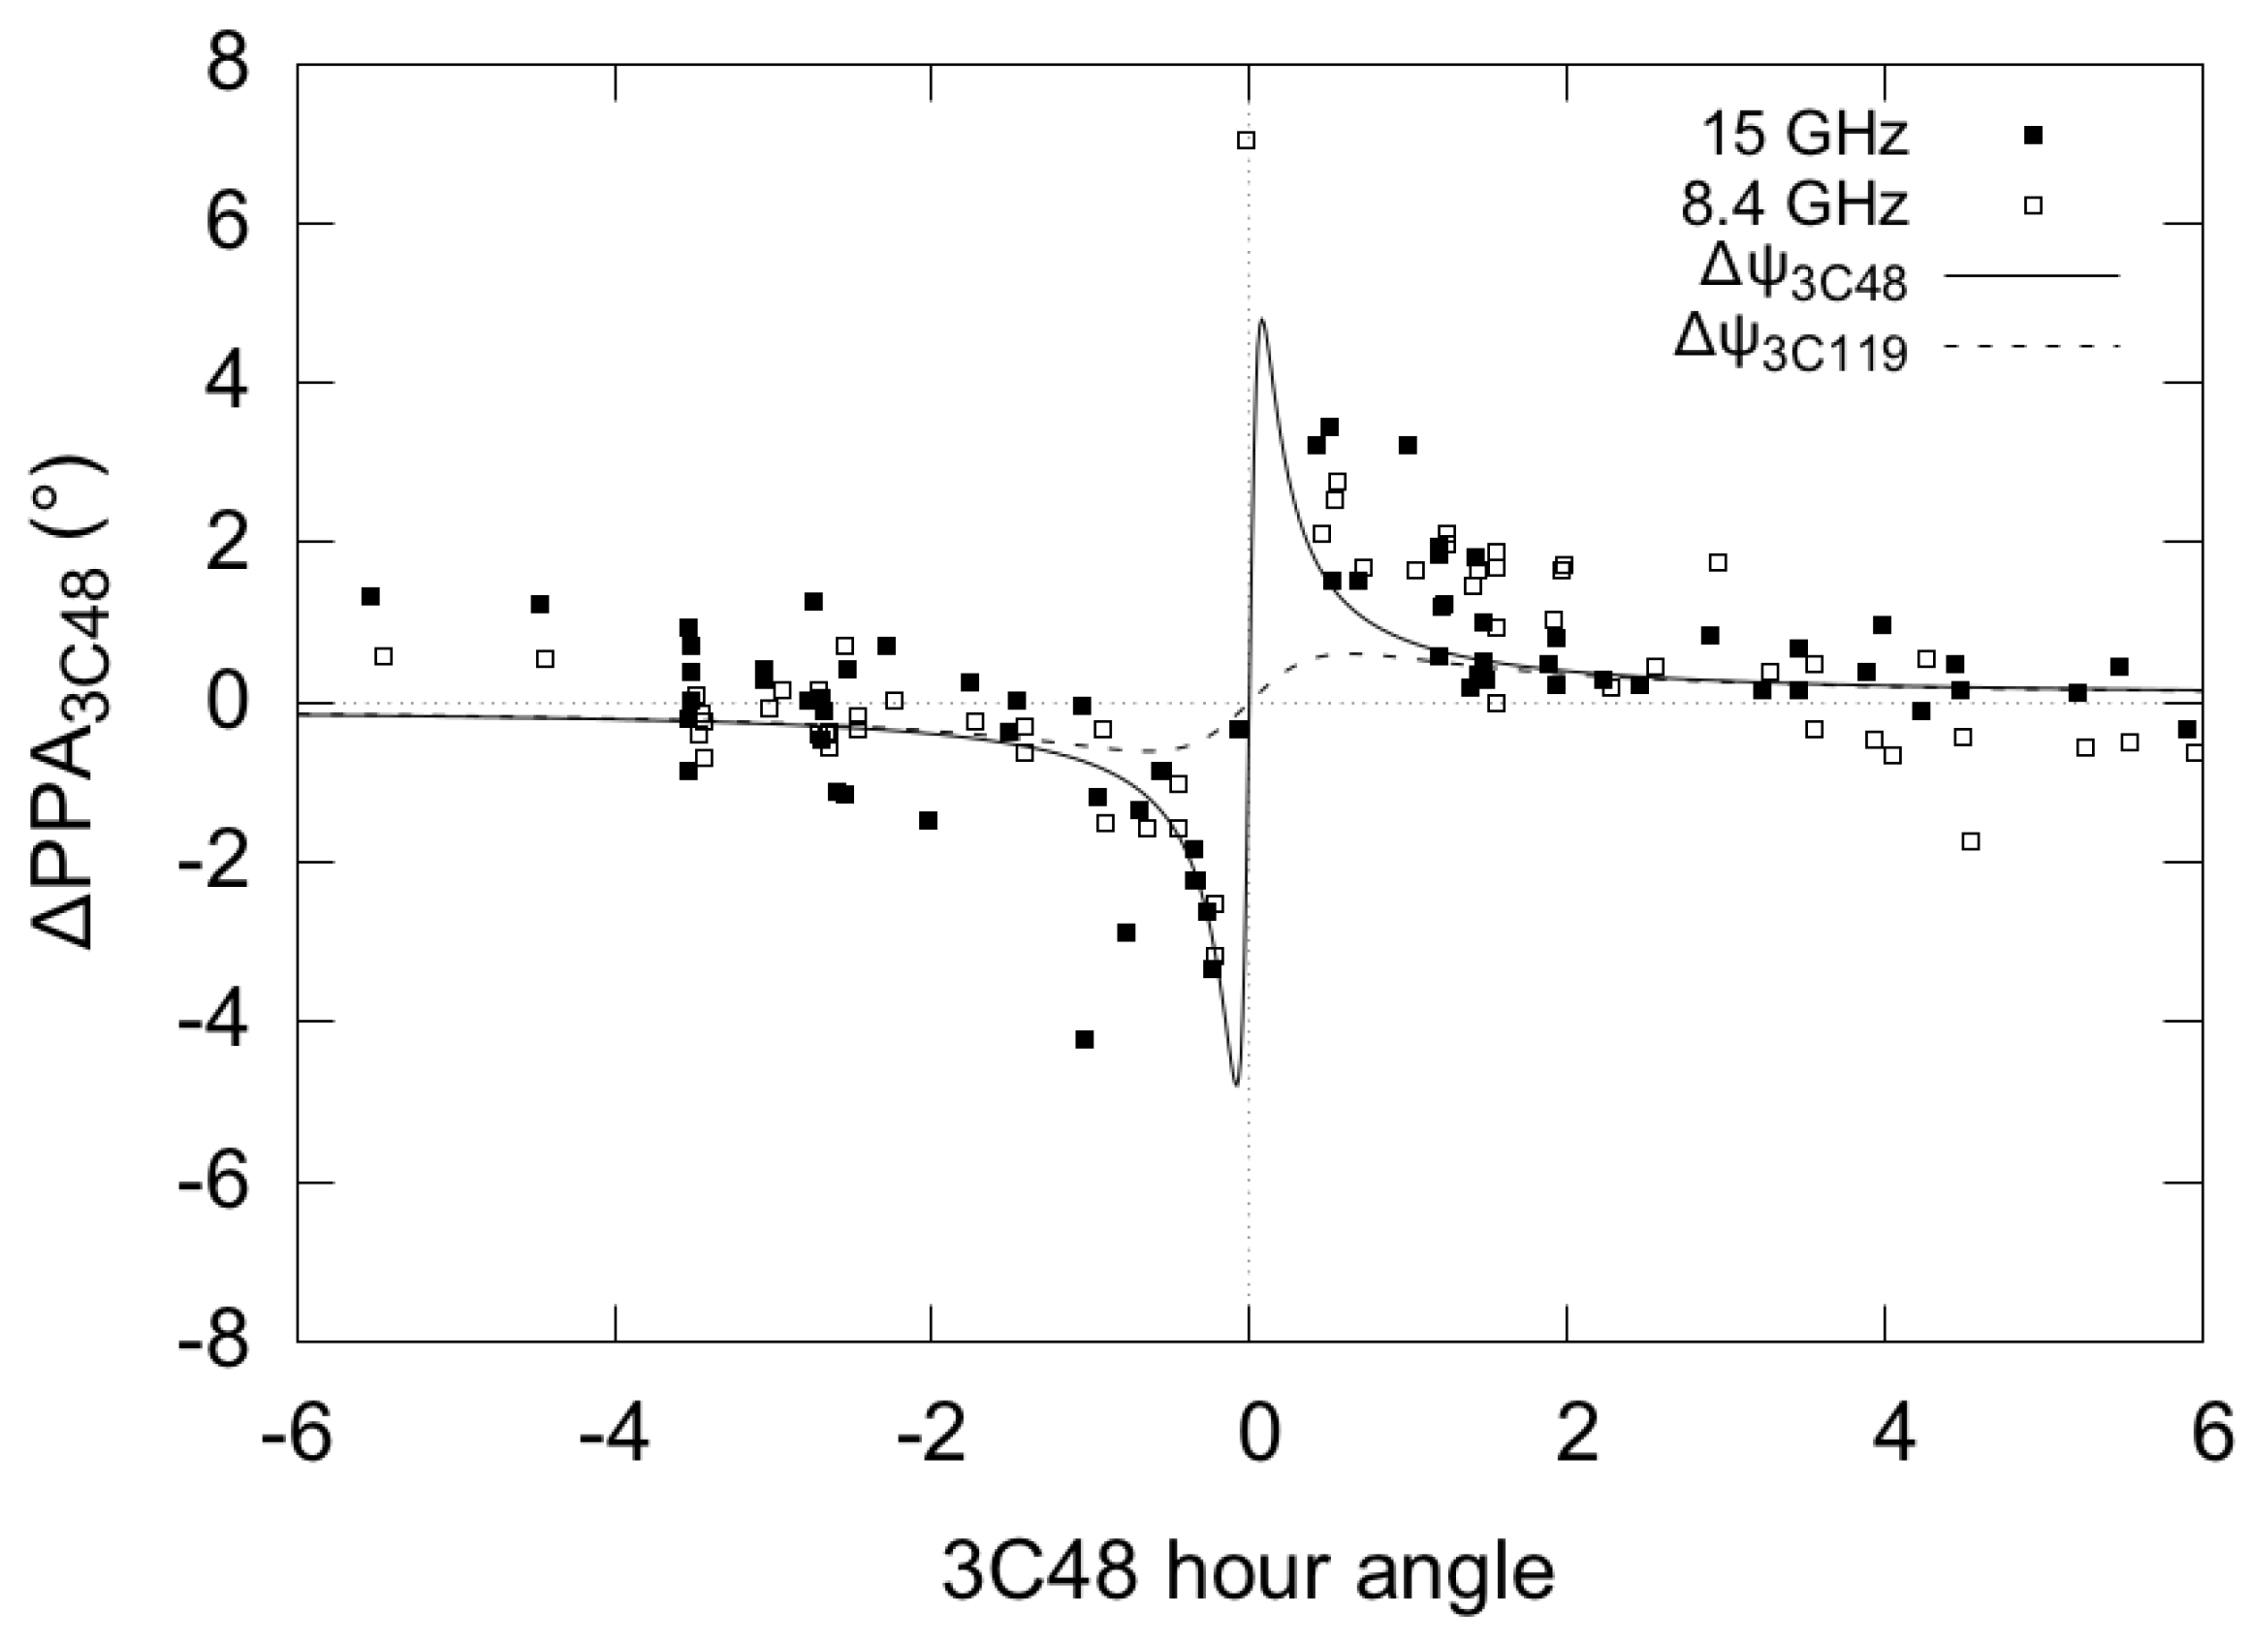
Figure 3.
Variability curves of images A and B of B0218+357. (a) 15-GHz percentage polarization; (b) 15-GHz polarization position angle; (c) 8.4-GHz percentage polarization; (d) 8.4-GHz polarization position angle. Image A is the upper panel in each case.
Figure 3.
Variability curves of images A and B of B0218+357. (a) 15-GHz percentage polarization; (b) 15-GHz polarization position angle; (c) 8.4-GHz percentage polarization; (d) 8.4-GHz polarization position angle. Image A is the upper panel in each case.

Figure 4.
Left: the PPA of images A and B as a function of the wavelength squared. The linear variation is characteristic of Faraday rotation. Right: difference in PPA (8.4–15 GHz) for A (bottom—solid points) and B (top—open points). Image A has been shifted forward by the time delay. The majority of the image-B rotation measure have been removed in order to compare the two curves more easily.
© 2017 by the authors. Licensee MDPI, Basel, Switzerland. This article is an open access article distributed under the terms and conditions of the Creative Commons Attribution (CC BY) license (http://creativecommons.org/licenses/by/4.0/).
Share and Cite
MDPI and ACS Style
Biggs, A.; Browne, I. Polarization Monitoring of the Lens System JVAS B0218+357. Galaxies 2017, 5, 69. https://doi.org/10.3390/galaxies5040069
AMA Style
Biggs A, Browne I. Polarization Monitoring of the Lens System JVAS B0218+357. Galaxies. 2017; 5(4):69. https://doi.org/10.3390/galaxies5040069
Chicago/Turabian StyleBiggs, Andrew, and Ian Browne. 2017. "Polarization Monitoring of the Lens System JVAS B0218+357" Galaxies 5, no. 4: 69. https://doi.org/10.3390/galaxies5040069
Note that from the first issue of 2016, this journal uses article numbers instead of page numbers. See further details here.