Gravitational Lens Time Delays Using Polarization Monitoring


1
European Southern Observatory, Karl-Schwarzschild-Straße 2, D-85748 Garching bei München, Germany
2
Jodrell Bank Centre for Astrophysics, School of Physics & Astronomy, The University of Manchester, Alan Turing Building, Oxford Road, Manchester M13 9PL, UK
*
Author to whom correspondence should be addressed.
Galaxies 2017, 5(4), 76; https://doi.org/10.3390/galaxies5040076
Submission received: 15 September 2017
/
Revised: 25 October 2017
/
Accepted: 8 November 2017
/
Published: 13 November 2017
(This article belongs to the Special Issue Polarised Emission from Astrophysical Jets)
Abstract
:Gravitational lens time delays provide a means of measuring the expansion of the Universe at high redshift (and therefore in the ‘Hubble flow’) that is independent of local calibrations. It was hoped that many of the radio lenses found in the JVAS/CLASS survey would yield time delays as these were selected to have flat spectra and are dominated by multiple compact components. However, despite extensive monitoring with the Very Large Array (VLA), time delays have only been measured for three of these systems (out of 22). We have begun a programme to reanalyse the existing VLA monitoring data with the goal of producing light curves in polarized flux and polarization position angle, either to improve delay measurements or to find delays for new sources. Here, we present preliminary results on the lens system B1600+434 which demonstrate the presence of correlated and substantial polarization variability in each image.
1. Introduction
The Jodrell Bank–VLA Astrometric Survey (JVAS) and Cosmic Lens All Sky Survey (CLASS) observed over 16,000 flat-spectrum radio sources with the Very Large Array (VLA) at 8.4 GHz and identified 22 of these as gravitational lens systems through higher-resolution follow-up [1]. The flat-spectrum criterion was designed to select sources that were dominated by compact emission and which would therefore be (a) easily identifiable as lens systems and (b) likely to vary in brightness as a function of time. It was hoped that monitoring observations would allow the measurement of the time delays in many of these systems and thus allow multiple determinations of . However, despite many monitoring campaigns (the majority with the VLA at 8.4 GHz) time delays have only been measured for three of the 22 systems: JVAS B0218+357 [2,3], CLASS B1608+656 [4] and CLASS B1600+434 [5].
The case of B0218+357 is interesting as the lensed source is highly polarized (≤10%) and the variability of the polarized flux density is particularly pronounced. Other JVAS and CLASS lenses are also polarized, but monitoring of the polarization seems to have been discounted by most observers as a method of measuring the time delay, probably due to the very low polarized flux densities involved and the need to include dedicated polarization calibrators during the typically short monitoring observations. B0218+357 therefore remains the only lens system for which a time delay has been measured using polarization data. However, given the fact that radio sources are often more variable in polarization than in total flux density, we have begun an analysis of archival VLA data to investigate whether these can be used to measure additional time delays via polarization variability.
B1600+434 (Figure 1 is a two-image lens system [6] for which time delays of days [5] and days [7] have been measured in the radio and optical respectively. However, no correlated features were present in the radio data and the published delay was reliant upon a measurement of the flux ratio from a previous, unpublished monitoring campaign. Also, both the optical and radio data show evidence of variability that is not intrinsic to the lensed source which even in the radio might be due to microlensing [8] which complicates the time-delay determination.
A much more robust time delay has since been measured with further seasons of VLA monitoring [9] but the question arises as to whether the delay could have been measured more efficiently using polarization monitoring. The lensed source is polarized although this has received very little attention in the literature.
Here, we present a preliminary reduction of two seasons of the VLA 8.4-GHz monitoring data for B1600+434, including polarization. The first season corresponds to the unpublished data mentioned above, whilst the second season is the published data of Koopmans et al. [5].
2. Materials and Methods
The data (corresponding to VLA programs AH593, AX004 and AF340) were downloaded from the VLA archive. The observations were made in the VLA 8.4-GHz standard continuum band during two seasons of monitoring between October 1996 and October 1998. This gives a total timespan of ∼750 days with a gap in the middle of nearly 300 days when the VLA was in its C and D configurations.
The data were calibrated using NRAO’s Astronomical Image Processing System (AIPS) following standard procedures. For the first season, the flux scale was set using the standard flux calibrator 3C 286, but in the second season this was instead accomplished using the Compact Symmetric Object (CSO) 1634+627 (3C 343). CSOs are dominated by the emission from twin lobes and should therefore be stable flux-density calibrators [10].
The instrumental polarization (D-terms) of the first season’s data was calibrated using the unpolarized source OQ 208 and the polarization position angle (PPA) with 3C 286. No traditional polarization calibrators were observed during the second season, but many calibrators were observed of which one (1943+546, also a CSO) proved to be unpolarized and could be used to solve for the D-terms. In addition, 1634+627 is weakly polarized (∼10 mJy) and was used to calibrated the PPA. Although this is very weak compared to traditional PPA calibrators, it is significantly brighter than either image of B1600+434.
After calibration was complete, the Stokes I, Q and U flux densities of the two images of 1600+434 were measured using modelfitting to the data in Difmap [11] and the polarized flux density, percentage polarization and polarization position angle formed from these in the usual way. The uncertainties on the I, Q and U measurements were set to the rms noise in the residual maps at each epoch and these were then converted into the errors on the polarization quantities using standard error propagation theory. A systematic flux-calibration error of 0.5 per cent was assumed.
3. Results
The measurements of the total flux density, polarized flux density, percentage polarization and PPA are shown in Figure 2 where the time delay (40 days) previously measured from the total-intensity data only [9] has been removed. In addition, the flux densities of image B have been multiplied by a factor of 1.2 and a 2 offset subtracted from the PPA of image B.
3.1. Total Flux Density
A separate analysis of the total flux density during the second monitoring season was already presented by Koopmans et al. [5] and we find very similar results, including the greater variability in image A which is believed to be due to microlensing in the ISM of the lensing galaxy [8]. Our analysis shows that the same effect is present in the first season’s data which have never been published.
The linear decline in the total flux density during the second season meant that it was impossible for Koopmans et al. [5] to independently determine the time delay between the two images. However, an estimate of the flux ratio measured from the first season’s monitoring (communicated by the team responsible for acquiring those data) did allow a relatively crude delay to be measured. Actually, a feature at day 700 is visible in both images, but in general the slow timescale of the variability coupled with the extrinsic variations in image A make measuring a time delay very difficult.
3.2. Polarization Data
In contrast to the total flux density, all three polarization light curves show significant variability on relatively short timescales. This is seen most clearly during the first season where the polarized flux density and percentage polarization alternately decrease and increase on timescales of ∼1 month. Similar behaviour is also observed in PPA. The second monitoring season also shows significant correlated variations in A and B. Shifting the curves by the current best-estimate of the time delay 40 days; Reference [9] demonstrates that the variations in the two images line up very well. Extrinsic variability in image A is not readily visible, but this may be due to the much lower signal-to-noise ratio of the polarization data.
4. Discussion
We have shown that significant short-term polarization variability (by a factor of two) was present during the first two seasons of monitoring of B1600+434 with the VLA, despite the total flux density displaying little correlated variability. It has been possible to measure this despite the very low polarized flux density (∼1 mJy) and a complete absence of standard polarization calibrators. The good correspondence between the PPA variations seen in A and B strongly suggests that the calibrator (1634+627) is also stable in PPA, although we strongly recommend that future monitoring campaigns include more standard polarization calibrators.
The results presented here are preliminary and we have not yet performed a rigorous analysis to determine the best-fit time delay and associated uncertainty. More 1600+434 monitoring data exist in the VLA archive and we intend to add these to our analysis. It is also our intention to analyse VLA archival data on other lens systems without robust time delays to search for variations in the polarization properties of each image. Very preliminary analyses of JVAS B1422+231 [12] and JVAS B1030+074 [13] suggest that such variability is ubiquitous.
Acknowledgments
The National Radio Astronomy Observatory is a facility of the National Science Foundation operated under cooperative agreement by Associated Universities, Inc.
Author Contributions
Andrew Biggs performed the data analysis and wrote the manuscript. Ian Browne contributed to the scientific discussion.
Conflicts of Interest
The author declares no conflict of interest.
References
- Browne, I.W.A.; Wilkinson, P.N.; Jackson, N.J.F.; Myers, S.T.; Fassnacht, C.D.; Koopmans, L.V.E.; Marlow, D.R.; Norbury, M.; Rusin, D.; Sykes, C.M.; et al. The Cosmic Lens All-Sky Survey—II. Gravitational lens candidate selection and follow-up. Mon. Not. R. Astron. Soc. 2003, 341, 13–32. [Google Scholar] [CrossRef]
- Biggs, A.D.; Browne, I.W.A.; Helbig, P.; Koopmans, L.V.E.; Wilkinson, P.N.; Perley, R.A. Time delay for the gravitational lens system B0218+357. Mon. Not. R. Astron. Soc. 1999, 304, 349–358. [Google Scholar] [CrossRef]
- Cohen, A.S.; Hewitt, J.N.; Moore, C.B.; Haarsma, D.B. Further Investigation of the Time Delay, Magnification Ratios, and Variability in the Gravitational Lens 0218+357. Astrophys. J. 2000, 545, 578–590. [Google Scholar] [CrossRef]
- Fassnacht, C.D.; Xanthopoulos, E.; Koopmans, L.V.E.; Rusin, D. A Determination of H0 with the CLASS Gravitational Lens B1608+656. III. A Significant Improvement in the Precision of the Time Delay Measurements. Astrophys. J. 2002, 581, 823–835. [Google Scholar] [CrossRef]
- Koopmans, L.V.E.; de Bruyn, A.G.; Xanthopoulos, E.; Fassnacht, C.D. A time-delay determination from VLA light curves of the CLASS gravitational lens B1600+434. Astron. Astrophys. 2000, 356, 391–402. [Google Scholar]
- Koopmans, L.V.E.; de Bruyn, A.G.; Jackson, N. The edge-on spiral gravitational lens B1600+434. Mon. Not. R. Astron. Soc. 1998, 295, 534–548. [Google Scholar] [CrossRef]
- Burud, I.; Hjorth, J.; Jaunsen, A.O.; Andersen, M.I.; Korhonen, H.; Clasen, J.W.; Pelt, J.; Pijpers, F.P.; Magain, P.; Østensen, R. An Optical Time Delay Estimate for the Double Gravitational Lens System B1600+434. Astrophys. J. 2000, 544, 117–122. [Google Scholar] [CrossRef]
- Koopmans, L.V.E.; de Bruyn, A.G. Microlensing of multiply-imaged compact radio sources. Evidence for compact halo objects in the disk galaxy of B1600+434. Astron. Astrophys. 2000, 358, 793–811. [Google Scholar]
- Berciano Alba, A. Strong Gravitational Lensing in the Radio Domain. Ph.D. Thesis, University of Groningen, Groningen, The Netherlands, 2009. [Google Scholar]
- Fassnacht, C.D.; Taylor, G.B. Compact Symmetric Objects as Radio Flux Density Calibrators. Astron. J. 2001, 122, 1661–1668. [Google Scholar] [CrossRef]
- Shepherd, M.C. Difmap: An Interactive Program for Synthesis Imaging. In Astronomical Data Analysis Software and Systems VI; Hunt, G., Payne, H., Eds.; Astronomical Society of the Pacific Conference Series; Astronomical Society of the Pacific: San Francisco, CA, USA, 1997; Volume 125, p. 77. [Google Scholar]
- Patnaik, A.R.; Browne, I.W.A.; Walsh, D.; Chaffee, F.H.; Foltz, C.B. B1422 + 231—A new gravitationally lensed system at Z = 3.62. Mon. Not. R. Astron. Soc. 1992, 259, 1P–4P. [Google Scholar] [CrossRef]
- Xanthopoulos, E.; Browne, I.W.A.; King, L.J.; Koopmans, L.V.E.; Jackson, N.J.; Marlow, D.R.; Patnaik, A.R.; Porcas, R.W.; Wilkinson, P.N. The new gravitational lens system B1030+074. Mon. Not. R. Astron. Soc. 1998, 300, 649–655. [Google Scholar] [CrossRef]
Figure 1.
I-Band Nordic Optical Telescope image of B1600+434 showing the two lensed images A and B, the main lensing (edge-on spiral) galaxy (G1) and a secondary lensing galaxy G2 [6]. Both galaxies are at .
Figure 1.
I-Band Nordic Optical Telescope image of B1600+434 showing the two lensed images A and B, the main lensing (edge-on spiral) galaxy (G1) and a secondary lensing galaxy G2 [6]. Both galaxies are at .
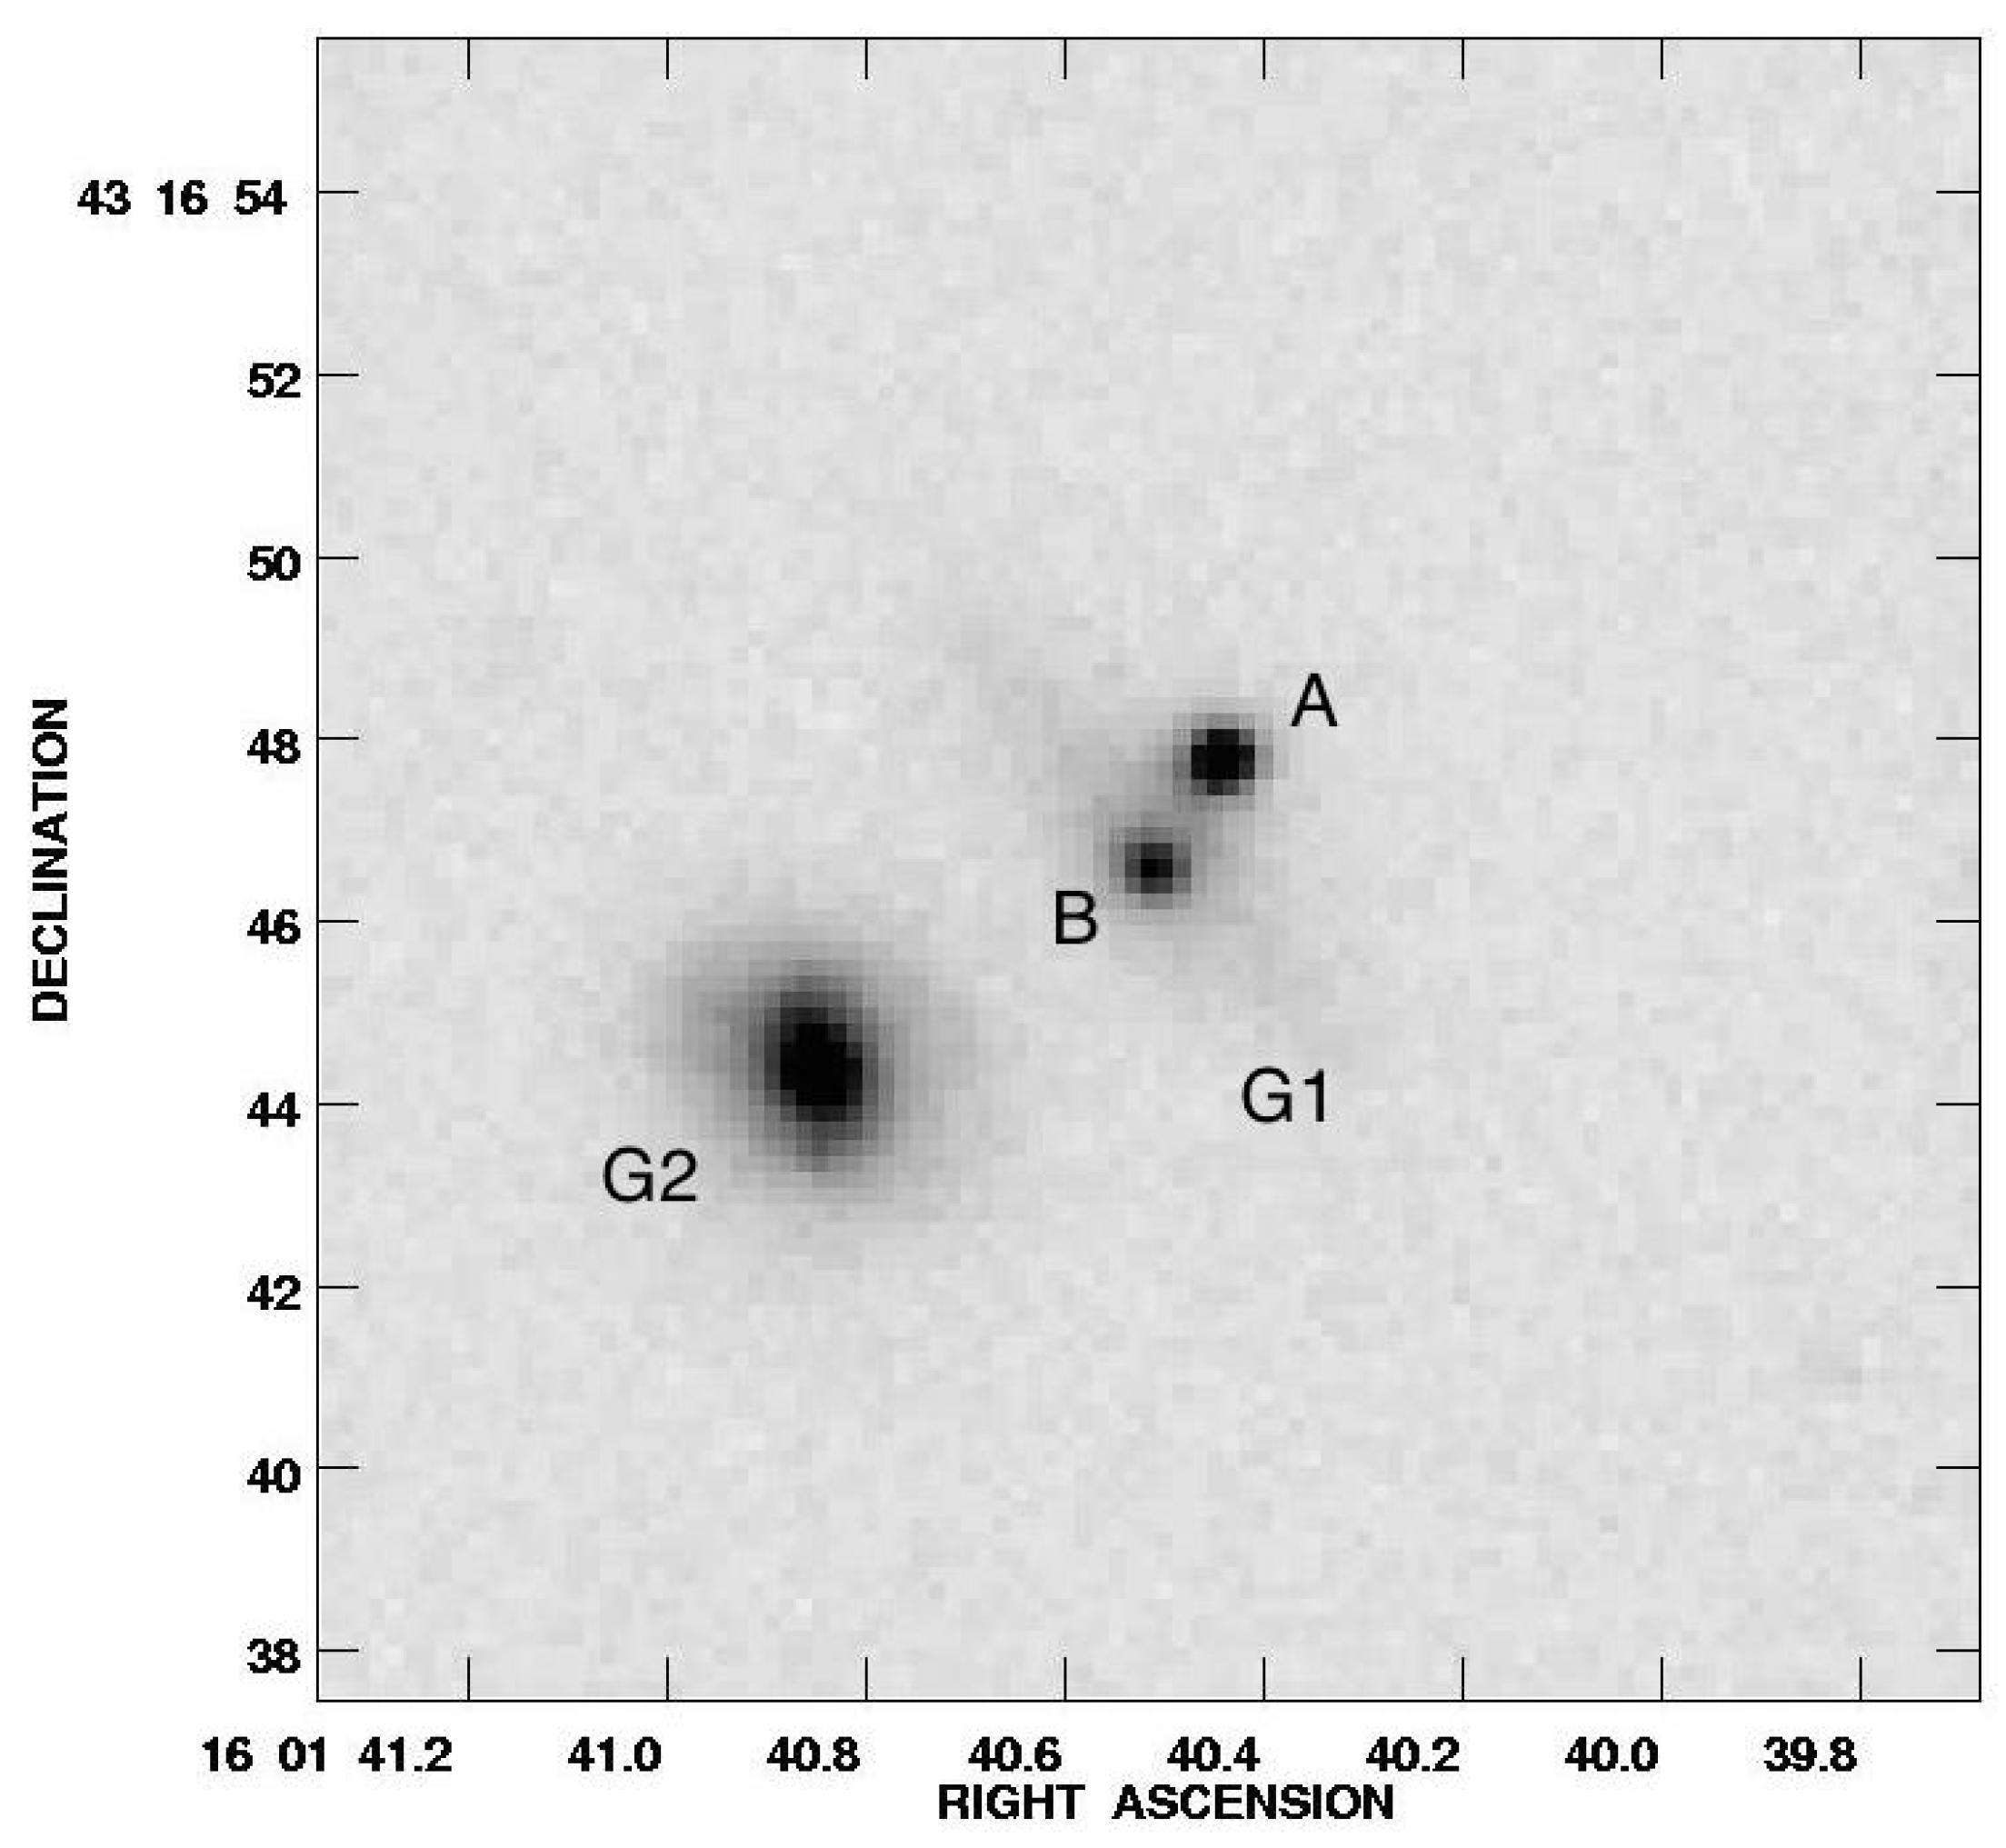
Figure 2.
Light curves of images A (purple) and B (green) of B1600+434. (a) Total flux density. (b) Polarized flux density. (c) Percentage polarization. (d) Polarization position angle. Image A has been moved forward by 40 days [9] to compensate for the time delay.
Figure 2.
Light curves of images A (purple) and B (green) of B1600+434. (a) Total flux density. (b) Polarized flux density. (c) Percentage polarization. (d) Polarization position angle. Image A has been moved forward by 40 days [9] to compensate for the time delay.

© 2017 by the authors. Licensee MDPI, Basel, Switzerland. This article is an open access article distributed under the terms and conditions of the Creative Commons Attribution (CC BY) license (http://creativecommons.org/licenses/by/4.0/).
Share and Cite
MDPI and ACS Style
Biggs, A.; Browne, I. Gravitational Lens Time Delays Using Polarization Monitoring. Galaxies 2017, 5, 76. https://doi.org/10.3390/galaxies5040076
AMA Style
Biggs A, Browne I. Gravitational Lens Time Delays Using Polarization Monitoring. Galaxies. 2017; 5(4):76. https://doi.org/10.3390/galaxies5040076
Chicago/Turabian StyleBiggs, Andrew, and Ian Browne. 2017. "Gravitational Lens Time Delays Using Polarization Monitoring" Galaxies 5, no. 4: 76. https://doi.org/10.3390/galaxies5040076
Note that from the first issue of 2016, this journal uses article numbers instead of page numbers. See further details here.