1. Introduction
Blazar S5 0716+71 is one of the most interesting blazars because its duty cycle for micro-variations is on the order of 80–90% [
1]. Thus it is an obvious choice to observe with a large telescope. The intent of the observation was to observe micro-variations with not only unprecedented time resolution (on the order of seconds), but also to monitor the polarimetric and multi-frequency variability at the same time. The motivation for the observation is to test the KRM turbulent jet model under development at Florida International University (cf. [
1,
2]). Micro-variability is defined as small-amplitude (∼0.1 mag), short-duration (<1 day) oscillations, which the model describes as being caused by a shock propagating down a turbulent jet. The KRM model is a two-zone, shock-in-jet model inspired by the work of Kirk, Reiger and Mastichiadis [
3]. In the model, the shock front accelerates upstream electrons which cool downstream by emitting synchrotron radiation. Micro-variability is explained by breaking the jet into turbulent cells with randomly directed magnetic fields, so that when a shock encounters a turbulent cell, the flux is increased. These temporary increases, during the encounter with the cell, are referred to as pulses or flares. The duration of a pulse is indicative of the size of the turbulent cell, and the amplitude is related to the density and magnetic field properties of the cell.
Several predictions of the model can be tested with multi-wavelength and polarimetric micro-variability observations. Solutions to the particle kinetic equations with synchrotron cooling allows us to predict the shape of a pulse emitted at a particular frequency as the result of the shock interacting with a turbulent cell. The pulse shapes are predicted to be different for different frequencies, inducing variability in the spectral index, and this provides a method to test the model if we can adequately observe micro-variations at widely separated frequency bands. As the model also predicts the direction of the magnetic field would be randomly oriented within cells, the strength of the synchrotron emission and the degree of polarization would be variable as well, and predictions on these variations would allow for further testing of the model.
The observations presented in this paper were planned for February, 2017, when 0716+71 would be placed optimally in the sky for long time series observations. The Florida International University (FIU) telescope was used to monitor brightness levels and the SARA JKT and SARA Kitt Peak telescopes were used to monitor the level of micro-variability activity before using time on the GTC 10.4-m. Unfortunately, all through January and February, the object went through a faint minimum, and attempts to detect micro-variability oscillations were fruitless. While the simultaneous CIRCE/JKT observation was postponed indefinitely, 0716+71 started to brighten in April, and the simultaneous observations were then scheduled.
2. Observations
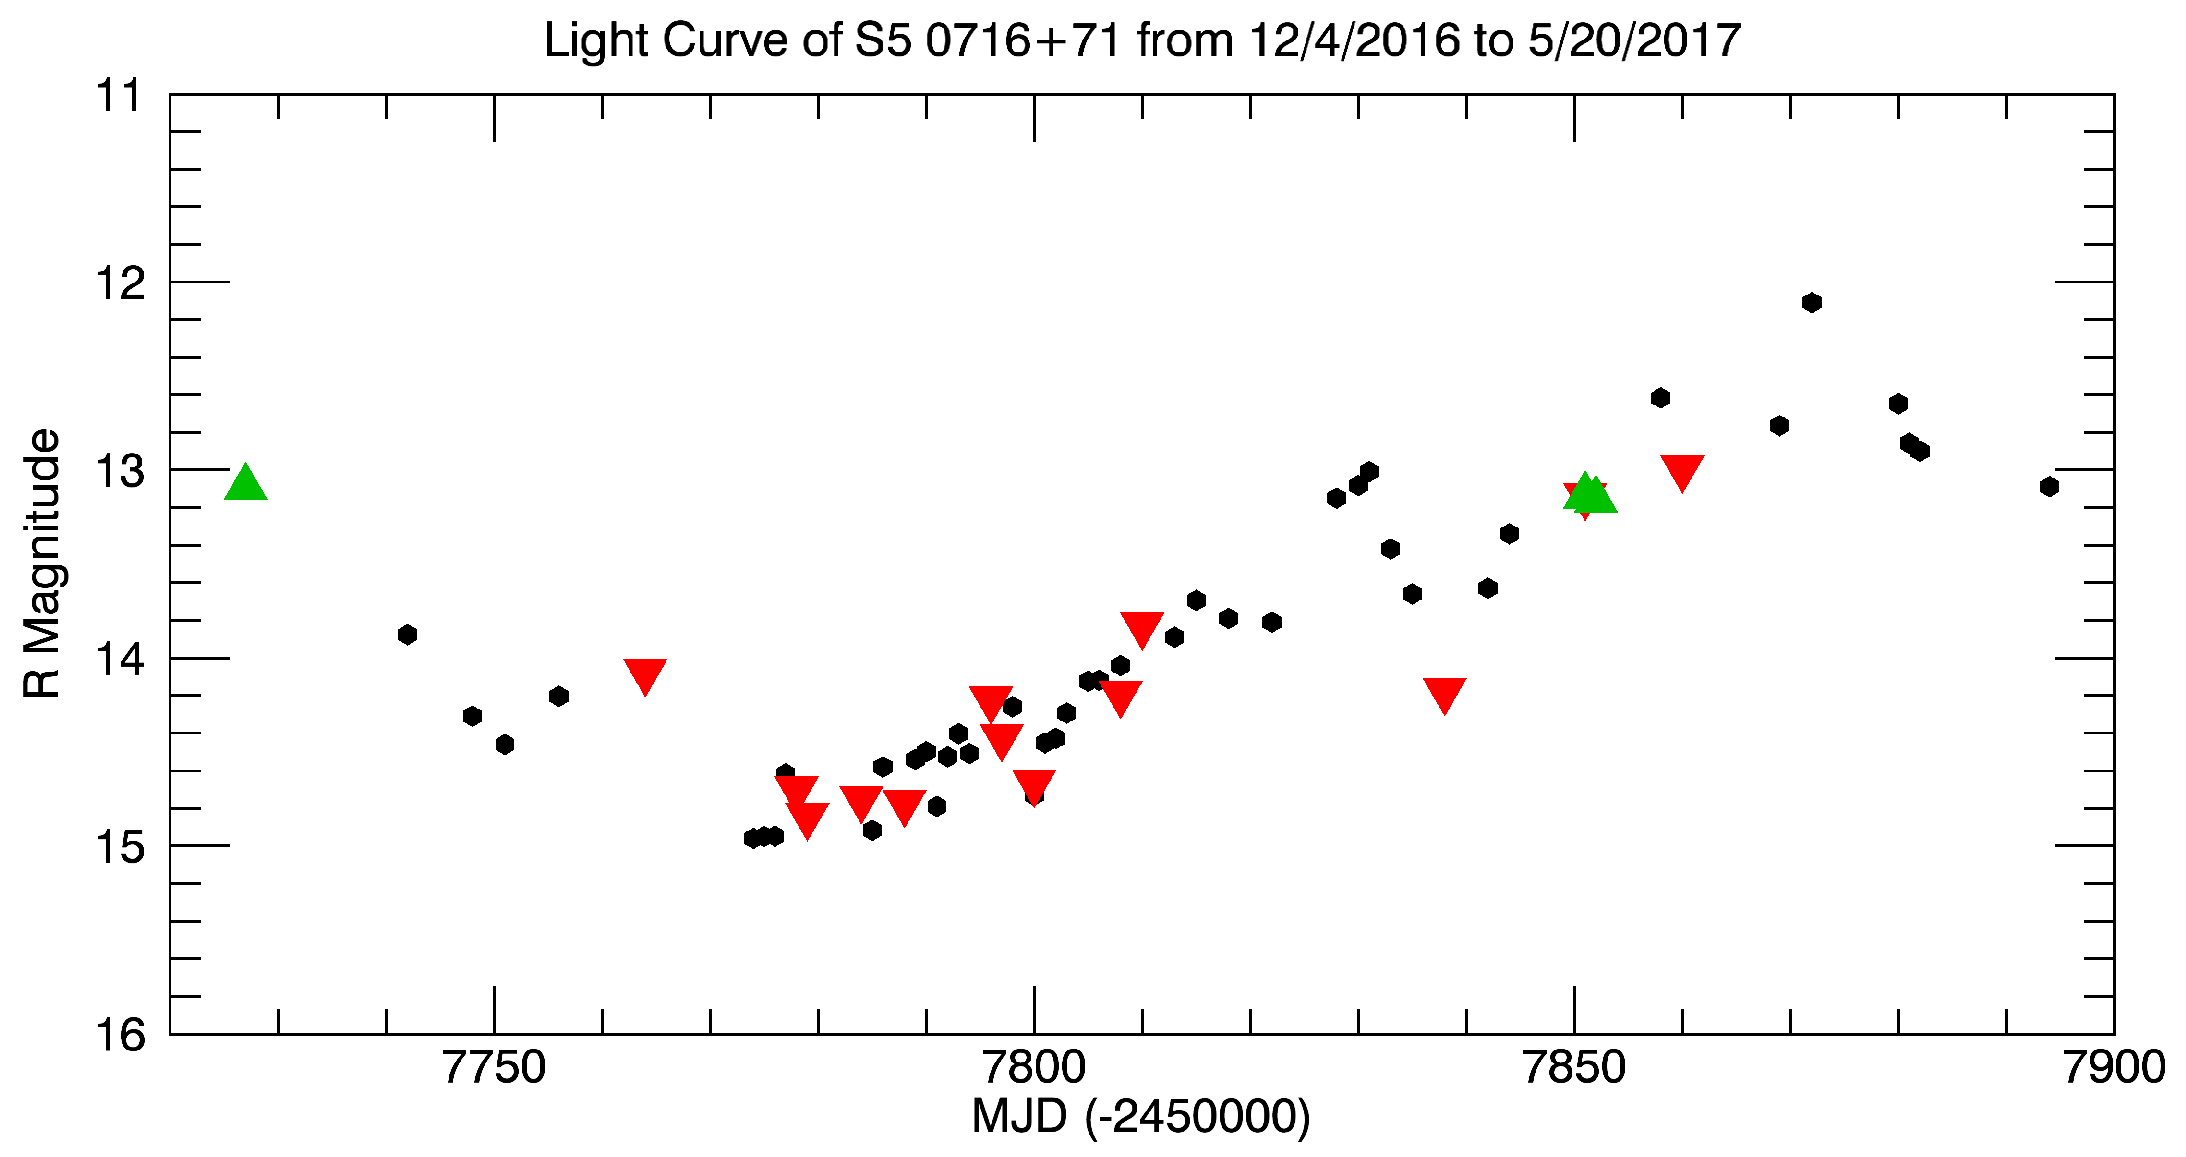
We observed S5 0716+71 as often as possible from 4 December 2016 (MJD 7727, with MJD = JD − 2,450,000) through 20 May 2017 (MJD 7894) using the FIU
and the two SARA telescopes at Kitt Peak and La Palma. The light curve presented in
Figure 1 shows the brightness of the source decreasing from around R = 13.0 reaching a minimum of R = 14.96 on 20 January 2017 (MJD 7774). The black dots represent monitoring observations with red triangles indicating a failed attempt to find micro-variability; green triangles indicate when micro-variability was detected. We define microvariability as the presence of pulses or variations with the linear trend removed. The nights shown where microvariability was seen were marginal detections and theerefore unsuitable for KRM fitting which needs distinct pulses for application.
Table 1 lists the micro-variability observations. Column 1 gives the calendar date while column 2 gives the MJD. Column 3 lists the observatory where the data was collected (“FIU” refers to Florida International University’s
telescope equipped with an FLI MAXCAM CCD and Johnson UBVRI filters. “SARA KP” refers to the SARA 0.9-m telescope at Kitt Peak National Observatory. “SARA JKT” refers to the 1.0-m Jacobus Kapteyn Telescope at Roque de los Muchachos Observatory on La Palma, Canary Islands). Column 4 gives the number of CCD images in the micro-variability observation and column 5 lists the results of the statistical test for micro-variability (known as the Howell test [
4]). The V, R, and I average magnitudes and errors are shown in the final three columns of
Table 1. The
symbol indicates a very weak detection of variability while the * denotes micro-variability pulses were visible in the light curve.
The low brightness levels during January and February of 2017 represented a “plateau” similar to those seen in 2003 and 2006, only at a much fainter base brightness level [
5,
6]. The earlier short-duration plateaus lasted only several hours, while the plateau we observed here lasted for several months. During this low period, fifteen micro-variability observations were made: nine showed statistical variability while six exhibited no signs of variability. Of the nine nights, only two nights showed actual micro-variability pulses in the light curves.
2.1. The SARA JKT Observation
A confluence of good weather and accessibility of both the GTC 10.4-m and SARA JKT telescopes occurred on the night of 16 April 2017. Since S5 0716+71 was only well positioned for the first half of the night, the total observing duration was only 3.61 h. Although the Moon was at 71%, it was more than
away in declination, and thus did not significantly affect our measurements. We took 320 total images with the SARA JKT telescope, 94 in the R-band sequencing between the V, R, and I filters. Each individual image was exposed for 30 s. The resulting time resolution, per frequency band, was about ∼2.5 min after readout time and changing filters.
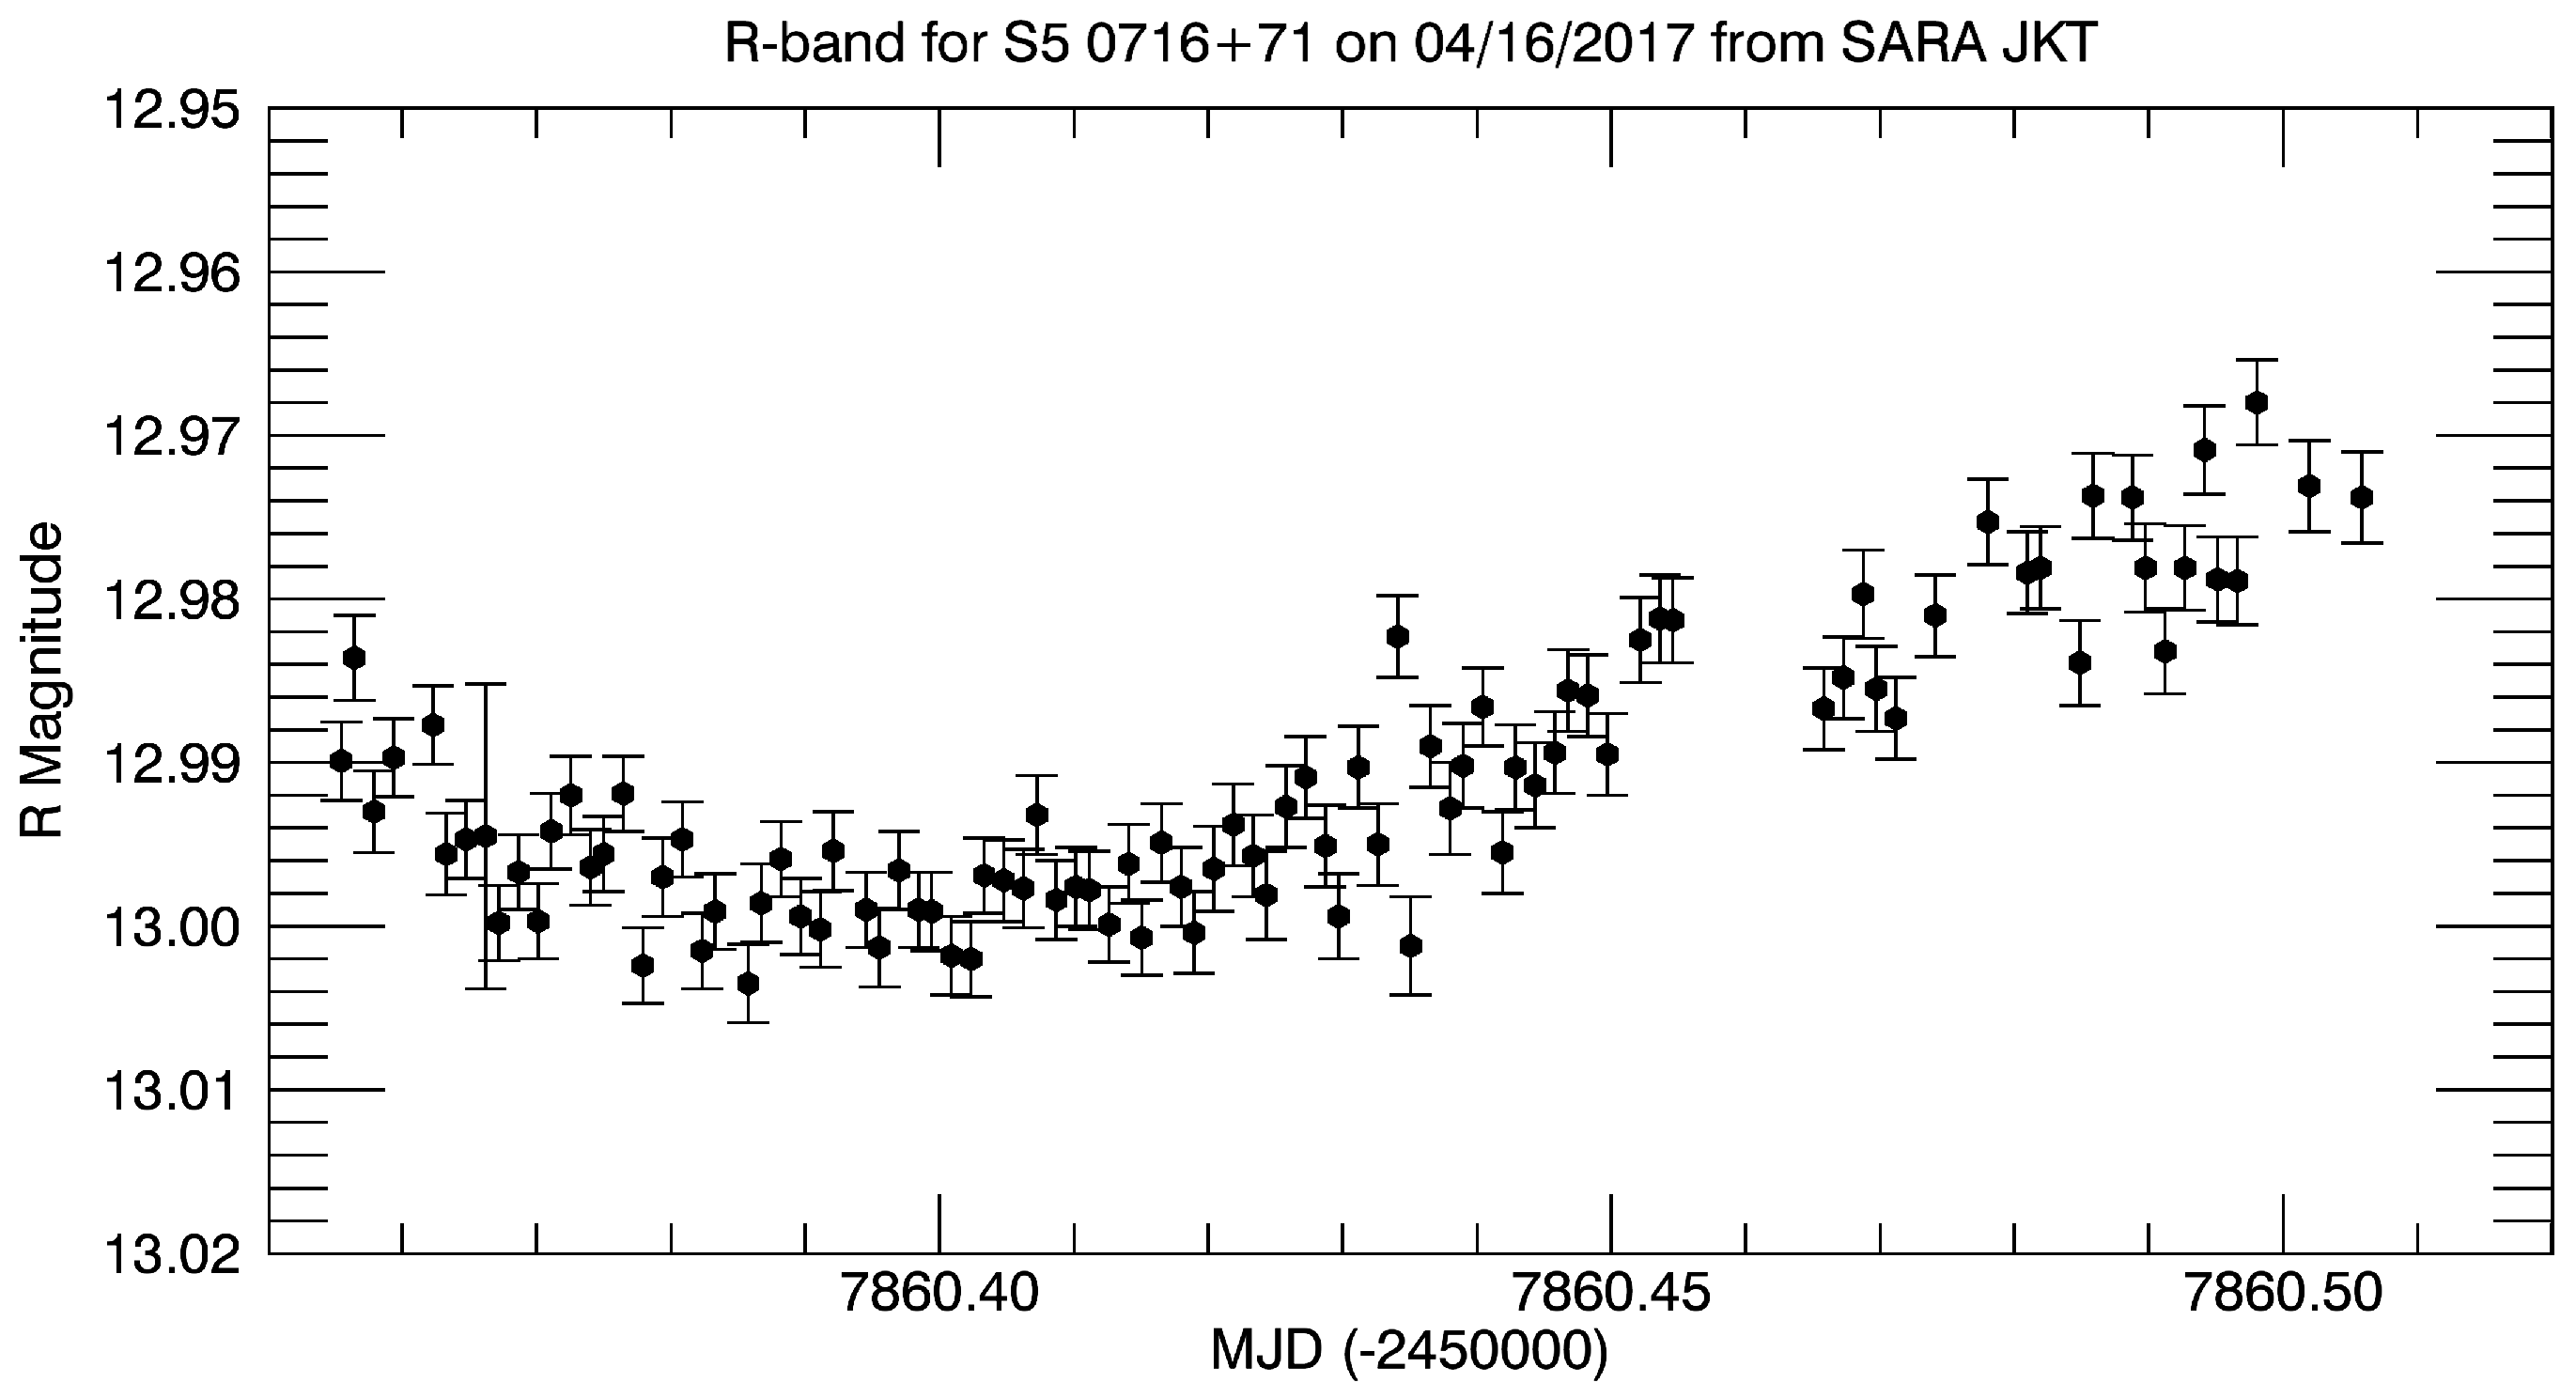
Figure 2 shows the SARA JKT micro-variability light curve in the R-band. The photometry was calibrated with the Heidelberg comparison sequence using stars 3, 4, 5, and 6. Star 8 was used as a check star. The initial Howell test returned a positive result for micro-variability with an F-test for variability value of 3.285 (the critical value being 1.4), which indicates a 95% probability of variability, as is attested to visually in
Figure 2. When the linear trend (
, with an
of 0.58) was removed, the Howell test returned a negative result for micro-variability. Thus, we did not observe the micro-variability pulses that we were hoping for to test the model. While no pulses were seen, the light curve shows similar variations in all three frequency bands.
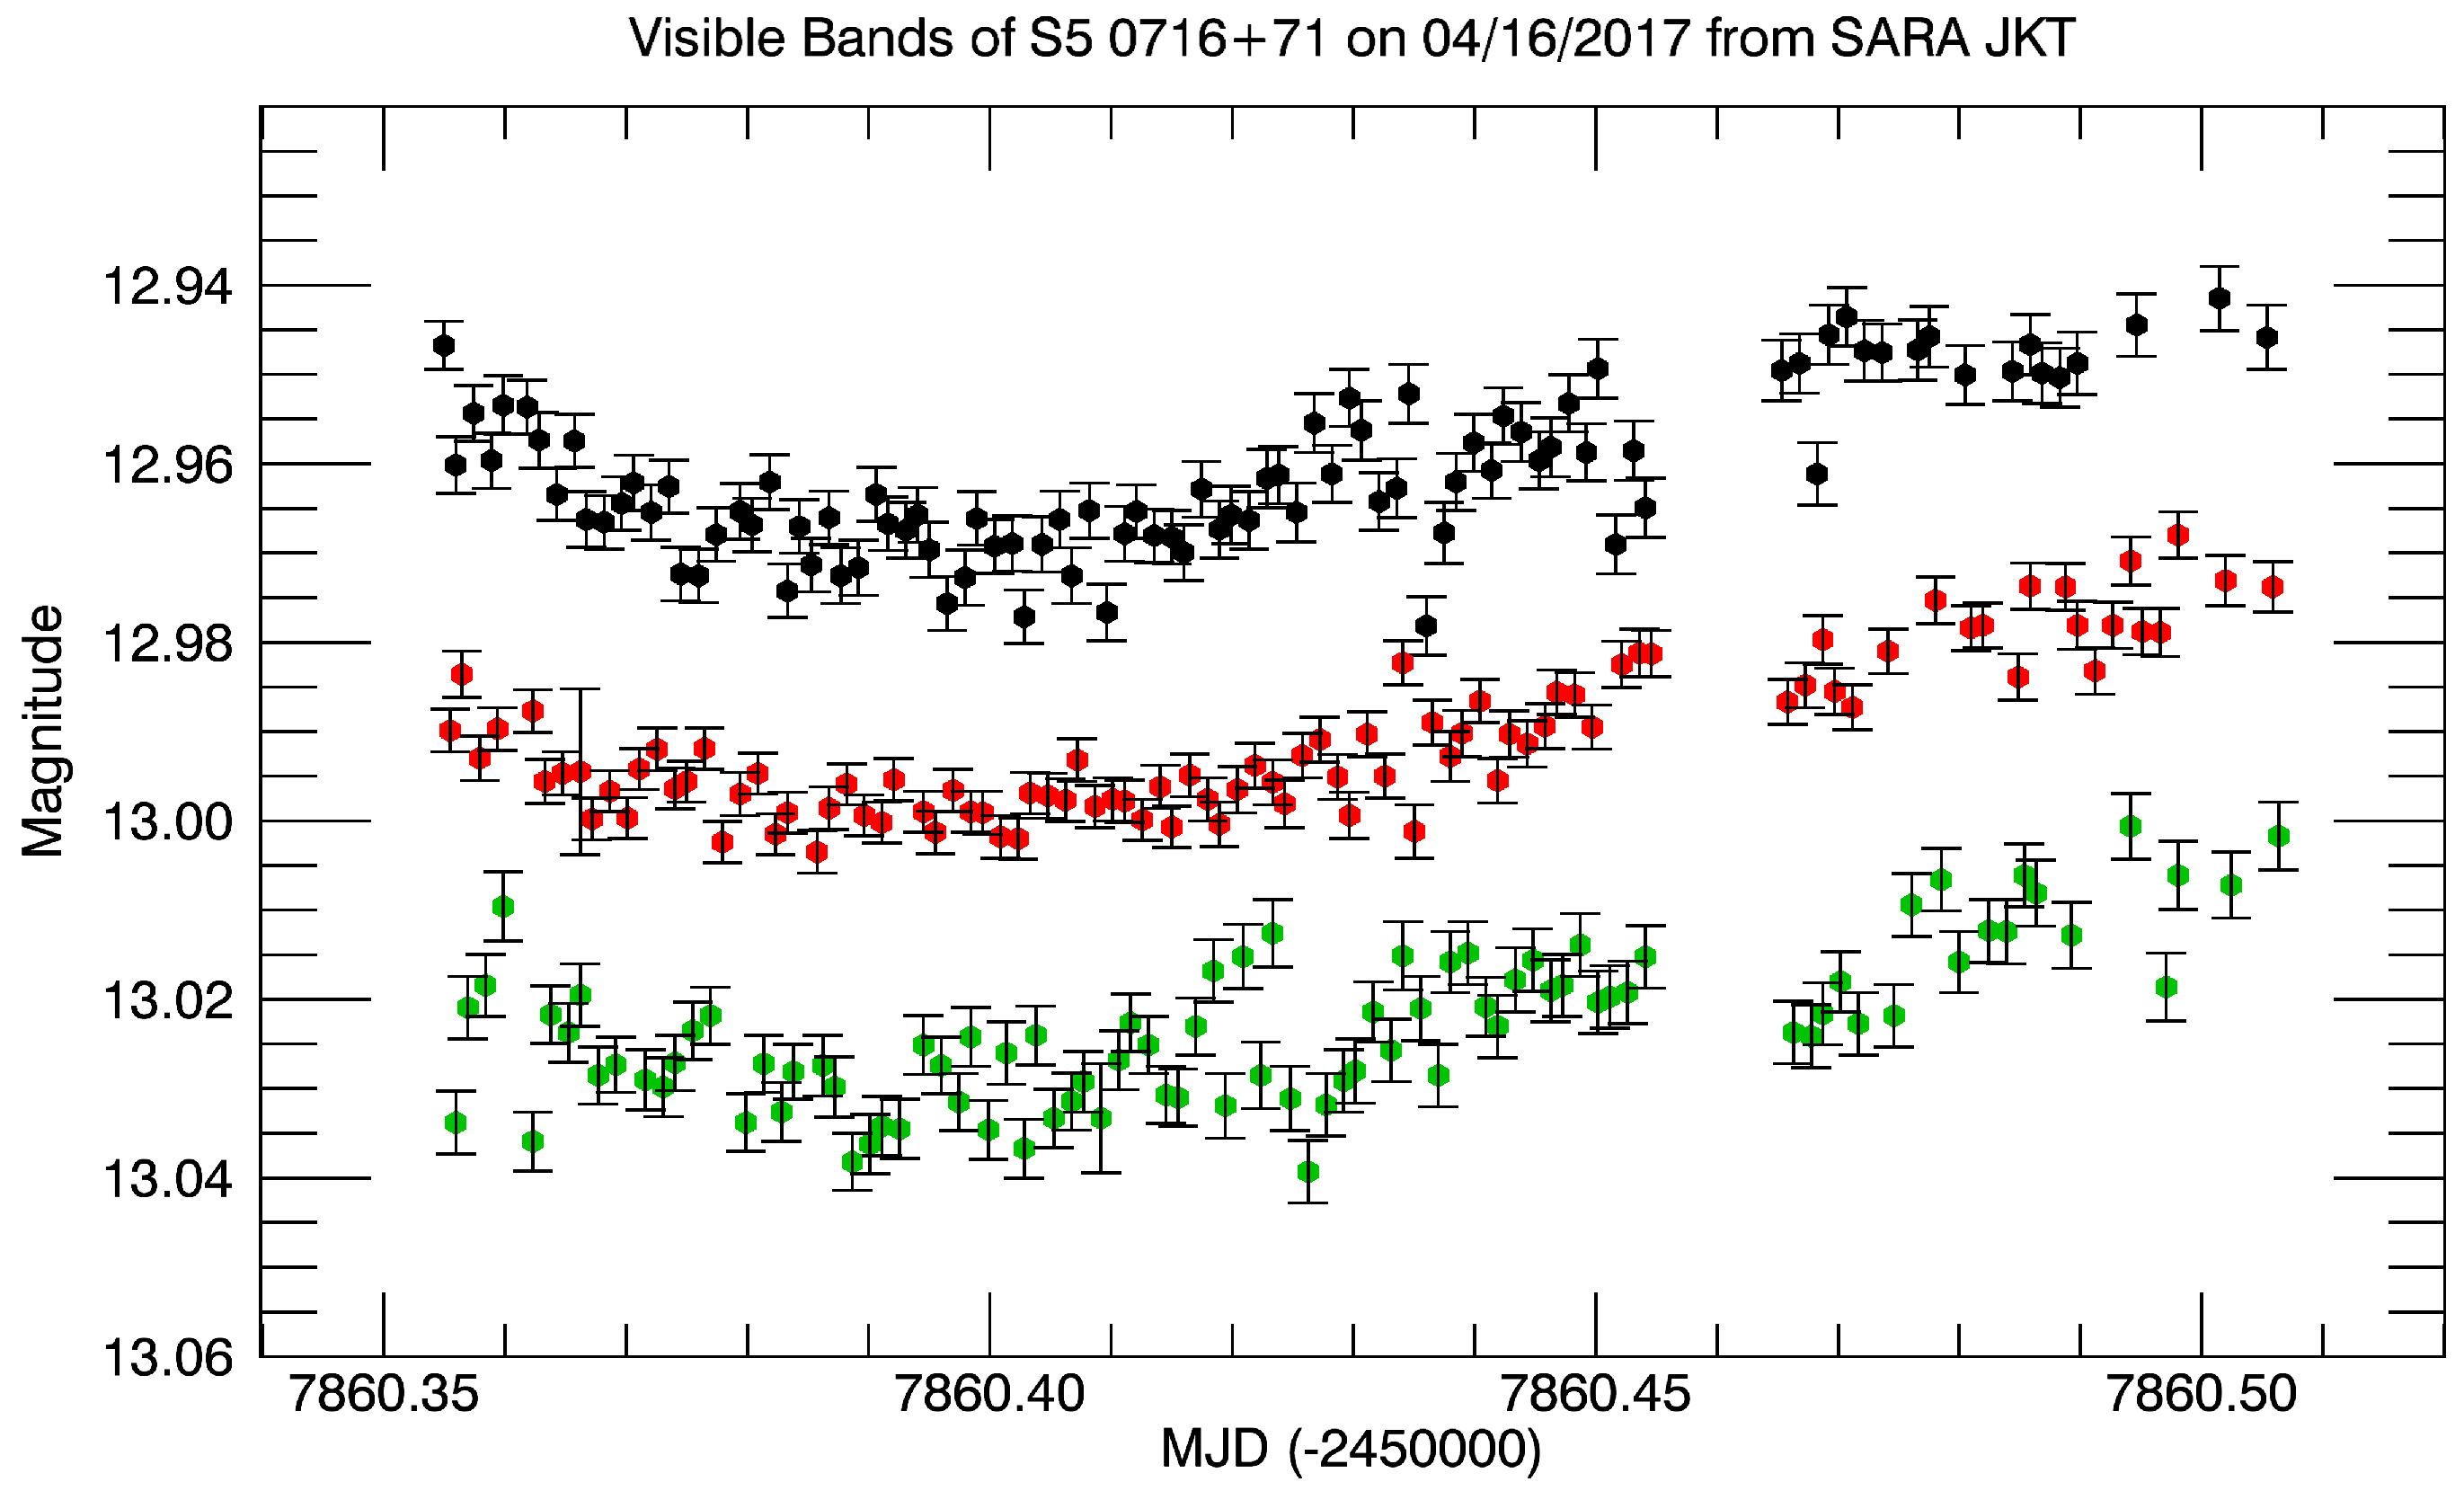
The resulting VRI light curves are plotted in
Figure 3, with the V magnitudes offset by −0.571 and the I magnitudes offset by +0.04882. The V and I data were much noisier that the R data. All photometry data presented in
Figure 2 and
Figure 3 are differential and calibrated using the sequences found at the Heidleberg Blazar monitoring site.
2.2. CIRCE Observations
The University of Florida’s near-infrared astronomical imager, polarimeter, and spectrograph, CIRCE, was built for the GTC 10.4-m telescope [
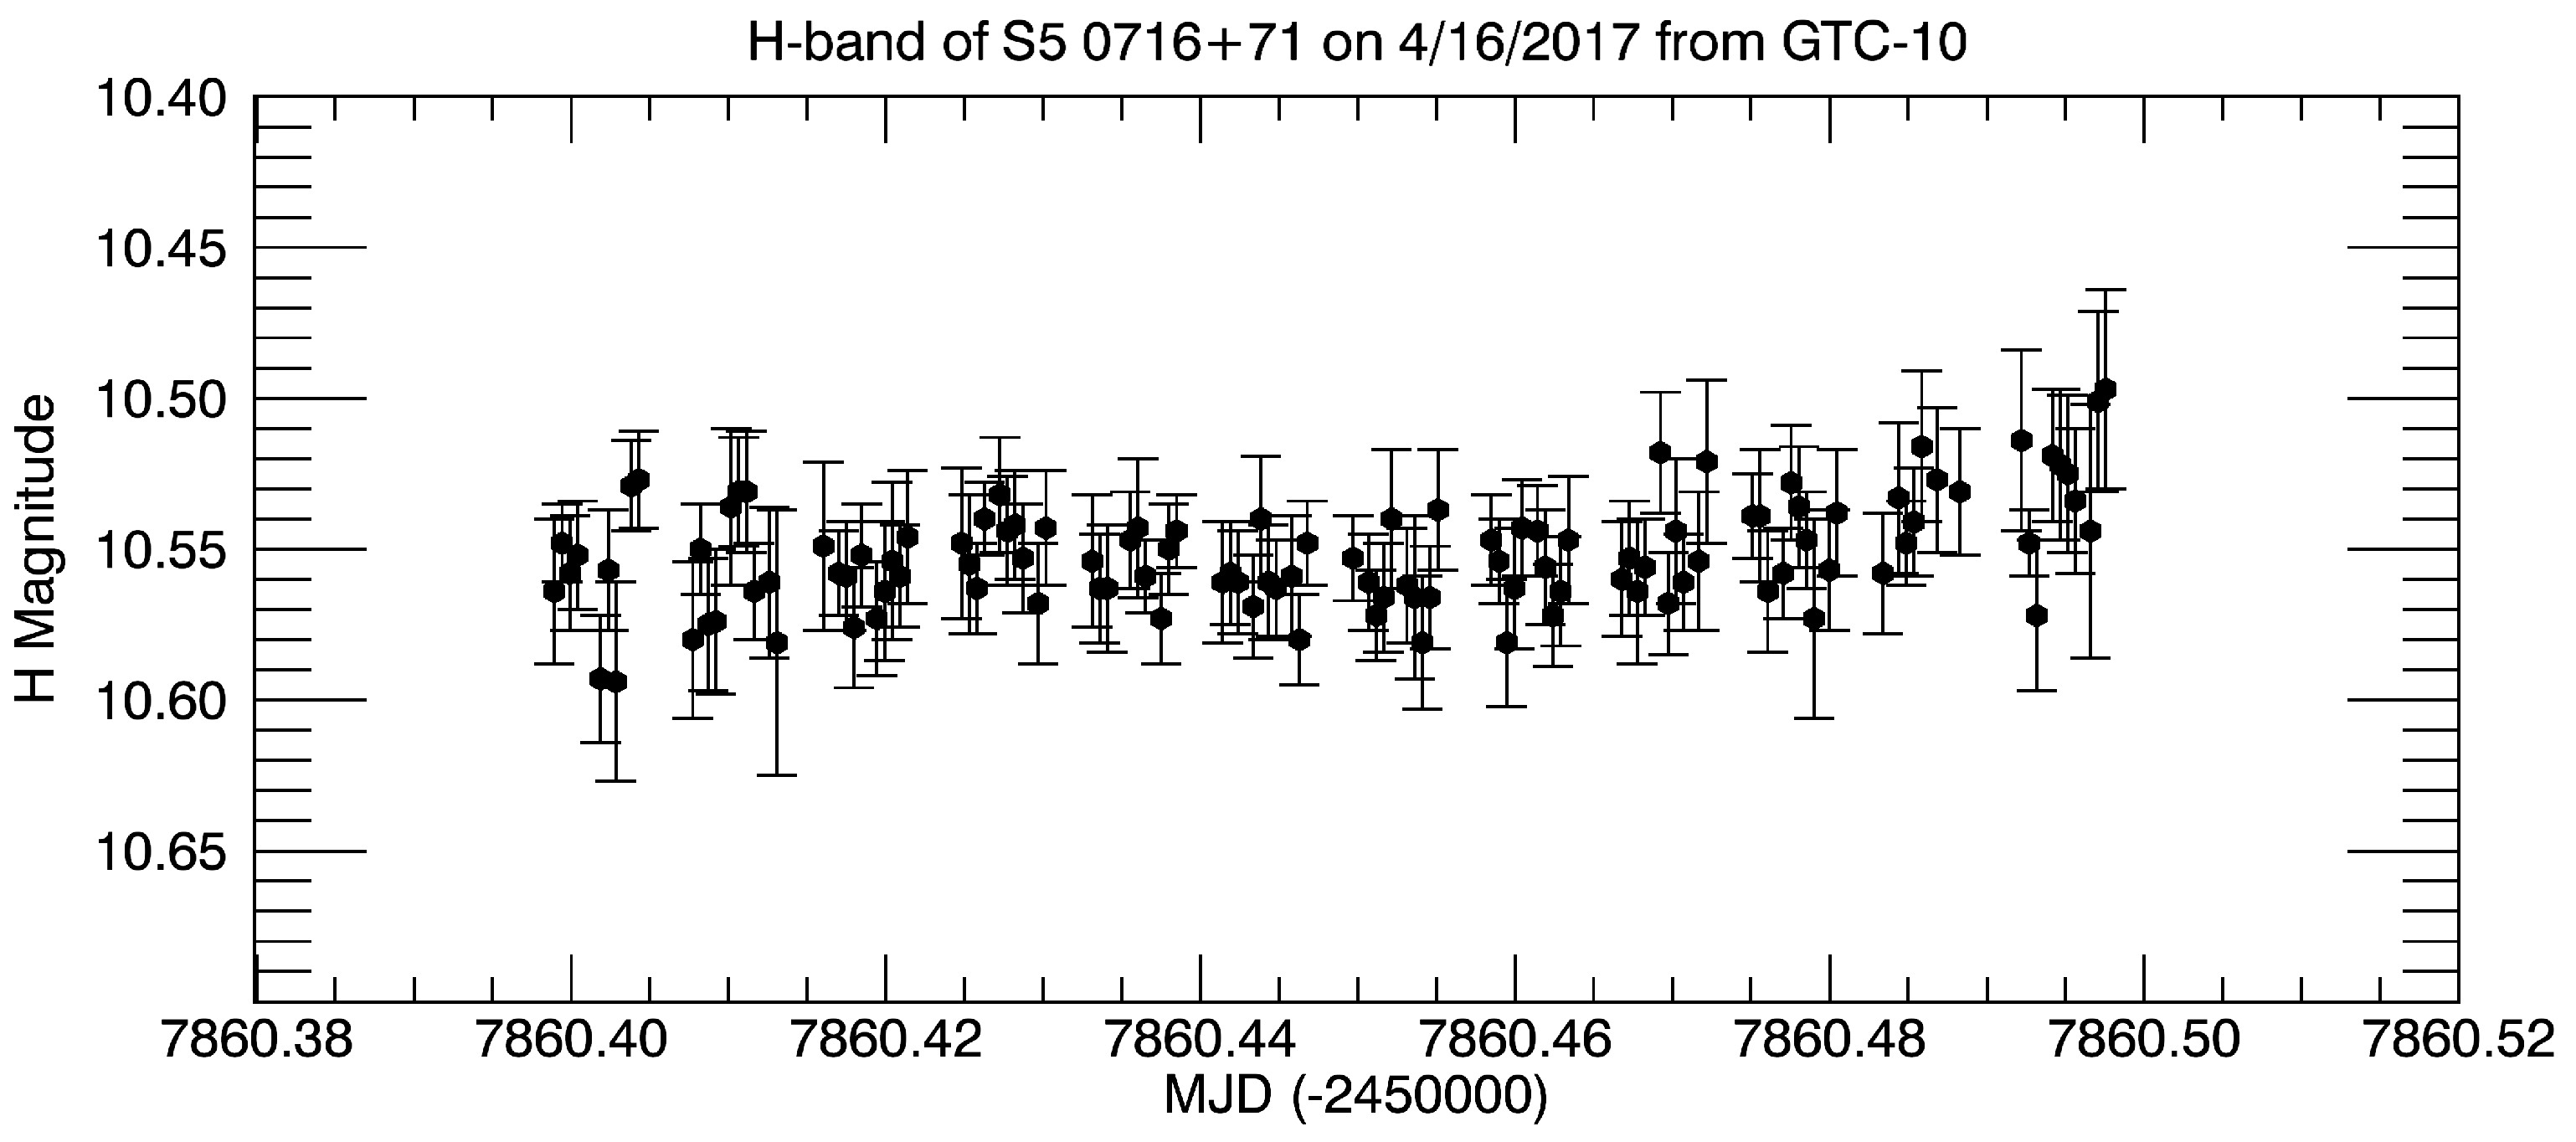
7]. CIRCE is a dual Wollaston Prism polarimeter which returns the linear Stokes parameters in a single image. The H magnitudes were calibrated with star 5 from the Heidelberg sequence. The H-band observations were taken at ∼1 s time resolution and binned to about 45 s time resolution. The total observing duration was 2.365 h.
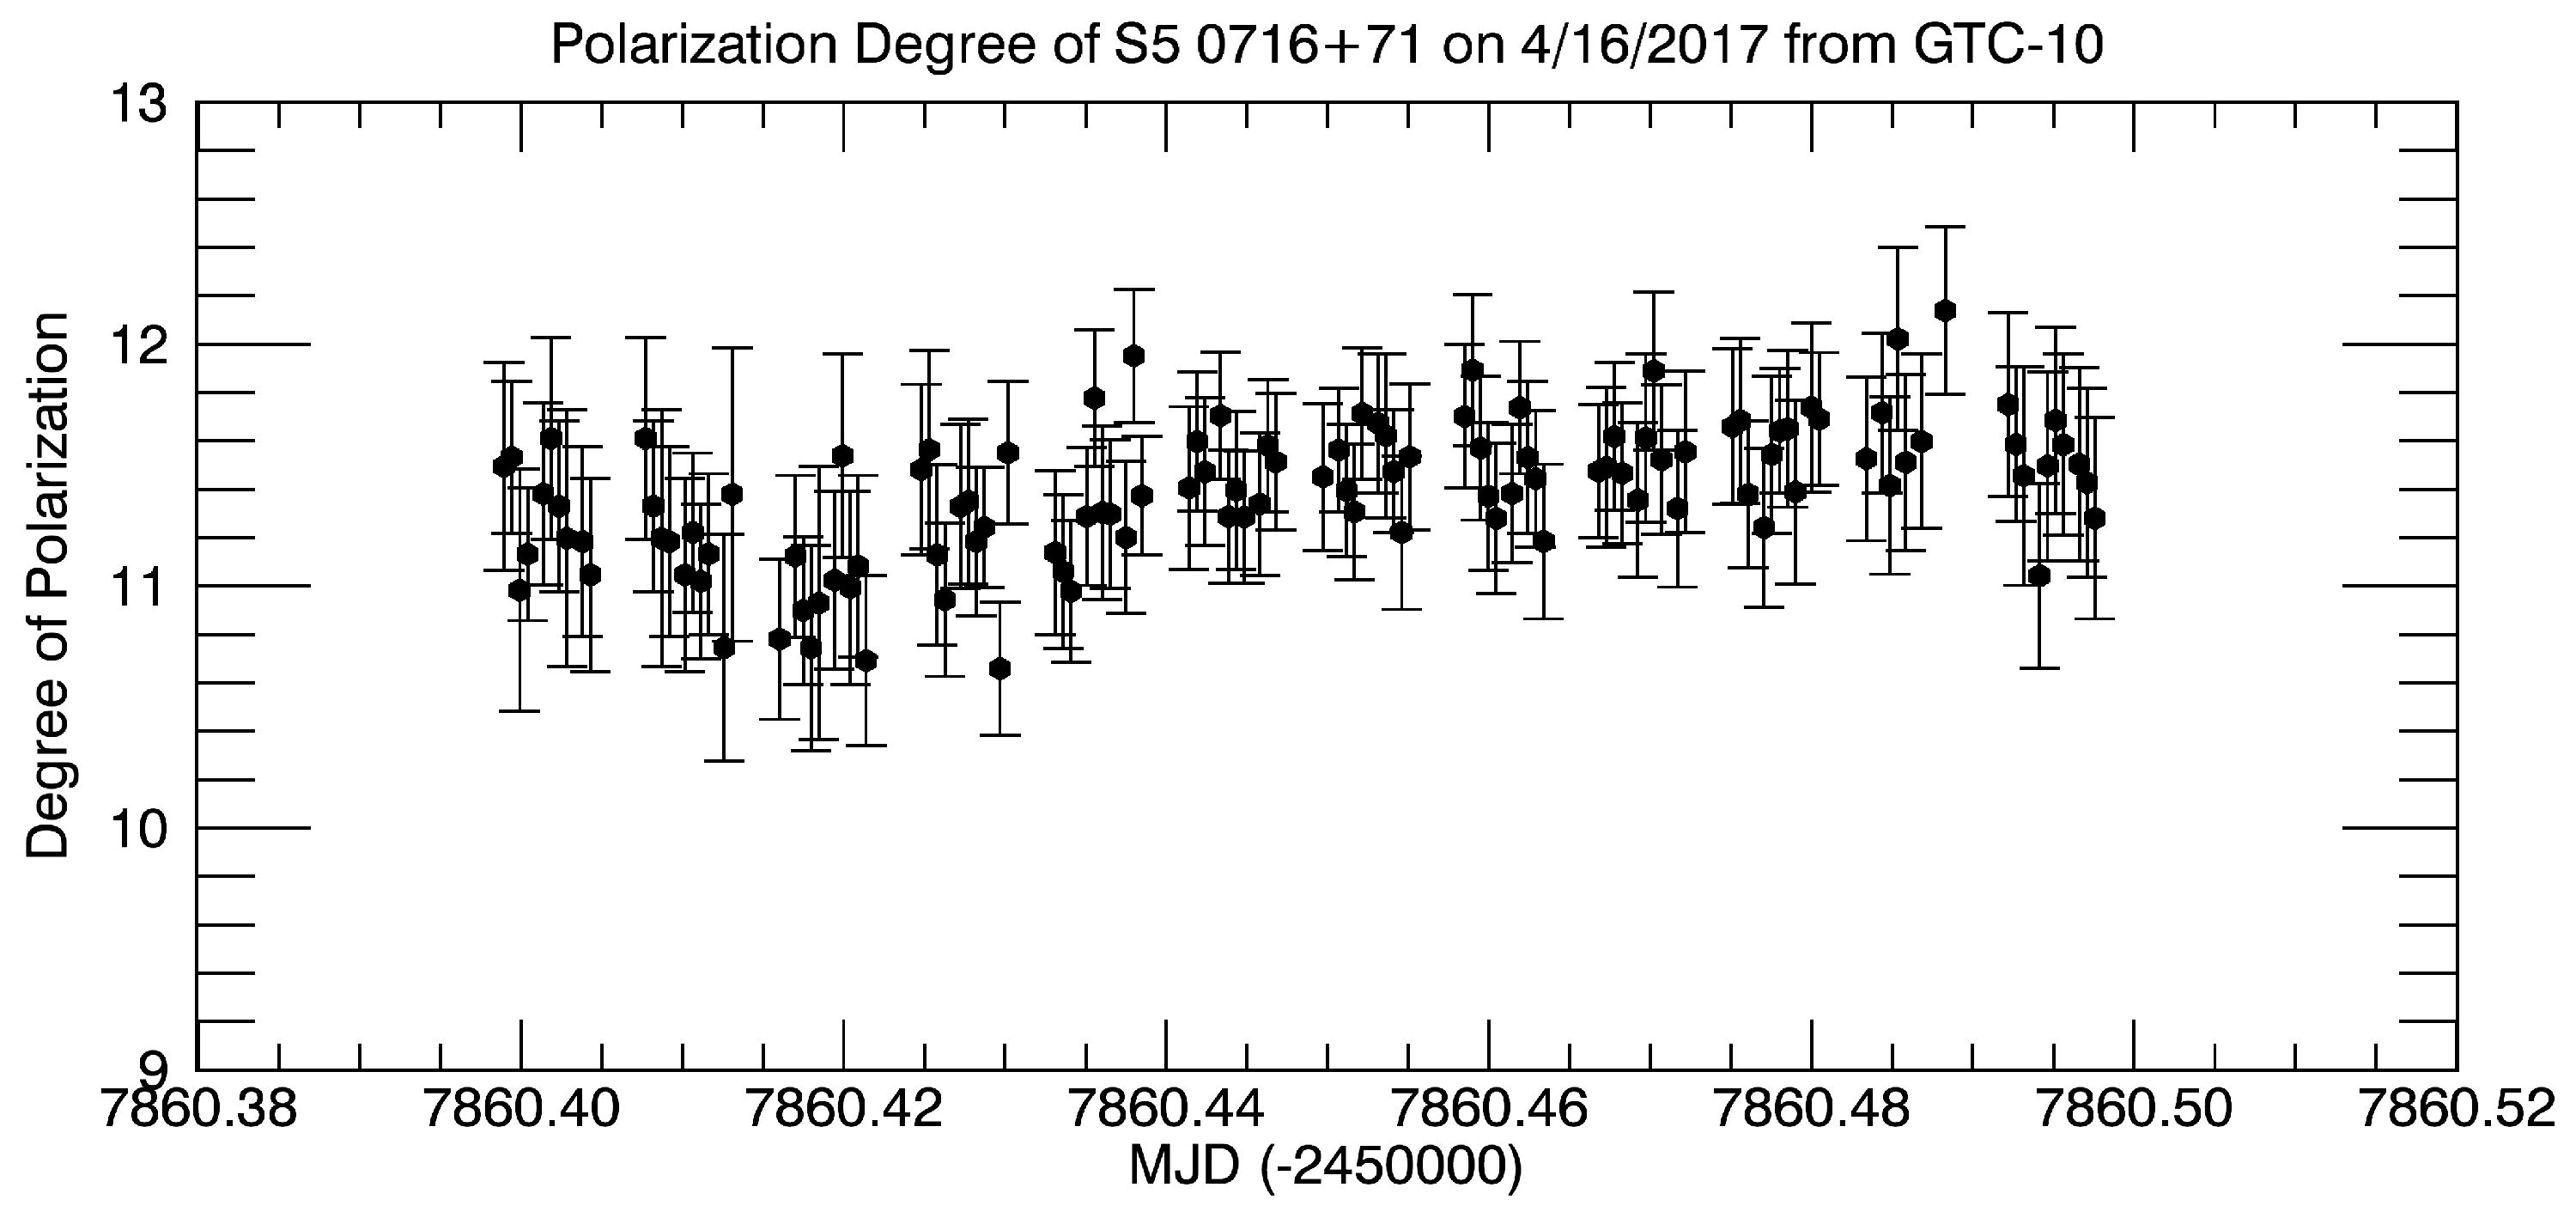
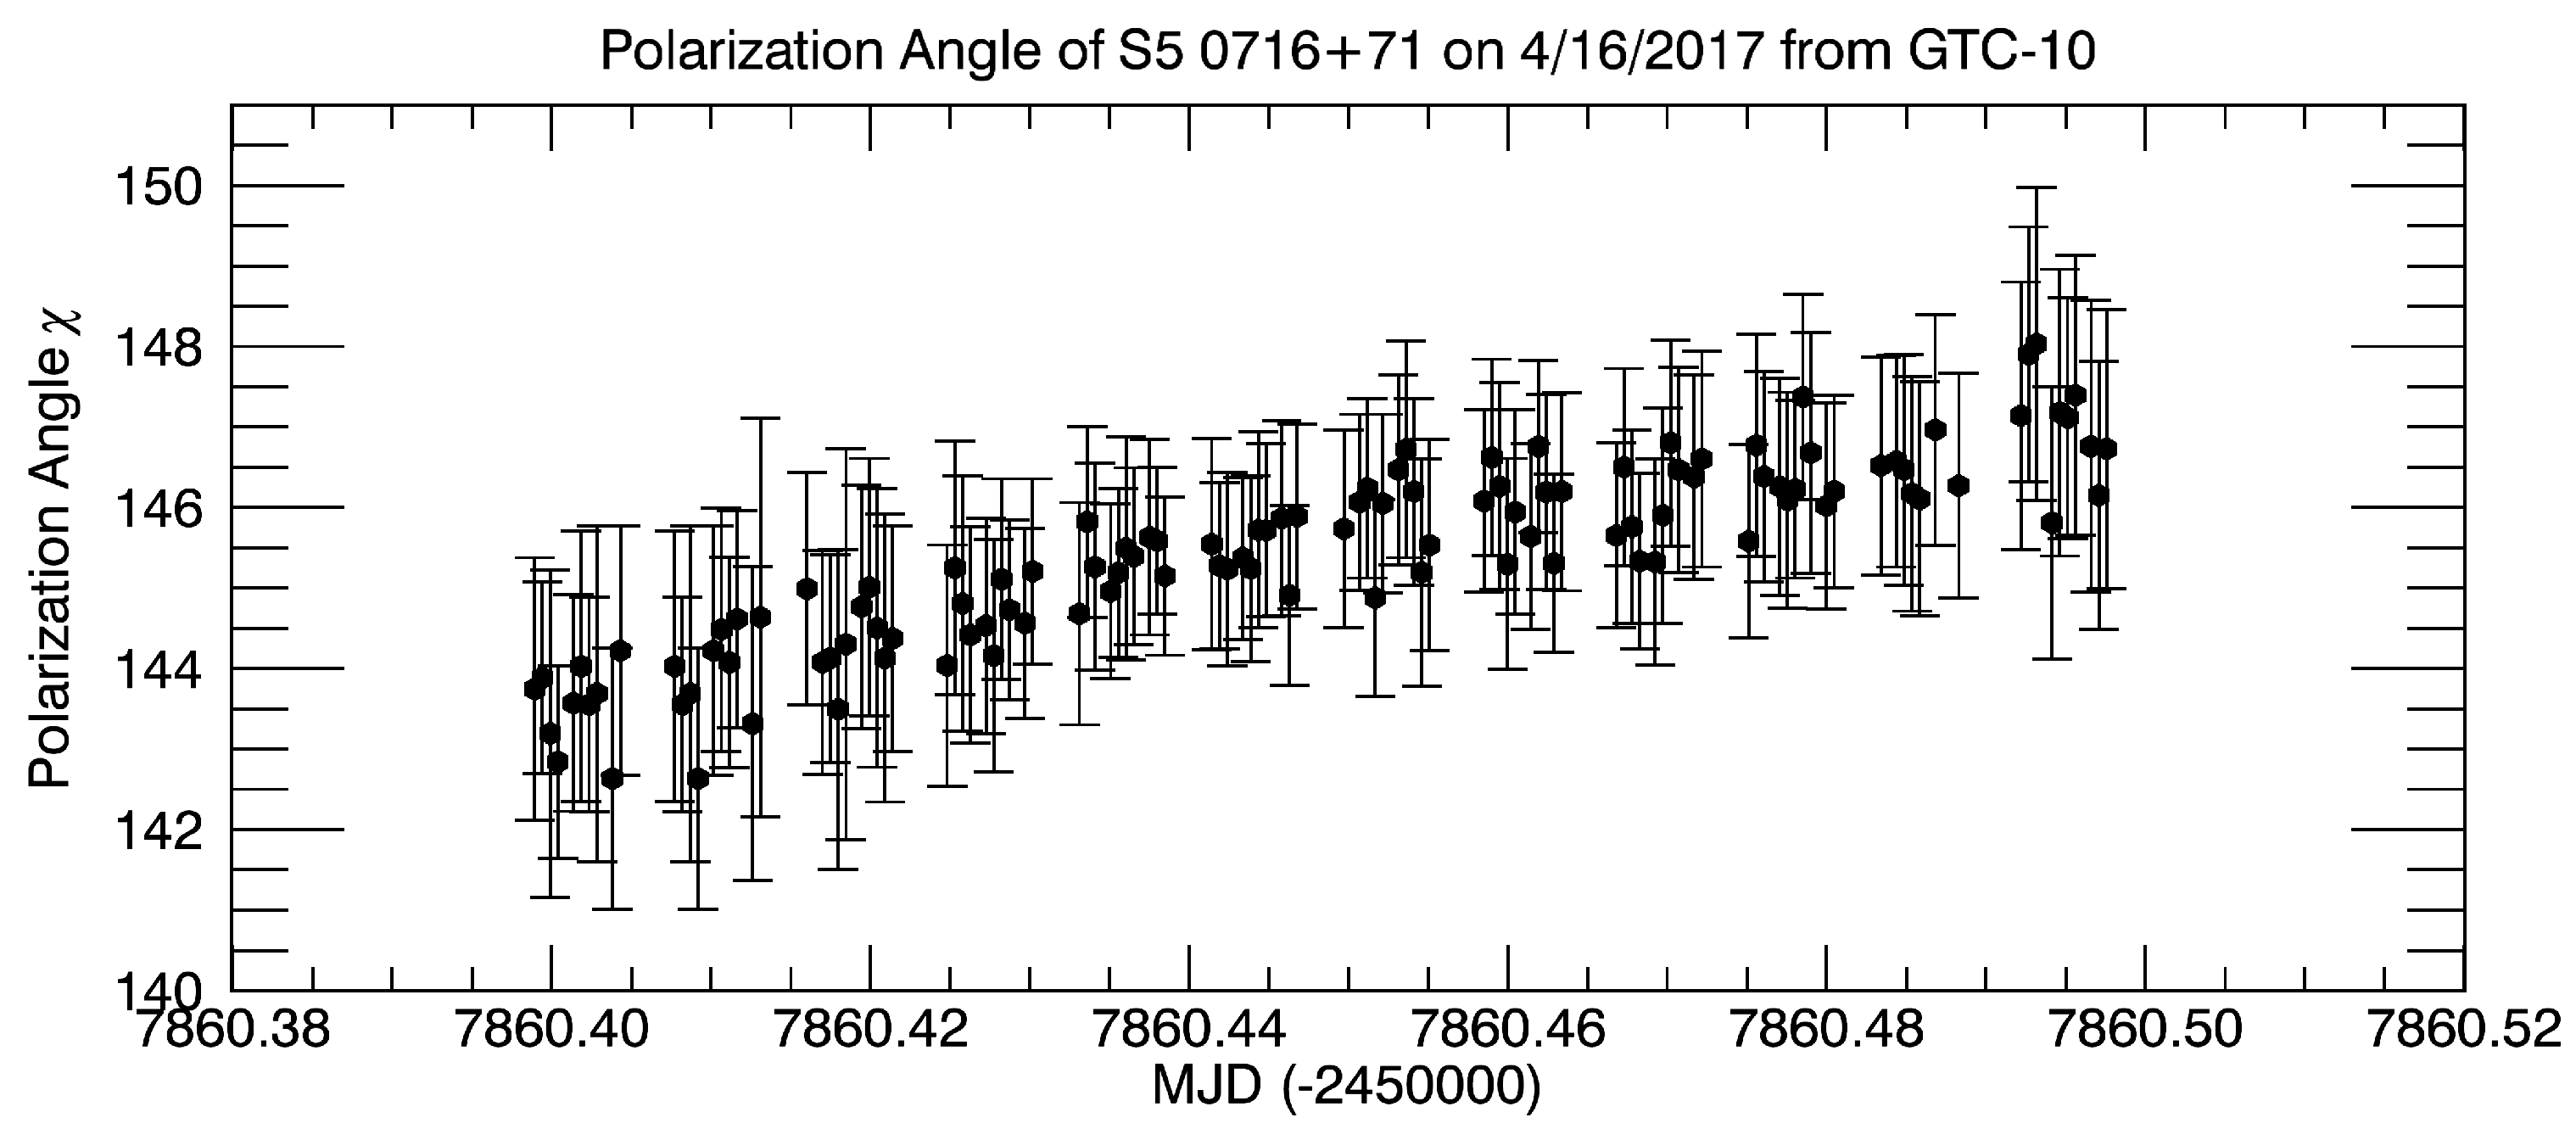
Figure 4 shows the binned H-band magnitude light curve. Due to the beam splitting in CIRCE, the photometric errors bars are larger than the SARA errors which did direct imaging. Both the polarization degree and the position angle were obtained with a frequency of about 1 per second. The binned polarization degree and polarization angle light curves are shown in
Figure 5 and
Figure 6.
2.3. Combined Observations
We have combined the CIRCE H-band and the SARA JKT VRI observations to evaluate the variability in 0716+71 for widely separated frequency bands along the optically thin portion of the synchrotron spectrum.
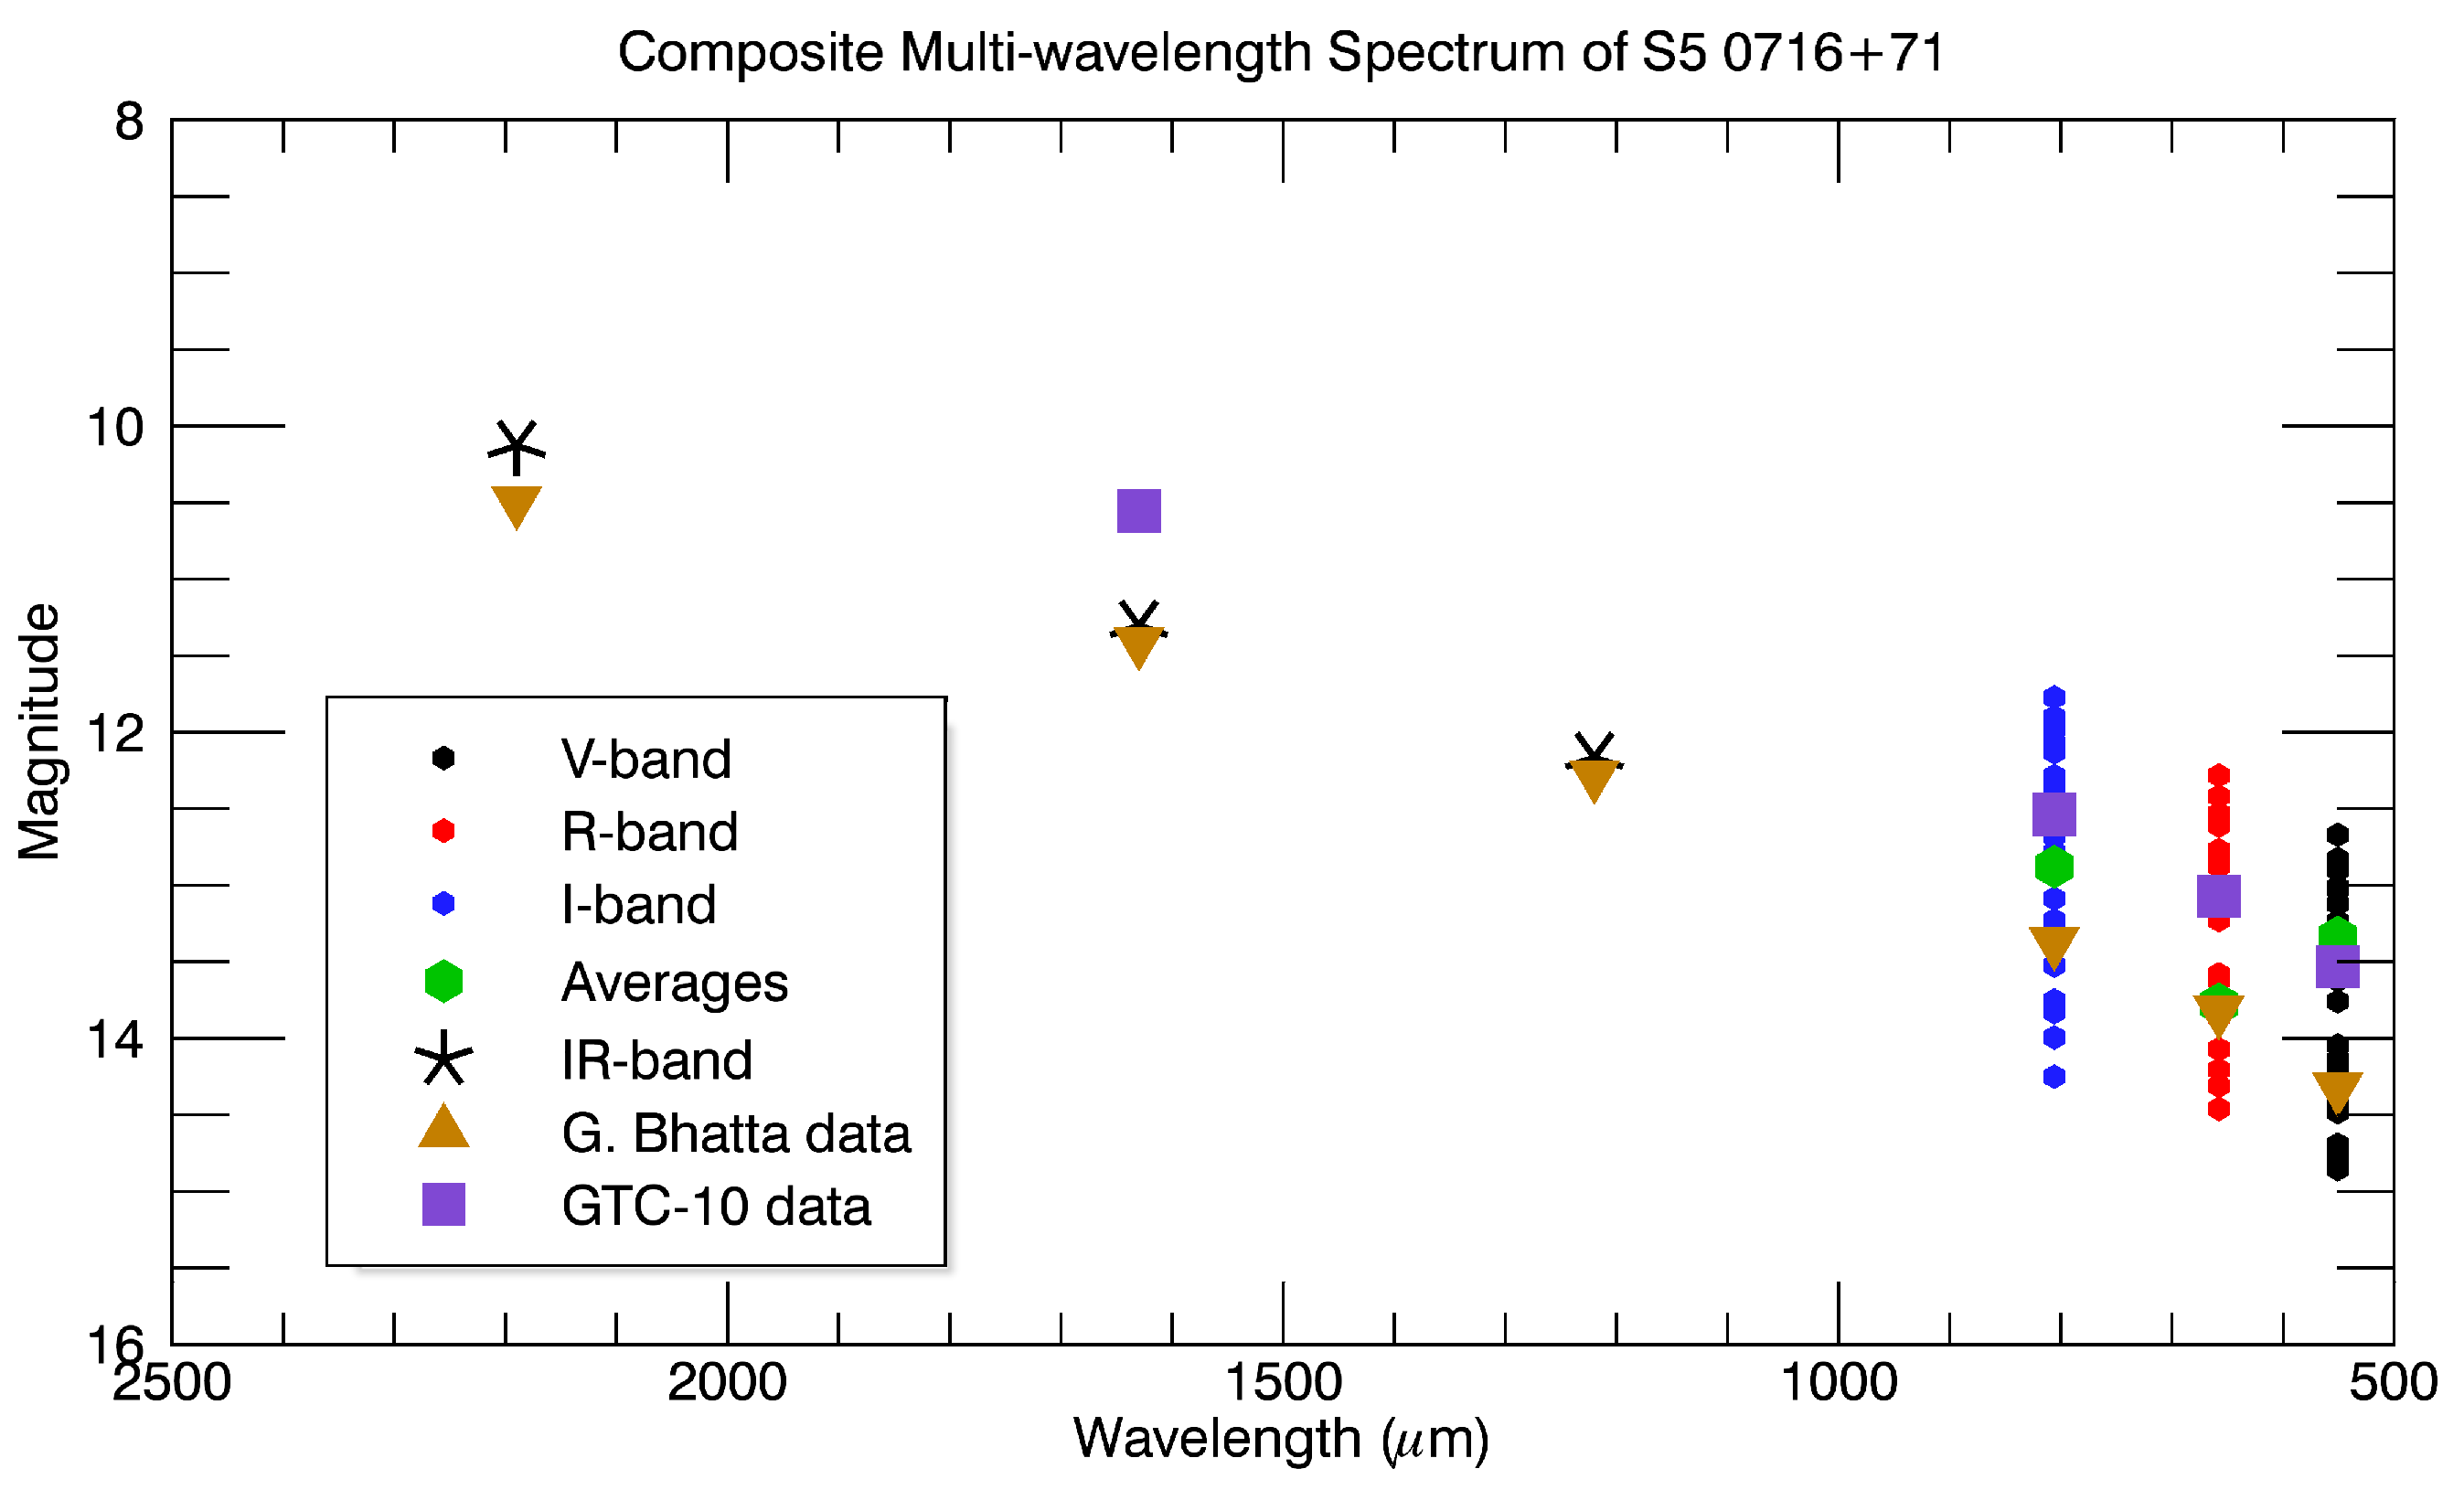
Figure 7 shows the extension of the optical flux extrapolated into the IR from previous studies.
The vertical clusters of V, R, and I points show the entire range of variability we have observed in those frequency bands over the last 11 years, the green dots giving the average value for each band during this time. The resulting slope is −0.0021 with a >98% correlation coefficient. Bhatta et al. [
6] found a similar slope of −0.0023 in the simultaneous WEBT data. Our best fit simultaneous VRIH data yields a slope of −0.0027. If one looks more closely at the 16 April 2017 data, the VRI linear fit has a significantly different slope
(
) and, if extended, predicts a much brighter H magnitude (∼9.3) than was actually observed (H = 10.55 (0.02)).
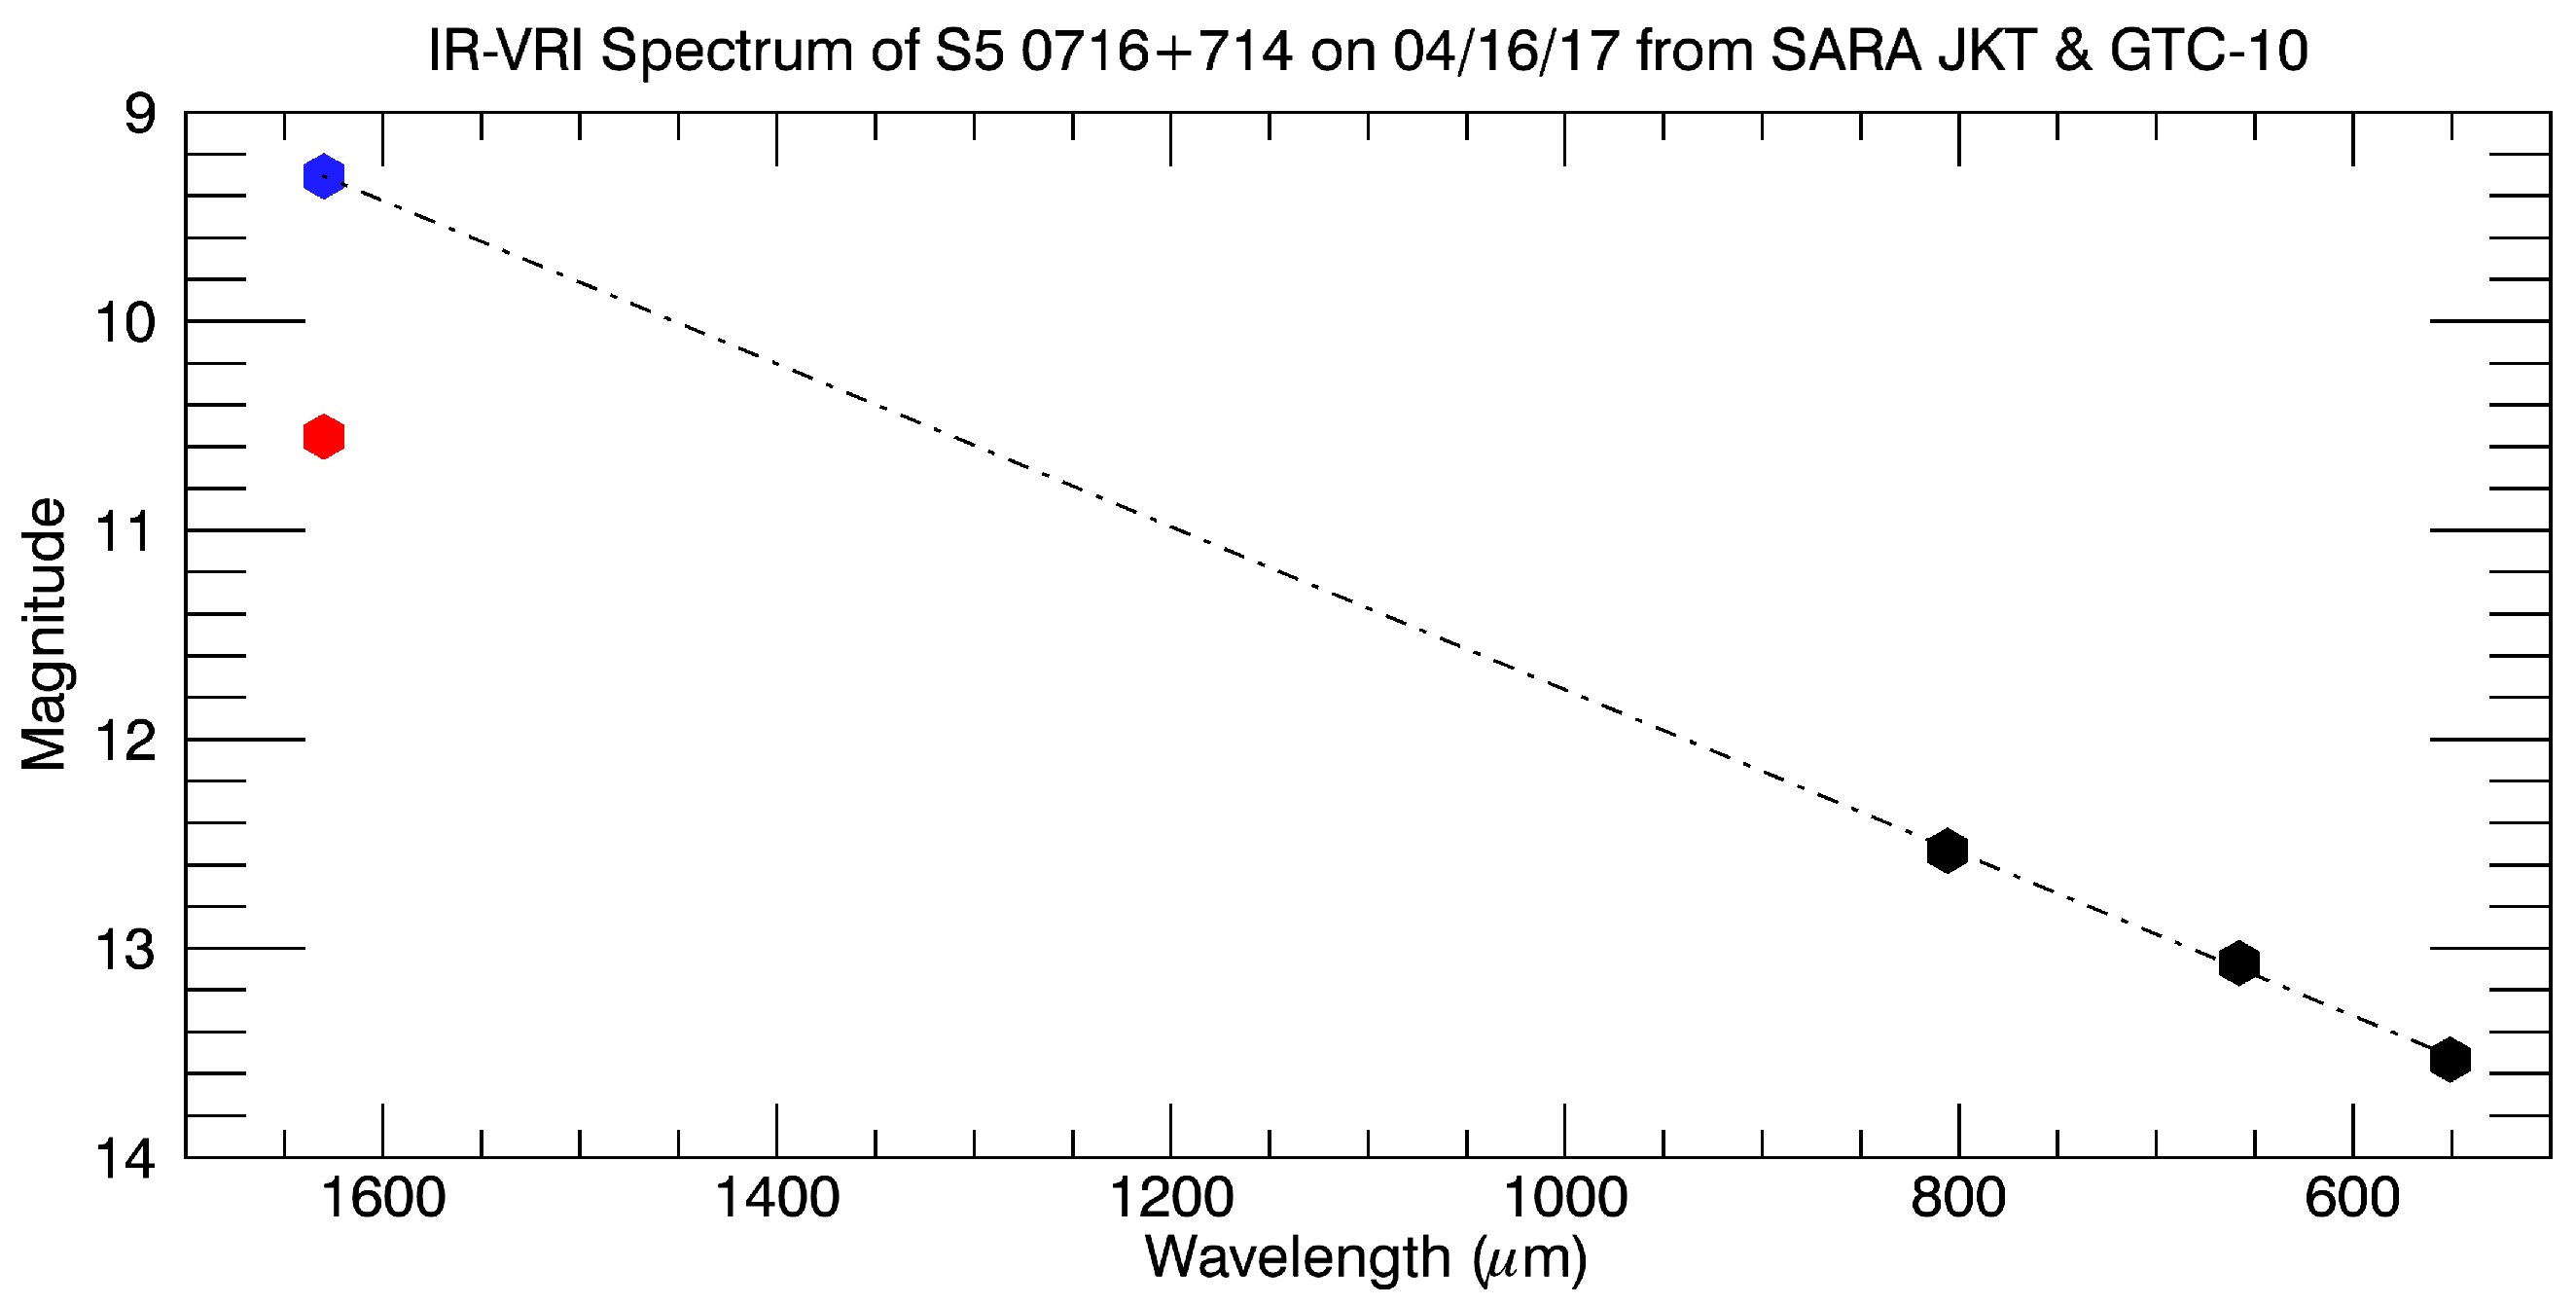
Figure 8 shows the spectrum from the 16 April 2017 data only. The blue dot is the extrapolation of the linear fit for the VRI data. This data is truly simultaneous and implies either a down-curve in the spectrum between the H and I bands, or the existence of a broken power law. Further observations are needed to confirm which.
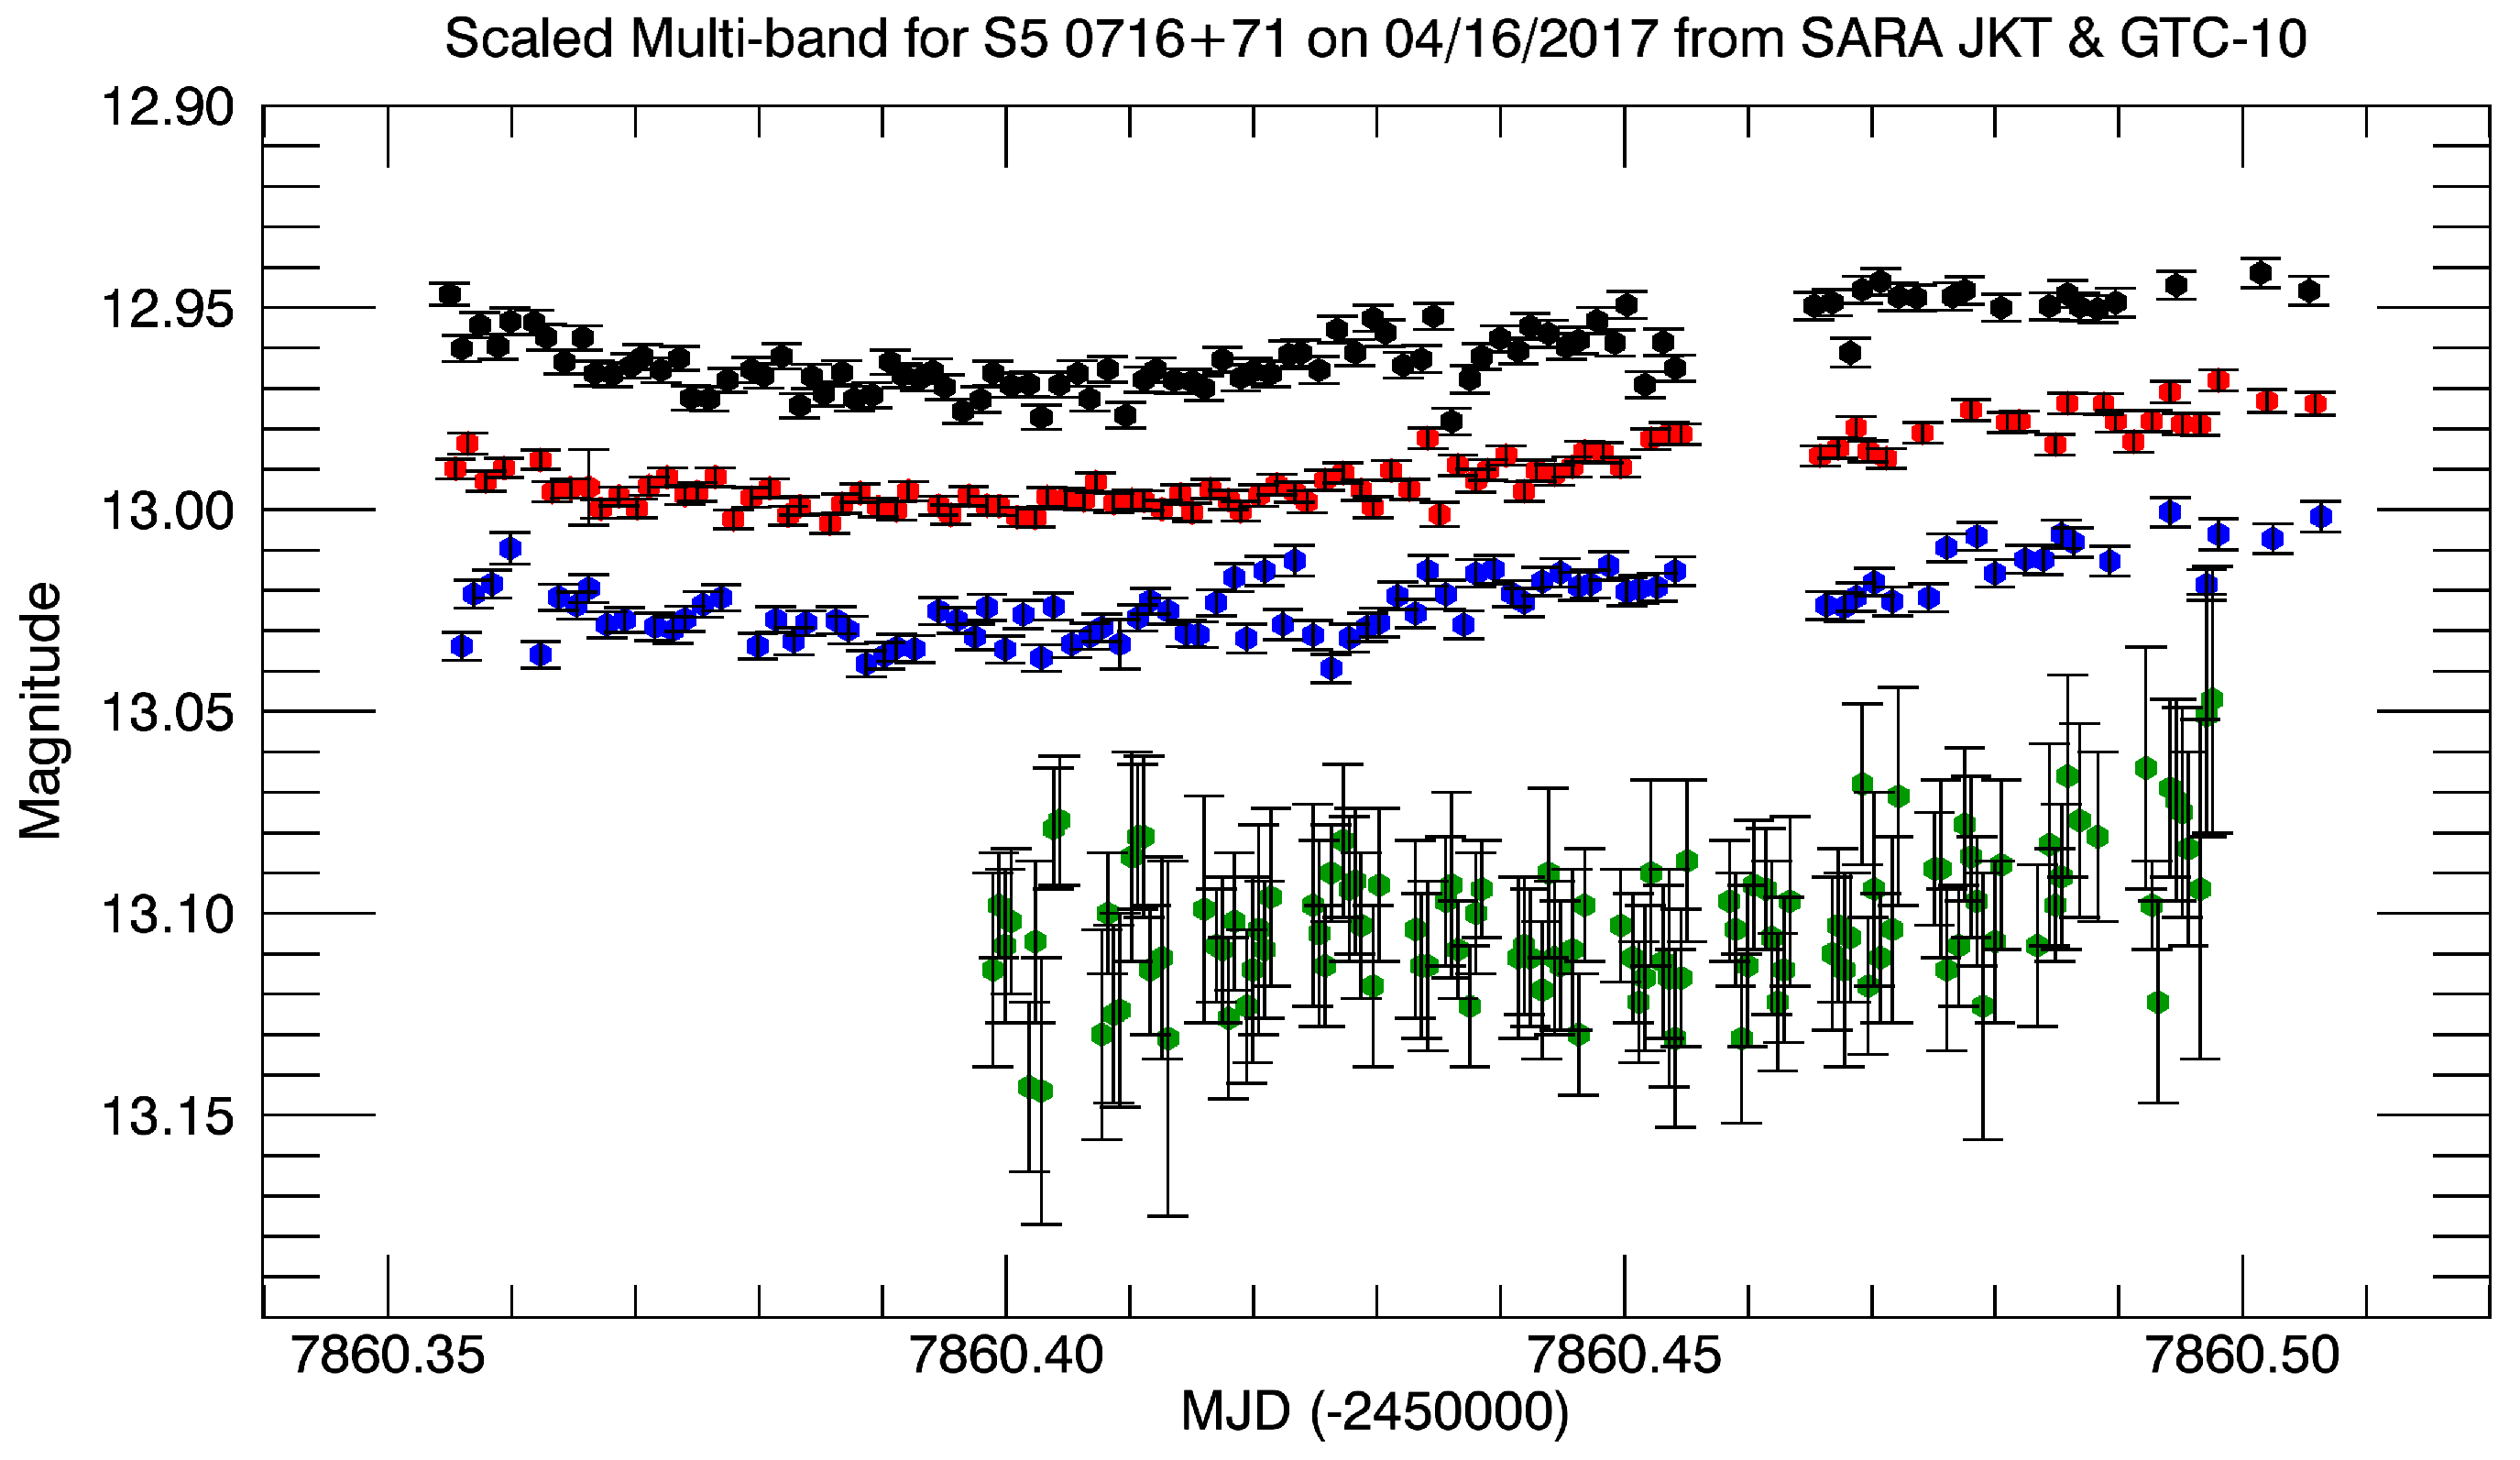
Figure 9 shows the scaled light curves plotted together so one can compare the time variability in each band. As in
Figure 3, the V magnitudes were offset by
and the I magnitudes by
. The H magnitudes were offset by
. Note the GTC observations were started after the SARA JKT, due to calibration measurements after sunset for CIRCE. The SARA JKT started imaging precisely at evening twilight. The general shape of the light curves are all consistent with similar behavior throughout the evening.
3. Discussion
We closely monitored the optical brightness of S5 0716+71 leading up to our simultaneous observation. Prior to the GTC observation, the object went through a minimum “plateau” that lasted for several months. We observed it at R = 14.96 (0.04) on 20 January 2017, which was maintained for over a month, until 31 January 2017. This behavior is similar to the “plateaus” discussed in [
6] but over a much longer time period, and 0.7 magnitudes fainter. Several micro-variability observations were made during this time, but the source was very stable. The two micro-variability detection’s on 25 January 2017 and 15 February 2017 showed only marginal variability. The object started recovering on 16 February 2017 and continued to be very active on a night-to-night basis, peaking above 13th magnitude before falling back down to R = 14.1. On 15 April 2017, it then rose again to R = 12.61, the night before our simultaneous observations. The object would continue to brighten following our observations, reaching a brightness of R ∼ 12.1 on 9 May 2017.
The optical polarization was measured at 9.21% (0.09) by the Boston group [
8] on 26 January 2017, with an electric vector angle of −54.91(0.3) degrees. The lowest percentage of polarized flux was 4.43%, occurring on 13 March 2017. The 16 April 2017 observation showed a polarization degree of about 11.3% with an angle of ∼145 degrees. As can be seen in
Figure 1, the simultaneous observations were made when the object had dropped 0.38 magnitudes from a local maximum.
Table 2 summarizes the polarization data gleaned from the literature as well as the data presented here.
In both [
2,
9], distinct events were seen in the micro-variability curve. The flare components were analyzed, separating them from a background component. It was found that the flare seemed indeed to have different polarization properties, indicating a small sub region of the jet is responsible for the flare or bump. Unfortunately our data did not show a flare or bump so we are unable to separate out the two components. Due to the lack of variability, and a comparable polarization percentage to those of the other observers, the H-band polarization is similar to the background component seen in the other studies. The idea, then, is that in the absence of micro-variations, the background jet has a rather consistent polarization degree over the optical IR region of the spectrum. In the KRM model, this is explained as laminar flow in the jet. The polarization degree changes significantly during a pulse or bump, indicating the presence of a cell or enhancement that could have vastly different properties from the background. The unchanging background polarization degree and angles are consistent with the KRM jet model, but unfortunately does not supply the critical test we had hoped for, since no pulses we observed during the observation so we could effectively separate out the pulse component.
The extrapolation of the optical VRI power-law spectrum did not match the H-band observed. This could mean either there exists a broken power law, with two different spectral indices, or the presence of significant spectral curvature. Although this behavior was not seen in previous observations, this was the first truly simultaneous VRI and H observations to date.


