The Jets of Microquasars during Giant Flares and Quiet State


1
SAO RAS, Niznij Arkhyz 369167, Russia
2
Institute of Physics, Kazan Federal University, Kazan 420008, Russia
*
Author to whom correspondence should be addressed.
†
These authors contributed equally to this work.
Galaxies 2017, 5(4), 84; https://doi.org/10.3390/galaxies5040084
Submission received: 2 October 2017
/
Revised: 9 November 2017
/
Accepted: 13 November 2017
/
Published: 21 November 2017
(This article belongs to the Special Issue Polarised Emission from Astrophysical Jets)
Abstract
:We report on the radio properties of jets of the following microquasars, as determined from daily multi-frequency monitoring observations with the RATAN-600 radio telescope during 2010–2017: V404 Cyg, SS433, Cyg X-1, GRS1915+105 and LSI+61303. We have detected many giant flares from SS433, a powerful flare from V404 Cyg in June 2015, an active state of Cyg X-1 in 2017 and fifty periodic flares from LSI+61303. We describe the properties of massive ejections based on multi-band (radio, X-ray and -ray) studies. The general properties of the light curves are closely connected with the processes of jet formation in microquasars.
1. Microquasars Studies with the RATAN-600 Telescope
The bright microquasars GRS1915+105, SS433, Cyg X-1, Cyg X-3, LSI+61303 and LS5039 are well-known X-ray binaries (XRBs) with relativistic jets, detected directly in the VLBI mapping. The radio emission of XRBs is mostly a variable synchrotron radiation from these jets, formed as a mass of ejections from central regions of an accretion disk within an intensive wind of the optical star. The inner shock waves in relativistic jets are the main generator of the relativistic electrons [1]. We have carried out a long-term monitoring of XRBs in almost daily measurements with RATAN-600 at 1.3–30 GHz during the last seven years [2,3]. During 52 orbital periods ( d) we studied the super-orbital modulation ( d) of the flaring radio emission from LSI+61303. The mean orbital light curves (usually for ten orbits) depend strongly on a phase . We detected two giant flares from Cyg X-3 in September 2016 and in April 2017 at 1.3–30 GHz. We discuss the properties of these flares in the paper of the Proceedings of [4].
2. Results
2.1. V404 Cyg
V404 Cygni is a low-mass XRB consisting of a black hole of mass 9.0 M, accreting matter from a low-mass (<1 M), late-type companion star. The orbital period d is the longest of all known black hole XRBs. V404 Cyg is the closest microquasar, kpc [5]. We observed V404 Cyg in June 2015 [6] and have detected the bright flare [7] simultaneously with the huge X-ray flare (40 Crabs at 15–50 keV, [8]) at MJD57198.933 (Figure 1). This flare had the characteristic synchrotron spectrum with a low-frequency turn-over. This is probably due to a synchrotron self-absorption or an absorption due to thermal electrons mixed with the relativistic ones [9]. During four days, the flaring flux decreased with time as a power-law: .
2.2. SS433
SS433 is a bright microquasar that we have observed with RATAN-600 at 1.3–22 GHz [3]. There are multiple powerful flares on the RATAN light curves (Figure 2). Most of them are optically thin synchrotron flares with spectral indices between and . By comparing VLBA images of SS433 with photometric radio monitoring from the RATAN-600 telescope, we explored the properties of these radio flares [11]. Usually, the active states continue for about 100 days, while we can see single bright flares within 10–15 days. In the quiet states, lasting up to 200 days, we have detected a weak modulation with an orbital period of 13.1 days or with a nutation period of 6.3 days. We did not find any correlation between the appearance of flares and the jet precession of the 164-day period. All the local peaks on the light curves can be associated with the appearance of new bright components in the VLBI maps, pointing to a connection with the ejection of new blobs.
2.3. Cyg X-1
The persistent black hole XRB Cyg X-1 had a variable flux density of 5–40 mJy at 4.7 GHz during the daily measurements in 2017 (Figure 3). We have detected a significant correlation () between the smoothed hard X-ray emission at 15–50 keV (Swift/BAT) and the radio flux density at 4.7 GHz.
2.4. GRS1915+105
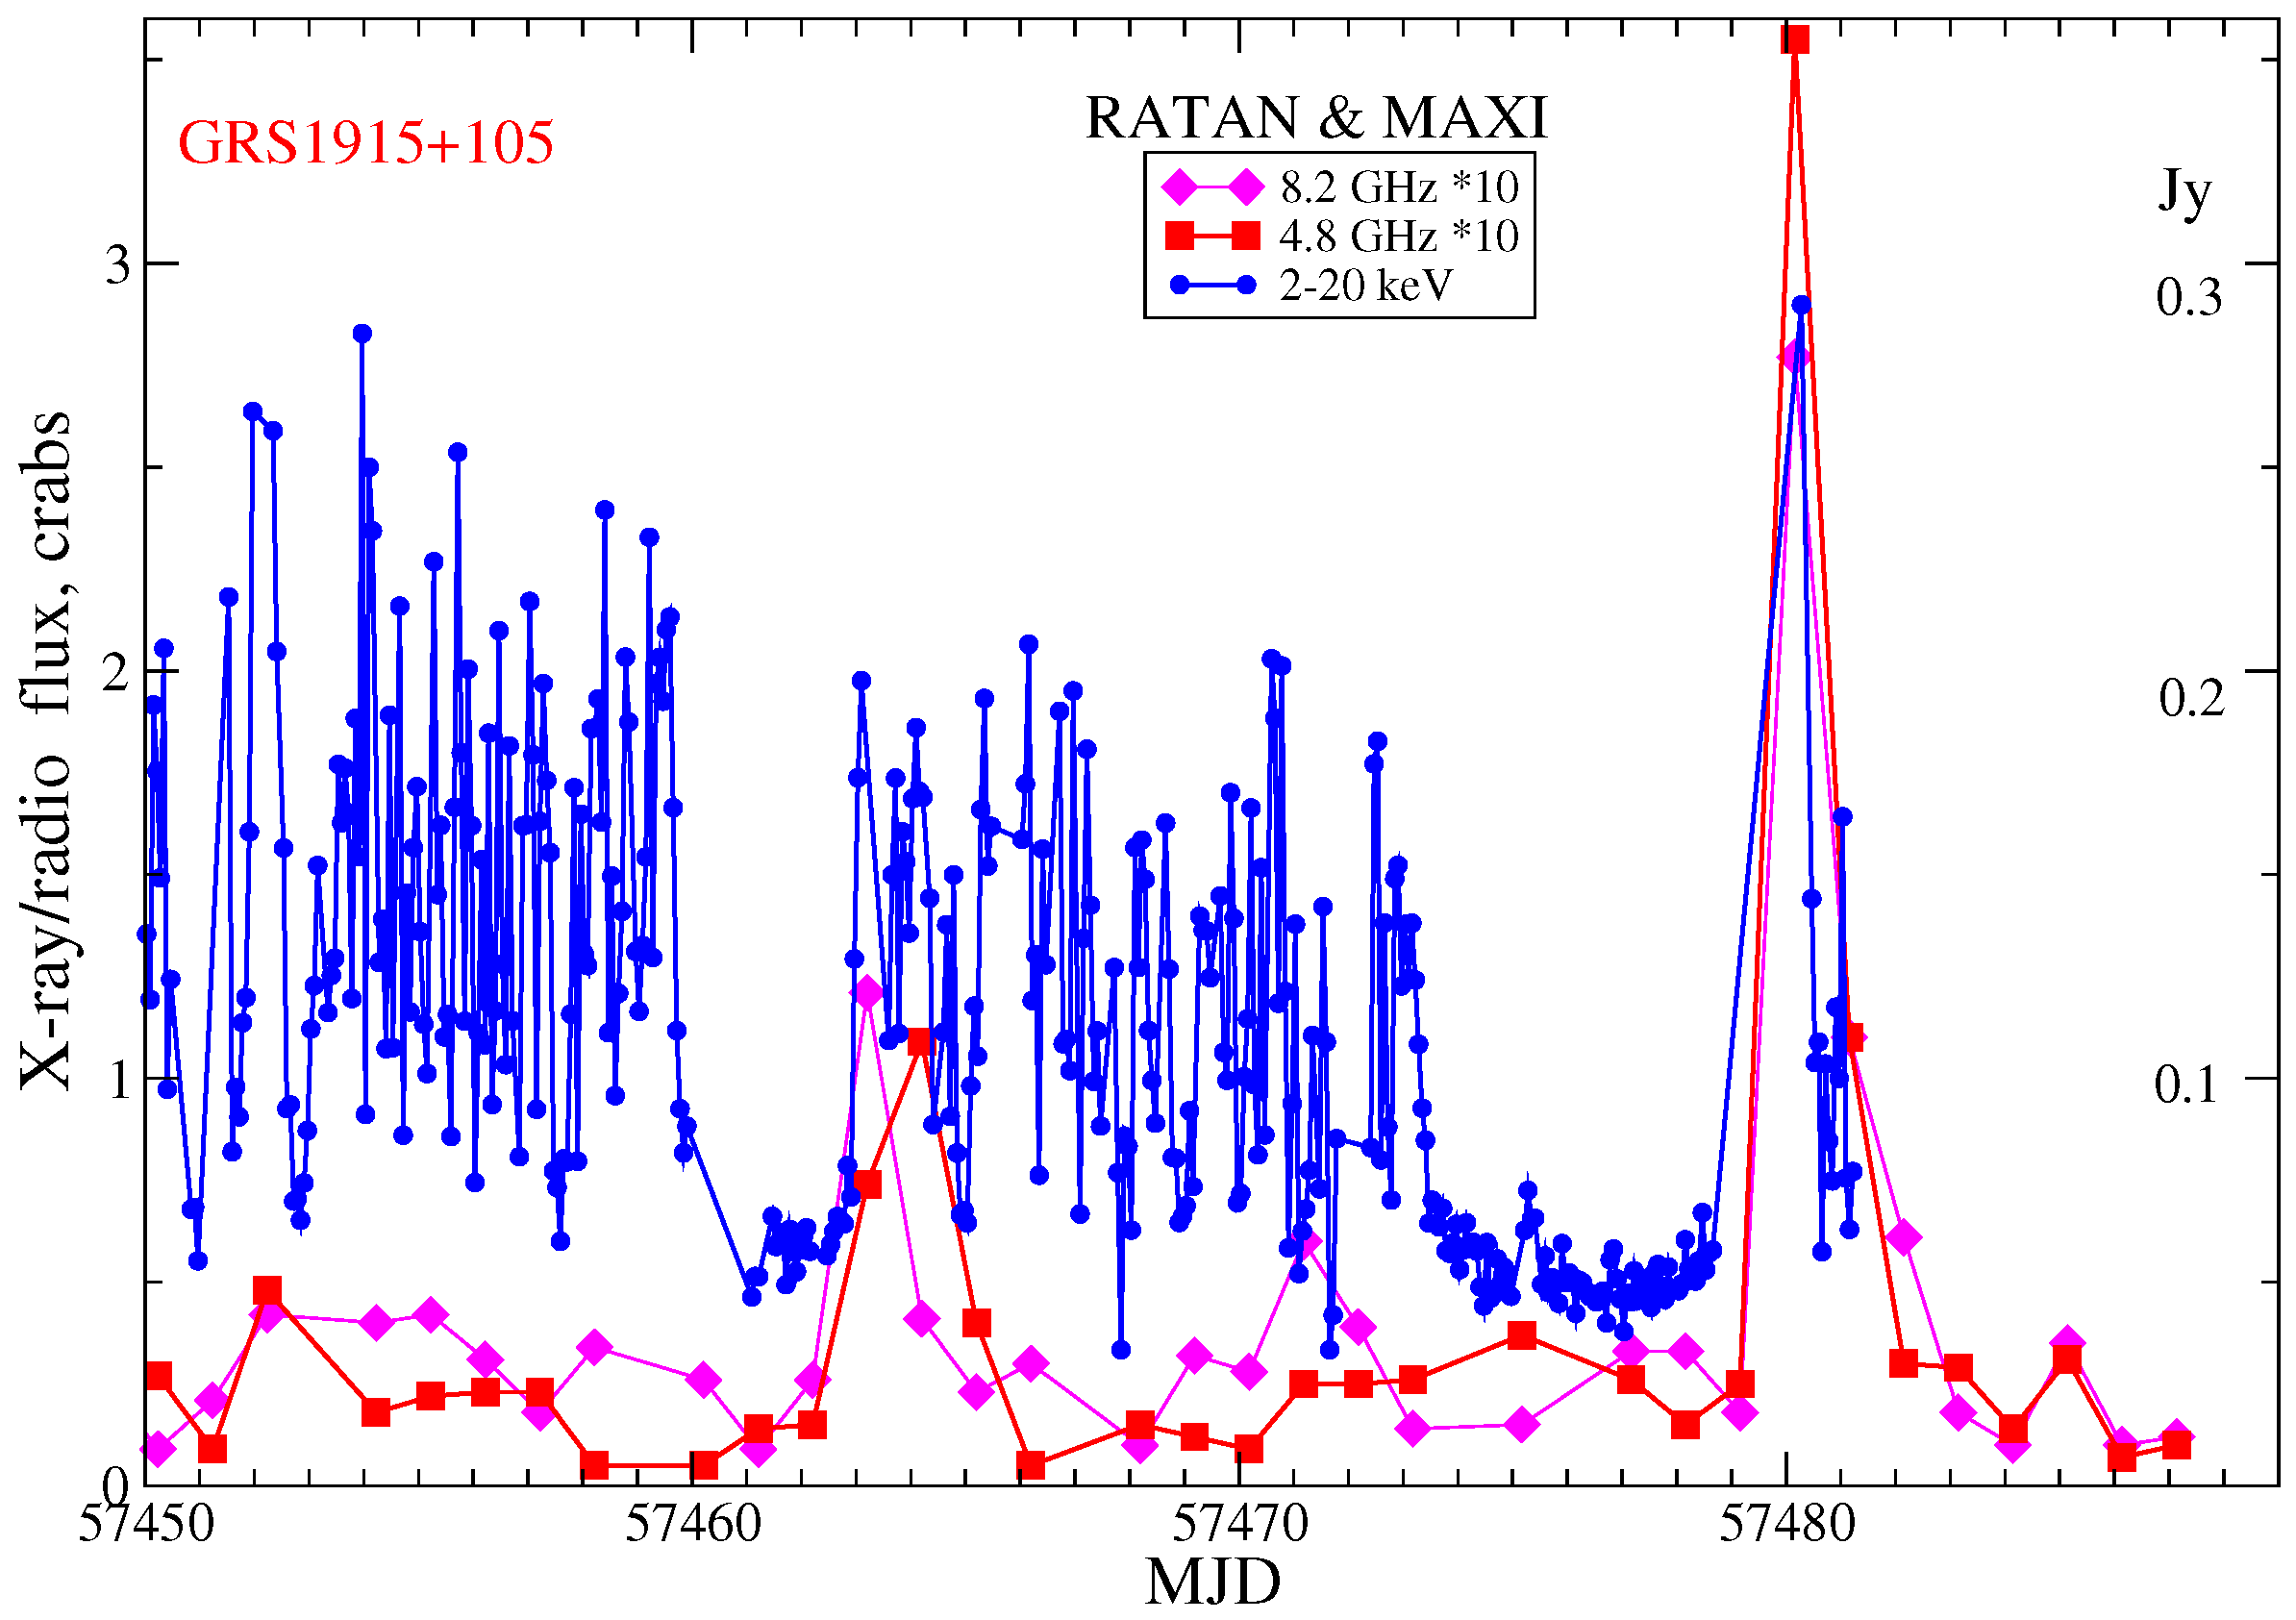
The prototypical microquasar GRS1915+105 showed very bright flares up to 1.5 Jy at 5 GHz in the 1990th years. These flares are definitely related to changes in the X-ray states. According to recent VLBA observations [12] and our studies [13], the X-ray luminosity increased in the last 2–4 h preceding the ejection in May 2013, which we later detected as the 80-mJy flare at 4.7–11 GHz. In the long-term monitoring of GRS1915+105 with RATAN-600, the flares have been detected commonly at the level of 0.6 Jy or lower. They occurred 2–3-times per year, usually when the low/soft X-ray state changed to the high/hard state. We plotted in Figure 4 one example of such behavior, where the light curves at 2–20 keV (MAXI) and at 4.7 GHz (RATAN) are shown.
2.5. LS5039
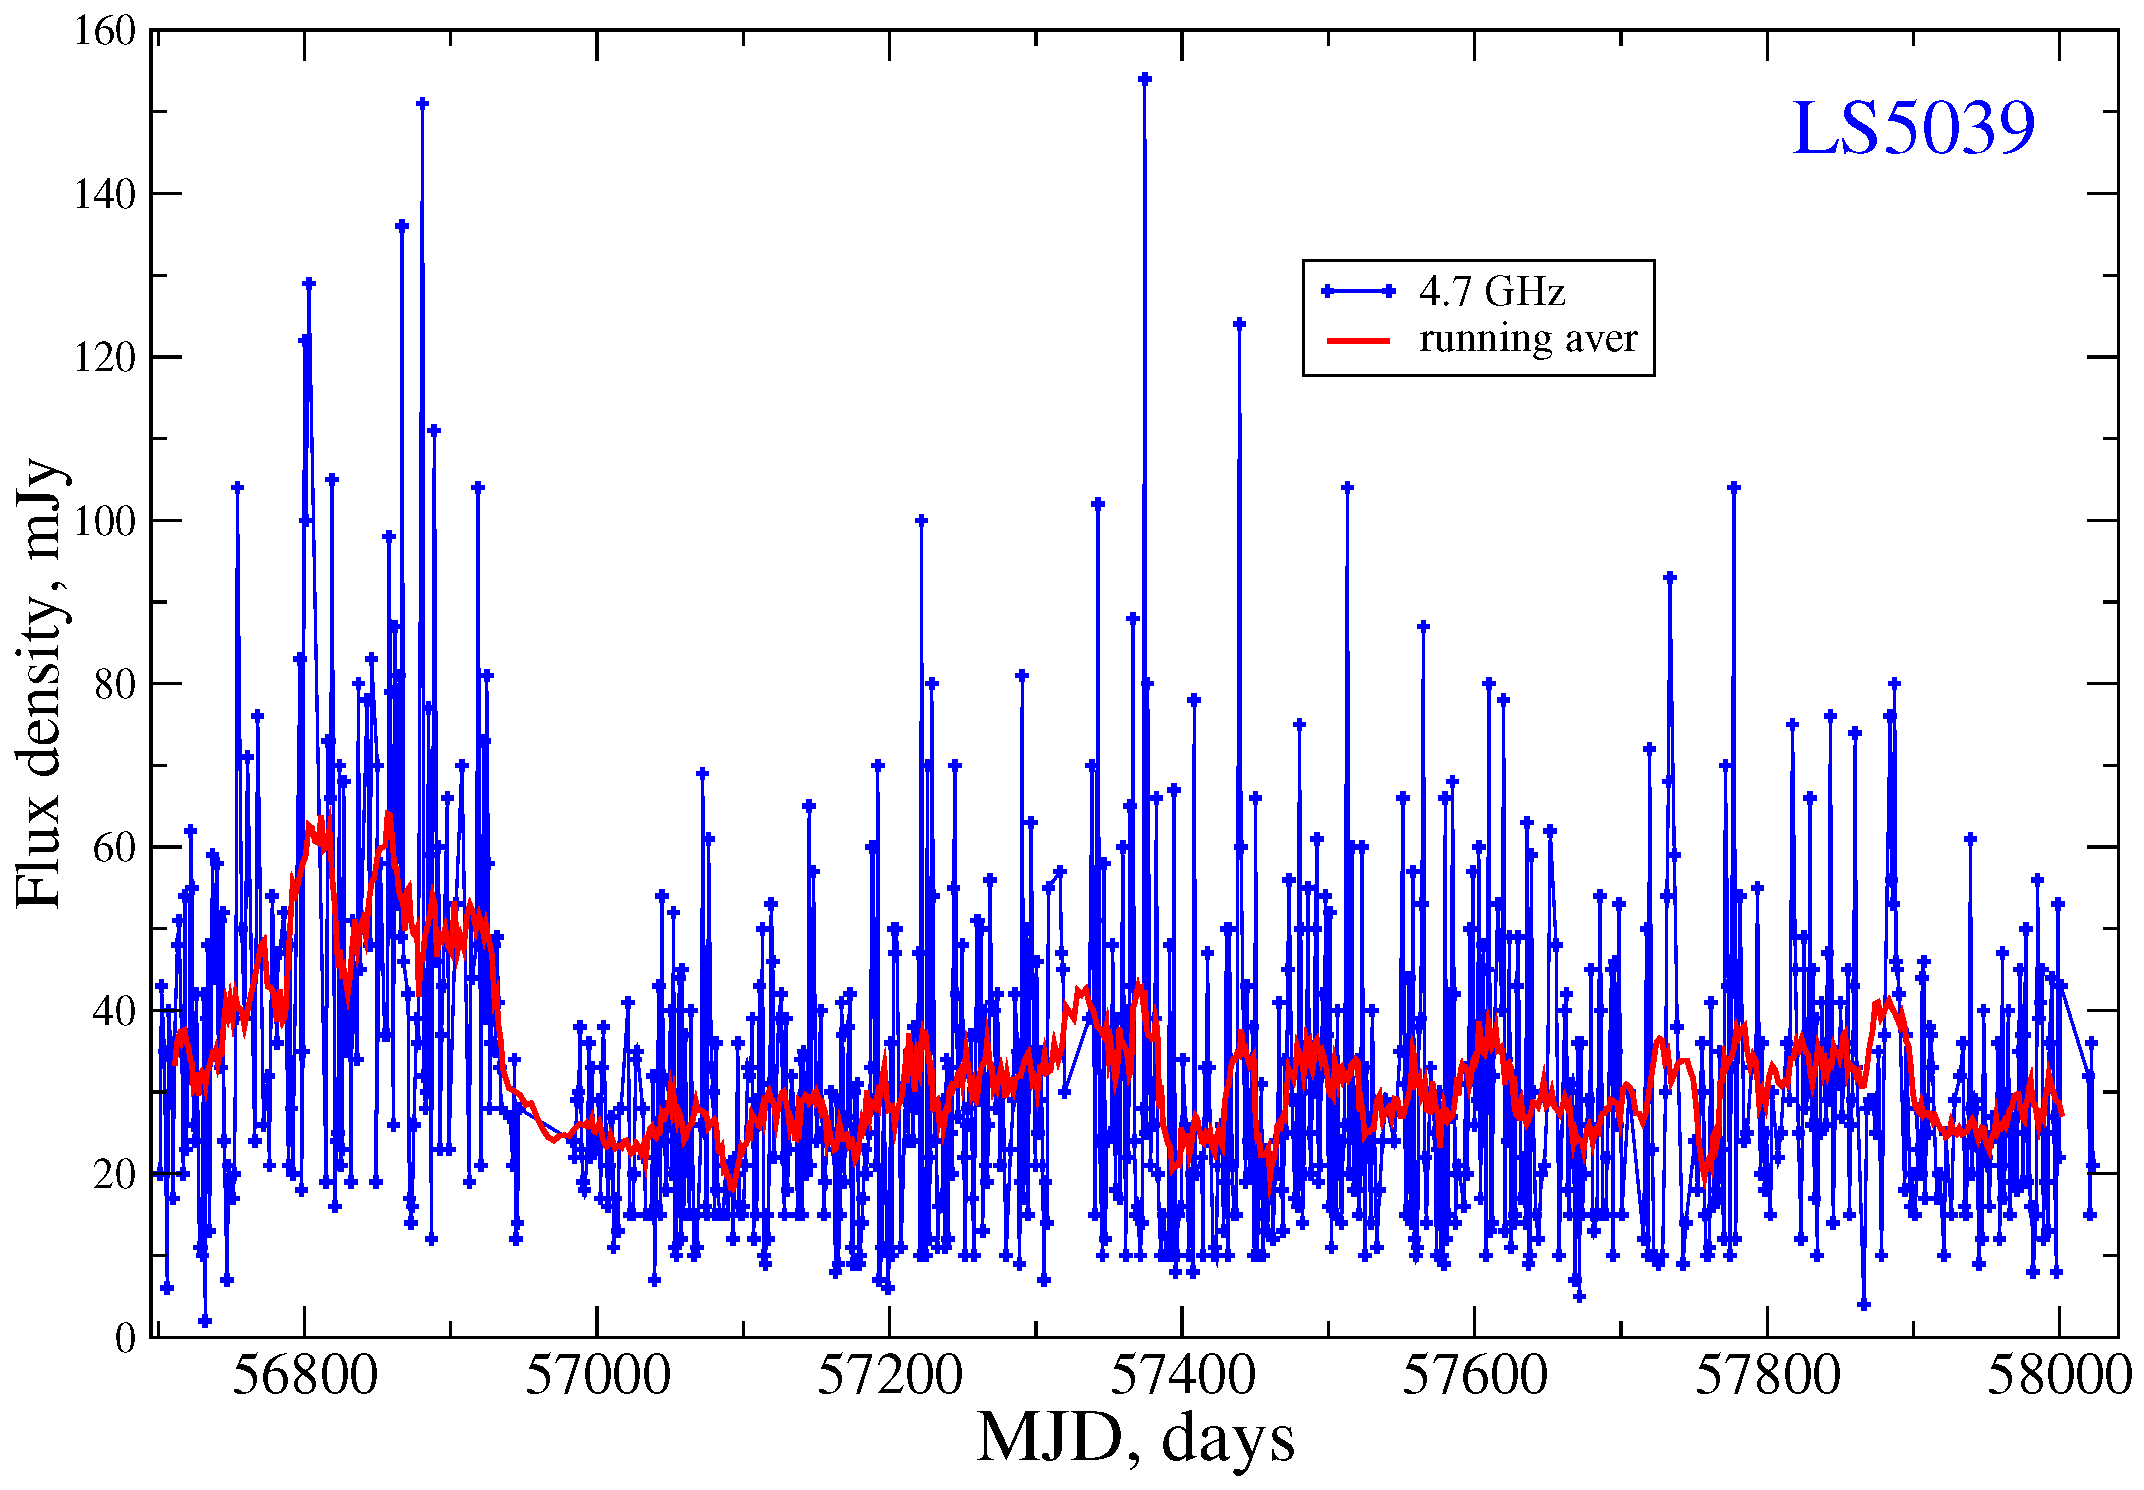
The high-mass microquasar XRB LS 5039, comprising the O6.5-type star and probably a black hole ([14]) (or NS), has been detected in -rays (see [15,16] (EGRET source 3EG J1824-1514 and the Fermi catalog source 3FGL J1826.2-1450). It has been monitored with the Green Bank Interferometer in the 1990th at 2.3 and 8.3 GHz. We measured the light curve at 4.7–4.8 GHz during 2014–2017 (Figure 5). Usually, the flux density varied from 10 to 100 mJy, while the mean flux density for 10–15 days was 25–30 mJy. In 2017, we measured the average (over 10–15 days) flux density at 8.2 GHz at the level of 5–20 mJy; thus, the spectrum is non-thermal with spectral indices (here, always ) between and , with the median value of . We did not detect any significant modulation associated with the orbit period ( d) in these data at 4.7 GHz, while such modulation could be related to the measured eccentricity >0.25, which can influence the accretion rate, and therefore the jet formation, as we found in XRB LSI+61303.
2.6. LSI+61303
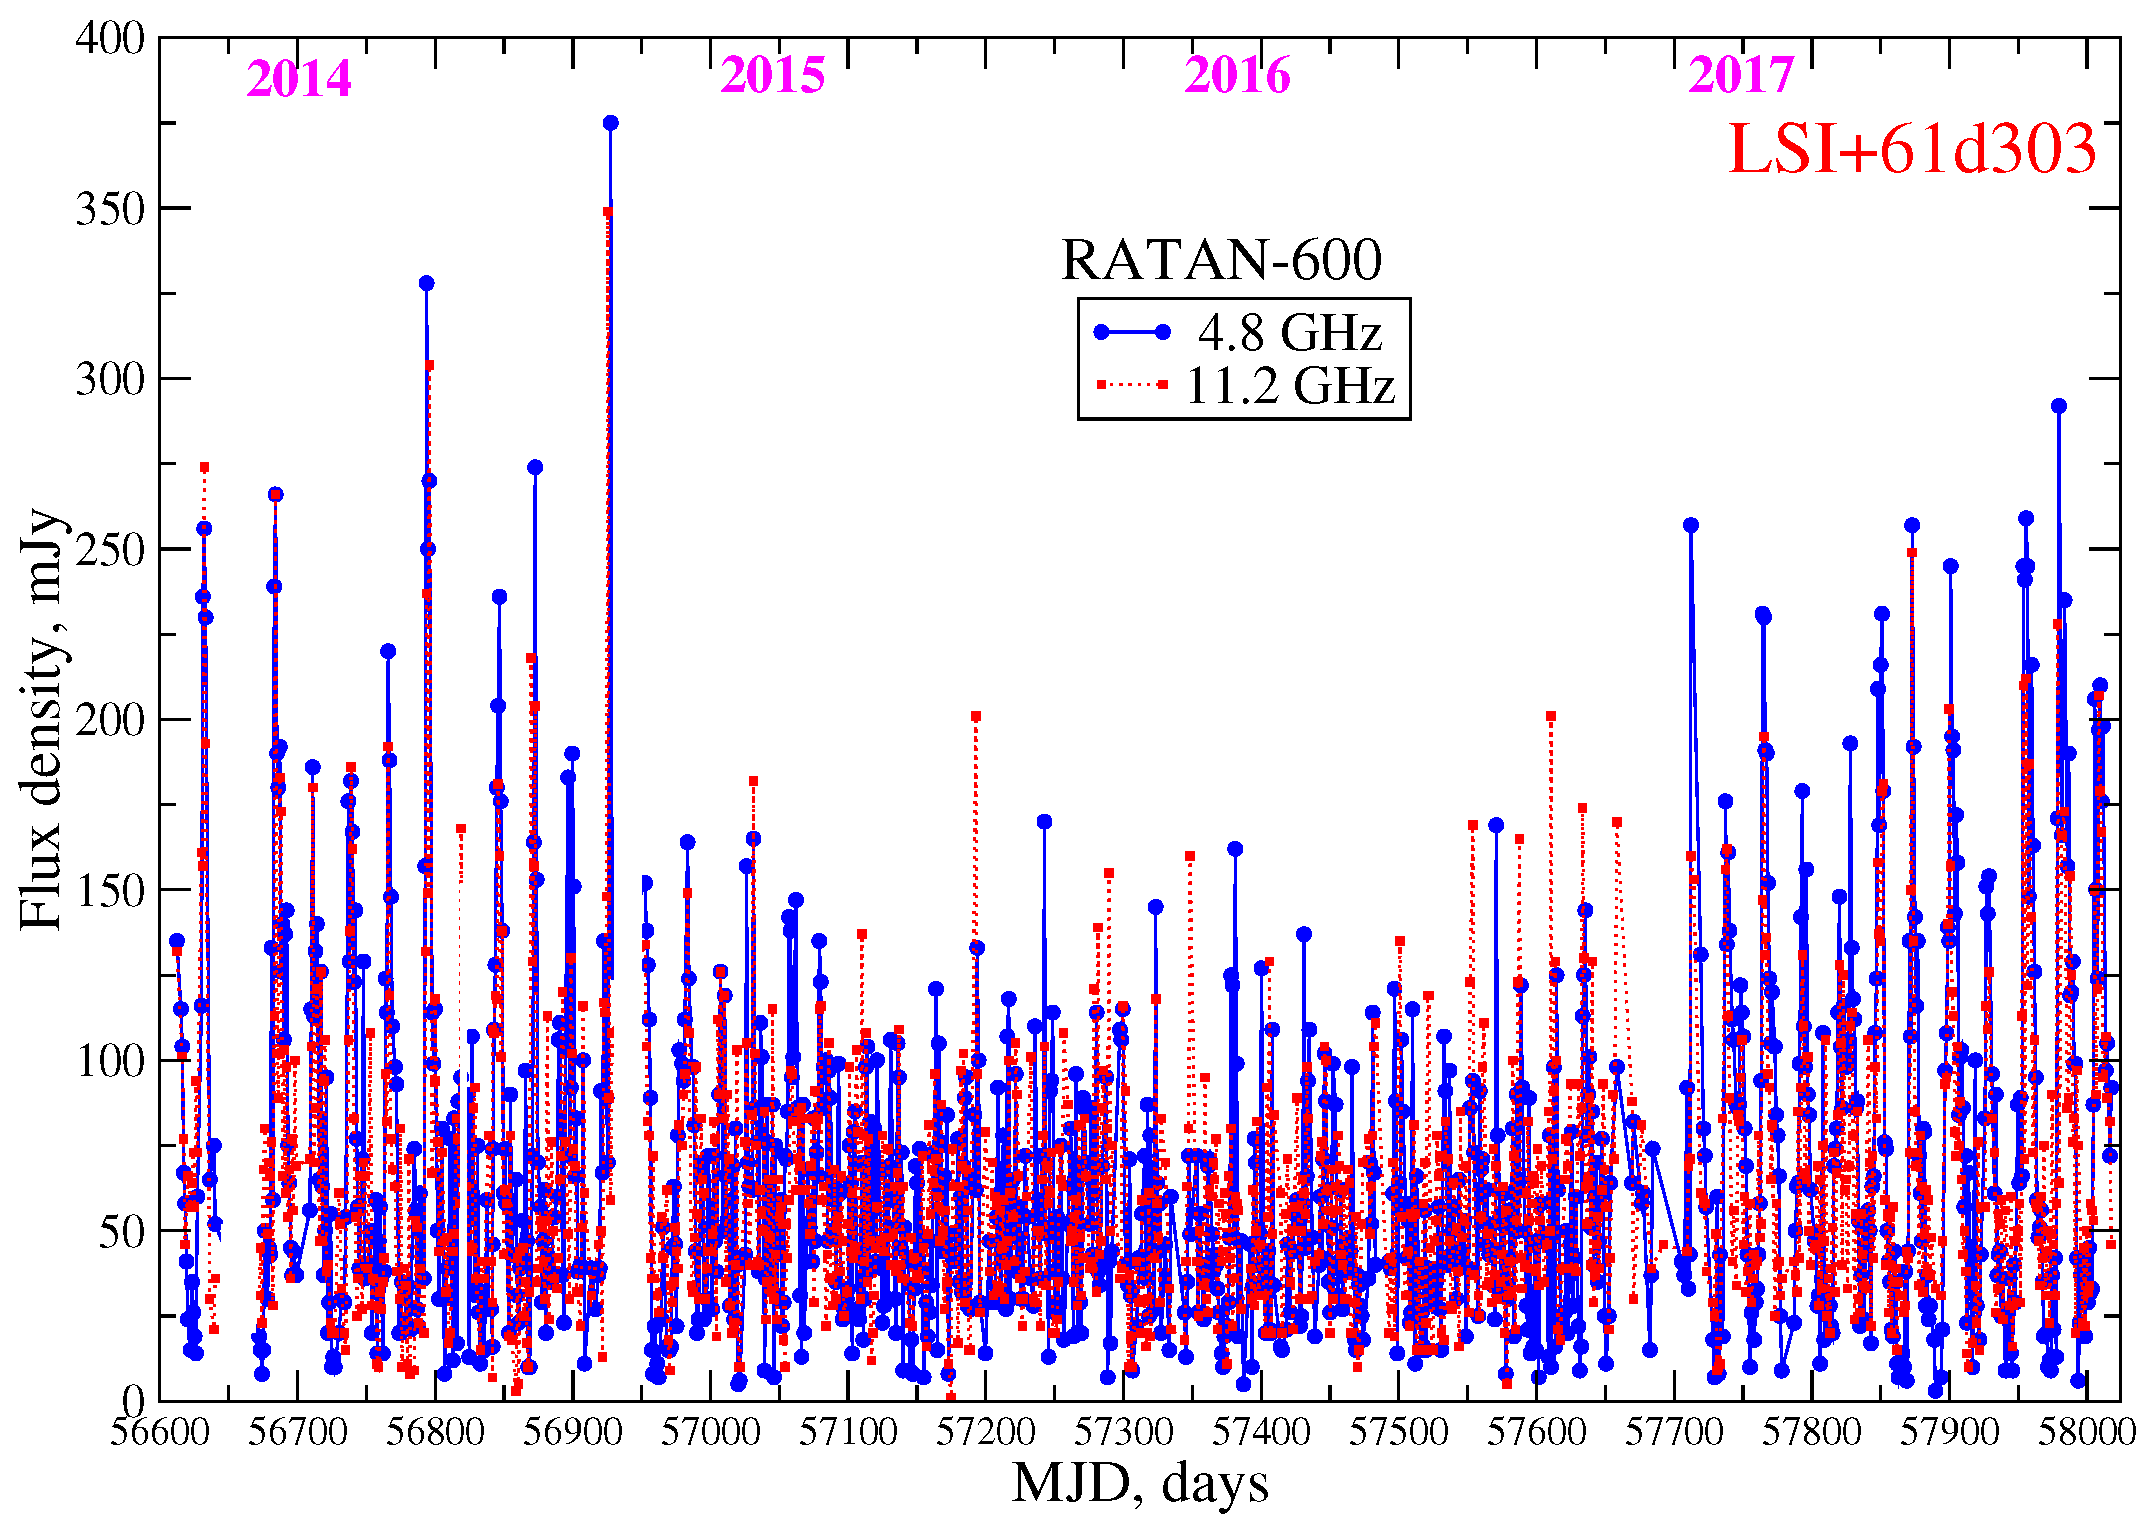
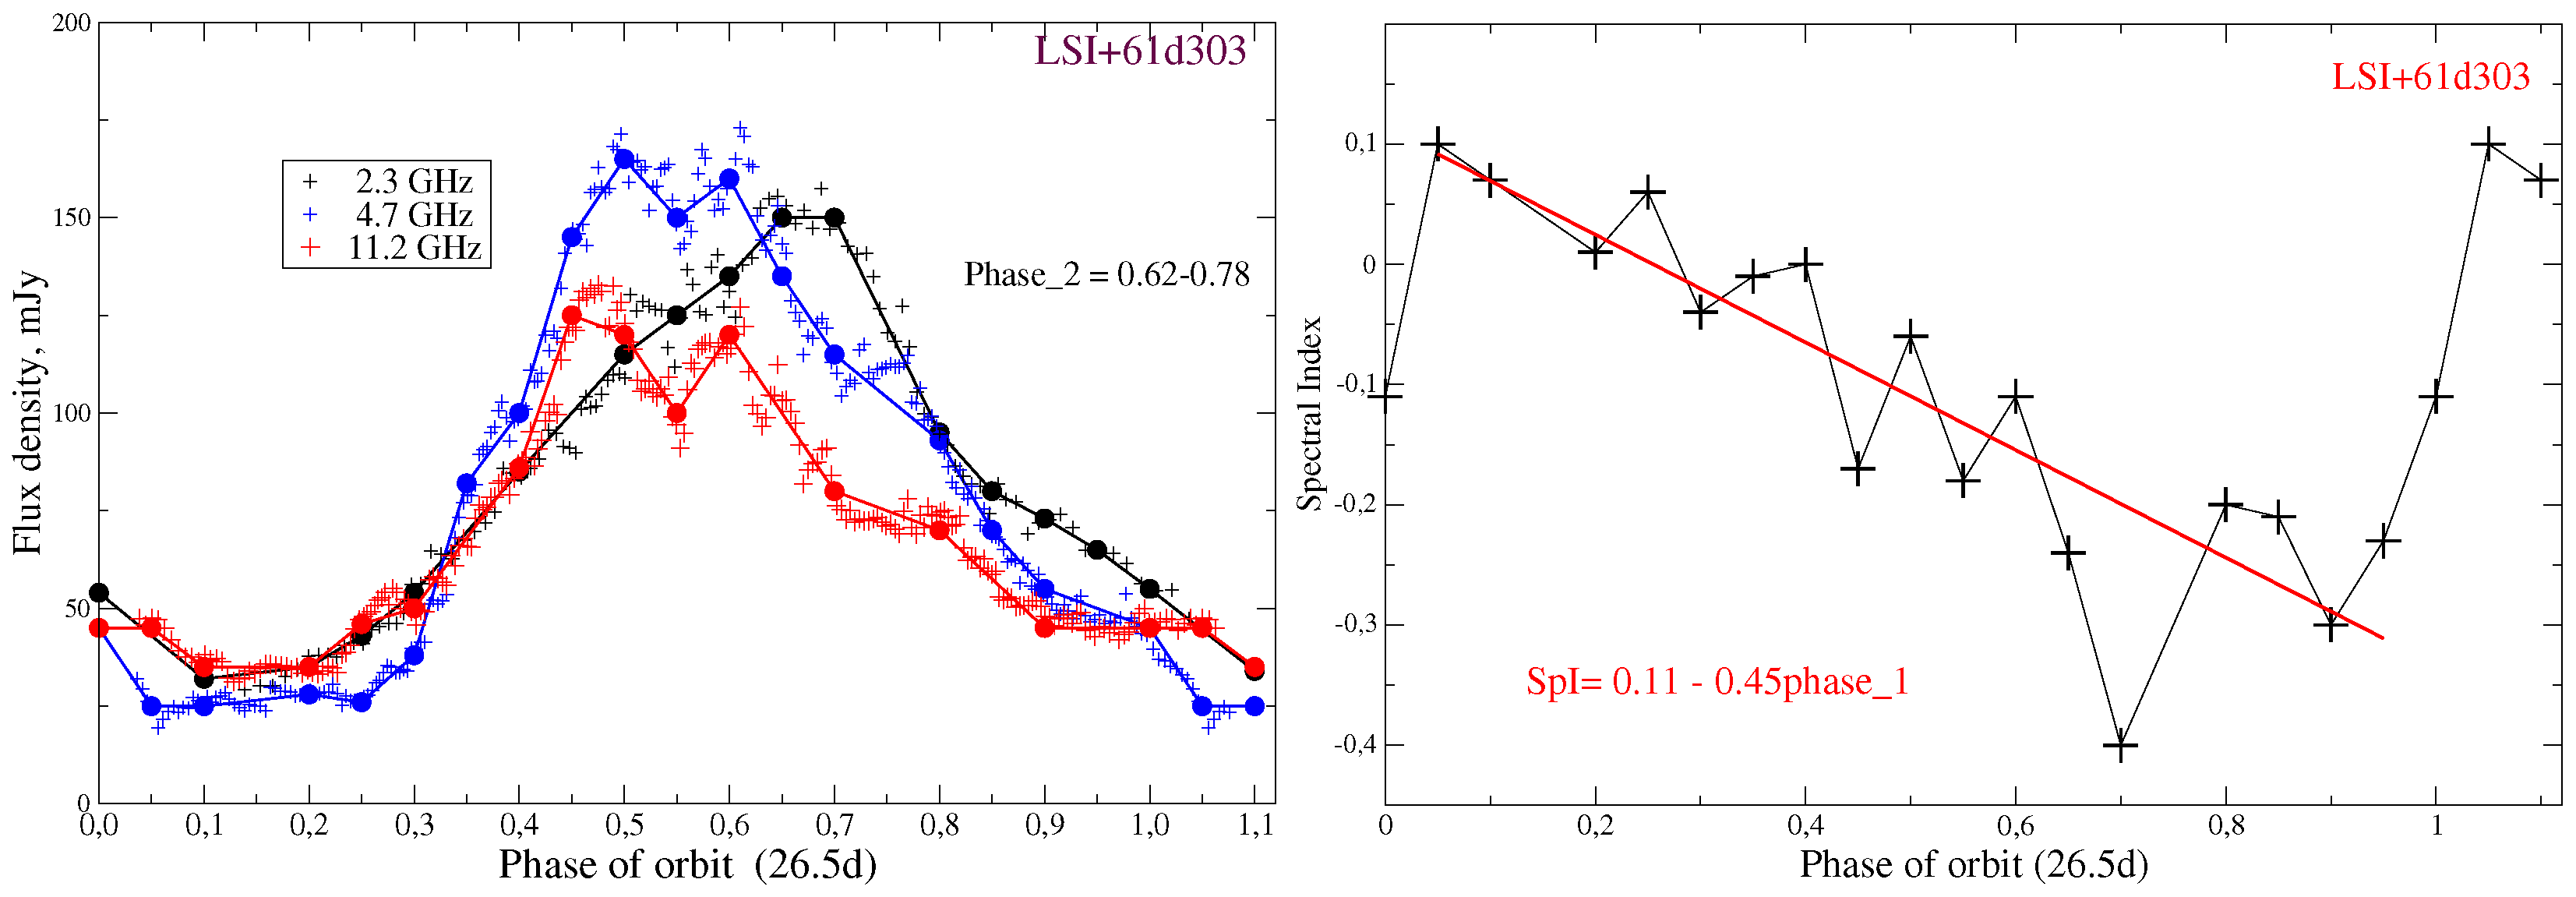
We continued our monitoring of the periodical flaring activity in radio and -rays XRB LSI+61303 [17,18] during 1400 days, i.e., 52 orbits ( d) at frequencies of 2.3, 4.7 and 11.2 GHz (Figure 6). The aim was to trace the enigmatic super-orbital ( d) period [19] in full to study the evolution of the radio properties. Indeed, we found that the maximal flaring flux density and their -phases notably changed with the phases (Figure 7).
3. Discussion
We have conducted an intensive monitoring of the bright microquasars during the last 4–7 years and have obtained an unprecedented spectral and temporal set of data. It serves as a good tracer of the jet activity and could be used for comparison with the optical, X-ray and -ray data. A search for the correlations or associations of processes in the accretion disks and jets (the so-called ‘disk-jets coupling’) is the key task in the building of the physical picture for microquasars [20].
Acknowledgments
S.A.T. acknowledges support through the Russian Government Program of Competitive Growth of Kazan Federal University.
Author Contributions
S.T. has carried out all radio observations and their data reduction. N.N. and P.T. prepared the total radiometric complexes and calibration. G.Z. prepared the antenna adjustment and control.
Conflicts of Interest
The authors declare no conflict of interest.
Abbreviations
The following abbreviations are used in this manuscript:
| GRS | International Astrophysical Observatory ’GRANAT’ source |
| LSI | Luminous Stars in the Northern Milk Way 1 (1959) |
| MAXI | The Monitor of All-sky X-ray Image aboard the International Space Station |
| RATAN-600 | Radio Astronomical Telescope Academy of Science, Russia |
| SAO RAS | Special Astrophysical observatory, Russia |
| SS | Stephenson & Sanduleak calalog (1977) |
| Swift/BAT | Burst Alert Telescope aboard the Swift Cosmic Observatory |
| VLBA | Very Large Baseline Array of NRAO (USA) |
References
- Mirabel, I.F.; Rodriguez, L.F. Sources of Relativistic Jets in the Galaxy. Ann. Rev. Astron. Astrophys. 1999, 37, 409–443. [Google Scholar] [CrossRef]
- Trushkin, S.; Bursov, N.N.; Nizhelskij, N.A.; Majorova, E.K.; Voitsik, P.A. What do we understand from multi-frequency monitoring of microquasars? In Proceedings of the VI Microquasar Workshop: Microquasars and beyond, Como, Italy, 18–22 September 2006. [Google Scholar]
- Trushkin, S.A.; Nizhelskij, N.A.; Bursov, N.N. Multi-Frequency Radio Photometry of the Microquasars with the RATAN-600 Radio Telescope. In Twelfth Marcel Grossmann Meeting on General Relativity; Chamseddine, A.H., Ed.; World Scientific Publishing Co. Pte. Ltd.: Singapore, 2012. [Google Scholar]
- Trushkin, S.A.; McCollough, M.; Nizhelskij, N.A.; Tsybulev, P.G. The giant flares of the microquasar Cygnus X-3: X-rays states and jets. Galaxies 2018, in press. [Google Scholar]
- Miller-Jones, J.C.A.; Jonker, P.G.; Dhawan, V.; Brisken, W.; Rupen, M.P.; Nelemans, G.; Gallo, E. The First Accurate Parallax Distance to a Black Hole. Astrophys. J. Lett. 2009, 706, L230–L234. [Google Scholar] [CrossRef]
- Trushkin, S.A.; Nizhelskij, N.A.; Tsybulev, P.G. The Inverted Radio Spectrum of the Flare in V404 Cyg. The Astronomer’s Telegram, 16 June 2015. [Google Scholar]
- Trushkin, S.A.; Nizhelskij, N.A.; Tsybulev, P.G. A New Giant Radio Flare of V404 Cyg at Centimeter Wavelengths. The Astronomer’s Telegram, 26 June 2015. [Google Scholar]
- Barthelmy, S.D.; D’Ai, A.; D’Avanzo, P.; Krimm, H.A.; Lien, A.Y.; Marshall, F.E.; Maselli, A.; Siegel, M.H. Swift trigger 643949 is V404 Cyg. GRB Coordinates Network, Circular Service. 15 June 2015. 17929. Available online: http://adsabs.harvard.edu/abs/2015GCN..17929...1B (accessed on 21 November 2017).
- Piano, G.; Munar-Adrover, P.; Verrecchia, F.; Tavani, M.; Trushkin, S.A. High-energy Gamma-ray Activity from V404 Cygni Detected by AGILE during the 2015 June Outburst. Astrophys. J. 2017, 839, 84. [Google Scholar] [CrossRef]
- Chandra, P.; Kaneka, N. Giant Metrewave Radio Telescope Monitoring of the Black Hole X-ray Binary, V404 Cygni during Its 2015 June Outburst. Astrophys. J. 2017, 846, 111. [Google Scholar] [CrossRef]
- Jeffrey, R.M.; Blundell, K.M.; Trushkin, S.A.; Mioduszewski, A.J. Fast launch speeds in radio flares, from a new determination of the intrinsic motions of SS 433’s jet bolides. Mon. Not. Roy. Astron. Soc. 2017, 461, 312–320. [Google Scholar] [CrossRef]
- Reid, M.J.; McClintock, J.E.; Steiner, J.F.; Steeghs, D.; Remillard, R.A.; Dhawan, V.; Narayan, R. A Parallax Distance to the Microquasar GRS 1915+105 and a Revised Estimate of its Black Hole Mass. Astrophys. J. 2014, 796. [Google Scholar] [CrossRef]
- Punsly, B.; Rodriguez, J.; Trushkin, S.A. The Accretion Flow-Discrete Ejection Connection in GRS 1915+105. Astrophys. J. 2016, 826, 5. [Google Scholar] [CrossRef]
- Casares, J.; Ribo, M.; Ribas, I.; Paredes, J.M.; Marti, J.; Herrero, A. A possible, black hole in the γ-ray microquasar LS 5039. Mon. Not. Roy. Astron. Soc. 2005, 364, 899–908. [Google Scholar] [CrossRef]
- Marti, J.; Paredes, J.M.; Ribo, M. The system LS 5039: A new massive radio emitting X-ray binary. Astron. Astrophys. 1998, 338, L71–L74. [Google Scholar]
- Ribo, M.; Reig, P.; Marti, J. X-ray and radio observations of RX J1826.2-1450/LS 5039. Astron. Astrophys. 1999, 347, 518–523. [Google Scholar]
- Massi, M. LSI+61°303 in the context of microquasars. Astron. Astrophys. 2004, 422, 267–270. [Google Scholar] [CrossRef]
- Massi, M.; Kaufman, B. Radio Spectral Index Analysis and Classes of Ejection in LS I +61°303. Astrophys. J. 2009, 702, 1179–1189. [Google Scholar] [CrossRef]
- Gregory, P.C. Bayesian Analysis of Radio Observations of the Be X-ray Binary LS I +61°303. Astrophys. J. 2002, 575, 427–434. [Google Scholar] [CrossRef]
- Fender, R.P.; Belloni, T.M.; Gallo, E. Towards a unified model for black hole X-ray binary jets. Mon. Not. Roy. Astron. Soc. 2004, 355, 1105–1110. [Google Scholar] [CrossRef]
Figure 1.
The light curves of V 404 Cyg at 4.7, 8.2, 11.2 (RATAN-600), 1.3 GHz with GMRT [10] and at 15–50 keV (Swift/BAT) during the giant flaring events in June 2015.
Figure 1.
The light curves of V 404 Cyg at 4.7, 8.2, 11.2 (RATAN-600), 1.3 GHz with GMRT [10] and at 15–50 keV (Swift/BAT) during the giant flaring events in June 2015.
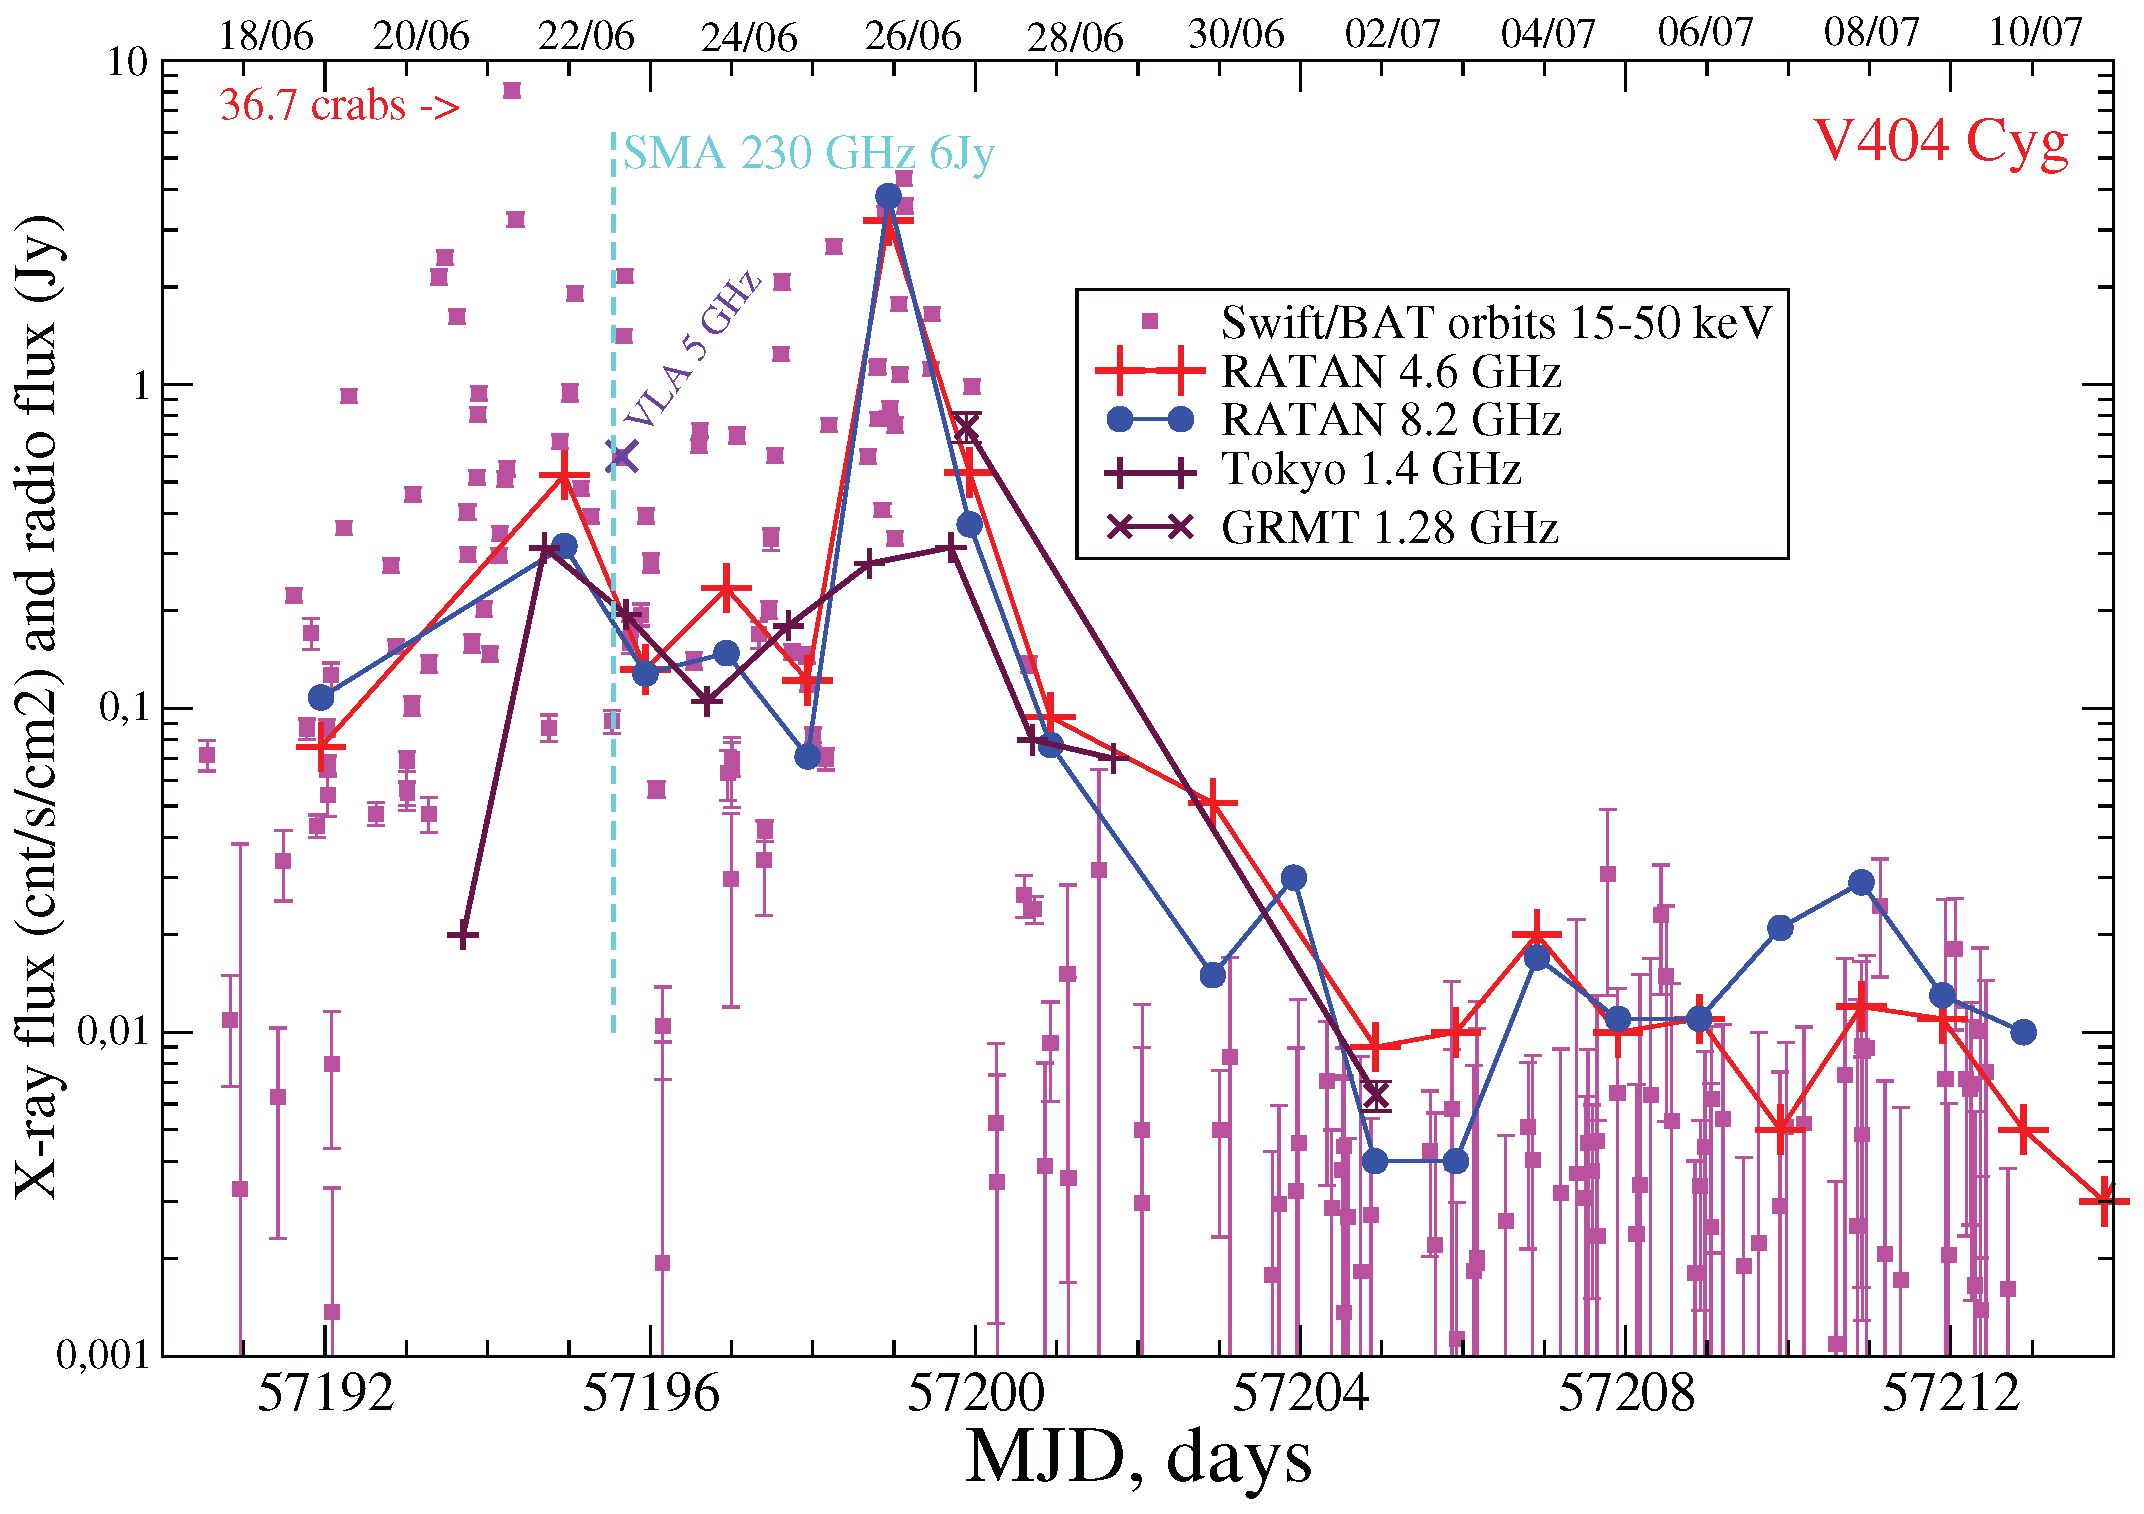
Figure 2.
The light curves of SS433 at 4.7, 8.2, 11.2 and 21.7 GHz with RATAN-600 during 2011–2017. We did not plot the measured data at 1.3 and 2.3 GHz.
Figure 2.
The light curves of SS433 at 4.7, 8.2, 11.2 and 21.7 GHz with RATAN-600 during 2011–2017. We did not plot the measured data at 1.3 and 2.3 GHz.
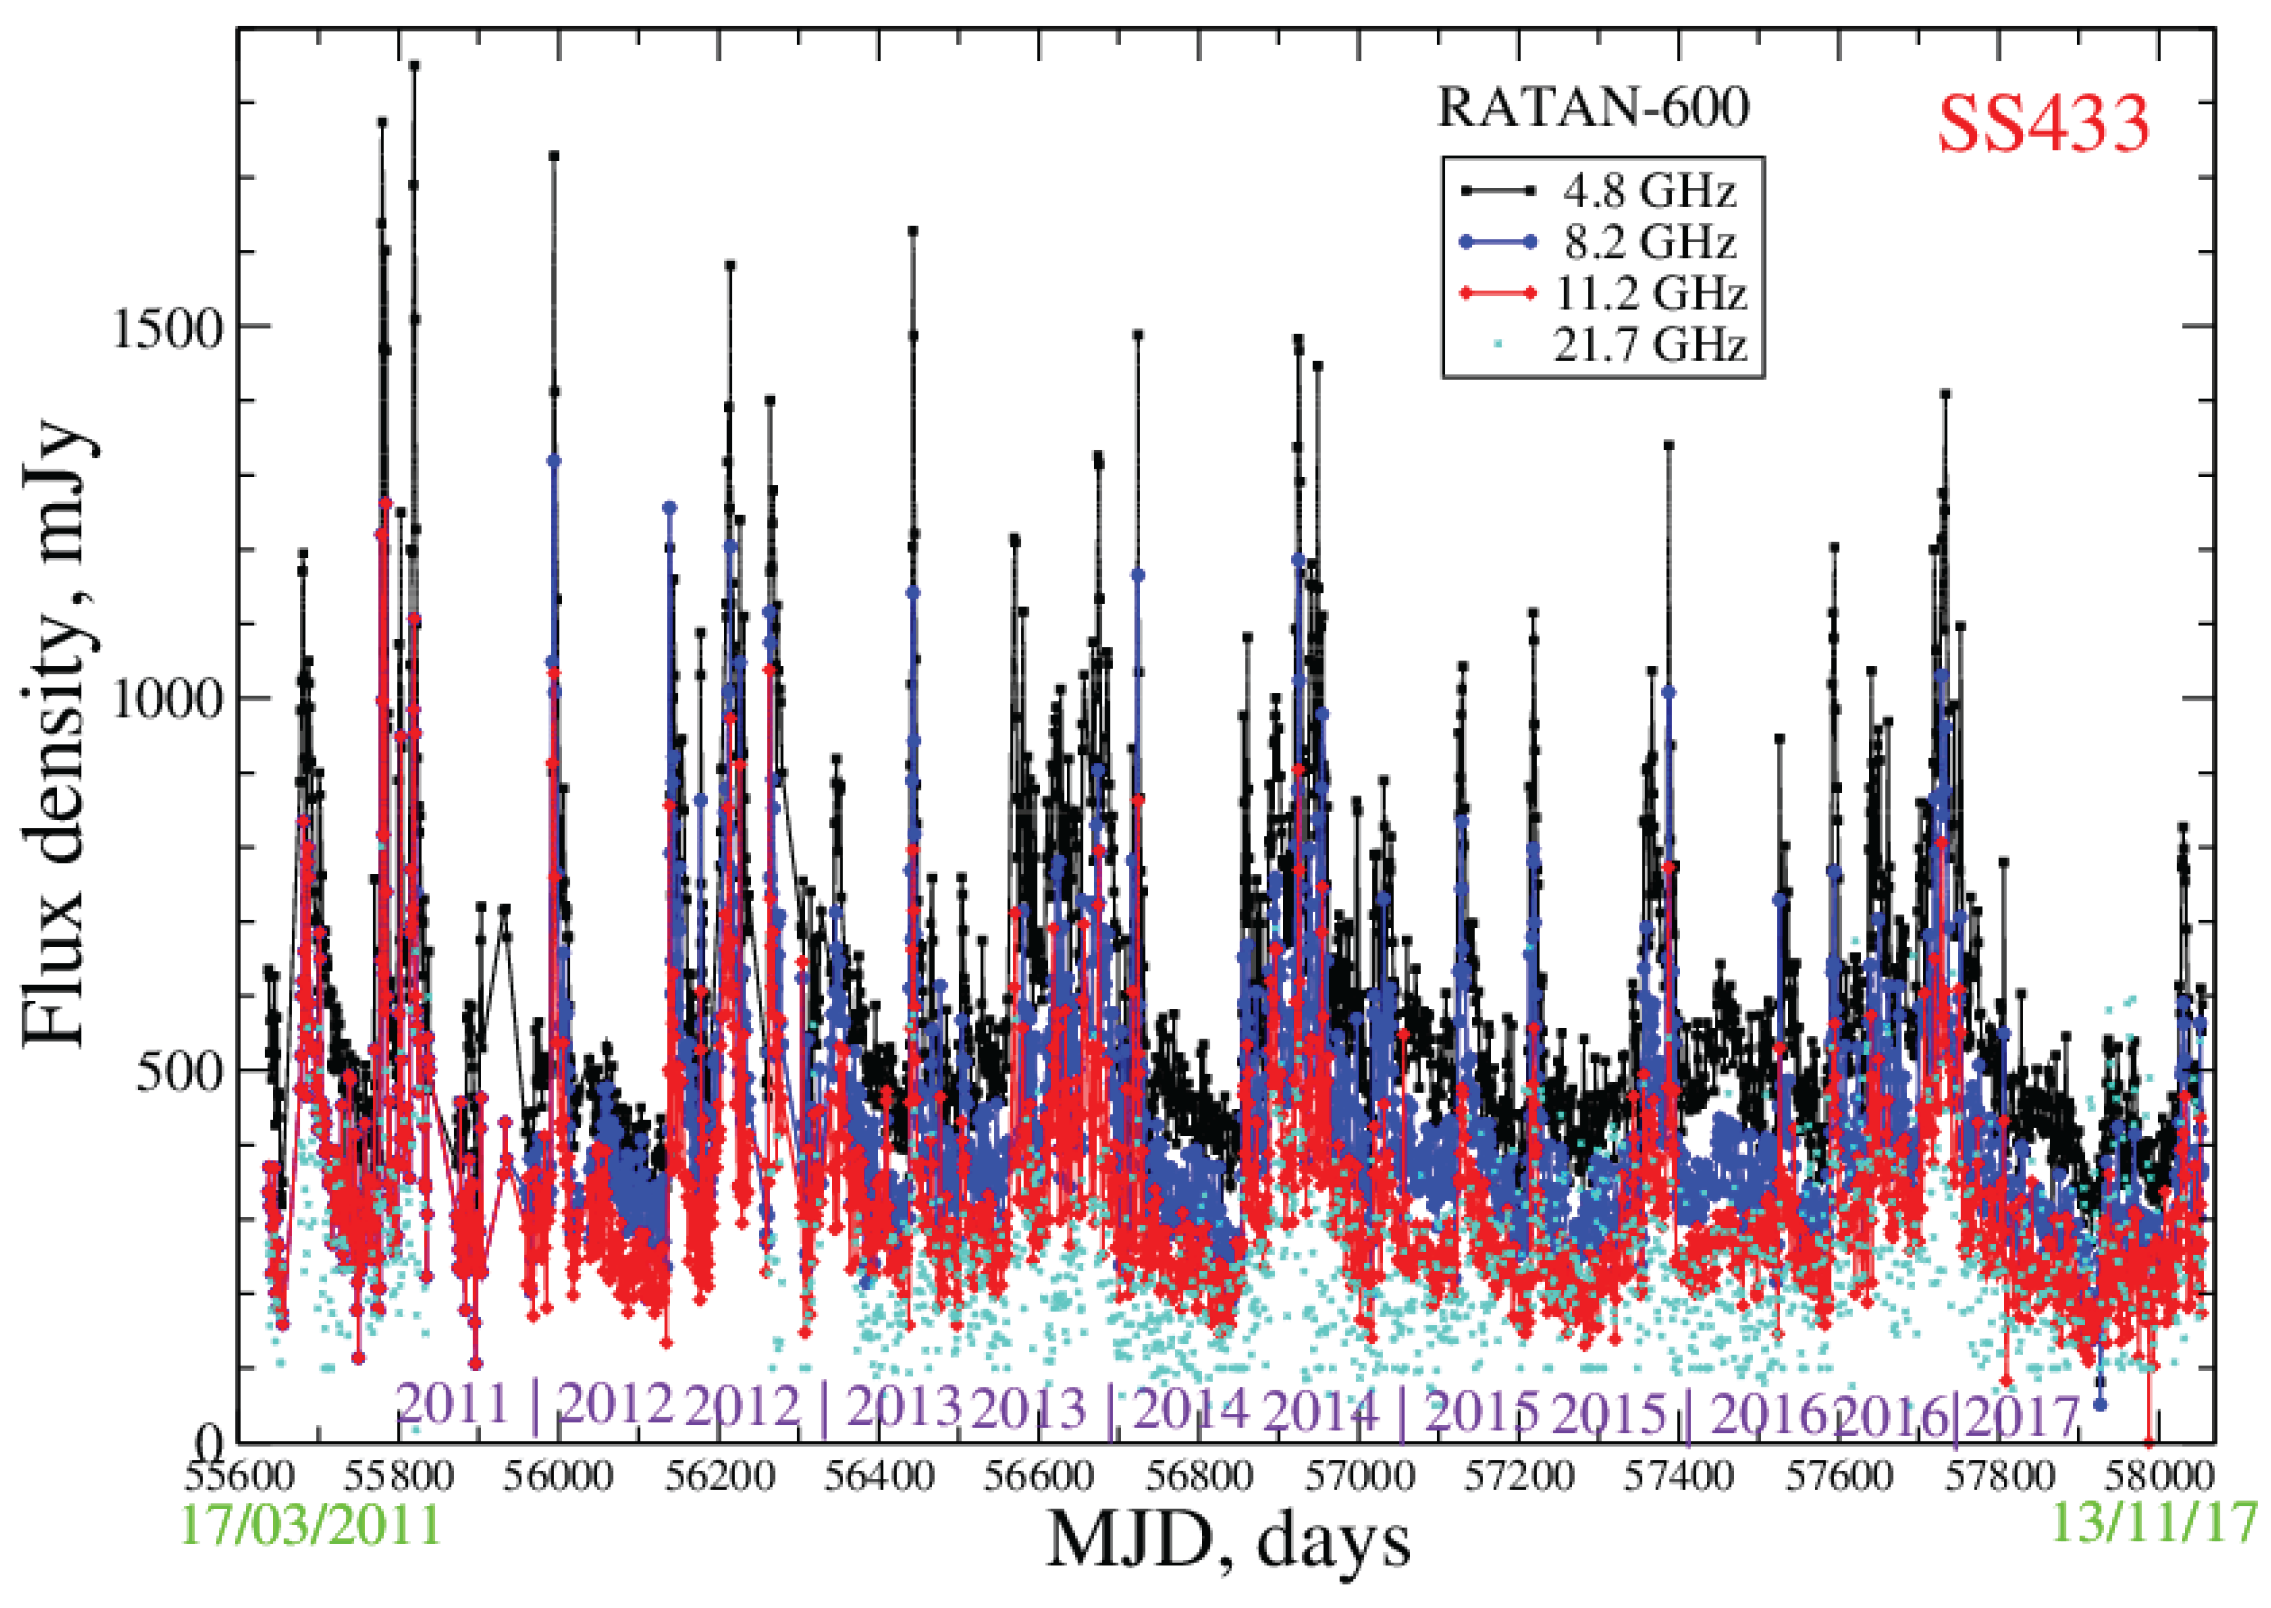
Figure 3.
The light curves of Cyg X-1 at 4.7 GHz (top) and Swift/BAT 15–50 keV (bottom) in 2016–2017. The positive correlation is significant.
Figure 3.
The light curves of Cyg X-1 at 4.7 GHz (top) and Swift/BAT 15–50 keV (bottom) in 2016–2017. The positive correlation is significant.
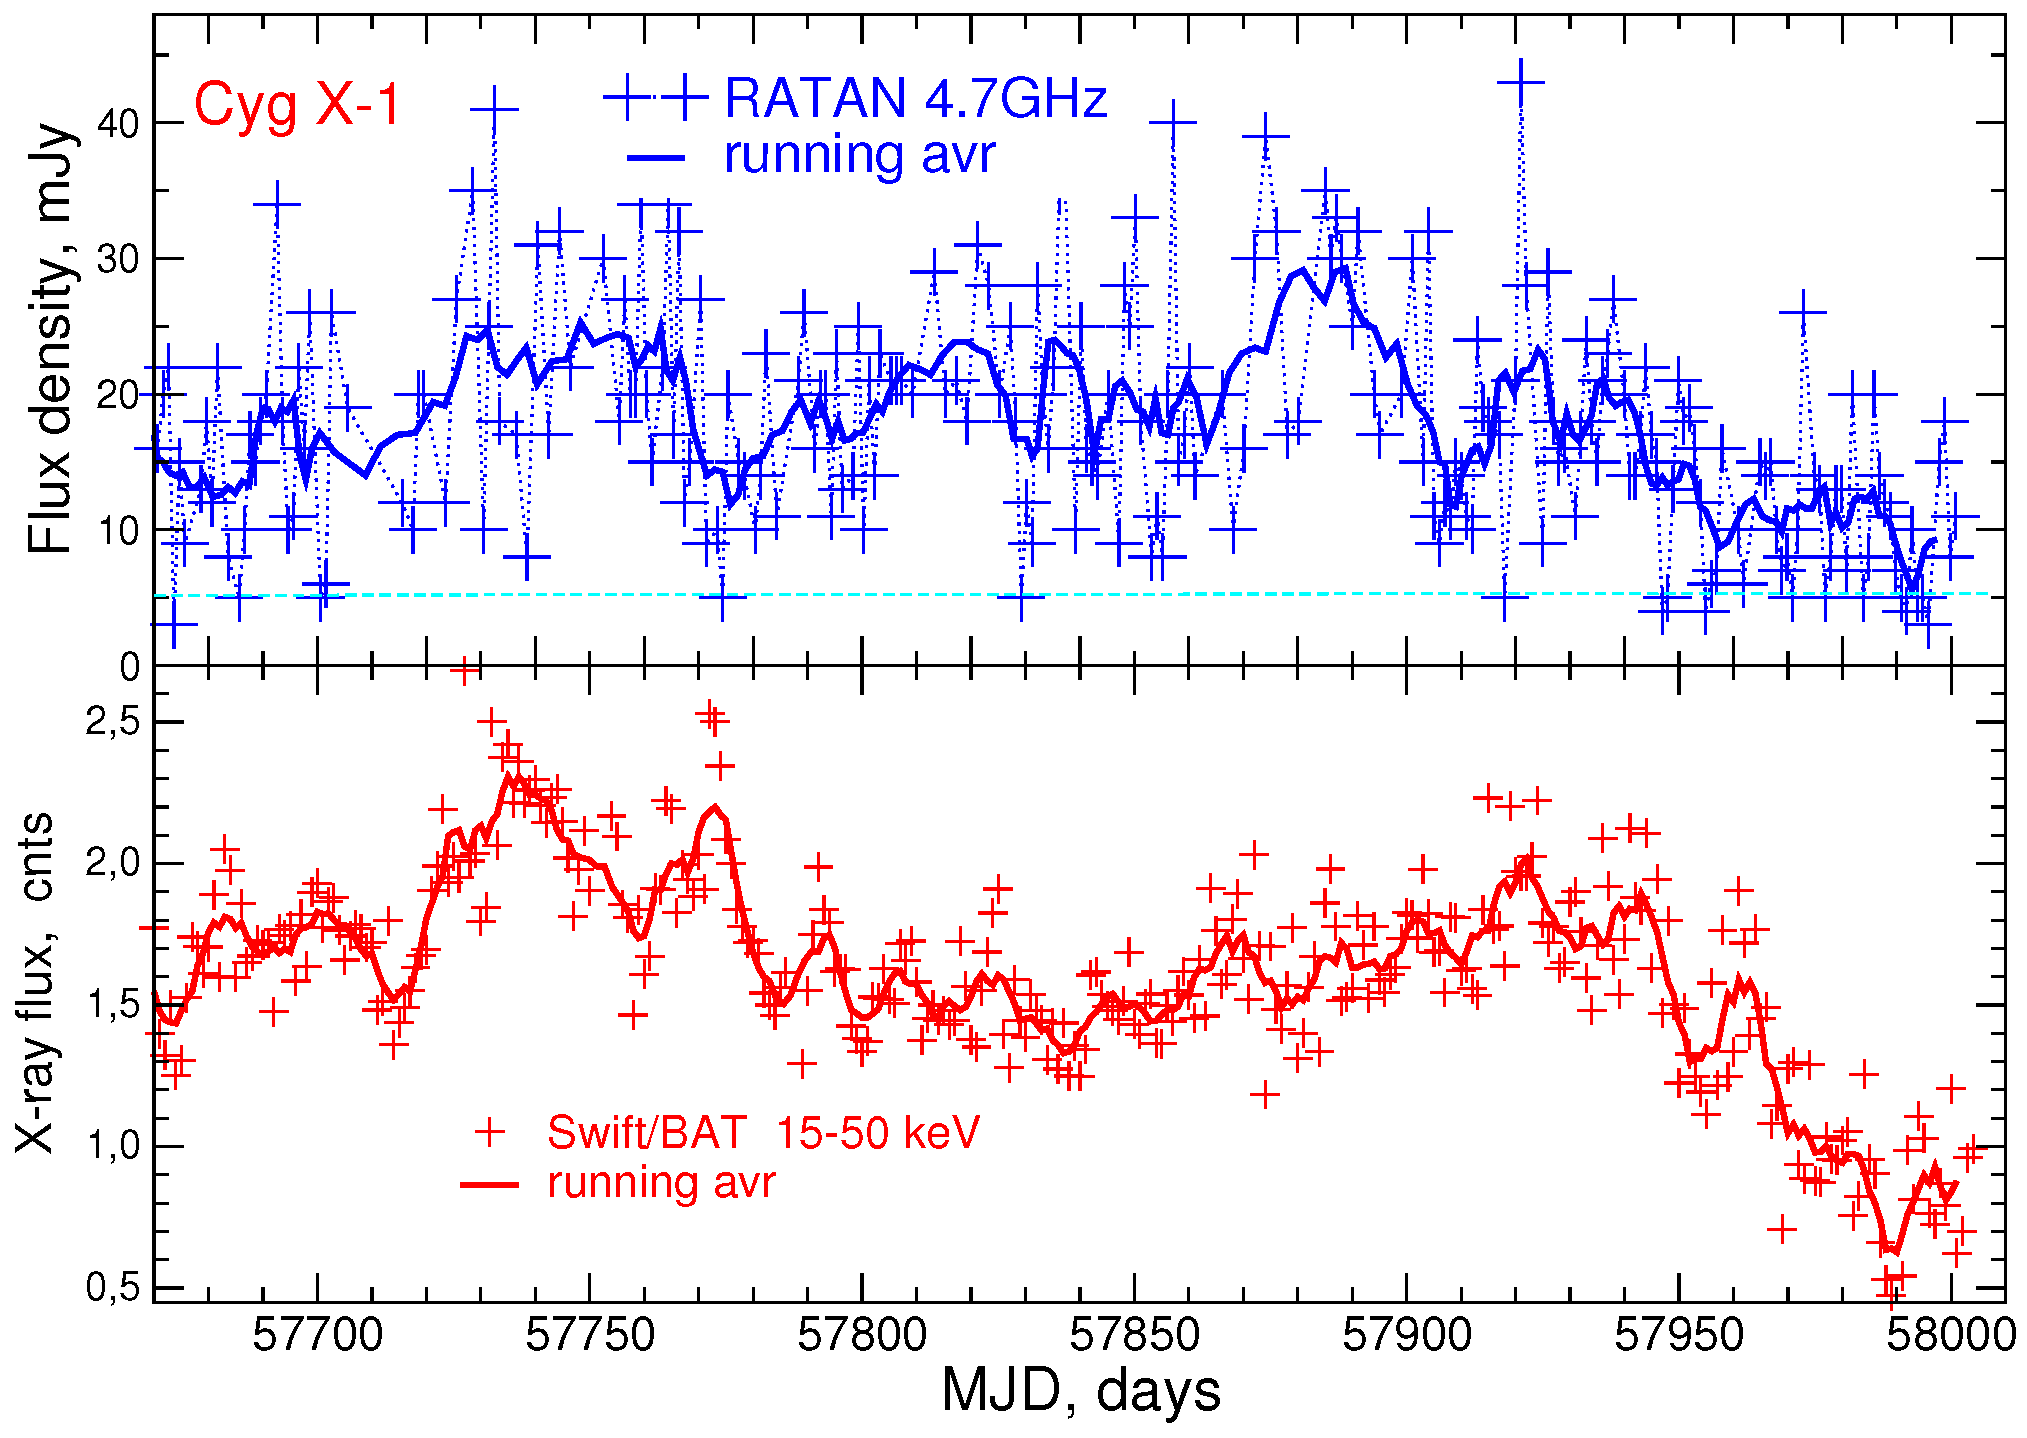
Figure 4.
The light curves of GRS1915+105 at 4.7 GHz and MAXI 2–20 keV in 2016.

Figure 5.
The light curves of LS5039 at 4.7 GHz from February 2014–September 2017. The radio fluxes have strongly changed day by day, but the smoothed light curves are relatively stable.
Figure 5.
The light curves of LS5039 at 4.7 GHz from February 2014–September 2017. The radio fluxes have strongly changed day by day, but the smoothed light curves are relatively stable.

Figure 6.
The radio light curves LSI+61303 at 2.3, 4.7 and 11.2 GHz during the last 52 orbits in 2013–2017. Maxima of the radio flares and its orbital phase change from 80–300 mJy and from 0.4–0.8, respectively.
Figure 6.
The radio light curves LSI+61303 at 2.3, 4.7 and 11.2 GHz during the last 52 orbits in 2013–2017. Maxima of the radio flares and its orbital phase change from 80–300 mJy and from 0.4–0.8, respectively.

Figure 7.
The radio light curves of LSI+61303 at 2.3, 4.7 and 11.2 GHz for last 10 orbits since the end of 2016 (Left) and the spectral index (Right).
Figure 7.
The radio light curves of LSI+61303 at 2.3, 4.7 and 11.2 GHz for last 10 orbits since the end of 2016 (Left) and the spectral index (Right).

© 2017 by the authors. Licensee MDPI, Basel, Switzerland. This article is an open access article distributed under the terms and conditions of the Creative Commons Attribution (CC BY) license (http://creativecommons.org/licenses/by/4.0/).
Share and Cite
MDPI and ACS Style
Trushkin, S.; Nizhelskij, N.; Tsybulev, P.; Zhekanis, G. The Jets of Microquasars during Giant Flares and Quiet State. Galaxies 2017, 5, 84. https://doi.org/10.3390/galaxies5040084
AMA Style
Trushkin S, Nizhelskij N, Tsybulev P, Zhekanis G. The Jets of Microquasars during Giant Flares and Quiet State. Galaxies. 2017; 5(4):84. https://doi.org/10.3390/galaxies5040084
Chicago/Turabian StyleTrushkin, Sergei, Nikolaj Nizhelskij, Peter Tsybulev, and Gennadij Zhekanis. 2017. "The Jets of Microquasars during Giant Flares and Quiet State" Galaxies 5, no. 4: 84. https://doi.org/10.3390/galaxies5040084
Note that from the first issue of 2016, this journal uses article numbers instead of page numbers. See further details here.