1. Introduction
Active galactic nuclei (AGNs) are powerful objects that are fed by supermassive black holes (SMBHs) at their centers. In the radio regime, radio-loud AGNs are dominated by synchrotron emission from their core, the radio jets, and the radio lobes. Understanding how the surroundings of these powerful radio objects are shaped, how the emitted radio components (i.e., jets and lobes) interact with the ambient medium, is important for studying the evolution and feedback of this class of objects and for understanding the formation and launching mechanism of the radio jets. This can be done by studying broadband polarization data. Some radio observatories, e.g., the Jansky Very Large Array (JVLA), have recently performed wideband upgrades to their receivers that allow one to collect, with very high sensitivity, well-sampled total intensity and polarized data within a wide frequency range. Polarized signals carry information about the ambient medium, and indeed several important polarization studies have been published over the last few years (e.g., [
1,
2,
3]), but in these works the data have been collected at different narrow frequency ranges. One group of researchers has recently discovered the power of collecting wideband data (e.g., [
4,
5,
6]). With the presented results, we are going to persuade the reader that the broadband spectropolarimetry technique is a very powerful tool for investigating the surroundings of astrophysical objects.
Following [
7], the complex linear polarization is
, where
I,
Q, and
U are the measured Stokes parameters, and
and
are the fractional polarization and the polarization angle of the polarized wave, respectively, described as
, where we consider
and
as the fractional values of the Stokes parameters
Q and
U, respectively, as used in [
8], and
. The study of polarization properties demonstrates two important effects: Faraday rotation and Faraday depolarization. Faraday rotation is the rotation of a polarized angle that occurs when the radiation from a synchrotron-emitted source passes through a magneto-ionic medium, while Faraday depolarization is the reduction of fractional polarization with increasing wavelength due to the presence of a magnetized and dense medium surrounding and/or interacting with the emitting radio source.
The study of how these two properties, together with polarization parameters, i.e.,
p and
, behave in jets of AGNs are of special relevance when the orientation of the magnetic field structure on the plane of the sky is to be determined. Through such study, a possible helical magnetic field configuration can be identified as a mechanism for the formation and collimation of relativistic jets, and the possible interaction between the relativistic jet and the ambient medium can be explained. This preamble has been taken as a starting point for many high angular resolution observations (e.g., [
9,
10]).
Faraday rotation is generally described, in the simplest scenario in which the emitted radiation goes through a single uniform Faraday screen in the foreground, with the following rotation measure (RM) [
11]:
(rad/m
). Traditionally, the RM has been determined by fitting the equation:
where
is the intrinsic polarization angle. In more realistic astrophysical cases, a nonlinear behavior of the polarization angle, and hence a complex Faraday structure, occurs (e.g., [
4,
12]).
Faraday depolarization has been studied for many years, and depolarization models have been proposed (e.g., [
7,
11,
13]). The depolarization mechanism can be divided into two big families: internal depolarization and external depolarization. The former occurs when the synchrotron-emitting and the Faraday-rotating regions are spatially coincident—the latter when the synchrotron-emitting and the Faraday-rotation regions are different. Generally, in the first case, the synchrotron radiation coming from the jets passes through a medium that contains thermal or non-thermal electrons (e.g., slow wind covering the spine relativistic jet); in the second case, the synchrotron radiation passes through an external thermal medium, hence the existence of foreground clouds interacting with the jet.
As suggested by the authors of [
8], in order to extract information about the magneto-ionic medium, it is necessary to study and model the fractional polarization p(
) and the polarization angle
in the lambda-squared domain, the so-called “qu-fitting.” Only recently has this new method been successfully performed (e.g., [
5]), thanks to the updated radio receivers at some of the radio observatories. In this study in particular, broadband polarized data with a high signal-to-noise ratio (S/N) have been modeled.
Here we want to underline how powerful this new method of qu-fitting is. Some of the results that are described in detail in [
4] are shown. The sample and data reduction are briefly described in
Section 2; an explanation on how the qu-fitting has been performed appears in
Section 3; results and discussion are given in
Section 4, and
Section 5 concludes.
2. Sample and Data Reduction
The sample used for high-sensitivity broadband JVLA observations is composed of 14 unresolved quasar (QSO) types, selected to have strong depolarization at 1.4 GHz in the NRAO VLA Sky Survey (NVSS) [
14] and to have high RM values, measured in previous single-dish work [
12] where RM
≥ 500 rad/m
. The sample was observed in full polarization mode at L, C, and X bands with the JVLA. Based on the highest angular resolution reached with these JVLA observations (0.6” at X band for the B configuration) and the redshift of the sources (the median value is z ≈ 1.5), we were able to determine an upper limit of their linear sizes. Our observations are sensitive to regions smaller than ∼5 kpc.
Data were edited and calibrated using the data-reduction package CASA (Common Astronomy Software Applications
1; version 4.4.0) following standard JVLA procedures. All targets were bright and their emission was dominated by a point-like component. We obtained signal-to-noise ratios (S/Ns) larger than approximately 30 for the total intensity at all observed frequencies and S/Ns larger than ≈3 for the polarized intensity (with 80% of the polarized data points having S/Ns ≈ 100). In each session, we included observations of a standard flux/polarization angle calibrator, as well as a leakage calibrator.
Images of Stokes parameters
I,
Q, and
U were made for each 64 MHz spectral window (spw) at L band and for each 128 MHz spw for C and X bands. We performed a Gaussian fit to the source extracting information on the Stokes parameters in order to study the total intensity spectra (at L, C, and X bands) and the polarized spectra (at C and X bands) of the sources. Details about the polarization calibration are reported in [
4].
3. Depolarization Modeling
We briefly report below the most important depolarization equations available in the literature, but an exhaustive description of the depolarization models are reported in [
7,
11,
13]. A plot of the different depolarization mechanisms is shown in Figure 5 in [
4]. We encourage the reader to look at this plot; it would help the reader to better visualize the different mechanisms. Depolarization, when it occurs, can be considered
external or
internal. When the synchrotron radiation is passing through an external magneto-ionic medium that contains a turbulent magnetic field, the depolarization is called external faraday dispersion/beam depolarization (EFD/Bd) and it is represented by the equation [
11]
where
is the Faraday dispersion, which measures the turbulence of the magnetic field within the telescope beam [
8], and RM is the mean RM across the source on the sky.
When the synchrotron-emitting regions and the Faraday-rotating regions are mixed together, the depolarization is internal. The main equations that describe this depolarization scenario are the (1) internal Faraday dispersion (IFD) and the (2) differential Faraday rotation (DFR [
15]).
The IFD occurs when the synchrotron-emitting and Faraday-rotating region contains a turbulent and regular magnetic field, and the equation is written:
where
. In this case, depolarization occurs because of the combination of both the presence of a regular magnetic field and the turbulent magnetic field.
The DFR occurs when
= 0 (i.e., no turbulent magnetic field component). The emitting and rotating regions are only co-spatial in the presence of a regular magnetic field, that is, the DFR. The complex degree of polarization is given by
where
is the Faraday depth through the region. In this case, the radiation coming from the most distant part of the region (with respect to the observer) undergoes a different amount of Faraday rotation with respect to the radiation coming from the nearest part of that region.
The JVLA observations revealed complex behavior both in the total intensity radio spectra and in polarization (see
Section 4). We therefore might expect a complex behavior also in the polarization information with the presence of multiple interfering RM components. We performed the qu-fitting, i.e., we fitted the wideband Stokes
q and
u spectra in the lambda square domain following the procedure proposed by the authors of [
5,
8]. We fit multiple-component RM models, simply constructed as
[
5]. Assuming optically thin emission and a single spectral index for all emission components, the depolarization models described above can be broadly represented by the following complex polarization equation:
where
j represents the several Faraday components used for the fitting,
is the intrinsic fractional polarization,
is the intrinsic polarization angle, and
and
describe the variation of the RM in a regular and turbulent magnetic field, respectively. This is the only equation that we used to fit our data.
We limited the number of the Faraday components to three, such that
. Adding more Faraday components in some cases would have improved the model fit, but there would have been no physical reason for this. We attempted to explain, as a first step, the complexity of the targets using the minimum number of Faraday components with the best statistics. Reduced
, standard deviation
, the Bayesian information criterion (BIC), and the Akaike information criterion (AIC), together with a visual inspection, were employed in order to evaluate the quality of the fit. In order to compare the several polarization properties (RM,
and
) for each source, we weighted the respective values to the number of Faraday components. We also corrected the measured RM for the Galactic foreground RM contribution (GRM) using the galactic RM map performed by the authors of [
16]. We obtained the residual rotation measure (RRM), by subtracting the polarization-weighted RM (RM
) and the GRM, and the weighted
and
.
4. Results and Discussion
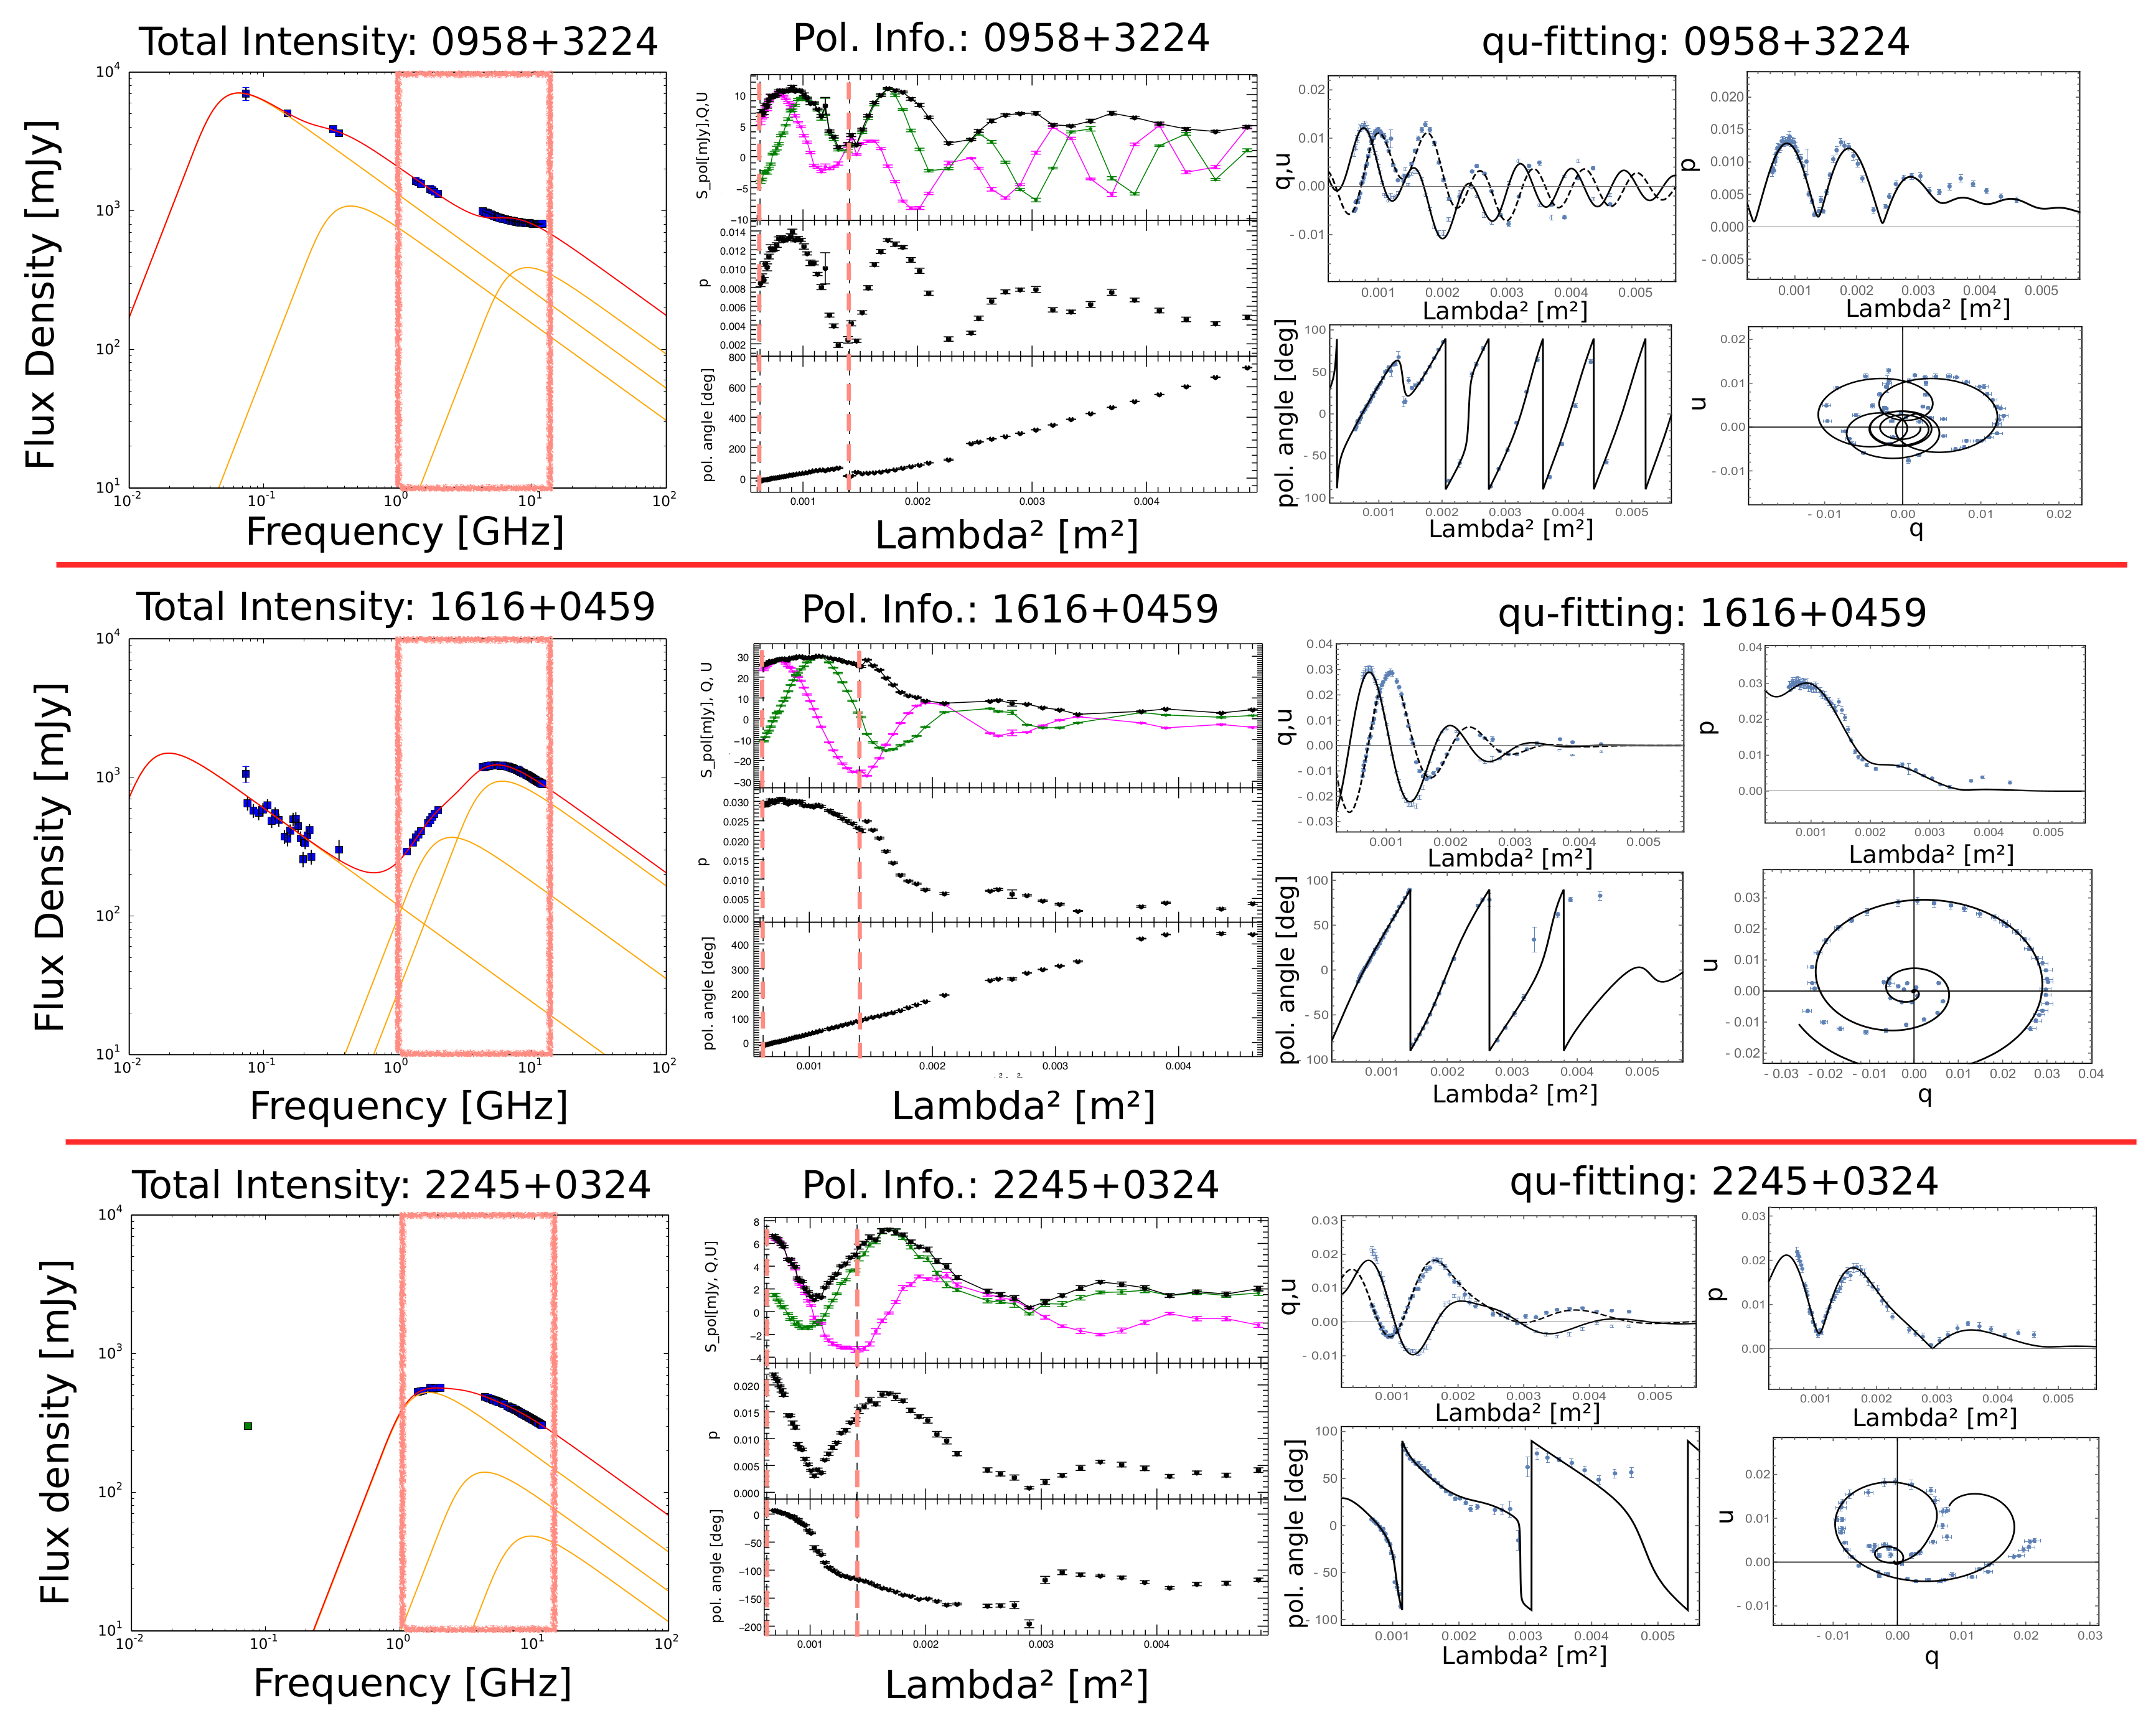
The radio spectra together with the polarization information and the performed qu-fitting for three sources chosen as example (0958+3224, 1616+0459, and 2245+0324) are shown in
Figure 1. Total intensity spectra have been fitted using a combination of several synchrotron components as well as data at lower frequencies reported in several surveys, e.g., the recent broadband low-frequency data from the GLEAM survey [
17] (the detailed description of the total intensity fit is reported in [
4]). The observed polarization quantities (the Stokes Q and U together with the polarized flux density
S,
p, and
) at C and X bands are also reported. The polarized signal clearly shows a complicated behavior, with
p and
changing in a non-trivial manner. A significant deviation of
from a simple linear trend with
occurs (as originally reported in [
12]). Several Faraday components with different RM values are required to explain the complexity of these targets. In fact, after the qu-fitting, it is clear that the surroundings of these targets are very complex, as more than two Faraday components for the entire sample are required to fit the polarized data (see
Figure 1). In fact, for the sources shown here, we needed to fit three Faraday components for the source 0958+3224 and two Faraday components for the sources 1616+0459 and 2245+0324 (a detailed table with parameters resulting from the qu-fitting is given in [
4]). We also noticed that the depolarization occurring at C and X bands, for the majority of the sources of our sample, is explained by modeling Equation (
4) with only the contribution from
. Therefore, the depolarization is mainly due to the presence of turbulent magnetic fields (for detailed discussion, see [
4]).
The weighted parameters, i.e., RM
, the RRM, the
, and the
RM
reveal, once again, the complexity of the medium surrounding the sources [
4]. These values are considerably large with RM
and RRM of the order of 2 × 10
rad/m
and
and
RM
of hundreds of rad/m
, suggesting a highly magnetized and dense medium in the vicinity of the central engine.
We can conclude that the selection of unpolarized radio sources at low frequency (1.4 GHz in the NVSS) reveals a sample of sources with strong depolarization that is due to very high RM values and that thus has complex magneto-ionic media. These AGNs all seem to be associated with very turbulent magnetic fields. Moreover, the magneto-ionic medium that is depolarizing is very close to the central engine of the targets. In fact, we can estimate an upper limit on the linear size of the sources: ≈5 kpc. As a consequence, the dense and turbulent magneto-ionic medium close to the central black hole (BH) can be probed via the study and modeling of these polarized data. Therefore, we can also assert that the magneto-ionic medium that causes Faraday rotation and depolarization is local to the source, with high electron densities and strong, turbulent magnetic fields. The complex media detected at C and X bands can be visualized with highly turbulent clouds in the proximity of the emitting radio source. The radiation coming from the radio jets, emitting synchrotron radiation, can be embedded or pass through very complex and turbulent clouds. These statements can be made thanks to the synergy that exists between broadband data and qu-fitting. This new method of modeling the polarization signal can thus be used to unveil polarized components, previously hidden by a lack of data coverage.
5. Conclusions
We present here some of the results (a detailed description of the work is reported in [
4]) of the JVLA full polarization observational campaign at L, C, and X bands (1–12 GHz) on a sample of AGNs that are unpolarized at 1.4 GHz (in the NVSS survey [
14]) and that have high RMs, which were detected in [
12]. Total-intensity and polarized-intensity data among the whole observational frequency range have been collected. We fit the total intensity radio spectra with several synchrotron components. We analyzed broadband spectro-polarimetric data across the JVLA C and X bands via the new qu-fitting method. Depolarization modeling required several Faraday components (at least two Faraday screens) to represent the complexity of the sources. Moreover, these magneto-ionic media are close to the central engine and have with high-electron density and strong, turbulent magnetic fields. In fact, the analysis of the polarized parameters (RRM,
, and
RM) reveal extreme conditions of the medium surrounding the AGNs with hundreds or thousands of rad/m
.
These broadband JVLA data show, without any doubt, the complexity of radio sources both in total intensity and in polarized intensity. Thanks to the high spectral resolution of these data, it was possible to follow the dramatic changes of the polarization information of these AGNs across a wide range of frequencies, and to model, with very good accuracy, the complexity of the polarization behavior. The new qu-fitting technique applied to broadband polarization data can be used to map the medium of these radio sources. Radio spectro-polarimetric observations, together with the qu-fitting method, can be used to unveil magnetized structures in radio AGNs.
Overall, this study paves the way for future broadband spectropolarimetric studies with large-area surveys (e.g., VLASS and ASKAP-POSSUM) that will greatly improve the statistical study of the magnetized properties of radio AGNs and their environments.

 ,
, 