Multi-Wavelength Observations and Modeling of Loop I †


1
Lebedev Physical Institute, Moscow 119333, Russia
2
Raman Research Institute, Bangalore 560080, India
†
This paper is an extended version of our paper published in Three elephants in the gamma-ray sky: Loop I, the Fermi bubbles, and the Galactic center excess.
Galaxies 2018, 6(2), 62; https://doi.org/10.3390/galaxies6020062
Submission received: 24 February 2018
/
Revised: 11 May 2018
/
Accepted: 4 June 2018
/
Published: 7 June 2018
(This article belongs to the Special Issue Searching for Connections among the Fermi Bubbles, the Galactic Center GeV Excess, and Loop I)
Abstract
:The article aims to overview the origin and current dynamical state of a giant structure on the northern galactic sky—the radio Loop I extending from ≈ to ≈ in longitudes and up to ≈ in latitudes over the Galactic center (GC). The main issue addressed here is a description of possible sources of mass and energy able to build up the Loop I and associated structures seen in X-ray, 21 cm, far infrared (FIR), and maintain them on long timescales. This region of the sky is highly crowded, such that contaminations from many projected structures can be tangled, and not always current direct observations look sufficient to disentangle them. At such conditions indirect arguments based on analysis of underlying star formation (SF) rate, morphological features in radio, X-ray and FIR may be important for understanding the origin of Loop I. Simple estimates show that the observed rather weak SF rate is able to create and maintain Loop I, and under certain circumstances can provide the observed east-west asymmetry. However, an explanation of an apparent coexistence of morphologically similar HI and FIR filaments close to Loop I is challenging, indicating that most likely they may belong to the foreground. Recently discovered absorptions in diffuse interstellar bands seem to confirm this picture.
1. Introduction
Brief history. The existence of a bright radio-spur originating near the Galactic plane (b ≃ ) and extending up to latitudes b ∼ —referred to as the North Polar Spur (NPS)—has became known since the pioneering observations at Jodrell Bank in late 1950s, and was clearly articulated first apparently by Hanbury Brown et al. [1]. Haslam et al. [2] concluded that the NPS is the brightest north-east part of the circle-like structure with a diameter ∼ defined later as Loop I. They also resolved a narrow neck connecting the NPS to the plane at () and several filamentary structures, what might hint on dynamical interaction of Loop I and the Galactic disk. Later, an intensive study of radio sky with higher resolution has revealed several loop-like structures defined as Loop II, III and IV [3,4,5].
Concepts. In spite of a 60 year long history of theoretical understanding of these radio loops and all related structures discovered in the area later, is still illusive. Historically two different points of view are established by the end of 1980s, and to a certain extent they still remain in competition: one suggests predominantly local origin of an expanding superbubble driven by stellar activity in nearby OB associations and local spiral arms within the solid angle ∼ pointing towards , the other point of view is that the NPS and related structures originate near the Galactic center (GC).
Sco-Cen-centric model. The first point of view is based on a simple and naturally attractive assumption that connects the four round-shaped loops with large faint supernova remnants in a relatively nearby interstellar medium (ISM) [2,4], and/or with a joint envelope from stellar wind of Sco-Cen OB association. This point of view lies close to the concept of giant HI supershells ubiquitously produced in the ISM disk by OB-associations with total energy release up to 10 SNe [6,7], see also theoretical arguments in [8], and later development in [9]. Sco-Cen is the nearest such region of a recent active star formation [10], and given its current position falls into the direction of the center of Loop I, it seems likely to be a very natural source of energy for maintaining this structure.
Galacto-centric model. The second emerged from 10 GHz observations of an -shaped lobe extending upward at in the very central Galactic region () [11].
Line of sight spread model. A complementary model was drawn by Sofue [12] who associated the spur-like structures with synchrotron ’banks’ elevated up to ∼1 kpc above the local (within ∼3 kpc) spiral arms. In this scenario, a slight (20 to 30) inclination of the spurs in the anticenter direction is explained by the ram pressure of an outward blowing gas or magnetohydrodymic waves from the Galactic center [12,13]. Later on such kind of structures have been described numerically in 2D MHD as hydraulic jumps combined with shocks from spiral density waves—the resulted plum-like vertical structures extending up to ∼0.5–1 kpc [14,15].
It is clear that the whole variety of structural features observed toward the Galactic center stems from crowded events along the line of sight. The problem is therefore to disentangle superposing contributions and identify the driving sources.
With rather uncertain distances inferred from the galactic rotation curve within , a reliable complementary tool for distance measurements is 3D-reddening measurements [16], (see, also [17]). In such circumstances, a reasonable compromise for understanding a qualitative picture can be found in estimates of timescales, gas and dust mass and energy budget, synchrotron emission (magnetic field, spectral index), morphological features of the structures etc. The following issues are therefore critical for understanding the origin of Loop I:
- Energetics: whether the underlying star formation and supernova (SN) rates during the history of Loop I formation are sufficient to feed it?
- Mass budget: whether the gas mass confined into Loop I (accounting in particular, X-ray gas in the NPS) is consistent with the overall evolutionary scenario? (see also [18]).
- Dust mass budget: whether the dust mass as inferred from infrared observations fits this evolutionary path, particularly when the morphology of dust distribution and its temperature with possible dust sputtering in high temperature environment of the NPS are accounted for?
- HI and its kinematics: what would be the fraction of atomic hydrogen in the expanding shell associated with Loop I and whether it is consistent with observational data? Whether the velocity field in 21 cm toward the Galactic center adequately displays the expanding supershell associated with Loop I? (see also [19]).
- Synchrotron: are characteristics of synchrotron emission in Loop I (spectral index, magnetic field) are compatible with its evolutionary scenario? (see also [20]).
- Time scales: whether typical time scales: dynamical, radiative cooling, and dust destruction, do fit the evolutionary scenario?
- Morphology and asymmetry: is Loop I (and the X-ray NPS) physically and genetically connected to the Fermi Bubbles?
Understanding these questions will provide generic qualitative constraints on evolutionary scenarios and physical mechanisms. In this review we will discuss energetics and mass budget of Loop I and their correspondence to the observed star formation rate in the underlying disk as the principal energy source. We focus on the morphological consistency of Loop I as seen in X-ray, synchrotron, HI and FIR emissions. Recently discovered diffuse interstellar bands within 2–3 kpc from Sun and their relation to Loop I are also briefly discussed. A systematic analysis of the origin and the distance to the NPS and its relation to the Fermi bubbles based on X-ray and gamma-ray data is given in the review by Kataoka et al. [18] in the same special issue of the Galaxies journal.
2. Evolution of Loop I and Its Driving Engine
2.1. Energetics
2.1.1. Local Hot Bubble and the Supershell from Sco-Cen
Within the first scenario with a bubble produced by explosions of a few SNe and stellar wind in the Sco-Cen OB association in the last 3–5 Myr the required energetics is of the order of erg s, and the total energy released SNe [21,22]. One of the key arguments in [22] scenario is the morphology of a dark ring-like structure in the ROSAT low energy band keV (0.1–0.5 keV) which was attributed to absorption by thick HI ring formed as an overlap of the supershell from Sco-Cen OB association and the Local Hot Bubble (LHB) in which the Solar system is embedded.
The HI column density in the ring is cm as measured by Copernicus, IUE and EUVE ultraviolet (UV) satellites (see in [22]). This number is at least half an order of magnitude higher than would be expected: with the assumed radius of the supershell from the Sco-Cen of pc and the mean ambient density cm (see [23]), the swept up column density is cm. Similar numbers for and the swept-up column density can be inferred from more recent measurements of HI and H distribution in the inner galaxy (galactocentric radii kpc) by Marasco et al. [24], see their Figure 11 and Table 1.
Moreover, it has to be taken into account that the center of Loop I lies at around , and thus the median vertical position of the driving SN explosions in the Sco-Cen OB should be pc, i.e., nearly 1.5 of the H scale height (which is ≈50 pc, see top panel of Figure 10 in [24]). One would expect that at such circumstances the shock wave from the SNe will propagate predominantly upwards and hardly can break through the midplane of the gaseous disk to push sufficient amount of H gas towards the LHB. It is also worth noting in this connection that the effective (Gaussian) scale height of neutral ISM gas—HI along with H, is nearly flat pc within 2–10 kpc as derived from observations of ≈100 Galactic point X-ray sources [25], thus making this inconsistency even more severe. Note also that if the X-ray absorbing shell toward the NPS was produced by collective SN explosions in ambient gas with cm, the net radiative energy losses would increase the required SN energy by an order of magnitude SNe.
In this context a very important conclusion has been reached in numerical simulations of the timing of Fe isotop sediments in ocean by [26]: the mean ambient gas density (being assumed homogeneous) within the whole volume including LHB and Loop I may not exceed cm, otherwise the observed overabundant Fe would not appear in the Earth’s crust and ocean. If this the case, the discrepancy between the column density in the LHB–Loop I interface layer increases further: the estimated cm is an order of magnitude lower than the observed towards the center of Loop I [22]. In principle, the expansion law of SN remnants in a non-homogeneous (clumpy) medium with the mean density ( is the volume filling factor of clumps, the gas density in clumps) depends on the mean density approximately as Korolev et al. [27], such that the overall dynamical behavior remains close to what takes place in a homogeneous medium with density . Moreover, measurements of polarization within the ring in [28] show a strong asymmetry between east and west parts and do not confirm it to be a unique ring-like structure.
An additional difficulty is related to the ages of stellar populations in the Sco-Cen association—the median age is ≈15 Myr with a large scatter between the subgroups: Myr in Upper Scorpius, Myr in Upper Centaurus Lupus, and Myr in Lower Centaurus Crux subgroups [29]. Moreover, very recently Donaldson et al. [30] found a hierarcical decrease of ages in the US association on lower scales with Myr and Myr. At such circumstances a very rough estimate of the number of SNe what could have exploded 3–5 Myr ago is 3–10, which is apparently less than needed.1
The HI ring—the interface between the Sco-Cen superbubble and the LHB, shadows the NPS emission in the ROSAT low energy keV X-ray band. There is also shadowing in the higher energy ROSAT band (R5, 0.89 keV) seen as a sharp drop in X-ray counts at the latitudes , which can be attributed to absorption in the Aquila rift located much farther (at kpc) [32]. By assuming the NPS to be a part of a shell structure Sofue [32] put a lower limit of the distance to its center at 1.1 kpc, (see more detailed discussion in [18]).
Even stronger constraints have been inferred in [16] from an unprecedented analysis of absorption measurements of ROSAT R4, R5 and R6 (mean energies 0.725, 0.885, and 1.145 keV, correspondingly) and XMM-Newton data towards the terminus of NPS, accompanied with measurements of interstellar optical reddening within 3D Pan-STARRS survey and a fine spaced radio CO survey of the terminus region. One of the important consequences from scanning of the XMM-Newton surface brightness and hardness ratio, is that the NPS terminus extends lower toward the Galactic plane than might be expected if the absorption is attributed only to the local ring between the Sco-Cen superbubble and the LHB. Indeed, the regions contributing to X-ray hardening on lowest parts of the NPS terminus scanned in [16], likely lie beyond the Aquila rift, as suggested first by Sofue [32]. The absolute lower limit on distance to the NPS boundary is set to 260 pc from comparing the HI absorption toward 3 stars in the NPS field and XMM absorbing column density. A similar lower boundary (300 pc) is derived from comparison of reddening to 19 dedicated stars in the XMM field and of dust maps for a larger sample of Pan-STARRS stars from [17]. An additional interesting feature of the reddening measured by Pan-STARRS is its deficiency from 0.6 to 4 kpc, as clearly seen from Figure 11 in [16]. Indeed, with the assumed scale height of 130 pc the inferred column density at low latitudes () should have increased between 0.6 and 4 kpc from 40 to 60 ( cm), while it remains nearly constant. This observation shifts the upper estimate on distance to NPS to the Planck limit ≈4 kpc derived from comparison of Pan-STARRS and Planck reddenings [33].
Radio polarimetry of the inner Galaxy () at 2.3 and 4.8 GHz placed the NPS terminus at a distance 2–3 kpc [34]. Moreover, in [34] they found also the rotation of the position angle of magnetic lines at 2.3 and 4.8 GHz towards a particular sight-line ( with the highest polarization. Sofue [32] derived from here the lower estimate of the distance towards the NPS terminus ∼5 kpc.
This line of arguments converges to the second scenario. The very first detection of a structure expected from wind-like outflow (the Galactic Center Lobe—GCL) of the very galactic center, has been reported by Sofue & Handa [11] on the base of 10 GHz observations. The east-side and west-side spurs restricting this “outflow” were detected earlier at lower frequencies (see references in [11]). The spectrum is derived to be thermal—with the slope , the structure therefore represents HII gas with electron density cm and temperature K. The gas mass is , and the required energy is erg [11]. More precise estimate would increase the energy by at least 10 if radiation losses are taken into account (see Figure 1) provided the energy is injected by explosions.
Later on Sofue [36] identifies in the 20-cm VLA image of the Galactic center arc a set of concentric shell structures 20 west-side and 5 souther of the GCL, and attributes them to a recurrent star bust events during the last few Myr. It seems quite natural under such circumstances to assume explicitly that star formation activity in the Galactic center not only drives the small-scale structures observed in the very narrow central part, but might have provided energy for the larger scale structure like Loop I, as mentioned first by Oort [37] and by Sofue & Handa [11], Sofue [38]. Bland-Hawthorn & Cohen [39] combined 10 GHz data with mid-infrared (4.3–21 m) image of a bipolar structure by the Midcourse Space Experiment (MSX), and extended them to much larger scales from to to demonstrate their physical connection with the NPS (see their Figure 6).
2.1.2. Stellar Activity in the Central Molecular Zone and Loop I
The principal energy source for Loop I (and its hot X-ray NPS part) can apparently be connected only with stellar activity, and more explicitly with SN explosions; the luminosity of the supermassive black hole is too weak: ∼ of the Eddington luminosity, which is far from being sufficient.2 Therefore the key parameter determining energetics of Loop I is the SF rate in the central region within —the central molecular zone (CMZ) [40]. When averaged over the CMZ the current SF rate per unit area is kpc yr (see Figure 16 in [41]), which gives overall SFR yr.
It is worthwhile to note though that the optimistic conclusions by Sofue [36] and Bland-Hawthorn & Cohen [39] are drawn from a simplified hydrodynamical model of the central outflow, with the total energy injection from a few ergs [39] to ergs [38].3 The SF rate in the central zone has a large uncertainty with estimates4 ranging from to yr (see [39]). A more detailed state-of-the art simulation by Sarkar et al. [42] has confirmed such a conclusion: in order for the central activity to produce a large scale -shaped wind-driven supershell with radial and vertical sizes comparable to the observed in the NPS, the central SF rate has to be yr, with the estimated age of 24 Myr. This is at least factor 3 in excess of the observed SF rate: Spitzer and MSX data lead Yusef-Zadeh et al. [41] to conclude that the peak SF rate in the central 200 pc × 50 pc region traced by years young stellar objects (YSO) is yr. This estimate is likely an upper limit because not in all cases the sources from Yusef-Zadeh et al. [41] are indeed YSO. For instance, ref. [43] suggests that main sequence stars in the CMZ might “masquerade” as YSOs, which can cause a threefold overestimate of the SFR in this area. On a longer timescale an estimate yr is inferred from the nonthermal radio emission. Overall, Yusef-Zadeh et al. [41] assume for a recent SFR 0.04–0.08 yr, while over the Hubble time the following strict upper limit is put ≃ yr.
More recent estimates of the SFR yr within the last 0.1–3 Myr were derived from Spitzer and Herschel data by fitting fluxes at 24 m and 70 m, and the bolometric spectrum in the range 5.8 to 500 m [44].
Therefore, following these estimates and numerical models the observed SF rate in the Galactic center seems to be weaker than needed to produce large scale Loop I structure within the Galacto-centric scenario, unless the initial mass function of stellar population in the CMZ is a heavy-top type (see discussion in [45]).
2.1.3. Continuous Wind vs. Instant Implosions
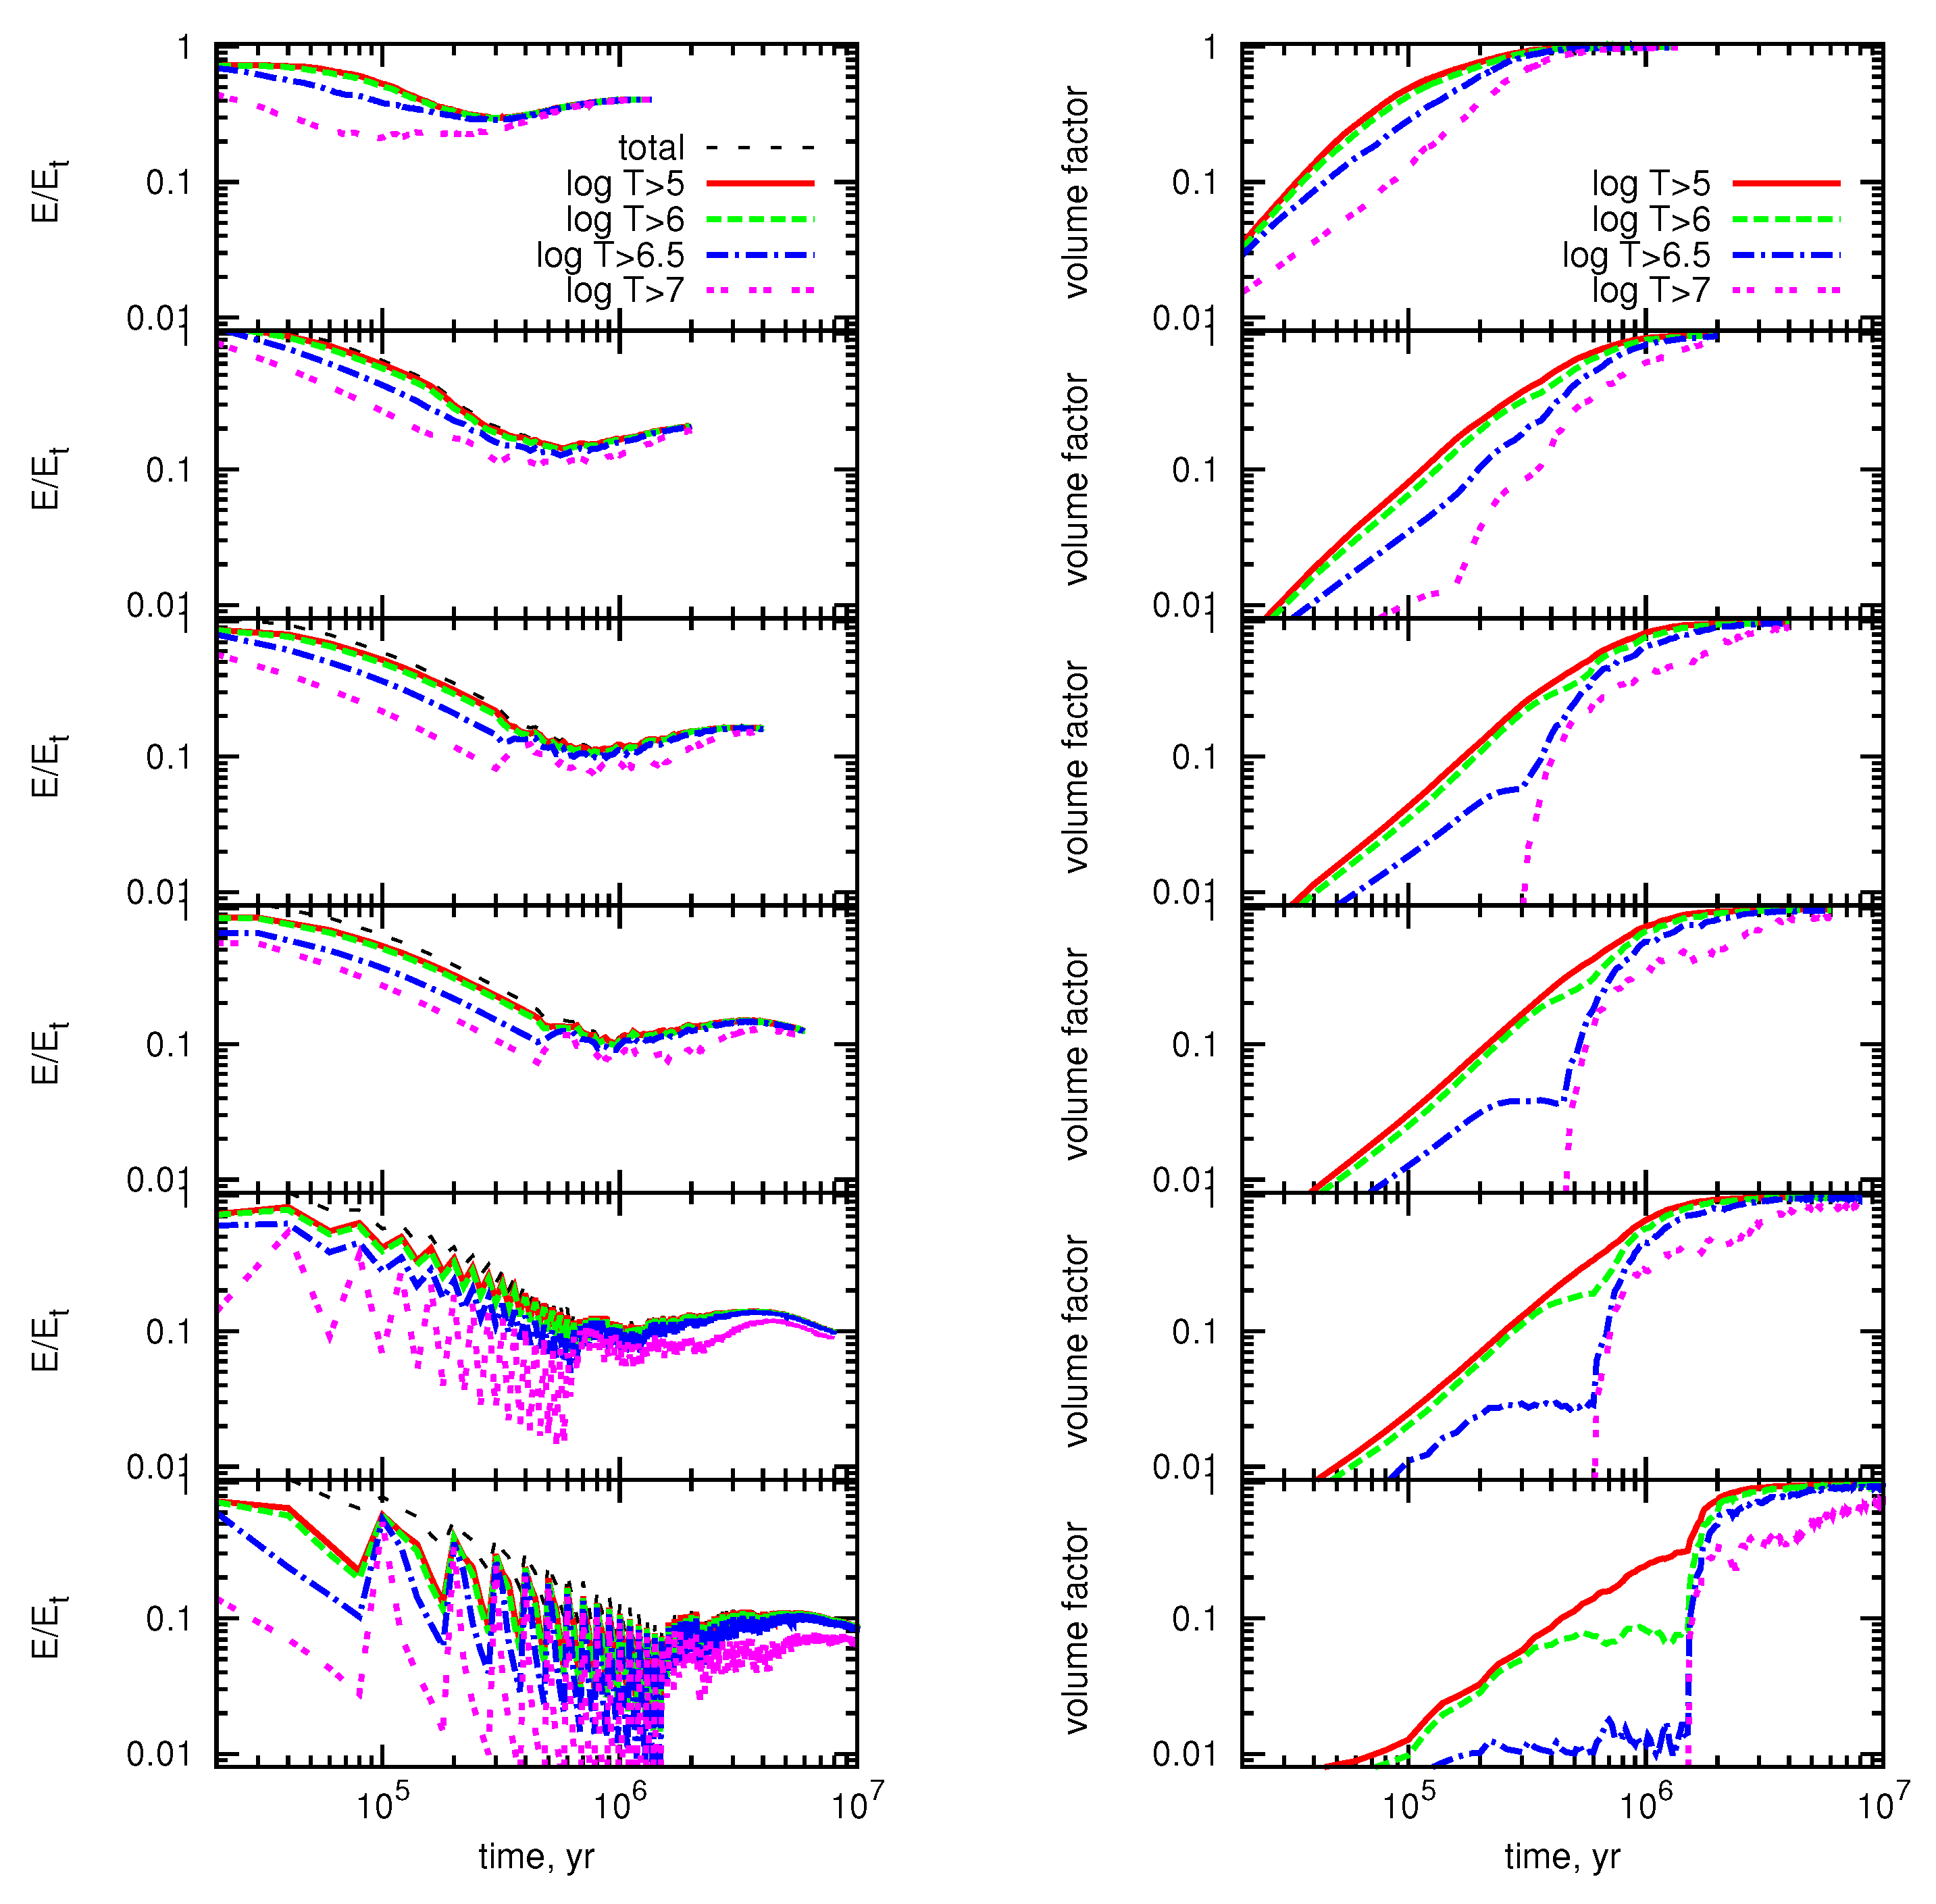
A possible solution of this inconsistency can be sought in changing the energy injection regime in the GC. An important detail of the numerical model by Sarkar et al. [42] is a continuous injection of energy and mass in a luminosity-driven wind regime. In a uniform (non-stratified) medium the wind regime is energetically the most efficient. The wind regime suggests frequent (“coherent”) SN explosions [46,47], in which case a smaller fraction of energy becomes lost, as obviously seen in Figure 1 [35]: at higher SN rates— yr pc, the fraction of total explosion energy retained at high temperatures approaches asymptotically . In a spherically symmetric model by Sharma et al. [48] the transition to the wind regime occurs when energy is injected by individual SN events with a rate higher than a certain critical value, such that thermolization occurs before a considerable fraction of energy is lost radiatively, see Figure 2. The differences in numerical values of SN rates and the fractions of lost energy between [35] and [48] are because in [35] SNe explode randomly in the volume 200 pc, while in [48] all energy in injected into the central numerical sphere with radius of 1 to 2 pc.
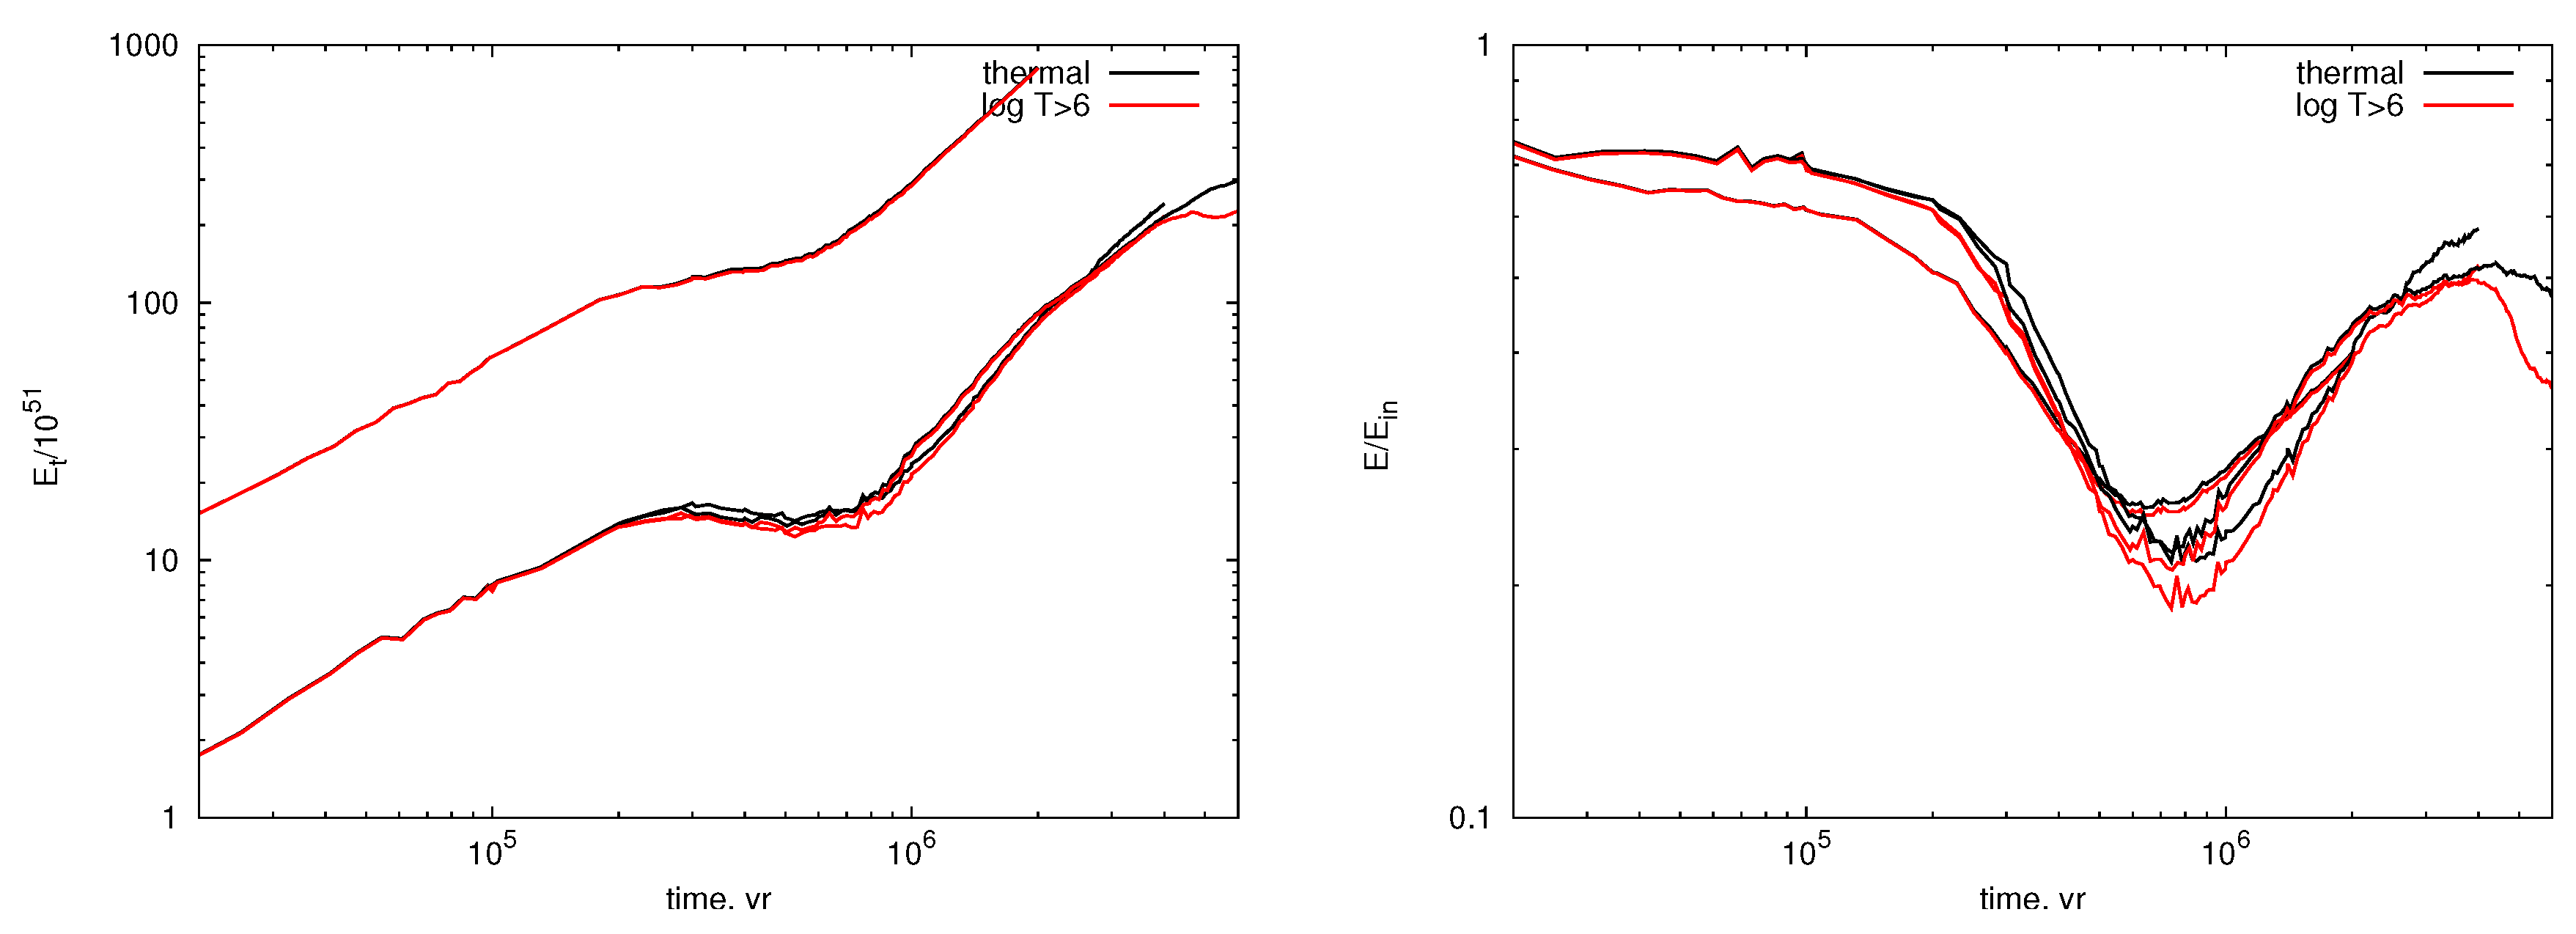
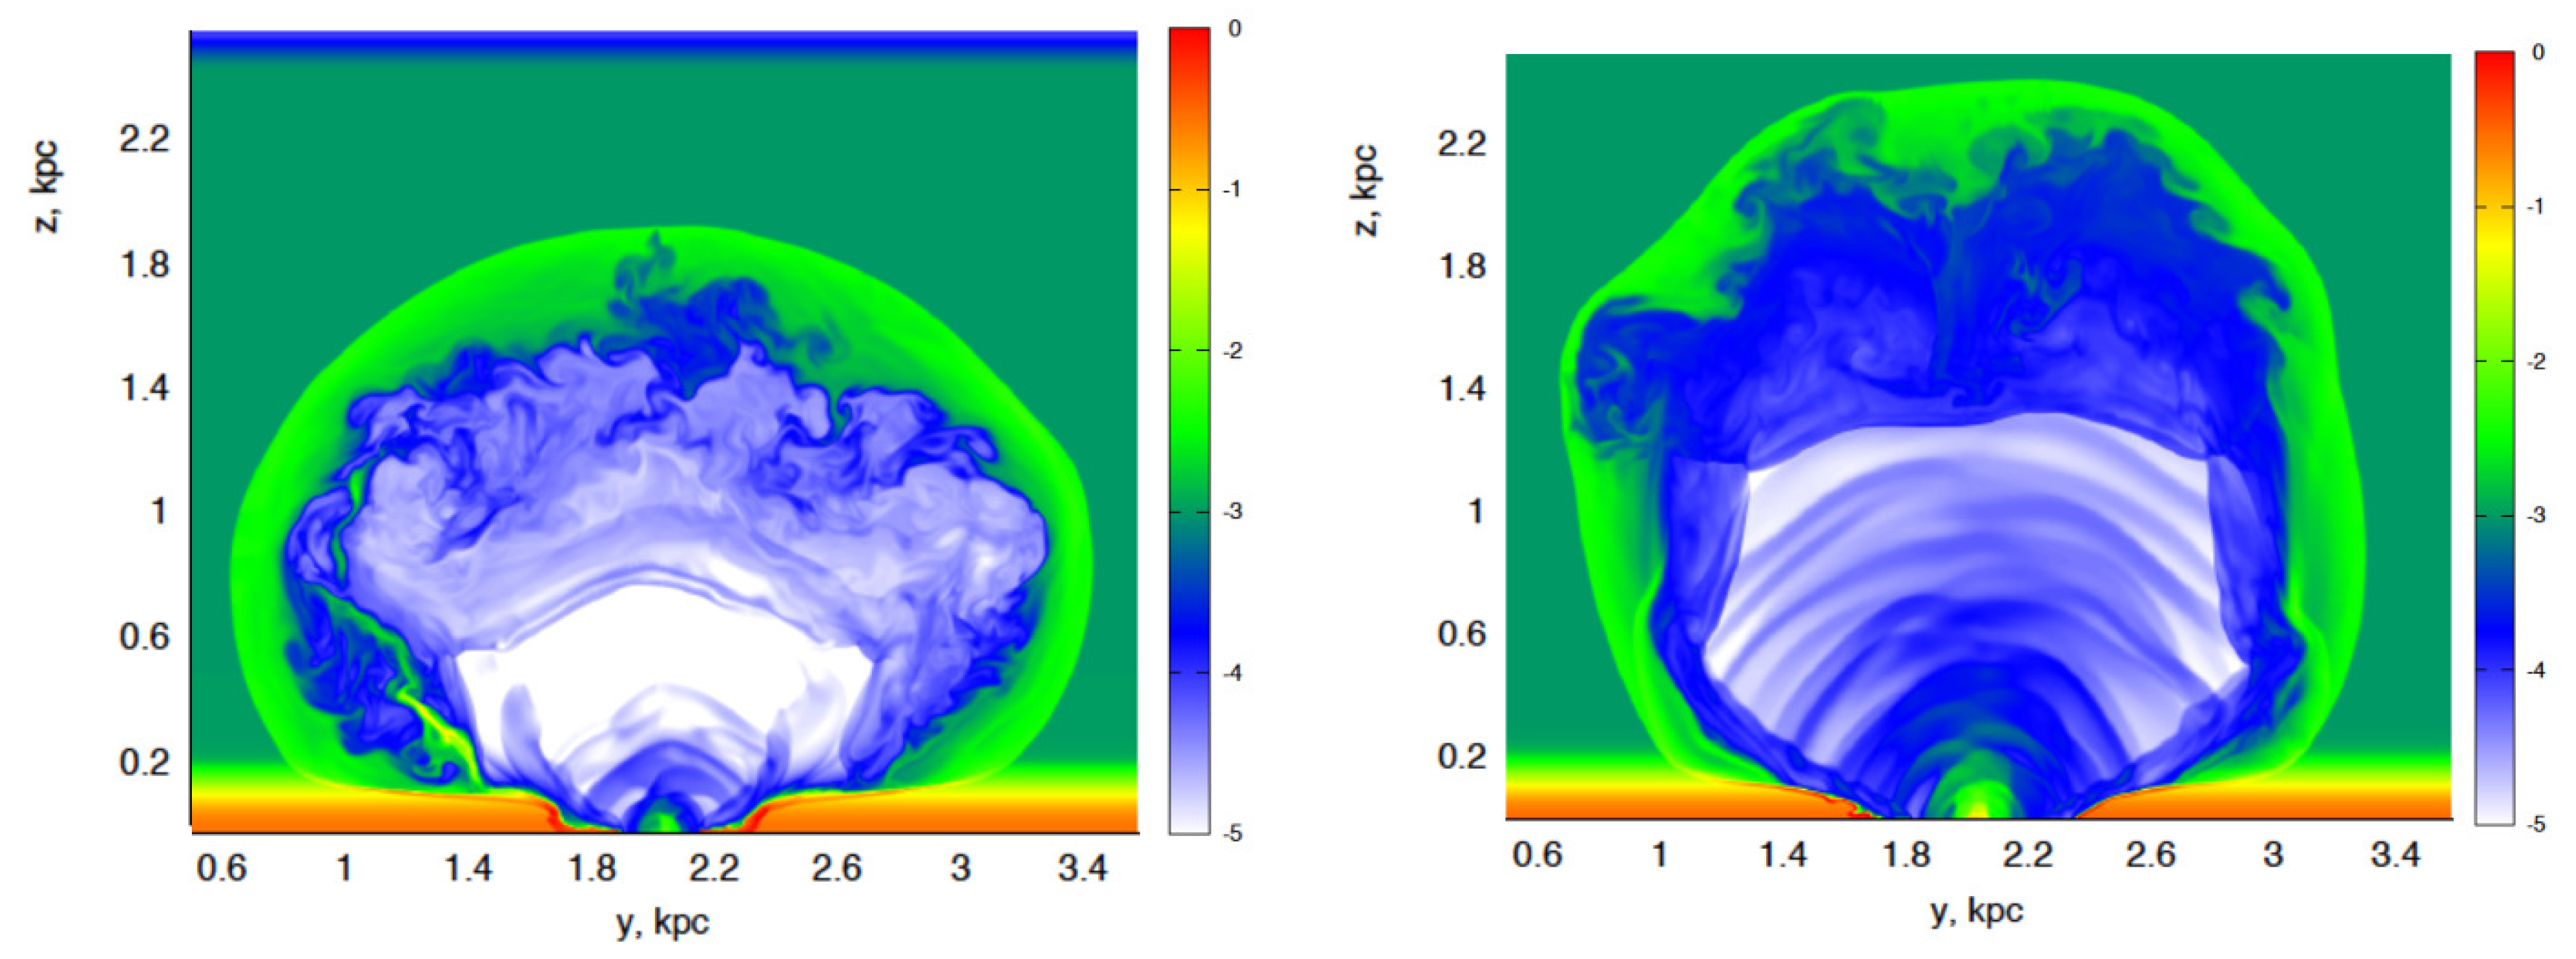
Dynamics change in a stratified medium. In this case, after a few SNe explosions, the collective bubble breaks out and continues growing predominantly upward. As a result, all subsequent explosions expand nearly into vacuum with minimal energy losses. A brief episode of a considerable radiative energy loss may occur in the initial stages, when the shock front propagating downward partly enters denser layers of the ISM disk where the radiative loss rate increases. It is seen in Figure 3: left panel depicts thermal energy, in the right panel the fraction of thermal energy is shown for a growing superbubble from clustered SNe explosions in the Galactic center. SNe explode one by one spread randomly in a volume of stellar cluster with radius pc; the rates are yr (upper curves in the left panel), and yr (lower curves). The star formation rates are ≈ yr and yr correspondingly, with a Kroupa IMF. On Figure 4 below the bubbles are shown for these two models: left panel is for SNe per yr at Myr, while right panel is for SNe per yr at Myr [50].
With a constant SF (and SN) rate the top parts of superbubbles grow approximately as and will reach the height of ≃10 kpc within ≃50 Myr for the lower rate, and within ≃25 Myr for the higher one (see in [50]). One may conclude therefore that even such an anemic SF rate 0.04–0.08 yr as measured in [41] can support large scale structures like Loop I and X-ray NPS when a regime of discrete energy injection from SN explosions is accounted for [50]. In an alternative model with two sequential star burts separated by around 10–15 Myr are responsible for the observed Loop I and NPS [18].
2.2. Mass Budget
Transporting mass from the ISM disk into halo is an issue deserving a separate discussion. Generally it is thought that fountaining SN remnants efficiently elevate interstellar gas. However, as shown by Mac Low et al. [51] only at most 3% of the mass from an exponential or a gaussian interstellar disk is indeed elevated, while the rest remains in wall-like shells with a vertical extent of a few scale heights. This kind of a shell is observed in the terminus of the NPS in 21 cm—a “crater” with a height ≃450 pc [52]. On smaller scales there is a 200-pc radius molecular cylinder reported by Sofue [53], with a vertical FHM length ∼60 pc—nearly twice of the CMZ scale height, might be due to a more recent explosion event in the Galactic center.
Therefore, when the mass budget of extraplanar structures, like NPS, is concerned the two sources are relevant: mass-loading by SNe explosions in the Galactic center or its disk, and partly the mass of a swept-up halo gas with a shallow density profile. It is exactly what happens in 2D numerical models by Sarkar et al. [42] and Sofue et al. [54]: the total mass injected by SNe is and the swept-up halo gas in 2 shell is in [42]. while and nearly the same for the swept-up mass in [54]. It fully corresponds to the assumed SFR: yr in [42], and ∼ yr in [54], with the vertical density profiles with cm and cm for the disk and halo gas in [42], while cm (for gaussian z-profile) and cm in [54]. It is also valid in the 3D model of a growing superbubble with low SF rate shown in Figure 4: gas mass in the shells ( on the left, and on the right) consists mostly on the swept-up halo gas, while SNe ejecta contributes little. This is consistent with the conclusion by Kataoka et al. [18] that the X-ray emitting gas in the NPS is a halo gas compressed by shocks coming from the GC.
2.2.1. —The Hot Gas Mass in the NPS
Mass of X-ray gas is
with being the solid angle of the NPS (of in width, and in length), , the distance to the base normalized by 10 kpc, is the thickness of the emitting layer in units of 1 pc. H and are connected through the emission measure pc cm [55]. Depending on the NPS morphology H can vary from around the projected thickness of the NPS to the chord along the line of sight perpendicular to the projected NPS. It can be estimated as , where varies from ≈0.25 in the first case at , to around for the second case. With a given emission measure the mass of X-ray gas in the NPS is then
For and this estimate is in accord with the above numbers shown for numerical models by Sarkar et al. [42] and Sofue et al. [54] when only the swept-up mass is taken into account. The corresponding thermal energy erg would be injected by SN explosions corresponding to star formation with the rate ∼ yr in ∼ Myr, where > 0.3 is the heating efficiency of collective SN explosions.
2.2.2. NPS Morphology
It is obvious that the observed asymmetry of the X-ray NPS and 408 MHz Loop I, along with all features seen in HI maps, dust emission, Planck dust optical depth—their concentration mostly towards the eastern part, is an essential and important characteristic from the point of view of their origin. In the galacto-centric scenario the structure which manifests through these features, requires huge energy—– erg and mass—, which suggests averaging over large scales in the central Galactic region, and therefore a rather symmetric configuration.5 For mean surface density in the Galactic center pc [58], one can get the gas mass around within the radius 100 pc. To explain the north-east asymmetry of the NPS within the Galacto-centric model, one has to assume a highly energetic flow which would elevate selectively a third of gas mass of the Galactic central region up to heights kpc north-east keeping its integrity. It looks very unlikely provided the central SN activity is rather symmetric, because the flow prefers to extend towards low density regions with local velocity . In addition, Rayleigh-Taylor and Kelvin-Helmholtz instabilities act on timescales shorter than that needed for the flow to carry this mass up to ∼10 kpc.
One of possible solutions here might be connected with highly nonhomogeneous distribution of star formation and SN rate in the central molecular zone (see review in [45]). In this case an occasionally east-biased local starburst in the Centrale molecular zone can initiate an outflow mostly towards the north-east side of the GC (see examples in [50]).
2.3. HI Around NPS
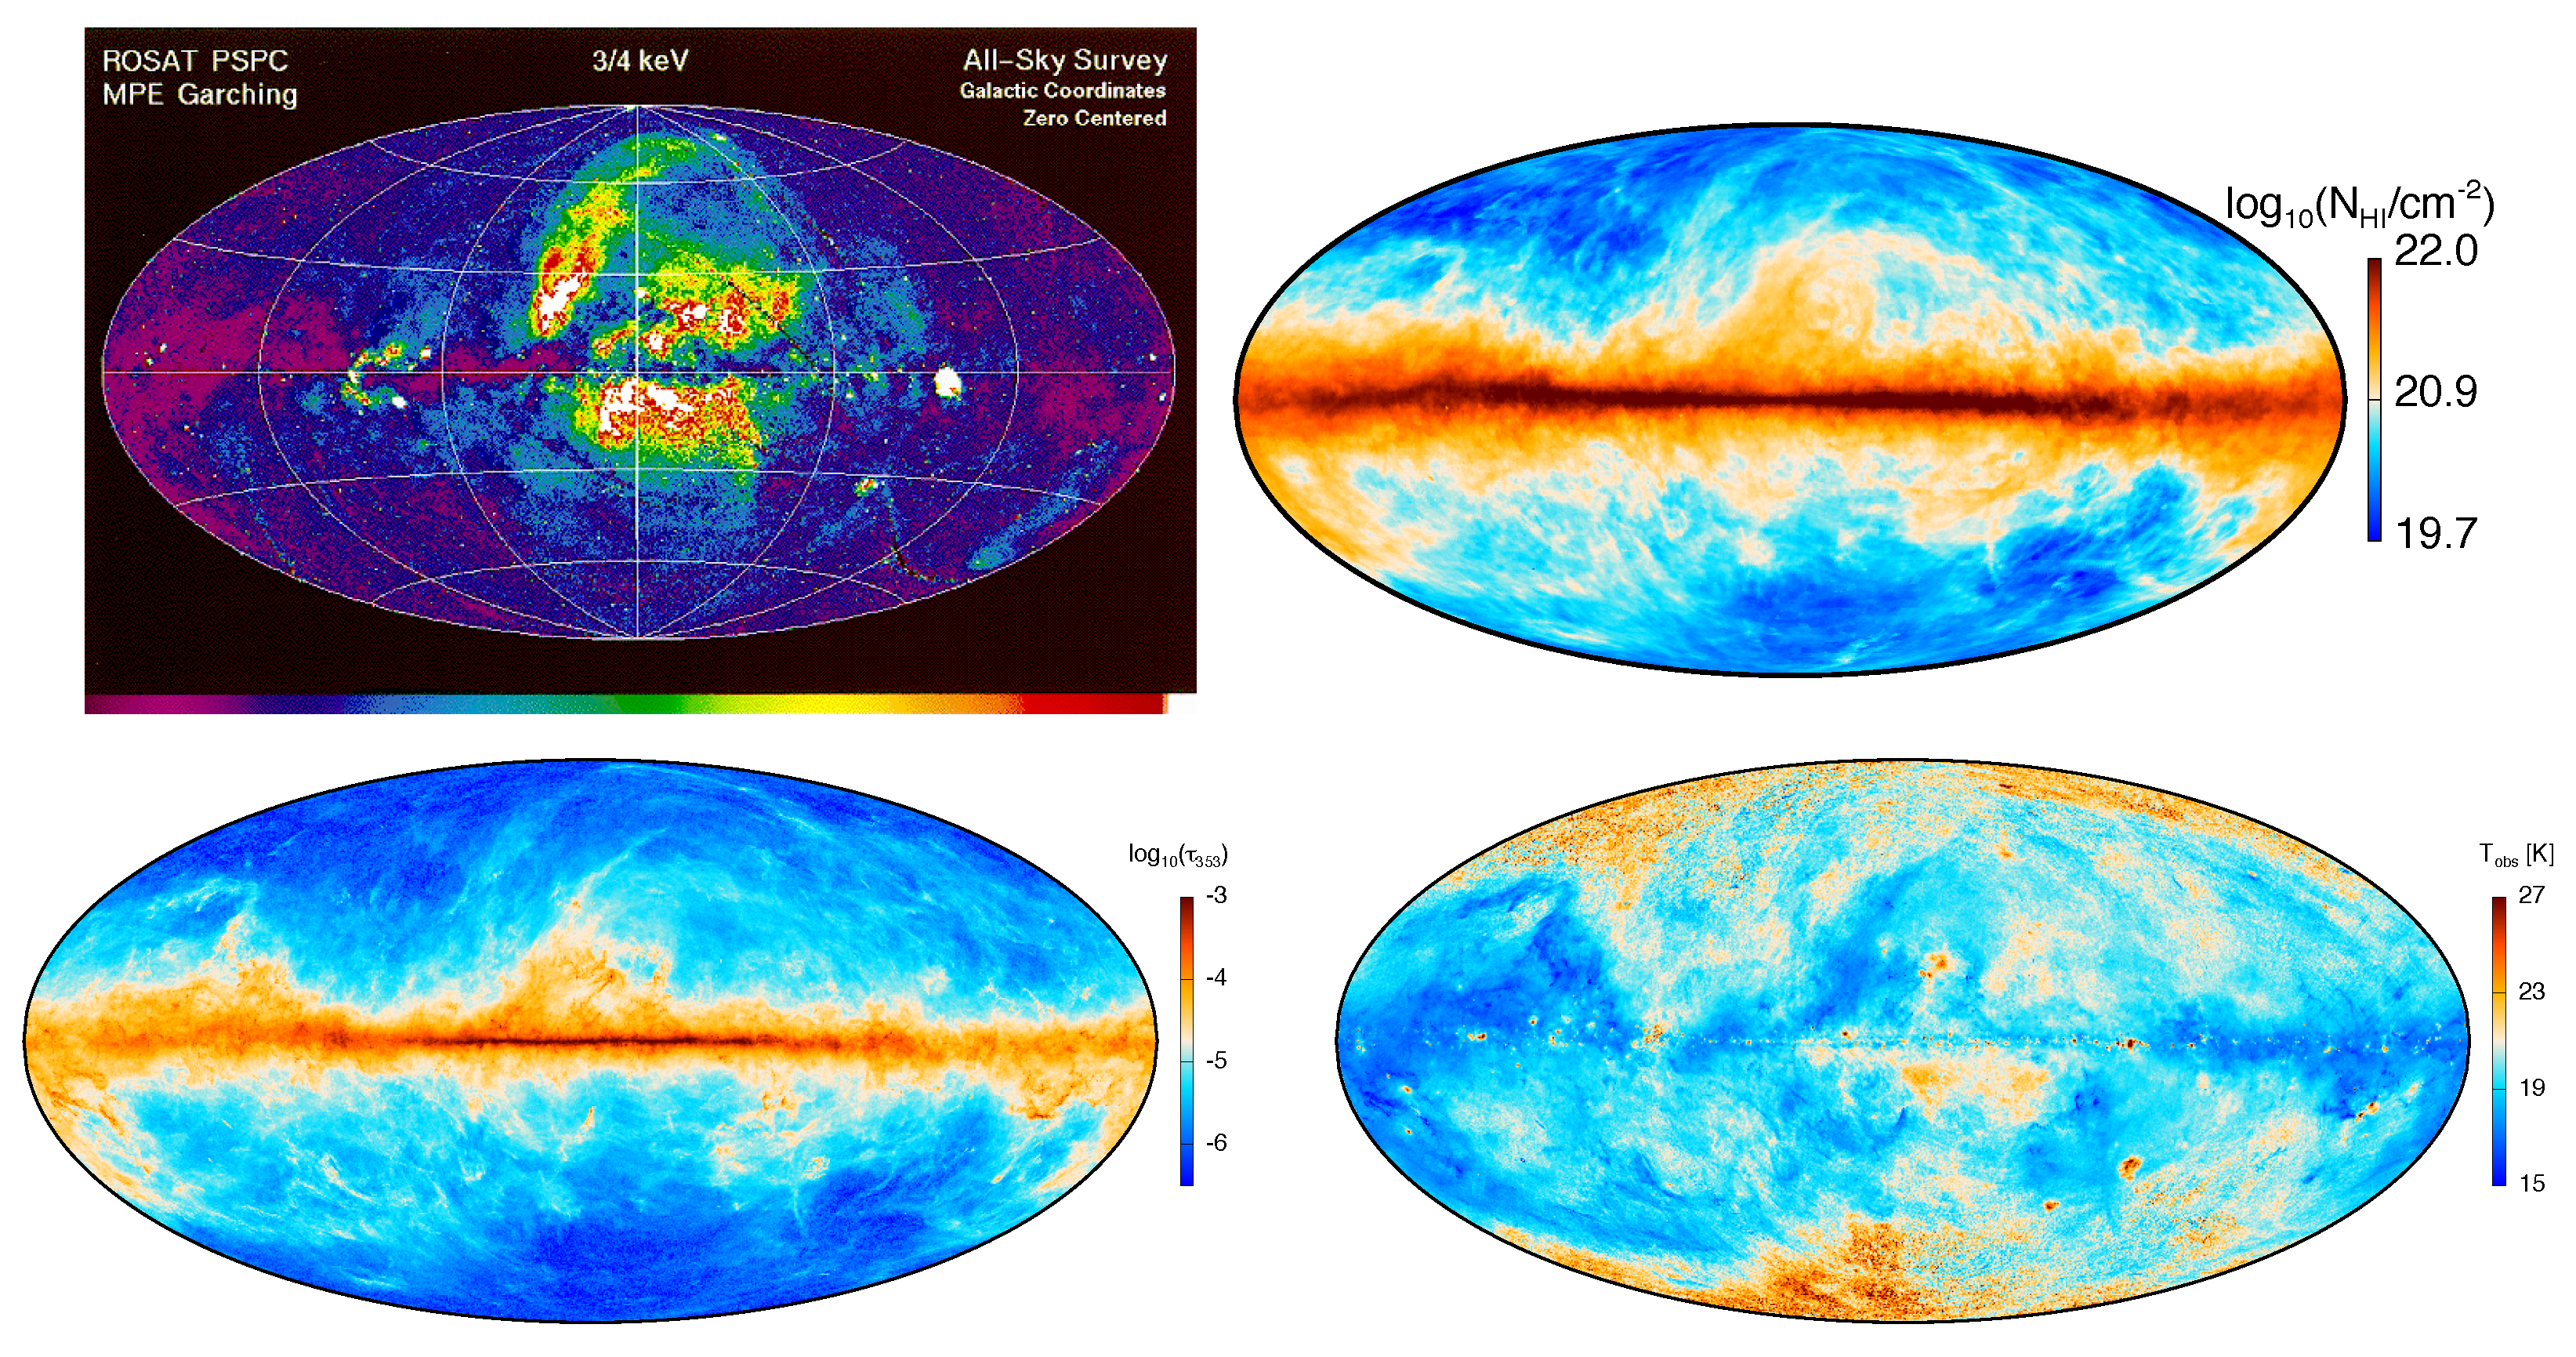
In spite of a general morphological similarity of all structures around Galactic symmetry axis: NPS, synchrotron (e.g., 408 MHz) emission, HI, Planck dust optical depth at 353 GHz , several features deserve a closer look.
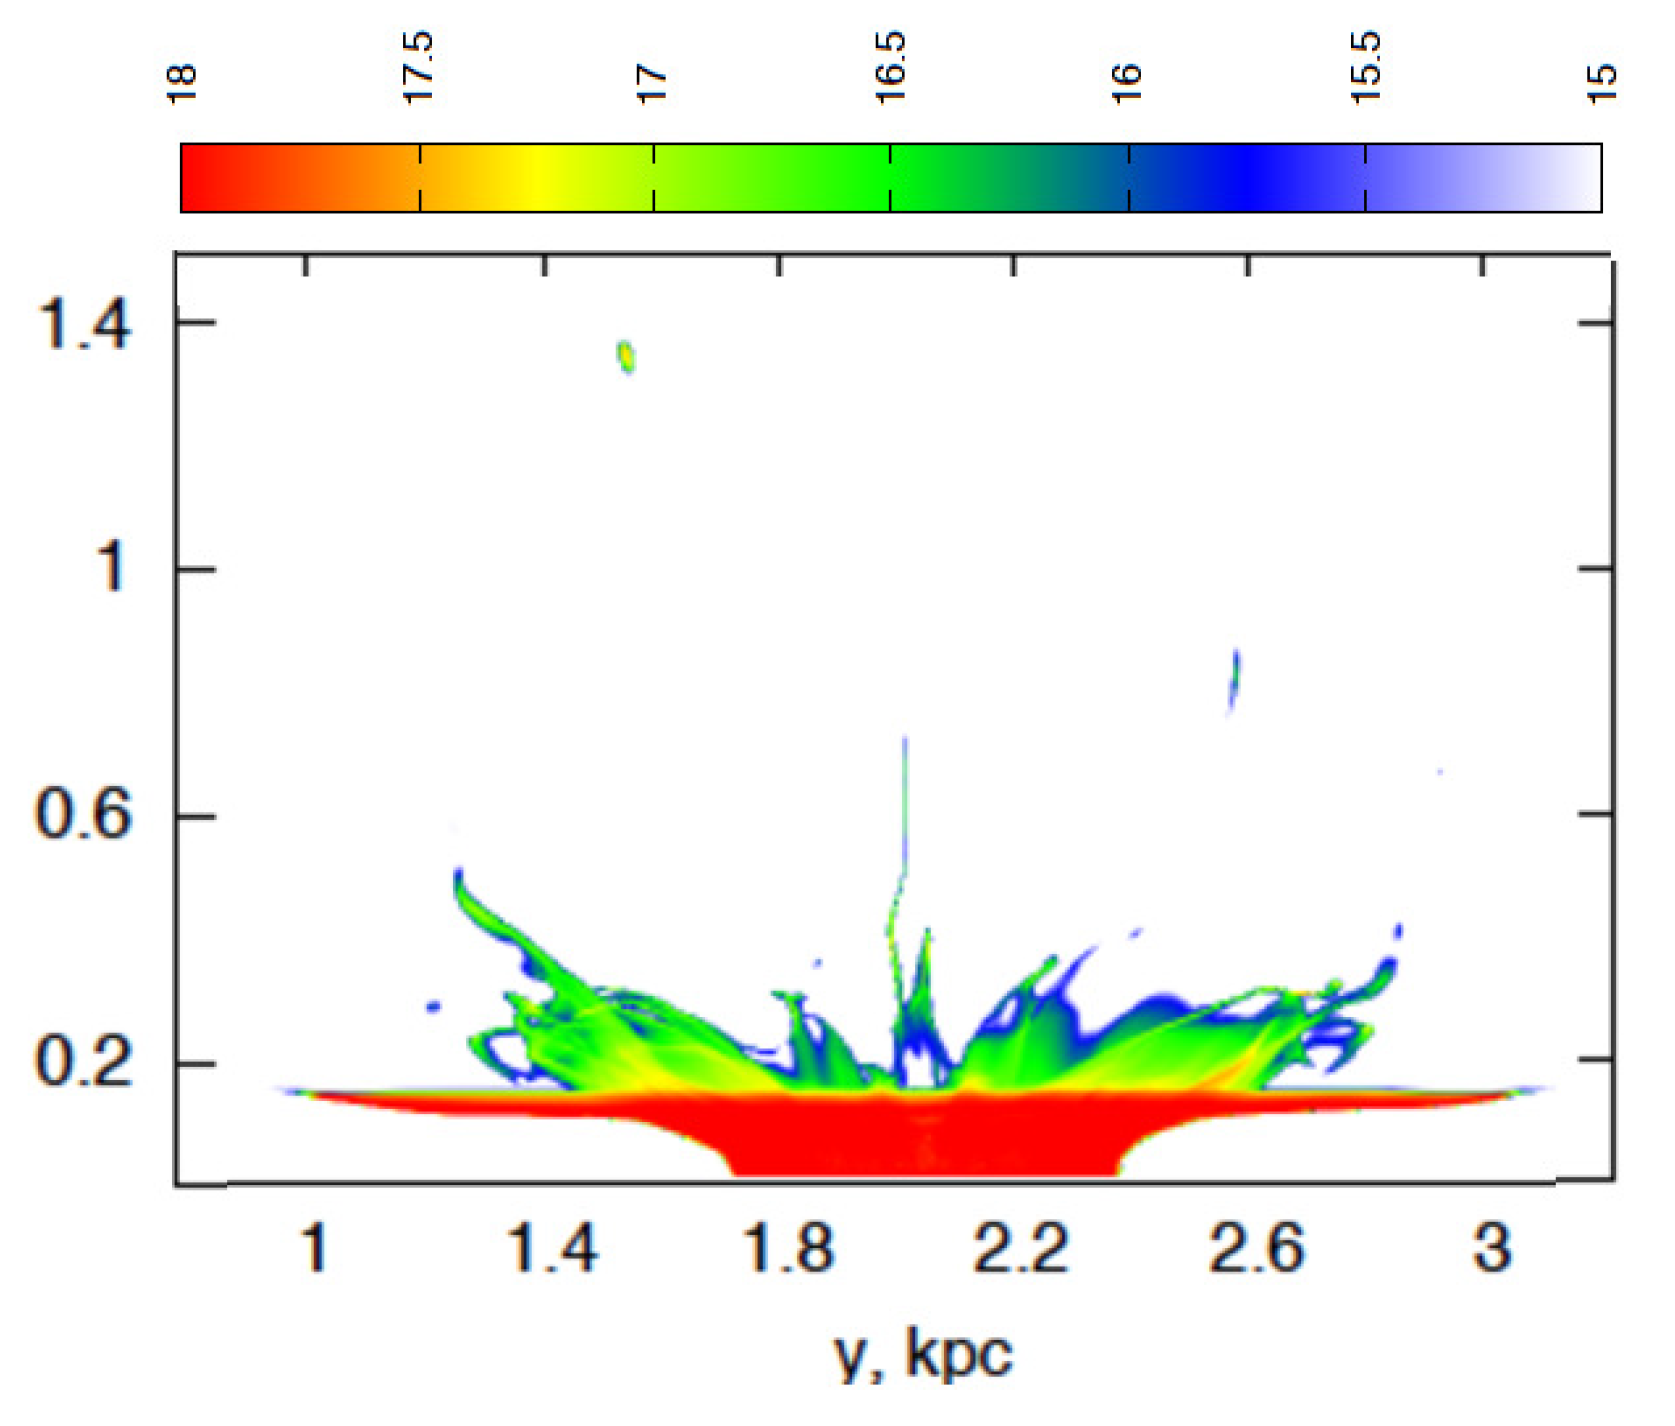
Soft X-ray as seen from ROSAT, Suzaku and XMM-Newton reveals high-temperature plasma: keV (see in [59], for more recent discussion see [18]), which suggests that the gas is highly ionized by a high-velocity shock wave(s) from SNe explosions in the center. In this scenario it looks unlikely that the observed HI loop-like gas is directly connected to the NPS and Loop I. Figure 5 shows a 3D numerical model of HI column density map of the shell being swept-up by central SNe explosions with the rate yr [50]. HI shell can be recognized only up to heights z ≲ 0.6 kpc, while at higher z strong shock waves completely converge atomic hydrogen into fully ionized—only a few tiny clumps and filaments survive up to z ∼ 1 kpc. Please note that the postshock gas does not cool radiatively at z > 0.5 kpc because the cooling time is longer than the dynamical one (see below). This circumstance excludes possible formation of clouds via thermal instability.
It is important though to stress here that this model implies a homogeneous vertically stratified density. However, the existence of clumpy and molecular outflows (e.g., in M82) suggests a nonhomogeneous ambient gas distribution before the starburst (see, e.g., filamentation model by Tanner et al. [57]). Though at higher heights of kpc, clumps and filaments are usually getting erased (see in [56,57,60]). From this point of view the presence of HI high-velocity clumps in a conical region towards the Galactic center at z ≳ 1.5 kpc (b ≃ 10°) demonstrated byMcCluer-Griffits [19] looks exceptionally interesting.
For conditions in the NPS, gas remains highly ionized deeper behind the shock front because its radiative cooling time ≳ 100 Myr for ≲ 0.01 cm−3 (see in [50]). This might mean that the HI low latitude tongue around the polar axis is most likely a front-side feature not connected with the shock wave presumably responsible for creating the NPS.
Another feature is the low column density tongue (, and the corresponding mass of ) offset north-east of the NPS, and extending upwards closer to the polar axis. It continues farther north-west beyond the polar axis along Loop I (see Figure 6). The overall morphological picture of NPS, radio-continuum Loop I and HI loop looks like if they are physically connected. However, if HI north-east filament is connected with the X-ray NPS, it precedes the shock front and thus seems to stay not in the right place.
One issue related to this HI feature is though worth to speculate: isolated HI structures in the ISM being exposed to the diffuse Lyman continuum, are expected to be bounded by HII envelopes, which might be seen in H emission. A rough estimate of the H surface brightness in the rims is R [50], assuming the structure of a cylindrical filament and exposure by diffuse Lyman continuum flux phot cm s [64,65]. Therefore, when such a filamentary structure lies at kpc the rim brightness falls below the detection limit. However, if they have local origin and are at pc the ionized rims around them might be recognizable. Such rims are not seen though at high latitudes in H all-sky surveys and are not obviuosly present around the HI loop close to the NPS [66,67,68], indicating probably that this tongue is located at high heights closer to the polar Galactic axis. Thus the origin of this HI loop is not quite clear.
Abundance Pattern in the NPS
Miller et al. [59] reported that heavy elements (C, O, Ne, Mg and Fe) are significantly depleted in the NPS down to less than 0.5 solar, while N is highly enhanced: as compared to the solar ratio. This observation may indicate a contribution from an elder population of asymptotic giant branch stars. Miller et al. [59] conclude that such an enhancement can be understood in the Sco-Cen scenario as due to a swept-up ISM gas enriched on longer time by Pop I stellar population. In the Galacto-centric scenario such an explanation of overabundant N can be problematic: with the total X-ray mass in the NPS of (see, Section 2.2.1) the mass of nitrogen in it would be of while the expected mass of oxygen from the GC is ≳ , assuming 〈𣊠 ≳ oxygen from a single core-collapse SN [69].
2.4. Dust
2.4.1. Dust Mass in Filament
Another important issue concerns the presence of dust in an immediate neighbourhood of the X-ray NPS gas (see lower panels in Figure 6). The optical depth at the lower left panel of Figure 6 shows a clearly seen filament following the HI loop from north-east to north-west. Its eastern part lies ≈ easter of the X-ray NPS (before the front, if the NPS traces hot gas behind the shock moving eastward). The total gas mass in this tongue estimated from (0.6–1) , after integration over the solid angle for this dust structure6 is: , which is consistent with the above estimated HI mass in the slightly north-east offset 21 cm filament coincident with the one.
Given that the dust-to-gas mass ratio is similar to the one in the Galactic disc , the total amount of dust in this feature can be as . One can conclude from this that the dominant source of dust mass in filament can be only the dust in swept-up gas, which therefore is supposed to have the dust mass fraction not less than in the ISM disk.
The two fllaments—HI and represent apparently a separate physically connected gas structure standing aside the X-ray gas of NPS. Moreover, as mentioned above, their position with respect to X-ray gas does not look consistent if the latter is driven by a shock wave from the Galactic center, and is hard to be interpreted in the Galacto-centric scenario.
2.4.2. Dust Temperature
The dust temperature distribution around the X-ray component of NPS (see the lower right panel in Figure 6) displays a hot ( K) dust tongue nearly coincident with the NPS. If the tongue is physically connected to the NPS, then dust temperature is determined by collisional heating from hot plasma—the equilibrium value is around K ( cm—plasma density in NPS, keV, its temperature, m—dust grain radius): particles with a = 0.01–0.1m fit well the whole range of dust temperature in the NPS.
However, when dust grains are maintained by thermal collisions at K, their characteristic survival time against thermal sputtering is only few to ten Myr for silicates and carbonaceous grains, respectively, which is obviously shorter than the dynamical time for the NPS. From this point of view this dust may be a residual fraction of dust being destroyed in the hot hostile environment of X-ray plasma. However, with the mean flux density MJy at 353 GHz from the region occupied by the K dust (solid angle ) within the NPS X-ray hot gas, one can estimate the corresponding dust mass . The dust mass fraction within X-ray NPS gas is
for the assumed numbers. This ratio seems to be at least factor of 3 higher than would be expected for a 30 Myr old NPS X-ray region, suggesting that two additional parts of hot ( K) dust lie in the same projected area as the NPS.
2.5. Synchrotron
Supernova remnants and their ensembles growing within the ISM disk (i.e., within 1 to 2 scale heights) have similar physical characteristics at their shells: gas density, temperature, cosmic ray density. For such remnants the relation falls on to the general trend (see, discussion in [71,72,73]), and the spectral index of their synchrotron emission is expected to be generally invariant along the shell (see [72]). Remnants of larger scales produced by a collection of SNe and consequently extending upward higher than 2 to 3 scale heights are expected to become individualized by their large scale gradient of the spectral index . Such a gradient emerges because of several reasons: (i) relativistic electrons lose their energy ∝, such that the characteristic cooling time for them ; and (ii) this effect is enhanced for relativistic electons being elevated in a vertically growing superbubble, in which an additional adiabatic cooling due to diverging velocity field in the superbubble shift their energy spectrum towards lower energies (see in [74]). One can expect therefore the Loop I spectral index to grow upwards, i.e., the spectrum to get steeper along the Loop I from its terminus at low latitudes to its polar parts.
Observations of polarized emission in the east northern part of Loop I [73] do not confirm this conclusion: going from the northest (field 1, Figure 6 in [73]) through the middle (field 2) and to the lowest (field 3) part changes from 0.26 to 0.12 and to 1.3, respectively (see upper panel on Figure 7 in [73]). At the same time, global maps of synchrotron intensity from 10 MHz to 2.3 GHz obviously show softening in the spectrum from the central midplane area towards the north-north-east direction [75]. Similar behavior is found in the wind flow of M82 with strong variations of along the outflow: from ≃ in the central region to ≃ on scales of 0.5 kpc outward [76]. Sychrotron spectral index in halos of edge-on galaxies do also reveal a considerable increase in the vertical direction consistent with a strong (velocities 100 to 250 km s) advective transport [77].
2.6. DIBs in the NPS
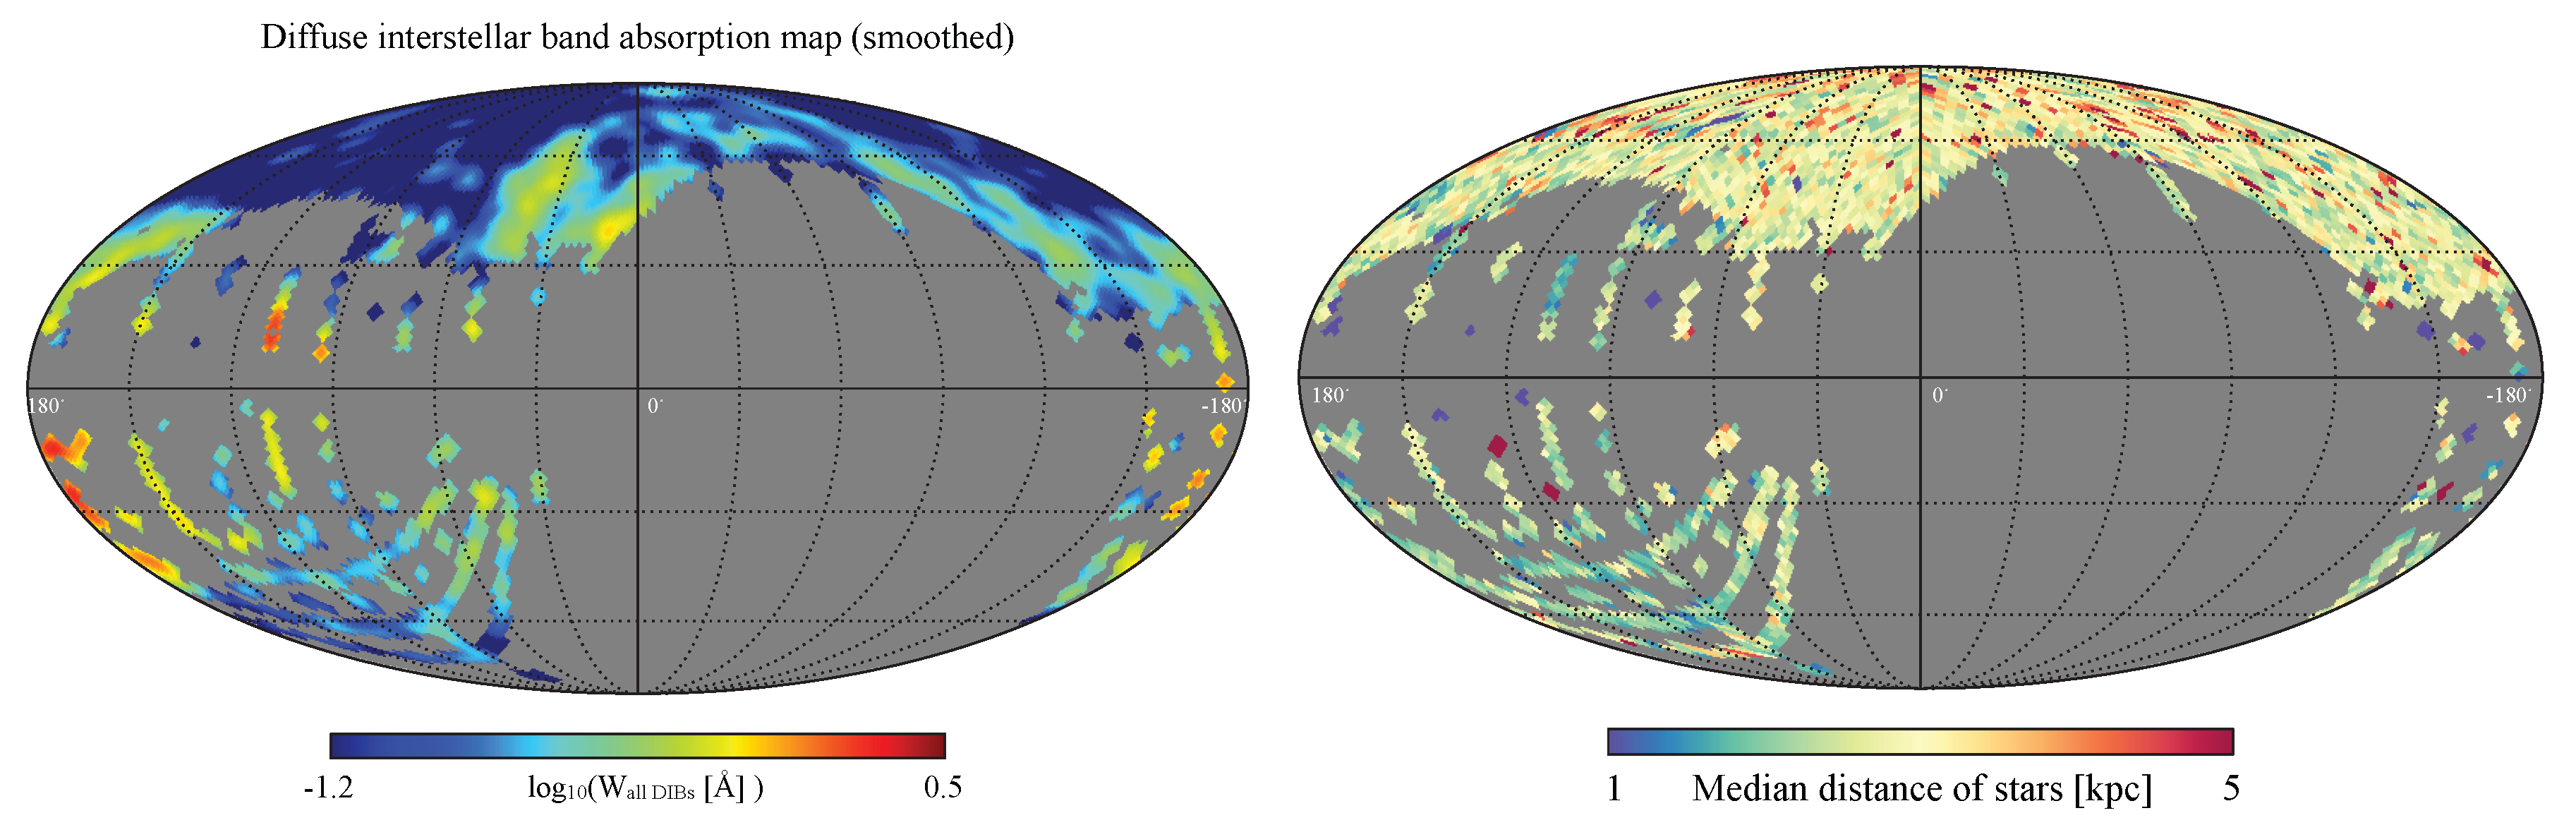
Lan et al. [78] scanned around 5000 deg of the northern Galactic hemisphere mostly at high latitudes () including the NPS domain, in order to find diffuse interstellar bands (DIB) in the Milky Way halo. The most interesting result of their study connected to the question of interest—the origin of Loop I and related structures, is that the strongest DIB absorptions ( 0.5–0.8 Å) are located exactly in the HI filaments close to the NPS X-ray part from east and west sides, and demonstrate a very similar morphology seen in Figure 7, left panel. This observation is reflected in a very tight correlation between their DIBs absorptions and the total-integrated over the integrated velocity range from km s to +400 km s of atomic hydrogen in the LAN survey [63]: with being the equivalent width of a DIB feature, , (see Figures 11 and 12, and Equation (4) in [78]).
A striking feature is that the typical distance to SDSS stars in this coverage is 2 to 3 kpc as seen from Figure 7, right panel. This finding definitely demonstrates that high-latitude HI tongues, and possibly connected to them gas traced by , cannot be directly associated with the NPS X-ray gas provided it locates closer to the Galactic center. Otherwise they all: HI, and X-ray, are placed nearby at D ≲ 2–3 kpc, and represent a part of a huge (quasi)conical shell structure in the foreground.
3. Conclusions
Current observations and models of Loop I and related structures can be summarized as follows:
- Energetic events in the Galactic center and the very existence of the Fermi-bubbles make it very attractive to think, that all this is produced by a collective SN activity in the center. The conclusion of whether a weak central SF rate—SRF ≲ yr is sufficient for maintaining these structures, crucially depends on the numerical model: luminosity-driven wind scenarios require an order of magnitude higher SFR, while randomly spread isolated SNe can apparently do the work with a lower SFR.
- The mass of HI filament inferred from 21 cm column density, and the gas mass of a coincidental filament north-east of the X-ray component of NPS are nearly equal, which would mean that they are physically connected. However, their position with respect to the X-ray NPS indicates most likely that they represent warm gas isolated of the X-ray gas.
- Mass budget and energetics of the X-ray gas of NPS can be maintained by the central star formation of SFR yr during ∼ Myr, within the model of randomly positioned isolated SN explosions as the energy source. However, the dust mass in the X-ray NPS as inferred from far infrared emission at 353 GHz is factor of 3 higher than would be expected from a more than 30 Myr old NPS.
- An enhanced N/O ratio in the NPS reported by Miller et al. [59] does not look to match conditions in the Galacto-centric model. It is easer understood within the Sco-Cen scenario.
- Loop I synchrotron emission and, in particular, softening of its spectrum toward lower frequencies (10 to 820 MHz) in comparison to higher ones (1.4 to 2.3 GHz) is consistent most likely with the galacto-centric scenario.
- On the other hand, discovery of DIB SDSS absorptions in spectra of stars within 2 to 3 kpc sheds a new light on the problem, because the most strong DIB absorptions seem to outline the same regions on sky containing the Loop I and related HI, and the X-ray structures. This may indicate that either these structures are all placed relatively locally, within 2–3 kpc, or otherwise one has to conclude that not all of them are physically connected. For instance, synchrotron Loop I and X-ray NPS gas might arise due to SN activity in the GC, while HI and filaments and plumes along with DIB absorptions represent frontside structures within 2–3 kpc.
The overall conclusion is therefore that even though some components of Loop I seem to be connected with activity of the Galactic center, including relativistic electrons shining in synchrotron and perhaps the hot NPS X-ray gas, there are contaminations from structures lying closer to us, and projecting onto structures over the GC. New techniques, such as 3D measurements of interstellar dust redenning or 21 cm velocity field towards Loop I, are to be applied in order to disentangle projection effects.
Acknowledgments
I acknowledge the hospitality of Niels Bohr Institute, University of Kopenhagen, where part of this work is done. I am thankful to P. D. Naselsky who paid my attention to the problem, and to B. B. Nath, K. C. Sarkar, P. Sharma and E. O. Vasiliev for continuous valuable discussions. I also thank H. Liu for his gentle assistance with understanding the Planck dust results. I appreciate efforts by D. Malyshev to shaping my writing more explicit. It is a pleasure to acknowledge the organisers for warm and fruitful atmosphere during the “Three elephants in the gamma-ray sky” meeting. The work is supported by RFBR (project code 17-52-45053).
Conflicts of Interest
The authors declare no conflict of interest.
References
- Hanbury Brown, R.; Davies, R.D.; Hazard, C. A curious feature of the radio sky. Observatory 1960, 80, 191–198. [Google Scholar]
- Large, M.I.; Quigley, M.J.; Haslam, C.G. A radio study of the North Polar Spur. Mon. Not. R. Astron. Soc. 1964, 127, 273–285. [Google Scholar]
- Landecker, T.L.; Wielebinski, R. The galactic metre wave radiation. Aust. J. Phys. Astrophys. 1970, 16, 1–31. [Google Scholar]
- Berkhuijsen, E.M. The survey of the continuum radiation at 820 MHz between declinations -7∘ and +85∘. Astron. Astrophys. 1971, 14, 359–386. [Google Scholar]
- Haslam, C.G.T.; Salter, C.J.; Stoffel, H.; Wilson, W.E. A 408 MHz all-sky continuum survey. II—The atlas of contour maps. Astron. Astrophys. Suppl. Ser. 1982, 47, 1–142. [Google Scholar]
- Heiles, C. HI shells and supershells. Astrophys. J. 1979, 229, 533–537. [Google Scholar] [CrossRef]
- Heiles, C. HI shells, supershells, shell-like objects, and ‘worms’. Astrophys. J. Suppl. Ser. 1984, 55, 585–595. [Google Scholar] [CrossRef]
- Smith, R.K.; Cox, D.P. Modeling the Local Bubble using multiple supernova remnants. In The Local Bubble and Beyond Lyman-Spitzer-Colloquium; Springer: Berlin/Heidelberg, Germany, 1998; pp. 133–136. [Google Scholar]
- Breitschwerdt, D.; de Avillez, M.A. The history and future if the local and Loop I bubbles. Astron. Astrophys. 2006, 452, L1–L5. [Google Scholar] [CrossRef]
- Preibisch, T.; Mamajek, E. The nearest OB association: Scorpius-Centaurus OB2. In Handbook of Star Forming Regions, Volume II: The Southern Sky; Reipurth, B., Ed.; ASP Monograph: San Francisco, CA, USA, 2008. [Google Scholar]
- Sofue, Y.; Handa, T. A radio lobe over the Galactic center. Nature 1984, 310, 568–569. [Google Scholar] [CrossRef]
- Sofue, Y. The relation of Galactic radio spurs to spiral arms. Astron. Astrophys. 1976, 48, 1–10. [Google Scholar]
- Sofue, Y. Propagation of magnetohydrodynamic waves from the Galactic center. Astron. Astrophys. 1977, 60, 327–336. [Google Scholar]
- Martos, M.A.; Cox, D.P. Magnetohydrodynamic modeling of a galactic spiral arm as a combination shock and hydraulic jump. Astrophys. J. 1998, 509, 703–716. [Google Scholar] [CrossRef]
- Gómez, G.C.; Cox, D.P. Three-dimensional magnetohydrodynamic modeling of the gaseous structure of the Galaxy: description of the simulations. Astrophys. J. 2004, 615, 744–757. [Google Scholar] [CrossRef]
- Lallement, R.; Snowden, S.; Kuntz, K.D.; Dame, T.M.; Koutroumpa, D.; Grenier, I.; Casandjian, J.M. On the distance to the North Polar Spur and the local CO-H2 factor. Astron. Astrophys. 2016, 595, A131–A147. [Google Scholar] [CrossRef]
- Green, G.M.; Schlafly, E.F.; Finkelbeiner, D.P.; Rix, H.W.; Martin, N.; Burgett, W.; Draper, P.W.; Flewelling, H.; Hodapp, K.; Kaiser, N.; et al. A Three-dimensional map of Milky Way dust. Astrophys. J. 2015, 810, 25. [Google Scholar] [CrossRef]
- Kataoka, J.; Sofue, Y.; Inoue, Y.; Akita, M.; Nakashima, S.; Totani, T. X-ray and Gamma-ray observations of the Fermi Bubbles and NPS/Loop I structures. Galaxies 2018, 6, 27. [Google Scholar] [CrossRef]
- McClure-Griffits, N. HI in the direction of the Galactic centre. In Proceedings of the Talk Presented at This Meeting, Stanford, CA, USA, 31 March–1 April 2017. [Google Scholar]
- Dickinson, C. Overview of large-scale features in the radio sky. In Proceedings of the Talk Presented at This Meeting, Stanford, CA, USA, 31 March–1 April 2017. [Google Scholar]
- Weaver, H. Large supernova remnants as common features of the disk. In Symposium-International Astronomical Union; Cambridge University Press: Cambridge, UK, 1974; pp. 295–300. [Google Scholar]
- Egger, R.J.; Aschenbach, B. Interaction of the Loop I supershell with the Local Hot Bubble. Astron. Astrophys. 1995, 294, L25–L28. [Google Scholar]
- Karberla, P.M.W.; Dedes, L. Global properties of the HI distribution in the outer Milky Way. Planar and extraplanar gas. Astron. Astrophys. 2008, 487, 951–963. [Google Scholar] [CrossRef]
- Marasco, A.; Fraternali, F.; van der Hulst, J.M.; Oosterloo, T. Distribution and kinematics of atomic and molecular gas inside the solar circle. Astron. Astrophys. 2017, 607, A106. [Google Scholar] [CrossRef] [Green Version]
- Zhu, H.; Tian, W.; Li, A.; Zhang, M. The gas-to-extinction ratio and the gas distribution in the Galaxy. Mon. Not. R. Astron. Soc. 2017, 471, 3494–3528. [Google Scholar] [CrossRef] [Green Version]
- Schulreich, M.M.; Breitschwerdt, D.; Feige, J.; Dettbarn, C. Numerical studies on the link between radioisotopic signatures on Earth and the formation of the Local Bubble. I. 60Fe transport to the solar system by turbulent mixing of ejecta from nearby supernovae into a locally homogeneous interstellar medium. Astron. Astrophys. 2017, 604, A81. [Google Scholar] [CrossRef]
- Korolev, V.V.; Vasiliev, E.O.; Kovalenko, I.G.; Shchekinov, Y.A. Dynamics of a supernova shell in a cloudy interstellar medium. Astron. Rep. 2015, 59, 690–708. [Google Scholar] [CrossRef]
- Santos, F.P.; Corradi, W.; Reis, W. Optical polarization mapping toward the interface between the Local Cavity and Loop I. Astrophys. J. 2011, 728, 104. [Google Scholar] [CrossRef]
- Pecaut, M.J.; Mamajek, E.E.; Bubar, E.J. A revised age for Upper Scorpius and the star formation history among the F-type members of the Scorpius-Centaurus OB—Association. Astrophys. J. 2012, 746, 154–176. [Google Scholar] [CrossRef]
- Donaldson, J.K.; Weinberger, A.J.; Gagné, J.; Boss, A.P.; Keiser, S.A. New parralaxes for the Upper Scorpius OB association. Astrophys. J. 2017, 850, 11. [Google Scholar] [CrossRef]
- Hyde, M.; Pecaut, M.J. Supernova Ejecta in ocean cores used as time constraints for nearby stellar groups. arXiv, 2017; arXiv:1712.05466. [Google Scholar]
- Sofue, Y. The North Polar Spur and Aquila Rift. Mon. Not. R. Astron. Soc. 2015, 447, 3824–3831. [Google Scholar] [CrossRef] [Green Version]
- Ade, P.A.; Aghanim, N.; Aniano, G.; Arnaud, M.; Ashdown, M.; Aumont, J.; Baccigalupi, C.; Banday, A.J.; Barreiro, R.B.; Bartolo, N.; et al. Planck intermediate results. XXVIII. Interstellar gas and dust in the Chamaeleon clouds as seen by Fermi LAT and Planck. Astron. Astrophys. 2015, 582, A31. [Google Scholar]
- Sun, X.H.; Gaensler, B.M.; Carretti, E.; Purcell, C.R.; Staveley-Smith, L.; Bernardi, G.; Haverkorn, M. Absolutely calibrated radio polarimetry of the inner Galaxy at 2.3 and 4.8 GHz. Not. R. Astron. Soc. 2014, 437, 2936–2947. [Google Scholar] [CrossRef]
- Vasiliev, E.O.; Nath, B.B.; Shchekinov, Y.A. Evolition of multiple supernovae remnants. Mon. Not. R. Astron. Soc. 2015, 446, 1703–1715. [Google Scholar] [CrossRef]
- Sofue, Y. Galactic center shells and a reccurent starburst model. Publ. Astron. Soc. Jpn. 2003, 55, 445–450. [Google Scholar] [CrossRef]
- Oort, J. The galactic center. Astron. Astrophys. 1977, 15, 295–362. [Google Scholar] [CrossRef]
- Sofue, Y. Giant explosion in the Galactic Center and huge shocked shells in the halo. Astrophys. J. 1994, 431, L91–L93. [Google Scholar] [CrossRef]
- Bland-Hawthorn, J.; Cohen, M. The largescale bipolar wind in the Galactic center. Astrophys. J. 2003, 582, 246–256. [Google Scholar] [CrossRef]
- Serabyn, E.; Morris, M. Sustained star formation in the central stellar cluster of the Milky Way. Nature 1996, 382, 602–604. [Google Scholar] [CrossRef]
- Yusef-Zadeh, F.; Hewitt, J.W.; Arendt, R.G.; Whitney, B.; Rieke, G.; Wardle, M.; Hinz, J.L.; Stolovy, S.; Lang, C.C.; Burton, M.G.; et al. Star formation in the central 400 pc of the Milky Way: Evidence for a population of massive young stellar objects. Astrophys. J. 2009, 702, 178–225. [Google Scholar] [CrossRef]
- Sarkar, K.C.; Nath, B.B.; Sharma, P. Multiwavelength features of Fermi bubbles as signatures of a Galactic wind. Mon. Not. R. Astron. Soc. 2015, 453, 3827–3838. [Google Scholar] [CrossRef]
- Koepferl, C.M.; Robitaille, T.P.; Morales, E.F.E.; Johnston, K.G. Main-sequence stars masquerading as young stellar objects in the Central Molecular Zone. Astrophys. J. 2015, 799, 53. [Google Scholar] [CrossRef]
- Barnes, A.T.; Longmore, S.N.; Battersby, C.; Bally, J.; Kruijssen, J.M.; Henshaw, J.D.; Walker, D.L. Star formation rates and efficiencies in the Galactic center. Mon. Not. R. Astron. Soc., 2017, 469, 2263–2285. [Google Scholar] [CrossRef]
- Crocker, R. Nonthermal insights on mass and energy flows through the Galactic centre and into the Fermi bubbles. Mon. Not. R. Astron. Soc. 2012, 423, 3512–3539. [Google Scholar] [CrossRef]
- Nath, B.B.; Shchekinov, Y.A. Conditions for supernova-driven galactic winds. Astrophys. J. Lett. 2013, 777, L12. [Google Scholar] [CrossRef]
- Roy, A.; Nath, B.B.; Sharma Shchekinov, Y.A. Superbubble breakout and galactic widns from disc galaxies. Mon. Not. R. Astron. Soc. 2013, 434, 3572–3581. [Google Scholar] [CrossRef]
- Sharma, P.; Roy, A.; Nath, B.B.; Shchekinov, Y.A. In a hot bubble: why does superbubble feedback work, but isolated supernovae do not. Mon. Not. R. Astron. Soc. 2014, 443, 3463–3476. [Google Scholar] [CrossRef]
- Chevalier, R.A.; Clegg, A.W. Wind from a starburst galaxy nucleus. Nature 1985, 317, 44–45. [Google Scholar] [CrossRef]
- Vasiliev, E.O.; Shchekinov, Y.A.; Nath, B.B. Growing superbubbles in a stratified ISM. Mon. Not. R. Astron. Soc. 2018. submitted. [Google Scholar]
- Mac Low, M.M.; McCray, R.; Norman, M.L. Superbubble blowout dynamics. Astrophys. J. 1989, 337, 141–154. [Google Scholar] [CrossRef]
- Sofue, Y. Giant HI hole inside the 3-kpc ring and the North Polar Spur—The Galactic crater. Publ. Astron. Soc. Jpn. 2017, 69, L8. [Google Scholar] [CrossRef]
- Sofue, Y. The 200-pc molecular cylinder in the Galactic center. Mon. Not. R. Astron. Soc. 2017, 470, 1982–1990. [Google Scholar] [CrossRef]
- Sofue, Y.; Habe, A.; Kataoka, J.; Totani, T.; Inoue, Y.; Nakashima, S.; Matsui, H.; Akita, M. Galactic-center hyper-shell model for the North Polar Spurs. Mon. Not. R. Astron. Soc. 2017, 459, 108–120. [Google Scholar] [CrossRef]
- Willingale, R.; Hands, A.D.; Warwick, R.S.; Snowden, S.L.; Burrows, D.N. The X-ray spectrum of the North Polar Spur. Mon. Not. R. Astron. Soc. 2003, 343, 995–1001. [Google Scholar] [CrossRef] [Green Version]
- Cooper, J.L.; Bicknell, G.V.; Sutherland, R.S.; Bland-Hawthorn, J. Three-dimensional simulations of a starburst-driven galactic wind. Astrophys. J. 2008, 674, 157–171. [Google Scholar] [CrossRef]
- Tanner, R.; Cecil, G.; Heitsch, F. Starburst-driven galactic superbubbles radiating to 10 K. Astrophys. J. 2016, 821, 7–13. [Google Scholar] [CrossRef]
- Oka, T.; Hasegawa, T.; Sato, F.; Tsuboi, M.; Miyazaki, A. A Large-SCale CO survey of the Galactic Center. Astrophys. J. Suppl. Ser. 1998, 118, 455–515. [Google Scholar] [CrossRef]
- Miller, E.D.; Tsunemi, H.; Bautz, M.W.; McCammon, D.; Fujimoto, R.; Hughes, J.P.; Katsuda, S.; Kokubun, M.; Mitsuda, K.; Porter, F.S.; et al. Suzaku observations of the North Polar Spur: Evidence for Nitrigen enhancement. Publ. Astron. Soc. Jpn. 2008, 60, S95–S106. [Google Scholar] [CrossRef]
- Walter, F.; Weiss, A.; Scoville, N. Molecular gas in M82: Resolving the outflow and streamers. Astrophys. J. 2002, 580, L21–L25. [Google Scholar] [CrossRef]
- Snowden, S.L.; Freyberg, M.J.; Plucinsky, P.P.; Schmitt, J.H.; Trümper, J.; Voges, W.; Edgar, R.J.; McCammon, D.; Sanders, W.T. First maps of the soft X-ray diffuse background from the ROSAT XRT/PSPC all-sky survey. Astrophys. J. 1995, 454, 643–653. [Google Scholar] [CrossRef]
- Abergel, A.; Ade, P.A.; Aghanim, N.; Alves, M.I.; Aniano, G.; Armitage-Caplan, C.; Arnaud, M.; Ashdown, M.; Atrio-Barandela, F.; Aumont, J.; et al. Planck 2013 results. XI. All-sky model of thermal dust emission. Astron. Astrophys. 2014, 571, A11. [Google Scholar]
- Kalberla, P.M.; Burton, W.B.; Hartmann, D.; Arnal, E.M.; Bajaja, E.; Morras, R.; Pöppel, W.G. The Leiden/Argentine/Bonn (LAB) survey of galactic HI. Final data release of the combined LDS and IAR surveys with improved stray-radiation correction. Astron. Astrophys. 2005, 440, 775–782. [Google Scholar] [CrossRef]
- Reynolds, R.J.; Tufte, S.L.; Kung, D.T.; McCullough, P.R.; Heiles, C. A comparison of diffuse ionized and neutral hydrogen away from the Galactic plane: Hα-emitting HI clouds. Astrophys. J. 1995, 448, 715–726. [Google Scholar] [CrossRef]
- Haffner, L.M.; Dettmar, R.J.; Beckman, J.E.; Wood, K.; Slavin, J.D.; Giammanco, C.; Madsen, G.J.; Zurita, A.; Reynolds, R.J. The warm ionized medium in spiral galaxies. Rev. Mod. Phys. 2009, 81, 969–997. [Google Scholar] [CrossRef] [Green Version]
- Finkbeiner, D.P. A Full-Sky Hα Template for Microwave Foreground Prediction. Astron. Astrophys. 2003, 146, 407–415. [Google Scholar] [CrossRef]
- Hill, A.S.; Reynolds, R.J.; Benjamin, R.A.; Haffner, L.M. Density distribution of the warm ionized medium. Astrophysics 2007, 365, 250–253. [Google Scholar]
- Witt, A.N.; Gold, B.; Barnes, F.S.; DeRoo, C.T.; Vijh, U.P.; Madsen, G.J. On the origins of the high-latitude Hα background. Astrophys. J. 2010, 724, 1551–1560. [Google Scholar] [CrossRef]
- Woosley, S.E.; Waever, T.A. The Evolution and Explosion of Massive Stars. II. Explosive Hydrodynamics and Nucleosynthesis. Astron. Astrophys. 1995, 101, 181–235. [Google Scholar]
- Compiègne, M.; Verstraete, L.; Jones, A.; Bernard, J.P.; Boulanger, F.; Flagey, N.; Le Bourlot, J.; Paradis, D.; Ysard, N. The global dust SED: Tracing the nature and evolution of dust with DustEM. Astron. Astrophys. 2011, 525, A103. [Google Scholar] [CrossRef]
- Berezhko, E.G. Gamma-ray astronomy and cosmic ray origin problem. Adv. Space Res. 2005, 35, 1031–1040. [Google Scholar] [CrossRef]
- Dubner, G.; Giacani, E. Radio emission from supernova remnants. Astron. Astrophys. Rev. 2015, 23, 3. [Google Scholar] [CrossRef]
- Vidal, M.; Dickinson, C.; Davies, R.D.; Leahy, J.P. Polarised radio filaments outside the Galactic plane. Mon. Not. R. Astron. Soc. 2015, 452, 656–675. [Google Scholar] [CrossRef]
- Dettmar, R.-J.; Shchekinov, Y.A. Nonthermal radio-continuum from blow-outs and magnetic Parker loops. In Proceedings of the 27th International Cosmic Ray Conference, Hamburg, Germany, 7–15 August 2001. [Google Scholar]
- Zheng, H.; Tegmark, M.; Dillon, J.S.; Kim, D.A.; Liu, A.; Neben, A.R.; Jonas, J.; Reich, P.; Reich, W. An improved model of diffuse galactic radio emission from 10 MHz to 5 THz. Mon. Not. R. Astron. Soc. 2017, 464, 3486–3497. [Google Scholar] [CrossRef]
- Adebahr, B.; Krause, M.; Klein, U.; Weżgowiec, M.; Bomans, D.J.; Dettmar, R.J. M 82—A radio continuum and polarisation study. I. Data reduction and cosmic ray propagation. Astron. Astrophys. 2013, 555, A23. [Google Scholar] [CrossRef]
- Heesen, V.; Dettmar, R.J.; Krause, M.; Beck, R.; Stein, Y. Advective and diffusive cosmic ray transport in galactic haloes. Mon. Not. R. Astron. Soc. 2016, 458, 332–353. [Google Scholar] [CrossRef] [Green Version]
- Lan, T.-W.; Ménard, B.; Zhu, G. Exploring the diffuse interstellar bands with the Sloan Digital Sky Survey. Mon. Not. R. Astron. Soc. 2015, 452, 3629–3649. [Google Scholar] [CrossRef] [Green Version]
| 1 | Similar estimate is obtained recently from a detailed analysis of Sco-Cen star formation history [31]. |
| 2 | An alternative energy source for the NPS—two subsequent huge explosions not necessarily connected with a starbursts is advocated in the review by Kataoka et al. [18] based on a systematic analysis of available X-ray data. |
| 3 | It is important to stress that such energy input suggests concerted SN explosions, in which case radiative energy loss in interacting overlapping remnants might be severely enhanced [35]. As a result, the required injected energy should be at least factor of 10 higher than estimated in [38,39], see Figure 1. |
| 4 | For the specific SN rate of SN per |
| 5 | |
| 6 | For this estimate we used dust extinction model cm per H atom at mm, as accepted for the diffuse ISM at high galactic latitudes in [70]. |
Figure 1.
(Left) Evolution of the heating efficiency—a fraction of total energy injected by explosions retained in form of thermal energy in the phase with a given temperature (as indicated in the legend), top to bottom: SN rate , , , ∼, and yr in the computational volume pc—the volume nearly equal to the CMZ. (Right) The volume filling factor of gas with given temperatures (see legend) for the same SN rates. From [35].

Figure 2.
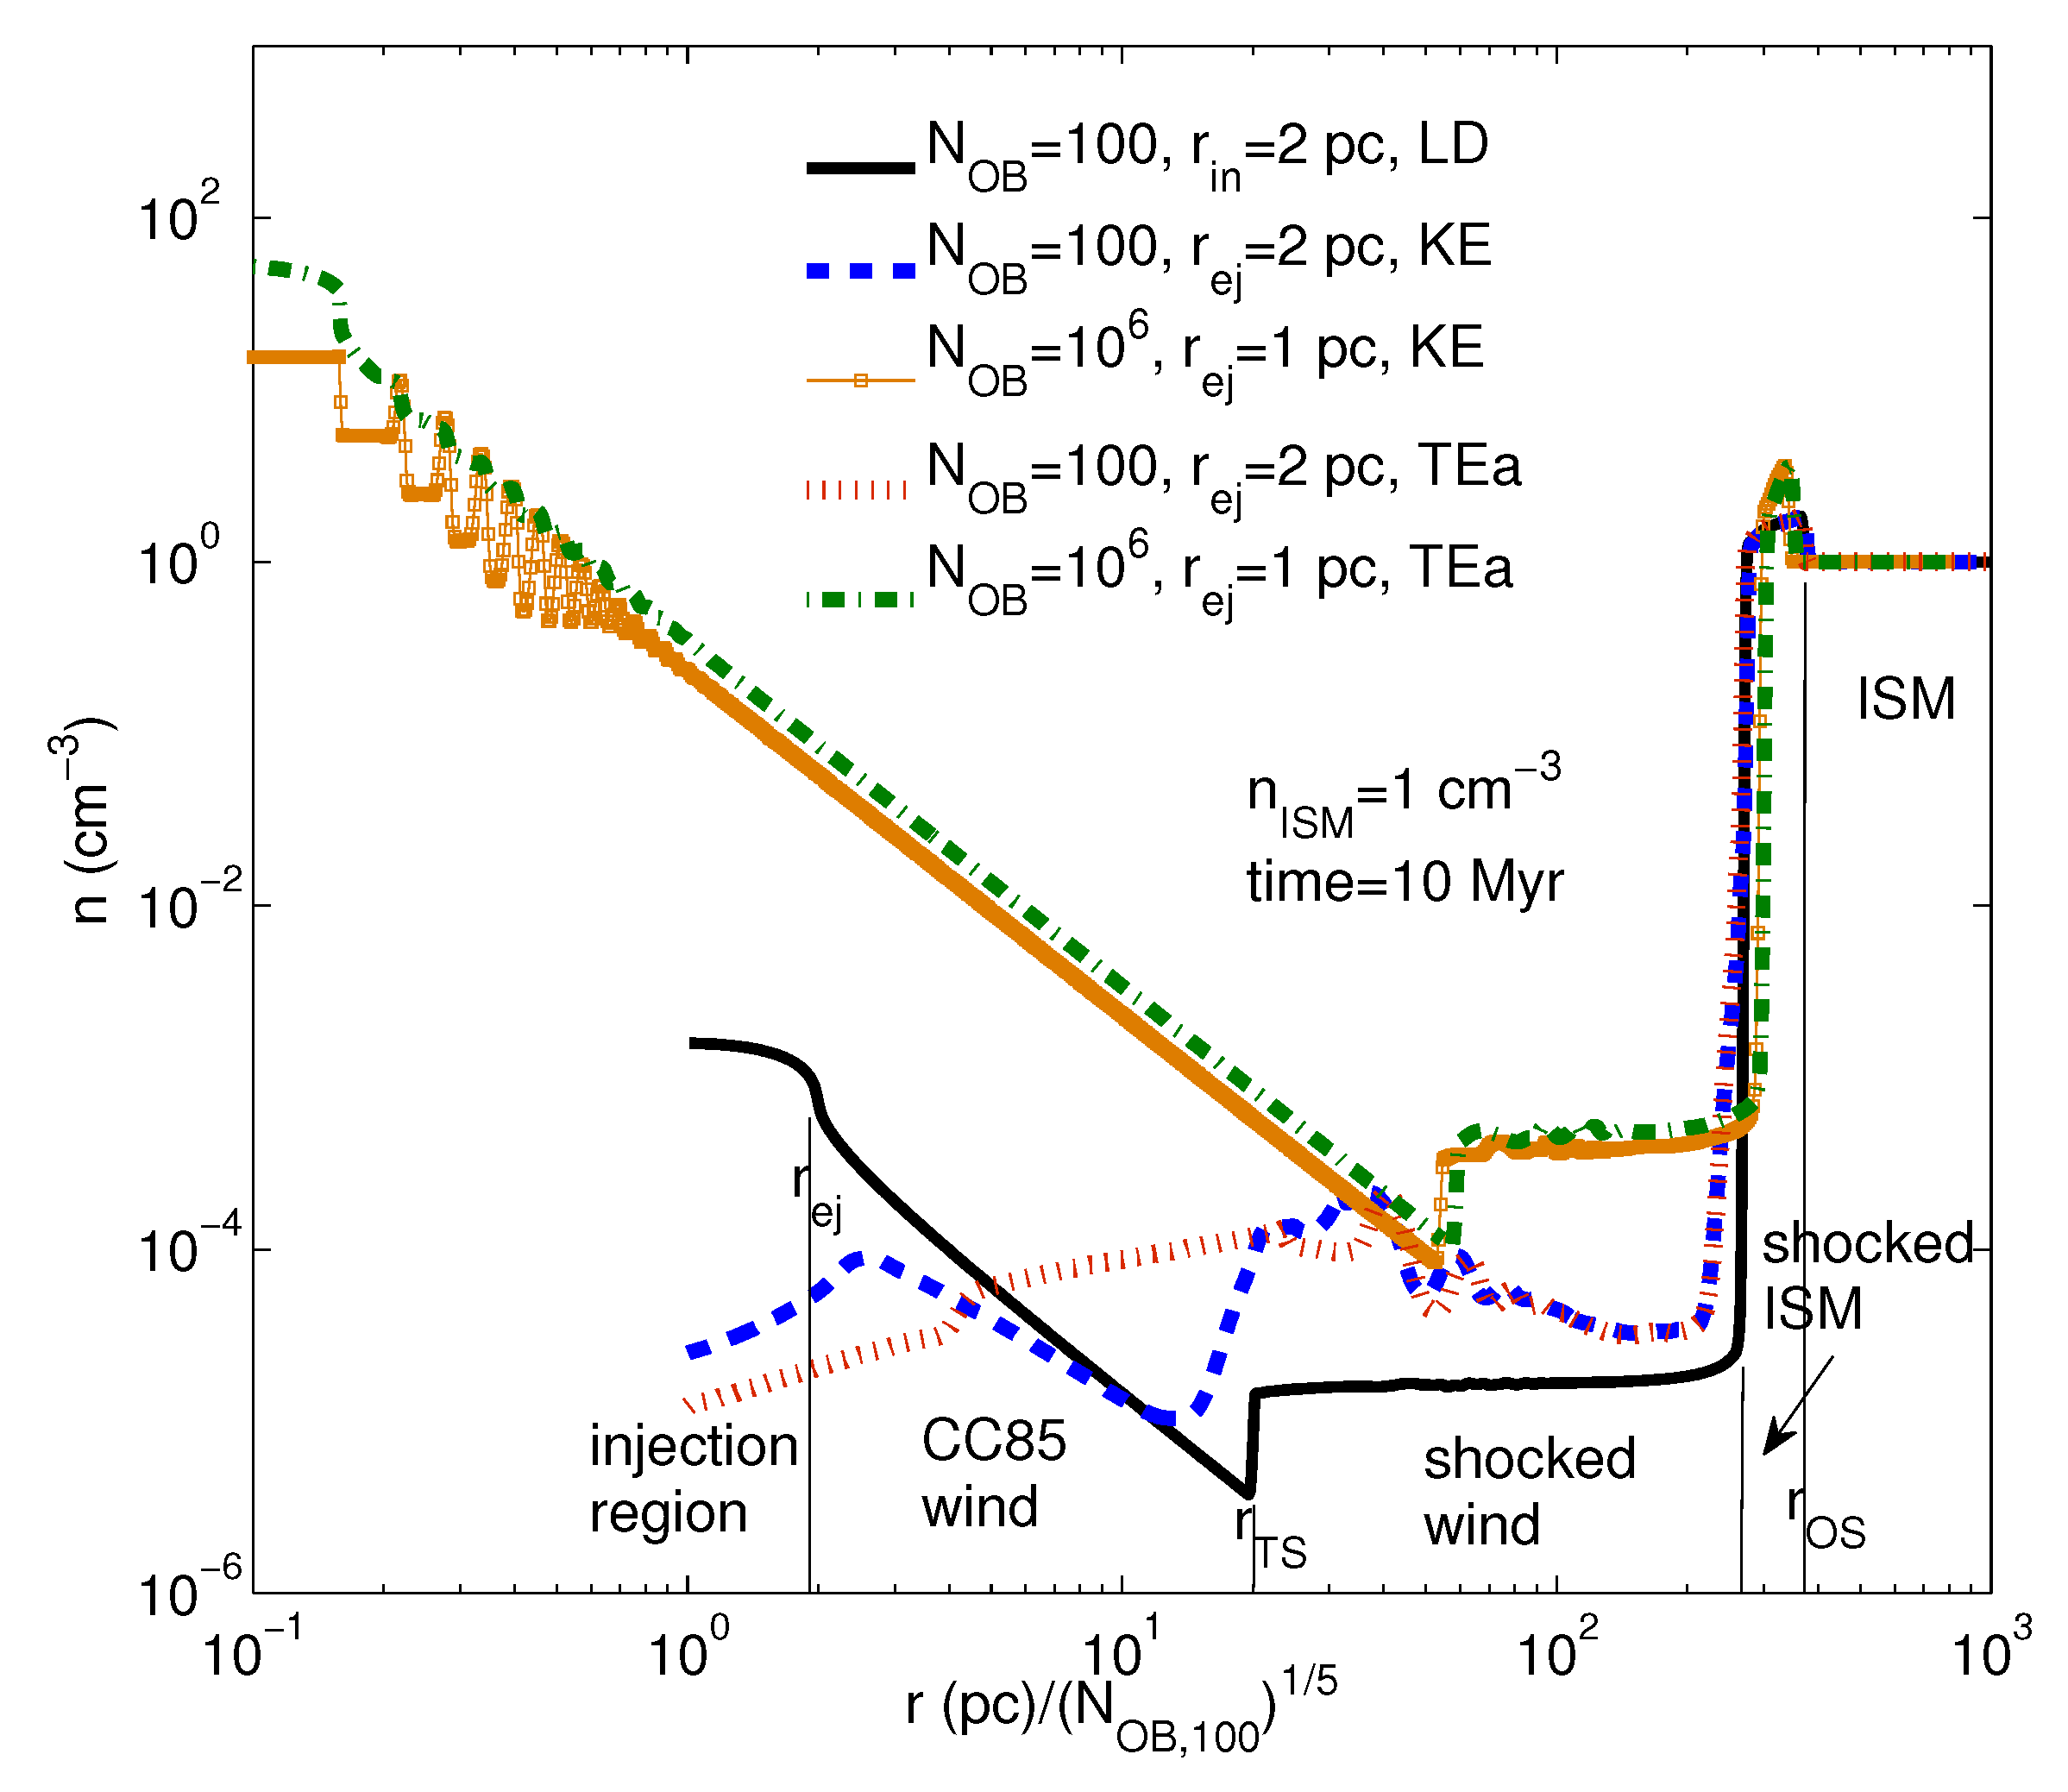
Density profiles vs normalized radius of the remnant formed by sequential explosions of SNe at in a small injection sphere with , see details in [48]. Energy is injected by with a rate , Myr as assumed in [48]; energy is injected in the form of kinetic energy (KE), thermal energy (TE), or the bubble is fed by the mechanical luminosity , B. It is seen that for rare explosion events each SN ejecta expands into a very low-density cavity—it is nearly an expansion into vacuum. For higher the profile approach the Chevalier-Clegg wind solution [49], where every portion of energy injection has to share it with the whole bubble through thermolization. From [48].
Figure 2.
Density profiles vs normalized radius of the remnant formed by sequential explosions of SNe at in a small injection sphere with , see details in [48]. Energy is injected by with a rate , Myr as assumed in [48]; energy is injected in the form of kinetic energy (KE), thermal energy (TE), or the bubble is fed by the mechanical luminosity , B. It is seen that for rare explosion events each SN ejecta expands into a very low-density cavity—it is nearly an expansion into vacuum. For higher the profile approach the Chevalier-Clegg wind solution [49], where every portion of energy injection has to share it with the whole bubble through thermolization. From [48].

Figure 3.
(Left) Thermal energy in a superbubble from sequential SNe explosions in a stratified ISM in the Galactic center; black lines depict the total thermal energy, red lines—thermal energy of gas with K, upper curves are for the SN rate yr, lower are for yr, SNe explode in a cluster of radius pc, gas scale height is 100 pc, the halo gas component has constant density cm. (Right) The ratio of thermal to total injected energy for all three model in the (Left) panel. The flattening of the energy growth is clearly seen in the (Left) panel between and Myr for lower SN rate, and between 0.2 and 0.6 Myr for higher SN rate. After the flattening radiative losses in the disk become inefficient compared to continuously injected energy, and thermal energy grows almost linearly. Later on, at around 1 to 4 Myr radiation increases in the shell when the downward parts of the shock wave cover a considerable fraction of the ISM disk. From [50].

Figure 4.
Density maps for superbubbles formed by a central stellar cluster with SNe rates yr at Myr (left), and yr at Myr (right). Clearly seen is a very low density— cm inside the bubble, and even an order of magnitude lower cm in the domain close to the cluster. From [50].
Figure 4.
Density maps for superbubbles formed by a central stellar cluster with SNe rates yr at Myr (left), and yr at Myr (right). Clearly seen is a very low density— cm inside the bubble, and even an order of magnitude lower cm in the domain close to the cluster. From [50].

Figure 5.
HI distribution in an expanding superbubble in the model shown in Figure 4 at the age 4 Myr (the central region is zoomed in to compare to Figure 4), color bar shows HI column density from to 18 cm. (From [50]).

Figure 6.
(Upper Left) ROSAT keV image of the NPS [61], (the map is taken from http://www.mpe.mpg.de/xray/wave/rosat/publications/highlights/all$_$sky$_$survey.php); (Upper Right) low velocity HI all sky map— km s (taken from [62]), originally from 21 cm LAB all-sky survey by Kalberla et al. [63]; (Lower Left) Planck dust optical depth at 353 GHz (from [62]); (Lower Right) Planck dust temperature map (from [62]). There is the north-east offset of the low column density 21 cm (), and low 353 GHz optical depth () tongues with respect to the NPS. It is also clear that and dust temperature do anti-correlate mostly through over the whole field and particularly in the low- tongue (see discussion in text) .

Figure 7.
(Left) The full sky map of cumulative DIB absorptions (combined in total of 20 DIB lines) smoothed with a -gaussian kernel; the map includes regions with ; (Right) the map showing median distance to the SDSS stars used in the coverage [78]. Clearly seen is that in the area of HI tongues neighbouring the X-ray NPS, the median distance is fairly flat of ≃ kpc with a weak patchy deviations. Both maps are from [78].

© 2018 by the author. Licensee MDPI, Basel, Switzerland. This article is an open access article distributed under the terms and conditions of the Creative Commons Attribution (CC BY) license (http://creativecommons.org/licenses/by/4.0/).
Share and Cite
MDPI and ACS Style
Shchekinov, Y. Multi-Wavelength Observations and Modeling of Loop I. Galaxies 2018, 6, 62. https://doi.org/10.3390/galaxies6020062
AMA Style
Shchekinov Y. Multi-Wavelength Observations and Modeling of Loop I. Galaxies. 2018; 6(2):62. https://doi.org/10.3390/galaxies6020062
Chicago/Turabian StyleShchekinov, Yuri. 2018. "Multi-Wavelength Observations and Modeling of Loop I" Galaxies 6, no. 2: 62. https://doi.org/10.3390/galaxies6020062
Note that from the first issue of 2016, this journal uses article numbers instead of page numbers. See further details here.