Article

Influence of Non-Linear Rotor Dynamics on the Bearing Friction of Automotive Turbochargers

1
VKA, Institute for Combustion Engines RWTH Aachen University, Forckenbeckstr. 4, 52074 Aachen, Germany
2
FEV Europe GmbH, Neuenhofstr. 181, 52078 Aachen, Germany
*
Author to whom correspondence should be addressed.
Lubricants 2017, 5(3), 29; https://doi.org/10.3390/lubricants5030029
Submission received: 11 July 2017 / Revised: 1 August 2017 / Accepted: 2 August 2017 / Published: 4 August 2017
(This article belongs to the Special Issue Bearings in Turbomachinery)

Abstract

:
One of the possibilities to increase the efficiency of an internal combustion engine is to enhance its interaction with the charging system. With the help of new advanced simulation tools, the rotor dynamic behavior and bearing friction losses of turbochargers (TC) can be quantified in the early stage of the development process. This procedure enables virtual bearing development, leading to shortened development times and reduced testing costs. This paper presents a detailed view of the findings in current research; focusing on rotor dynamic simulations with emphasis on the non-linear dynamics (oil whirl; oil whip) and their impact on bearing friction losses. In order to obtain a detailed understanding of these effects; elastic multibody simulations (EMBS) with elastic hydrodynamic bearing (EHD) analysis including a mass-conservative approach are used. Measurement data is obtained using a unique test bench which is designed to quantify the bearing friction losses by means of a drag test. Additionally, hot gas test bench measurements are carried out to assess the non-linear rotor dynamics during steady state operation using shaft motion measurement equipment. In the first step; a multibody simulation model of a common automotive TC is set up; and a model of the friction test bench is mapped into it. The author will show that there is a high agreement between simulated and measured friction losses. In the second step; the TC model is detached from the virtual test bench and a variation of the essential parameters are carried out to identify the influence of the non-linear rotor dynamics on the bearing friction. A final model validation is obtained by comparing the measured shaft orbits for the TC hot gas test bench with the results from the multibody simulation.

1. Introduction

The continuing demand for reducing CO2 emissions and fuel consumption of internal combustion engines (ICE) is associated with downsizing in combination with high specific power in recent years. The engine displacement or the numbers of cylinders are reduced and an increase in specific power is achieved through a boosting device. Boosted downsized engines with direct injection (DI) technology provide improved efficiency and can achieve 10–15% fuel efficiency benefits compared to natural aspirated engines with equal power output (Golloch [1], Weinowski et al. [2]). Usually, exhaust-gas turbochargers are used as an efficient charging concept in ICE.
Due to the high number of turbocharged engines in the market, the continuous improvement of the turbochargers (TC) performance is of major interest in development. On the one hand, special attention is given to improve the aerodynamic efficiency (e.g., variable nozzle TC (O’Conner and Smith [3]) or twin scroll turbines (Lückmann et al. [4]); on the other hand there are intensive research activities in the field of the turbocharger bearing systems and their resulting mechanical losses. In [5,6] it was shown that there is still significant potential for increasing effective turbine efficiencies, especially in the context of mechanical losses. Friction losses of the TC affect the minimum engine speed, from where the desired low-end torque (LET) can be achieved. The transient performance of the engine is significantly influenced. Furthermore, the part-load fuel consumption of Diesel engines can be decreased with reduced TC friction. Due to high rotational speeds (up to 300,000 1/min in common automotive turbochargers) and high thrust loads of up to ±150 N depending on the operating condition (Uhlmann [7]), hydrodynamic bearings are the predominant bearing technology. Rotor systems with hydrodynamic bearings show non-linear motion behavior with synchronous unbalanced vibrations and subharmonic phenomena (oil whirl and oil whip, see e.g., [8,9,10,11,12]). To ensure safe operation, these effects must be attenuated as much as possible. Therefore, hydrodynamic (semi-/full-) floating ring bearings with a coupled inner and outer oil film are applied as they offer a better damping behavior than single film bearings. Since the non-linear motion behavior influences the mechanical losses arising from the bearing system, it is important to consider the entire turbocharging system at an early stage of development.
An elastic multi-body simulation (EMBS) coupled with finite element method (FEM) calculations for the simultaneous solution of the non-linear hydrodynamic lubricating film pressures (and reaction forces) is currently the most efficient and accurate method for this kind of analysis, see e.g., these studies [10,13,14,15]. Most publications focus on the vibrations occurring during a speed ramp-up. In the present paper the authors measured the bearing friction of a common automotive turbocharger for three different oil inlet temperatures on a dedicated component test bench customized for turbocharger bearing friction analysis. Additionally, hot gas test bench measurements were carried out to capture the shaft motion of this turbocharger. EMBS simulations (for structural dynamics of the flexible shaft and mounted components) and fully-coupled simultaneous FE evaluation of the Reynolds lubrication equation (for the hydrodynamic analysis of the bearing oil films) with both test bench conditions are carried out to validate the simulation model. In a last step, parameter variations of the unbalanced masses and the unbalance phase of compressor and turbine wheel, as well as of the wheel sizes are carried out to answer the following questions:
  • Compressor and turbine wheels are removed to neglect aerodynamic losses at the friction test bench. Are the bearing friction measurements on the friction test bench transferable to the bearing behavior of the hot gas test bench with complete rotor assembly?
  • How much do the non-linear rotor dynamics influence the resulting friction?
  • Are the mechanical losses dependent on balance quality and/or wheel sizes?

2. Methodology

In the following Section, a detailed description of the tested turbocharger, the experimental investigations as well as of the simulation model is given.

2.1. Examined Turbocharger

The investigated turbocharger is a common variable nozzle turbocharger (VNT) with semi-floating bearings for Diesel engines which is in series production of different light duty and passenger vehicles. The geometry was 3D scanned and CAD data were re-generated to use the detailed geometry for the simulation model. To validate the 3D CAD data and material (density) the rotational inertia for compressor wheel, turbine and shaft was measured on a pendulum type test bench by determining the oscillation period and compared to the computational model using Equations (1) and (2). Figure 1 shows the pendulum test bench and a schematic view of it.
J TC   =   J Measurement     J TestSetup
J Measurement   =   ( T 2 π ) 2 ( m T C +   m T e s t S e t u p ) g r 2 l
  • T = period time of one oscillation
  • m = mass of the rotor assembly
  • r = distance from rotational axis to strings attachment to the rotor
  • l = string length
  • g = gravity
  • J = inertia
The turbocharger has a compressor exducer diameter of D 2   =   52   mm , a turbine inducer diameter of D 3   =   43   mm and a total assembly length of L   =   121.4   mm . The effective shaft diameter at the journal bearing D Shaft is 7.9 mm. The measured masses and rotational inertias can be found in Table 1.
The bearing system consists of a semi-floating journal bearing, where the rotational movement is fixed. For that, an anti-rotation pin is used on the compressor side of the bearing. Such a bearing type can be seen in Figure 6. Additionally, an axial movement of the bearing is not possible due to a centered fixation pin in the middle of the semi-floating ring. In order to support the turbocharger in axial direction, a segment pad thrust bearing is used with symmetrical design on compressor/turbine side. Main dimensions of the bearing system can be found in Table 2 below.

2.2. Experimental Investigations

For the experimental investigations two different methods were used. First, the examined turbocharger is set-up on a friction test bench which was specially designed to quantify the friction losses of TC bearings. In a second step, the shaft motion for the same turbocharger was measured on a hot gas test bench to obtain validation data for the simulation model.

2.2.1. Turbocharger Friction Test Bench

In this section the experimental setup is described that was used to obtain the bearing friction loss. The rotor of the turbocharger is driven by a high speed electric engine which itself is supported by electro-magnetic bearings, thus enabling operating speeds of up to nTC = 140,000 1/min. Friction losses Pf of the turbocharger bearings are determined through direct torque measurement (Mf) between the electric drive motor and the turbocharger bearings:
P f   =   2 π n TC M f
The torque sensor used in this application features a measurement range of 100 N mm. The thrust bearing of the turbocharger can be loaded with thrust forces of up to Fax = 100 N in either positive (“pulling of turbine”) or negative (“pulling of compressor”) direction by using a magnetic linear actuator. The thrust load can be controlled independently of the operating speed. The electric drive motor and the TC rotor are connected through a pin joint coupling, which allows to transmit thrust forces from the linear actuator onto the TC bearing. In order to eliminate any aerodynamic drag, the rotor wheels are removed from the shaft. Hence, the measured drag torque is resulting purely from the friction losses generated within the bearing system (neglecting negligible windage losses on the shaft surface). Special care is taken to ensure precise alignment between the electric motor shaft and the turbocharger rotor shaft. Temperature and pressure of the oil feeding the bearing are controlled by using a conditioning unit. The feed temperature can be varied ranging from 40 °C up to 120 °C, whereas the (absolute) feed pressure can be controlled between 1 bar and 6 bar. The oil is discharged into ambient conditions at the outlet of the bearing housing. Standard 5W30 synthetic oil is used for the present measurement. The test bench setup is shown schematically in Figure 2.

2.2.2. Hot Gas Turbocharger Test Bench

In addition to the measurements on the friction tests bench, the turbocharger has also been operated on a hot gas turbocharger test bench. The overall setup is highlighted in Figure 3. In this particular case the energy to drive the turbine is provided by a natural gas burner which is installed upstream of the turbine housing. A specially machined measurement pipe is installed upstream and downstream of the turbine housing in order to quantify its specific inlet and outlet conditions in terms of temperature and pressure. The mass flow rate through the turbine is measured upstream of the combustion chamber divided in the fresh dried air and natural gas share. An eddy current speed sensor is installed into the compressor housing to measure the speed of the turbocharger. As the main objective of the hot gas test bench measurements is the quantification of the rotor dynamics during operation, high frequency eddy current sensors are installed close to the compressor nut (see Figure 4). The sensors were calibrated prior to testing on the actual material of the compressor nut to ensure high measurement accuracy. The two sensors were synchronized in order to allow an absolute allocation of the rotor throughout the measurement.
The tests used for the calibration and validation of the multibody simulations (MBS) model mainly consist of a speed variation. Here, the compressor was operated close to its peak efficiency curve. The compressor mass flow rate was controlled through backpressure valves which are installed downstream of the compressor. A total number of 6 operating points were measured in a speed range from 97,000 1/min < nTC < 195,000 1/min as listed in Table 3.
The speed of the turbocharger is changed by adapting the turbine mass flow rate. Each operating point was run under stationary boundary conditions (const. turbine flow rate) and was checked for complete convergence by monitoring the stability of every variable shown in Figure 3. After convergence is detected the high frequency shaft motion measurement is triggered to log for 2 s. In order to keep the boundary conditions in line with the friction test bench, all tests were carried out with the identical 5W30 oil type as well as an oil inlet temperature of Toil = 90 °C and an oil inlet pressure of poil = 4 bar (abs.). For all operating points the thrust load was calculated using the method of Nguyen [10], which was implemented in a simulation tool by Lückmann et al. in study [16]. A negative thrust load (“compressor pulls”) is observed in nearly all points (Table 3).

2.3. Numerical Investigations

In the following section, a brief overview on the simulation model is given. Emphasis is placed on the modeling of hydrodynamic semi-floating ring and thrust bearings.

2.3.1. Elastic Multi-Body Simulation

For the simulation model, the commercial multibody simulation software FEV Virtual Engine © (FEV Europe GmbH, Aachen, Germany) is used. Figure 5 shows the general flow chart of the simulation process. During the buildup of the MBS model, CAD data of turbine and compressor wheel, bearing sleeves and center houses are used as input. In order to consider the shaft as a flexible body, Component Mode Synthesis (CMS) (according to Craig Jr. and Bampton [17]) methodology is used. Through this process, the shaft is discretized by FEM and the component modes for the CMS are calculated.
Due to the flexibility of the shaft, the rotor dynamics and the occurring modes (synchronous and sub-synchronous rotor oscillations) during operation of the overall model are represented with high accuracy. For the thrust load, representing the gas forces acting on the wheels, a magnitude force component can be applied on the turbine wheel.

2.3.2. Bearing Models

Generally, turbocharger bearings use floating rings in which the bearing sleeve is surrounded by a fluid film. A bearing sleeve that cannot rotate in the housing is called a semi-floating ring. In the inner side of the bearing sleeve (between rotor and sleeve) a full hydrodynamic oil-film can build up induced by the rotation of the rotor. At the outer side of the bearing sleeve only a hydrostatic oil film occurs due to the fact that no relative velocity exists between sleeve and housing. Here, the outer hydrostatic film pressure acts as an additional squeeze film damper. Figure 6 shows such a semi-floating ring concept. Generally, a single semi-floating bearing sleeve is used for two journal bearings.
The inner oil films can be simplified as a fluid wedge that is surrounded by the rotor and bearing sleeve. Due to the rotating journal, the lubricating oil is drawn into the wedge through the inlet (Nguyen-Schäfer [10]). The generalized Reynolds lubrication equation governs the pressure distributions p inner ( x i , y i , t ) and p outer ( x o , y o , t ) for the inner and outer oil films (only squeeze effect), according to Equation (4).
x [ ρ h ³ 12 η p x ]   +   y [ ρ h ³ 12 η p y ]   =   1 2 u ( ρ h ) x   +   ( ρ h ) t
In which ρ describes the oil density, η the oil dynamic viscosity, h the gap height and finally u the corresponding longitudinal relative velocity between rotor and bearing sleeve or between sleeve and housing respectively for each oil film. In the radial direction of the lubricating film, the velocity can be neglected (Dowson [18]).
In order to consider cavitation in the oil film, a mass conservative formulation of Equation (4) including the theory of Jakobsson, Floberg and Olsson (short: JFO-Theory) [19,20] is implemented. The resulting extended Reynolds lubrication equation including the cavitation fraction number r is given by Equations (5) and (6).
x [ ρ h 3 12 η p x ]   +   y [ ρ h 3 12 η p y ]   =   1 2 u ( ( ρ h ) x     ( ρ r h ) x )   +   ( ρ h ) t     ( ρ r h ) t
r   =   1     ρ vapor ρ
where ρ vapor is the density of the gas-vapor fluid mixture. To include roughness effects in the bearing as well, pressure flow factors ϕ ii p and shear flow factors ϕ ii s according to Rienäcker [21] and Lagemann [22] are used. Alternatively, the contact pressures can be calculated using the model of Greenwood and Tripp [23]. Due to the low oil film pressures in comparison to e.g., high-loaded con rod bearings of internal combustion engines, the oil density ρ is assumed to be constant. As a time-efficient approach without solving the 3D energy equation, a thermal-lumped model is used to calculate the temperature occurring in the oil film according to Equation (7).
c p · ρ · V · d T d t   =   c p · ρ · Q in · ( T oil     T )   +   P f
where c p describes the specific heat capacity, V the oil volume, Q in the oil inlet volume flow and T oil the oil inlet temperature. A thermal model which is also considering the heat transfer between oil and solid boundaries is currently under development. Reynolds lubrication equation and temperature calculation is coupled with the temperature-depending dynamic oil viscosity η ( T ) . At each time step, the current temperature is used to calculate the dynamic oil viscosity with a look-up table either from an oil supplier or with a rheological model according to Vogel [24] and Cameron [25]. For the investigations in this work, a look-up table for 5W30 oil type was used. Figure 7 shows the dependency of the dynamic oil viscosity from oil temperature for this oil, which was also used for the different measurements.
While the MBS motion derivatives are being solved, the Reynolds lubrication equation is simultaneously evaluated using the FEM. The resulting hydrodynamic load acts as a distributed force on the elastic shaft.
There is a wide range of thrust bearing designs being used to support the rotor in axial direction. In this work, a thrust bearing design idealized by a planar sliding shoe of finite width (pad thrust bearing), that is relevant for turbocharger applications has been considered. Pads, referred to as multiple sections of the circular surface of the bearing are designed as ramps. The working principle of pad thrust bearings, as shown in Figure 8, is also based on the hydrodynamic effect of the lubricating oil and can be described by the Reynolds lubrication equation (Equation (4)), too. Here, the relative velocity u is set to the cirumferential velocity U , which is calculated by the rotor speed ω and the mean diameter D m of the thrust collar. The bearing force that is generated by the oil film pressure acting on the thrust bearings arises from the wedge and squeeze film effects. At a certain oil film thickness, the bearing force balances the thrust load in order to maintain rotor stability in axial direction. The oil film thickness decreases with increasing thrust load on the rotor (Nguyen-Schäfer [10]). As only moderate thrust loads are considered for this work, an efficient and analytical solution of the Reynolds lubrication equation is used in accordance to DIN 31653. Through this analytical solution no in-time numerical integration must be calculated which leads to a very fast approach. At a given bearing geometry and boundary conditions, such as the bearing thrust load, the minimum oil film thickness is calculated from the dimensionless load number F B * according to Equation (8). Here, a relative tilting between rotor and thrust bearing is not considered. The effective oil temperature is computed using also an iterative thermal-lumped model based on the balance of heat flows in the thrust bearing.
F B *   =   F * ( C wed h min   ) 2   =   F ax · C wed 2 η · U · L 2 · W · Z   =   F B * ( h min C wed , W L )
where F * is the dimensionless load number in the hydrodynamic lubrication region, defined as
F *   =   F ax · ( h min L ) F f
With the friction force F f .

3. Results and Discussion

In this section, the measured and simulated results are presented and discussed. First, the friction losses occurring in the bearing system are both measured and simulated. Second, the shaft motion is measured using the hot gas test bench as described in Section 2.2.2 and simulated with the MBS model. At the end, the MBS model is used to carry out variations of the TC wheel sizes and unbalanced masses. The main objective is to get information about the influence of the shaft motion on the friction power without changing the bearing system. All measurements and simulations were carried out with an oil inlet pressure of poil = 4 bar (abs.).

3.1. Measurement of Bearing Friction and Validation of Simulation Model

As described in 
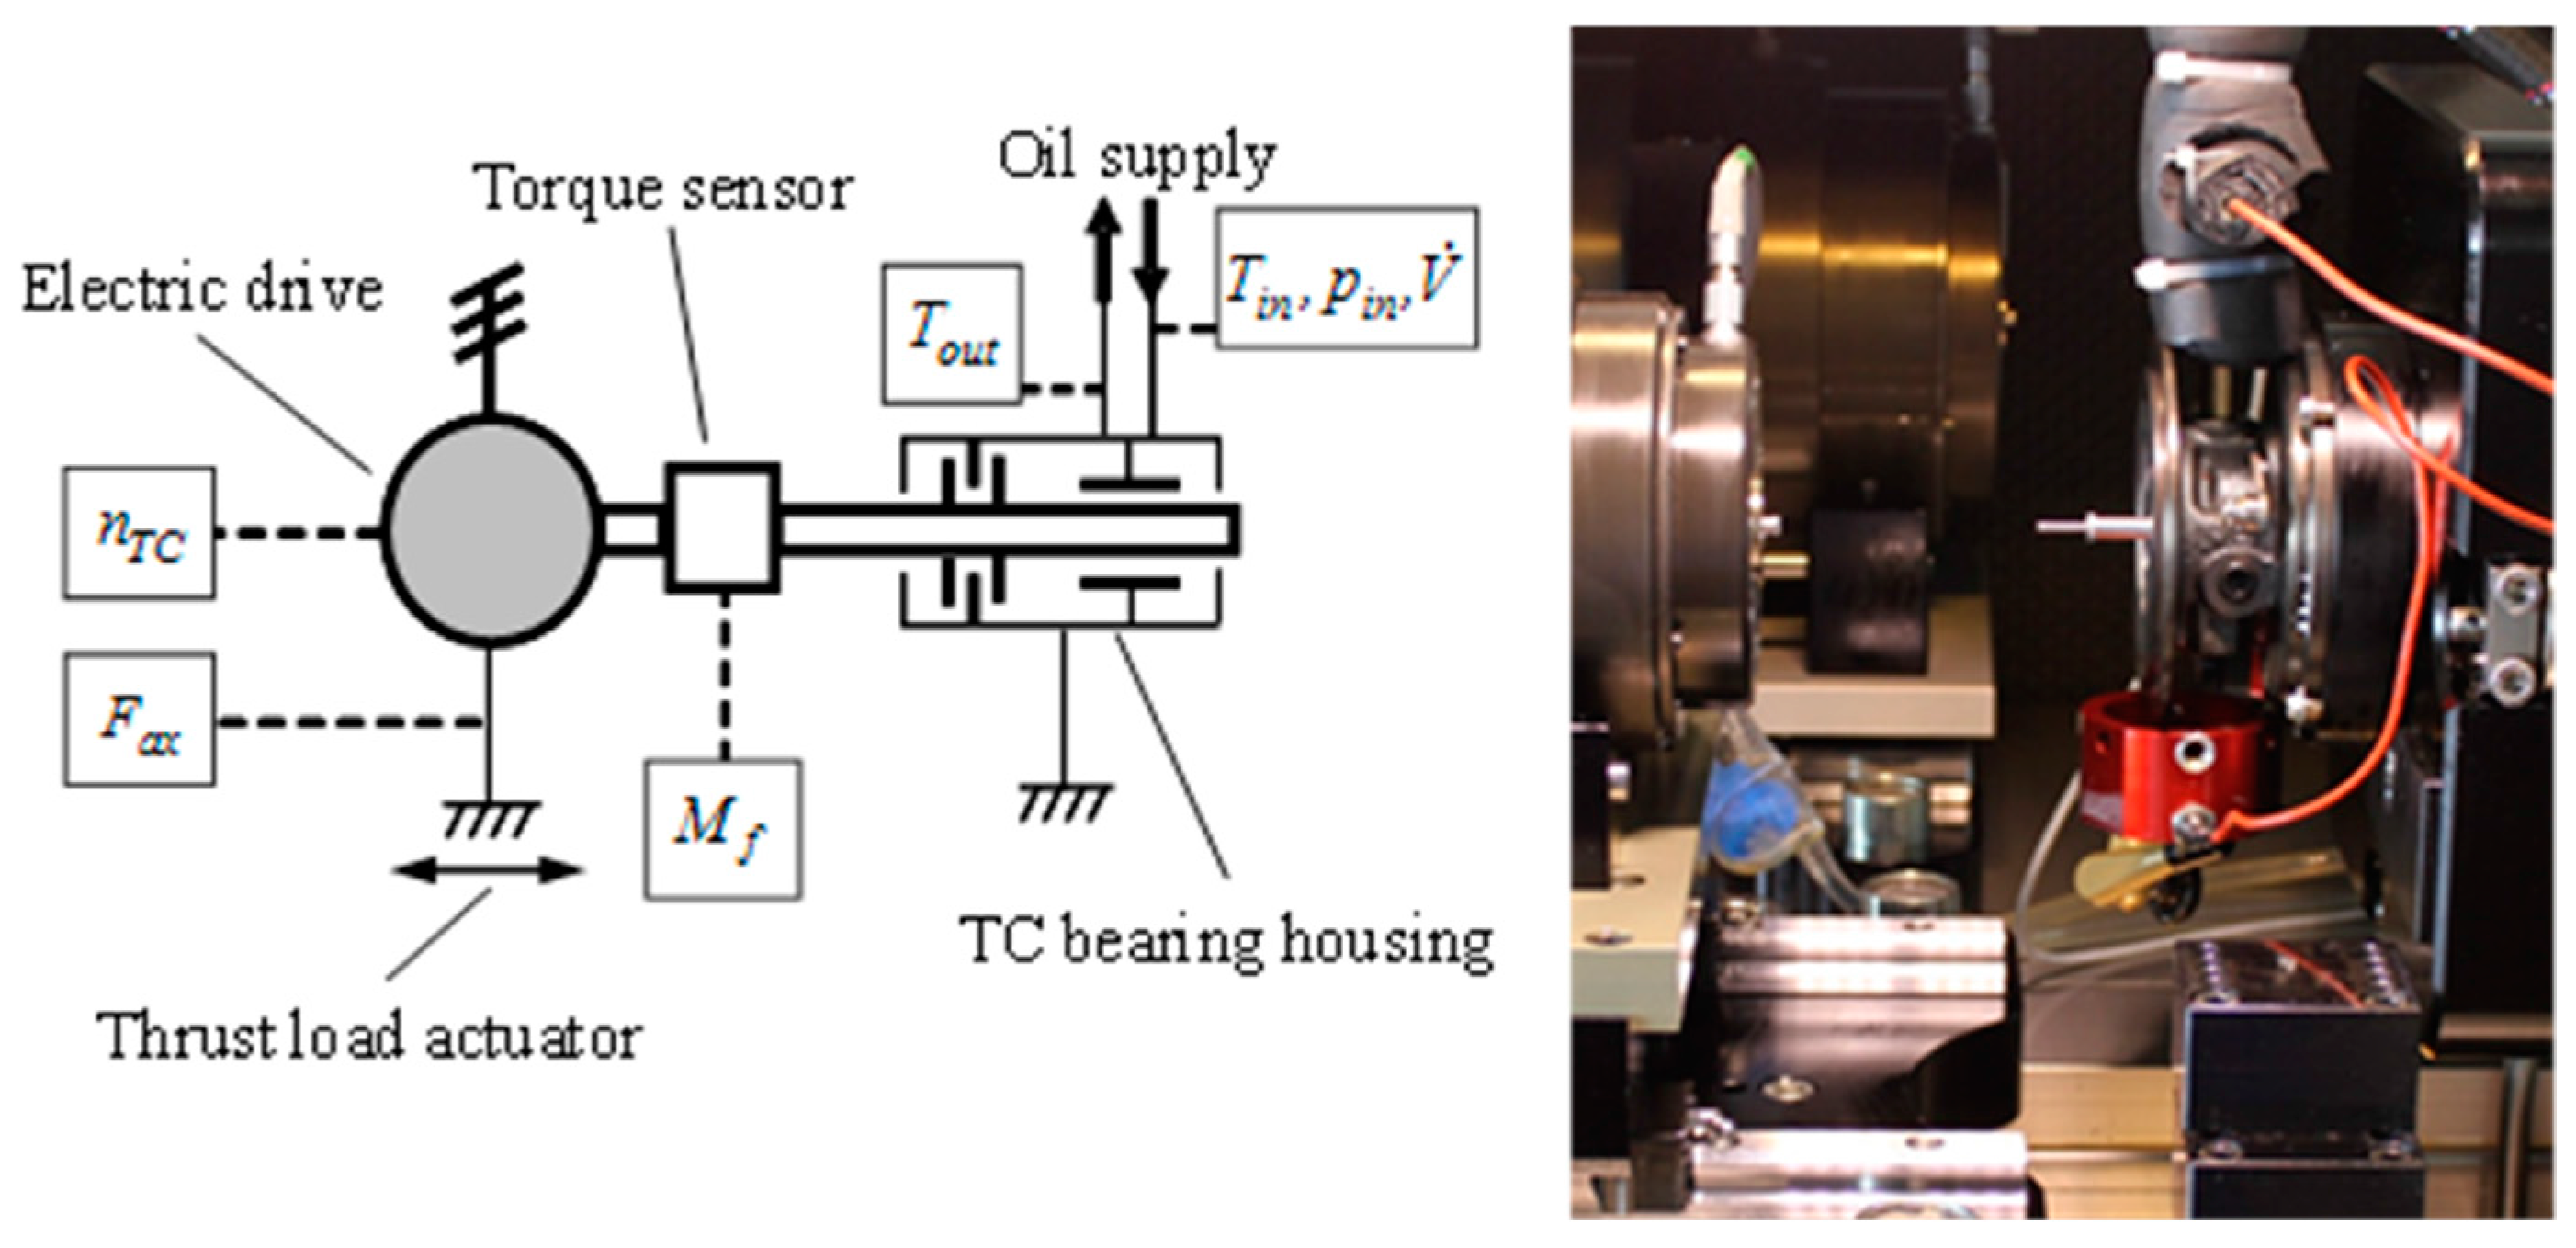
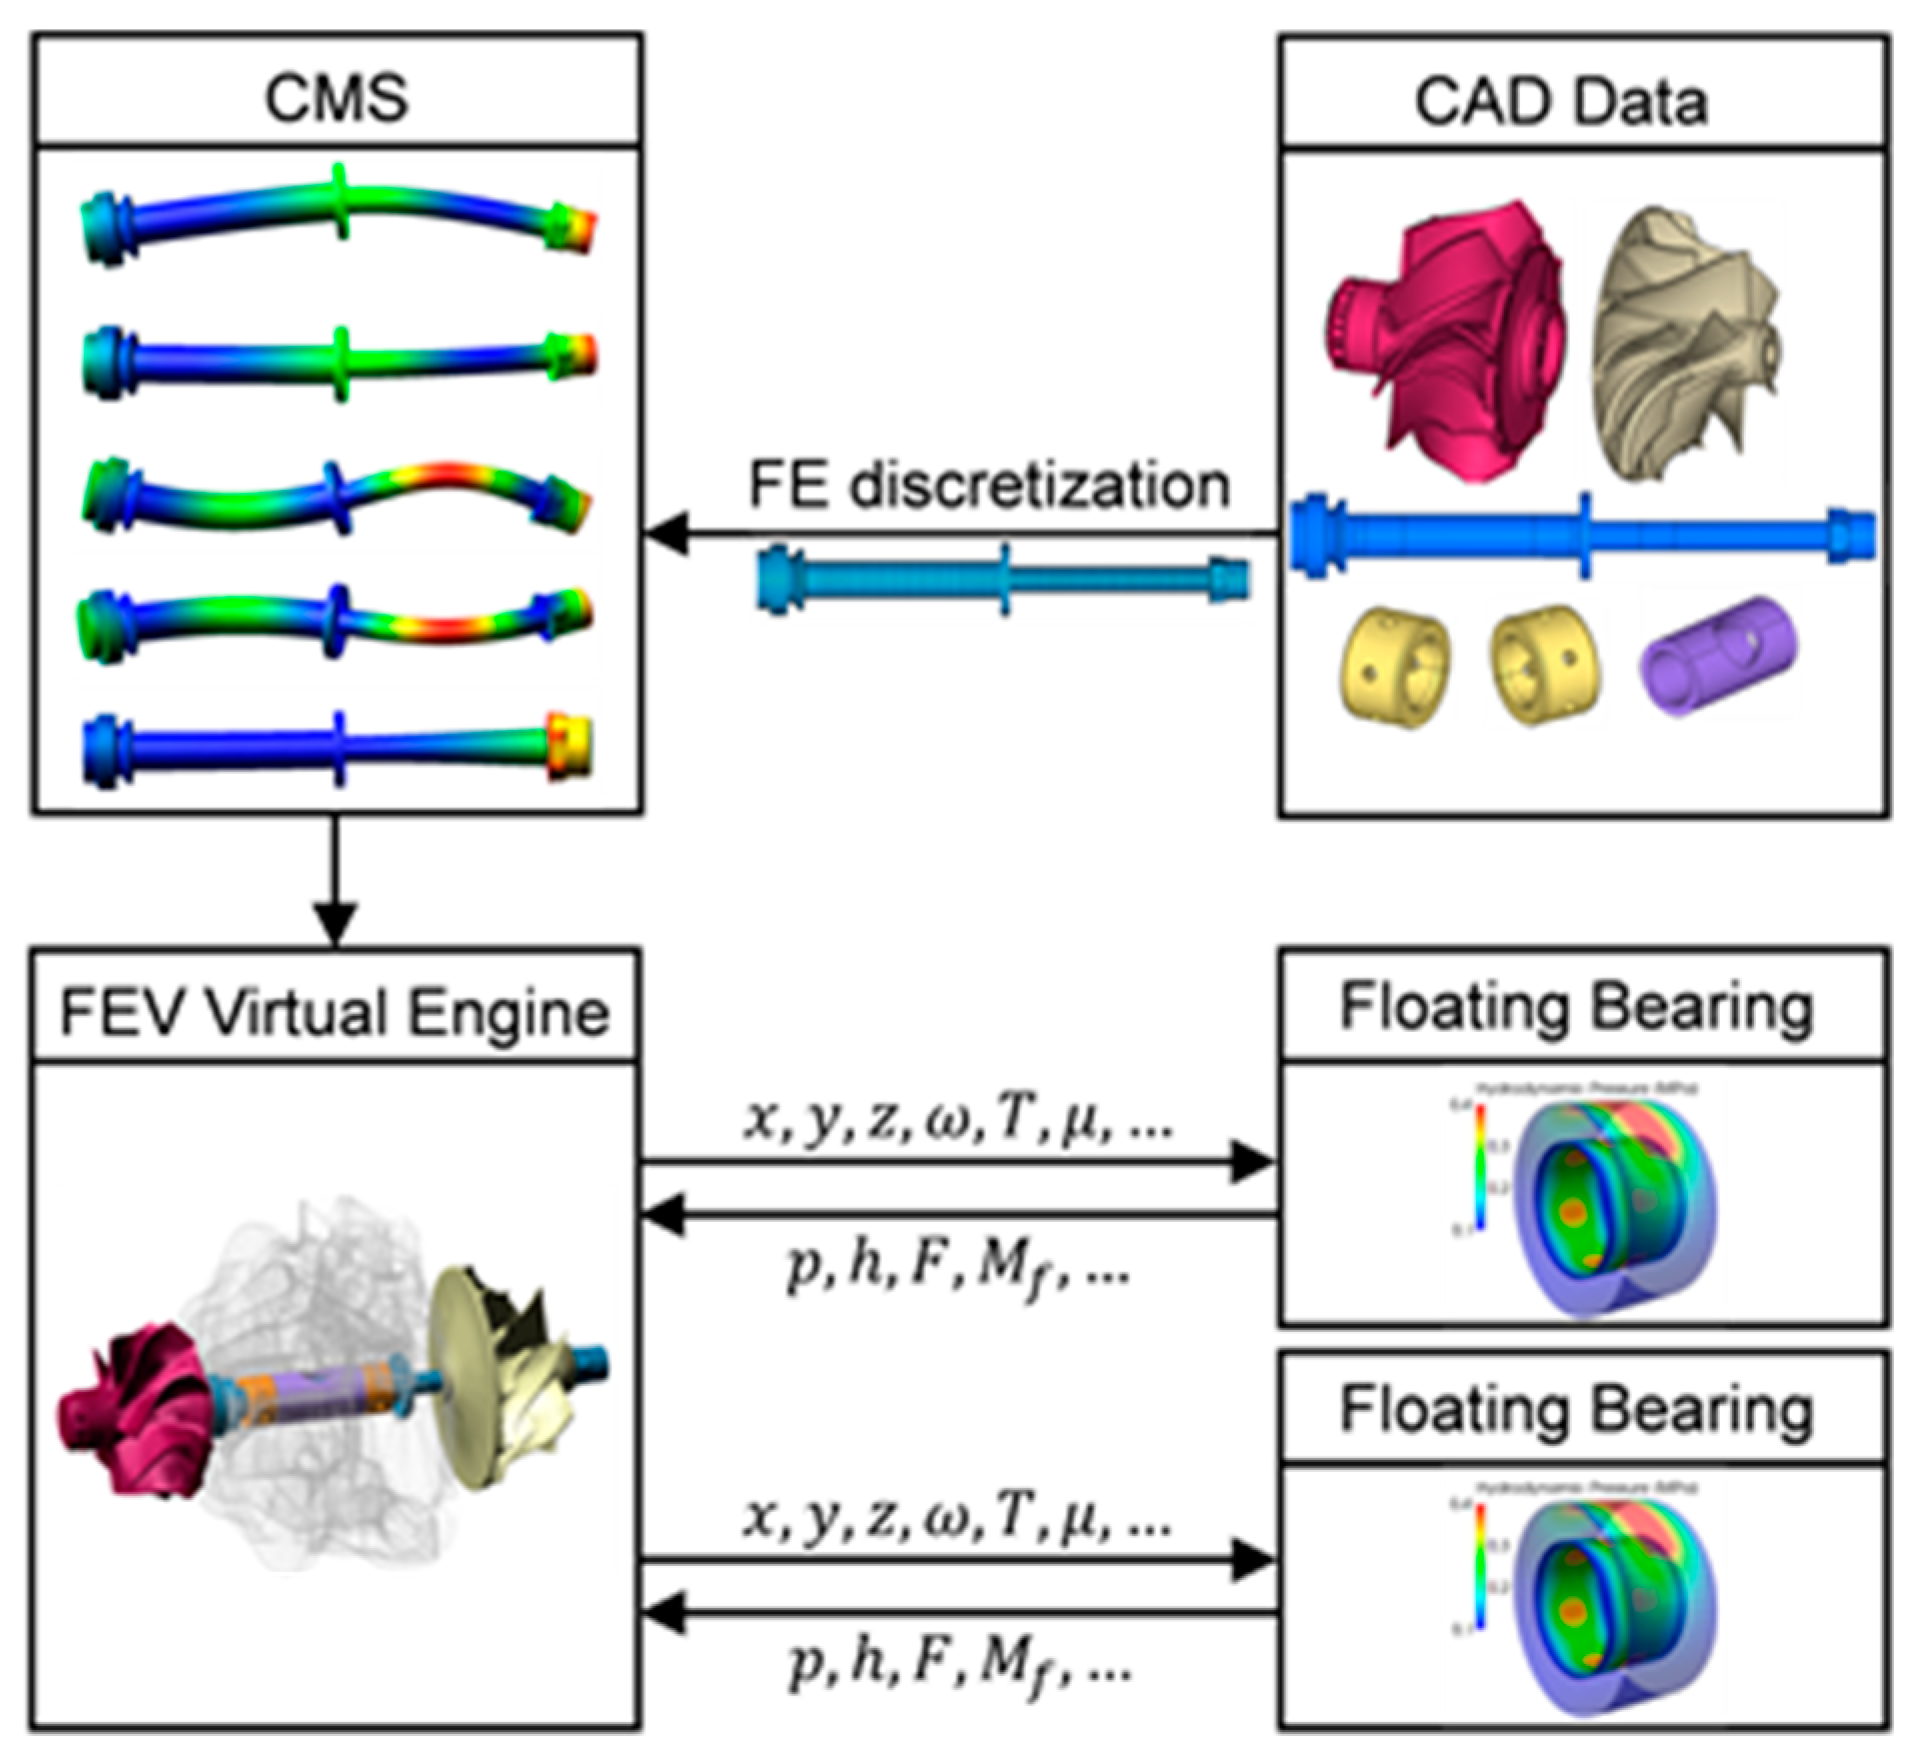
Section 2.2.1, the rotor wheels are removed from the shaft to eliminate aerodynamic drag on the friction test bench, so that the measured drag torque is resulting pureley from the friction losses generated within the bearing system. To get an accurate correlation of the turbocharger simulation model with the measurements, it is important to create a virtual model of the set-up from the test bench. That means, the turbine and compressor wheels in the model are removed and the rotational movement is given on the free end of the rotor at the compressor side which is radially supported with a linear bearing stiffness of K   =   200   N / mm as a spare electro-magnetic bearing. First, measurements and simulations with an oil inlet temperature Toil of 50, 70 and 90 °C from nTC = 0–120,000 1/min (measurement) and nTC = 0–170,000 1/min (simulation) and zero thrust load Fax were carried out. At around nTC = 170,000 1/min, the simulation model reaches a stability limit for all analyzed temperatures caused by very high rotor oscillation. The removed turbine and compressor wheels are here the probable reason as shown later in 
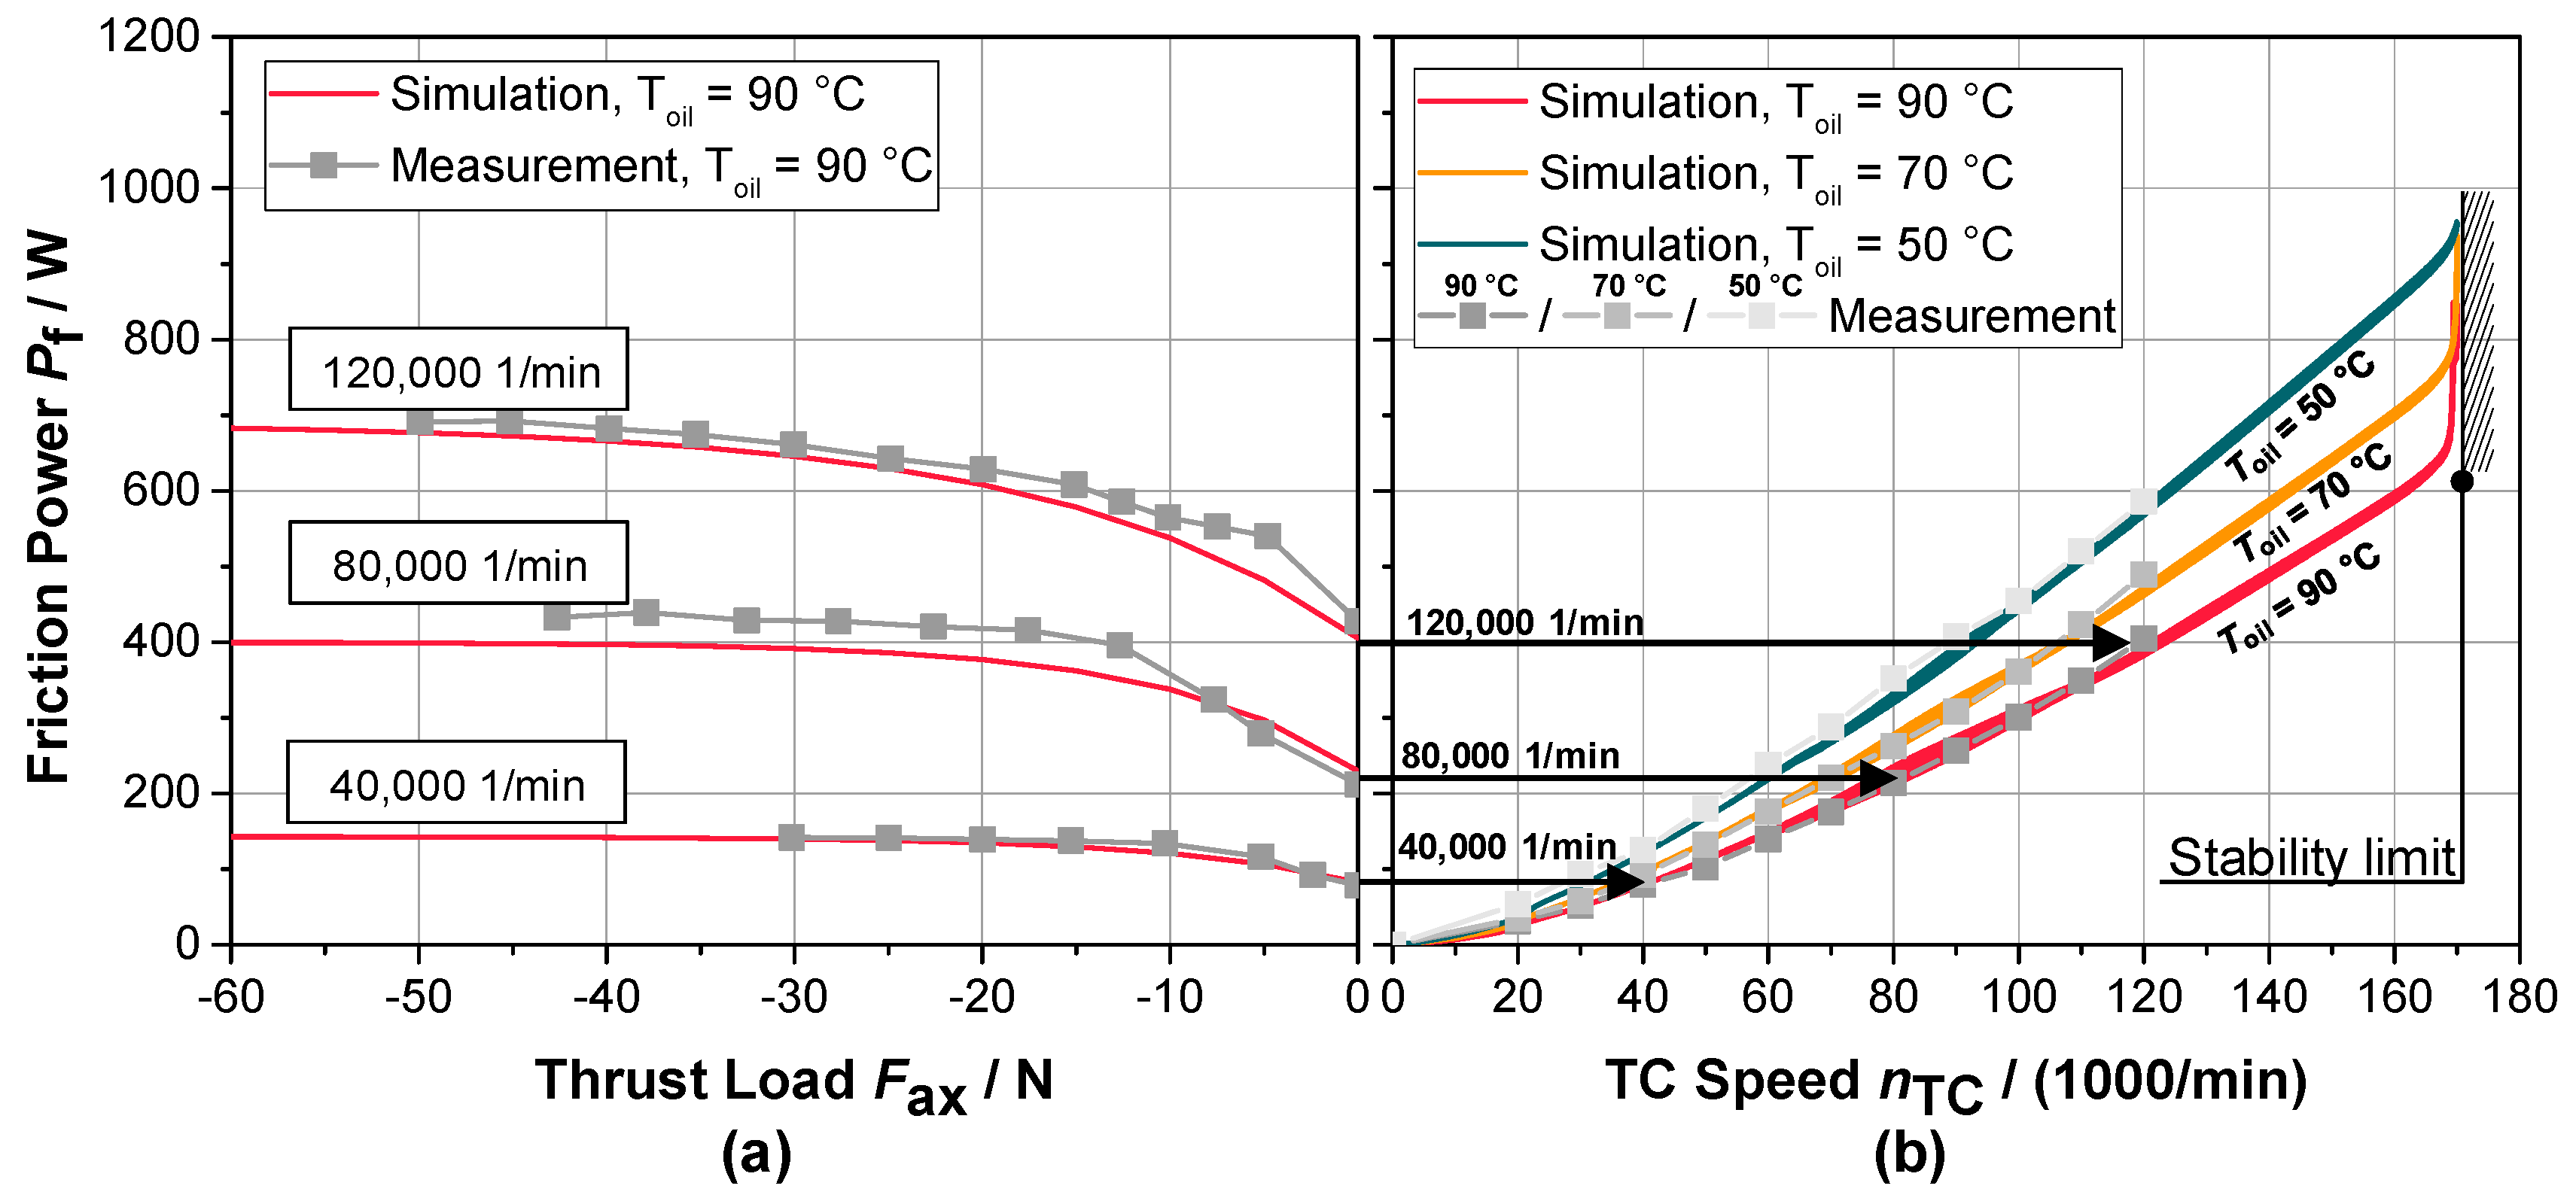
Section 3.2. Measured and simulated friction losses can be found in 
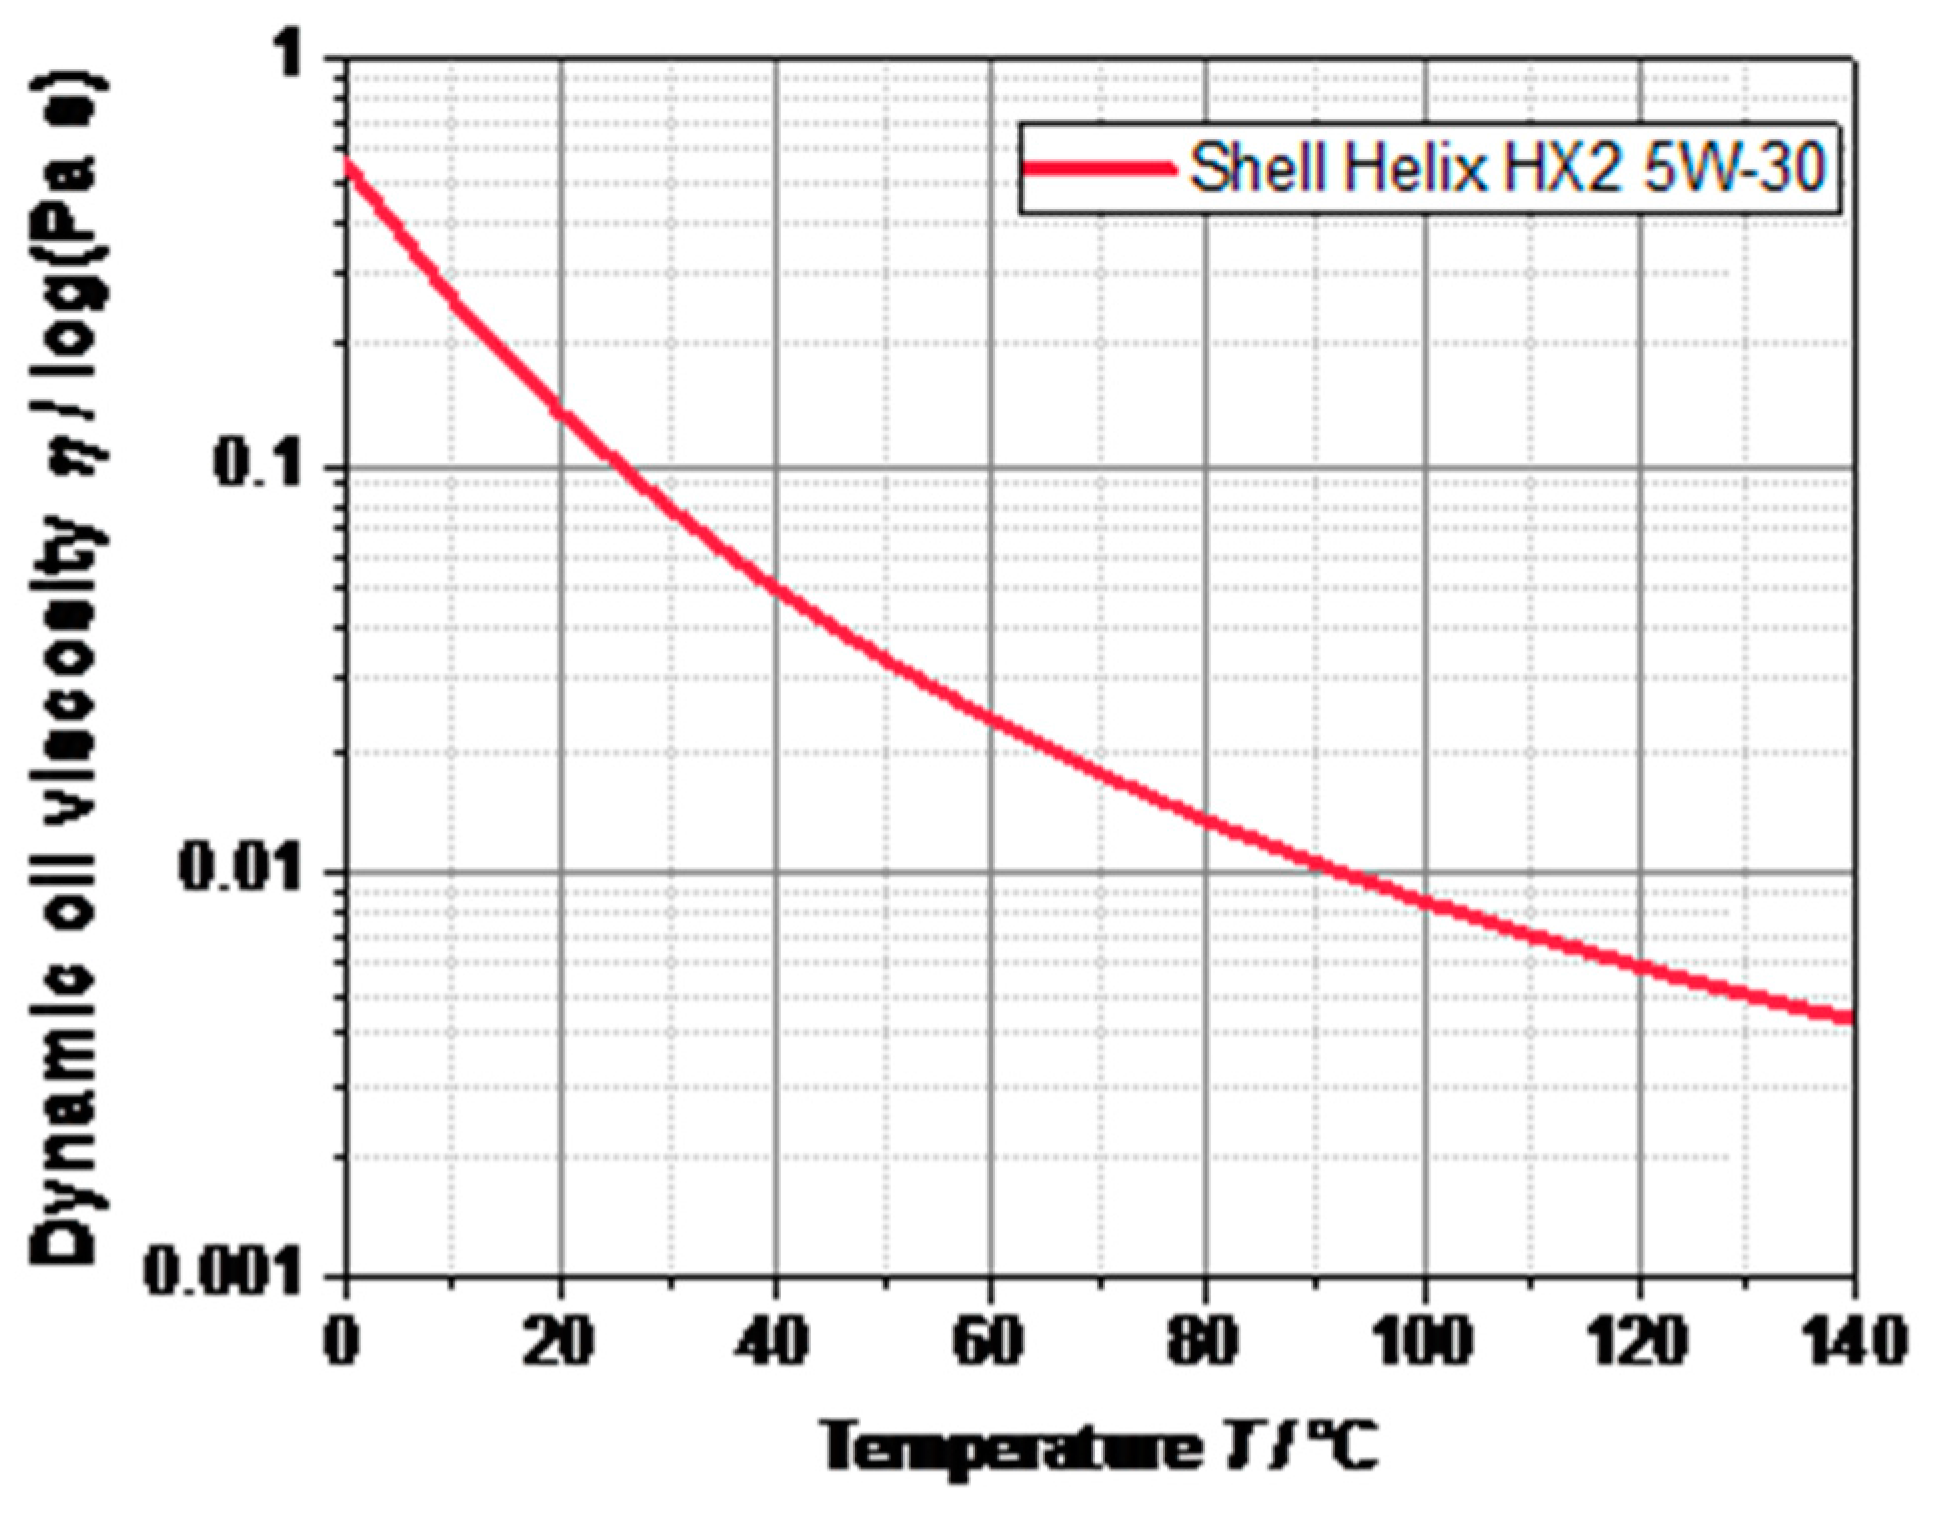
Figure 9b. As expected, the friction power decreases with increasing temperature due to a decrease of the dynamic oil viscosity. Both, measurement and simulation, show this trend and have nearly the same absolute values. In a second step, a thrust load variation with Toil = 90 °C for three different TC speeds (nTC = 40,000 1/min, 80,000 1/min and 120,000 1/min) was done. Due to the symmetrical design of the thrust bearing only negative thrust loads (“compressor pulls”) between Fax = −50 and 0 N were applied on test bench as well as simulation model. Figure 9a shows the impact of the thrust load on friction power for the three different speeds. With increasing speed the effect of the thrust load on friction is increasing (higher gradient). Similar results could be found in Höpke et al. [6]. Largest deviation between measurement and simulation is only 10.8% at Fax = −5 N and nTC = 120,000 1/min. Here, measurement shows a higher increase of friction power at low loads than the simulation model. Overall, the simulation model correlates very well with the measurement results and show for both variations (oil inlet temperature and thrust load) the same behavior of the bearing friction losses compared to the friction test bench.

3.2. Measurement of Shaft Motion and Validation of Simulation Model

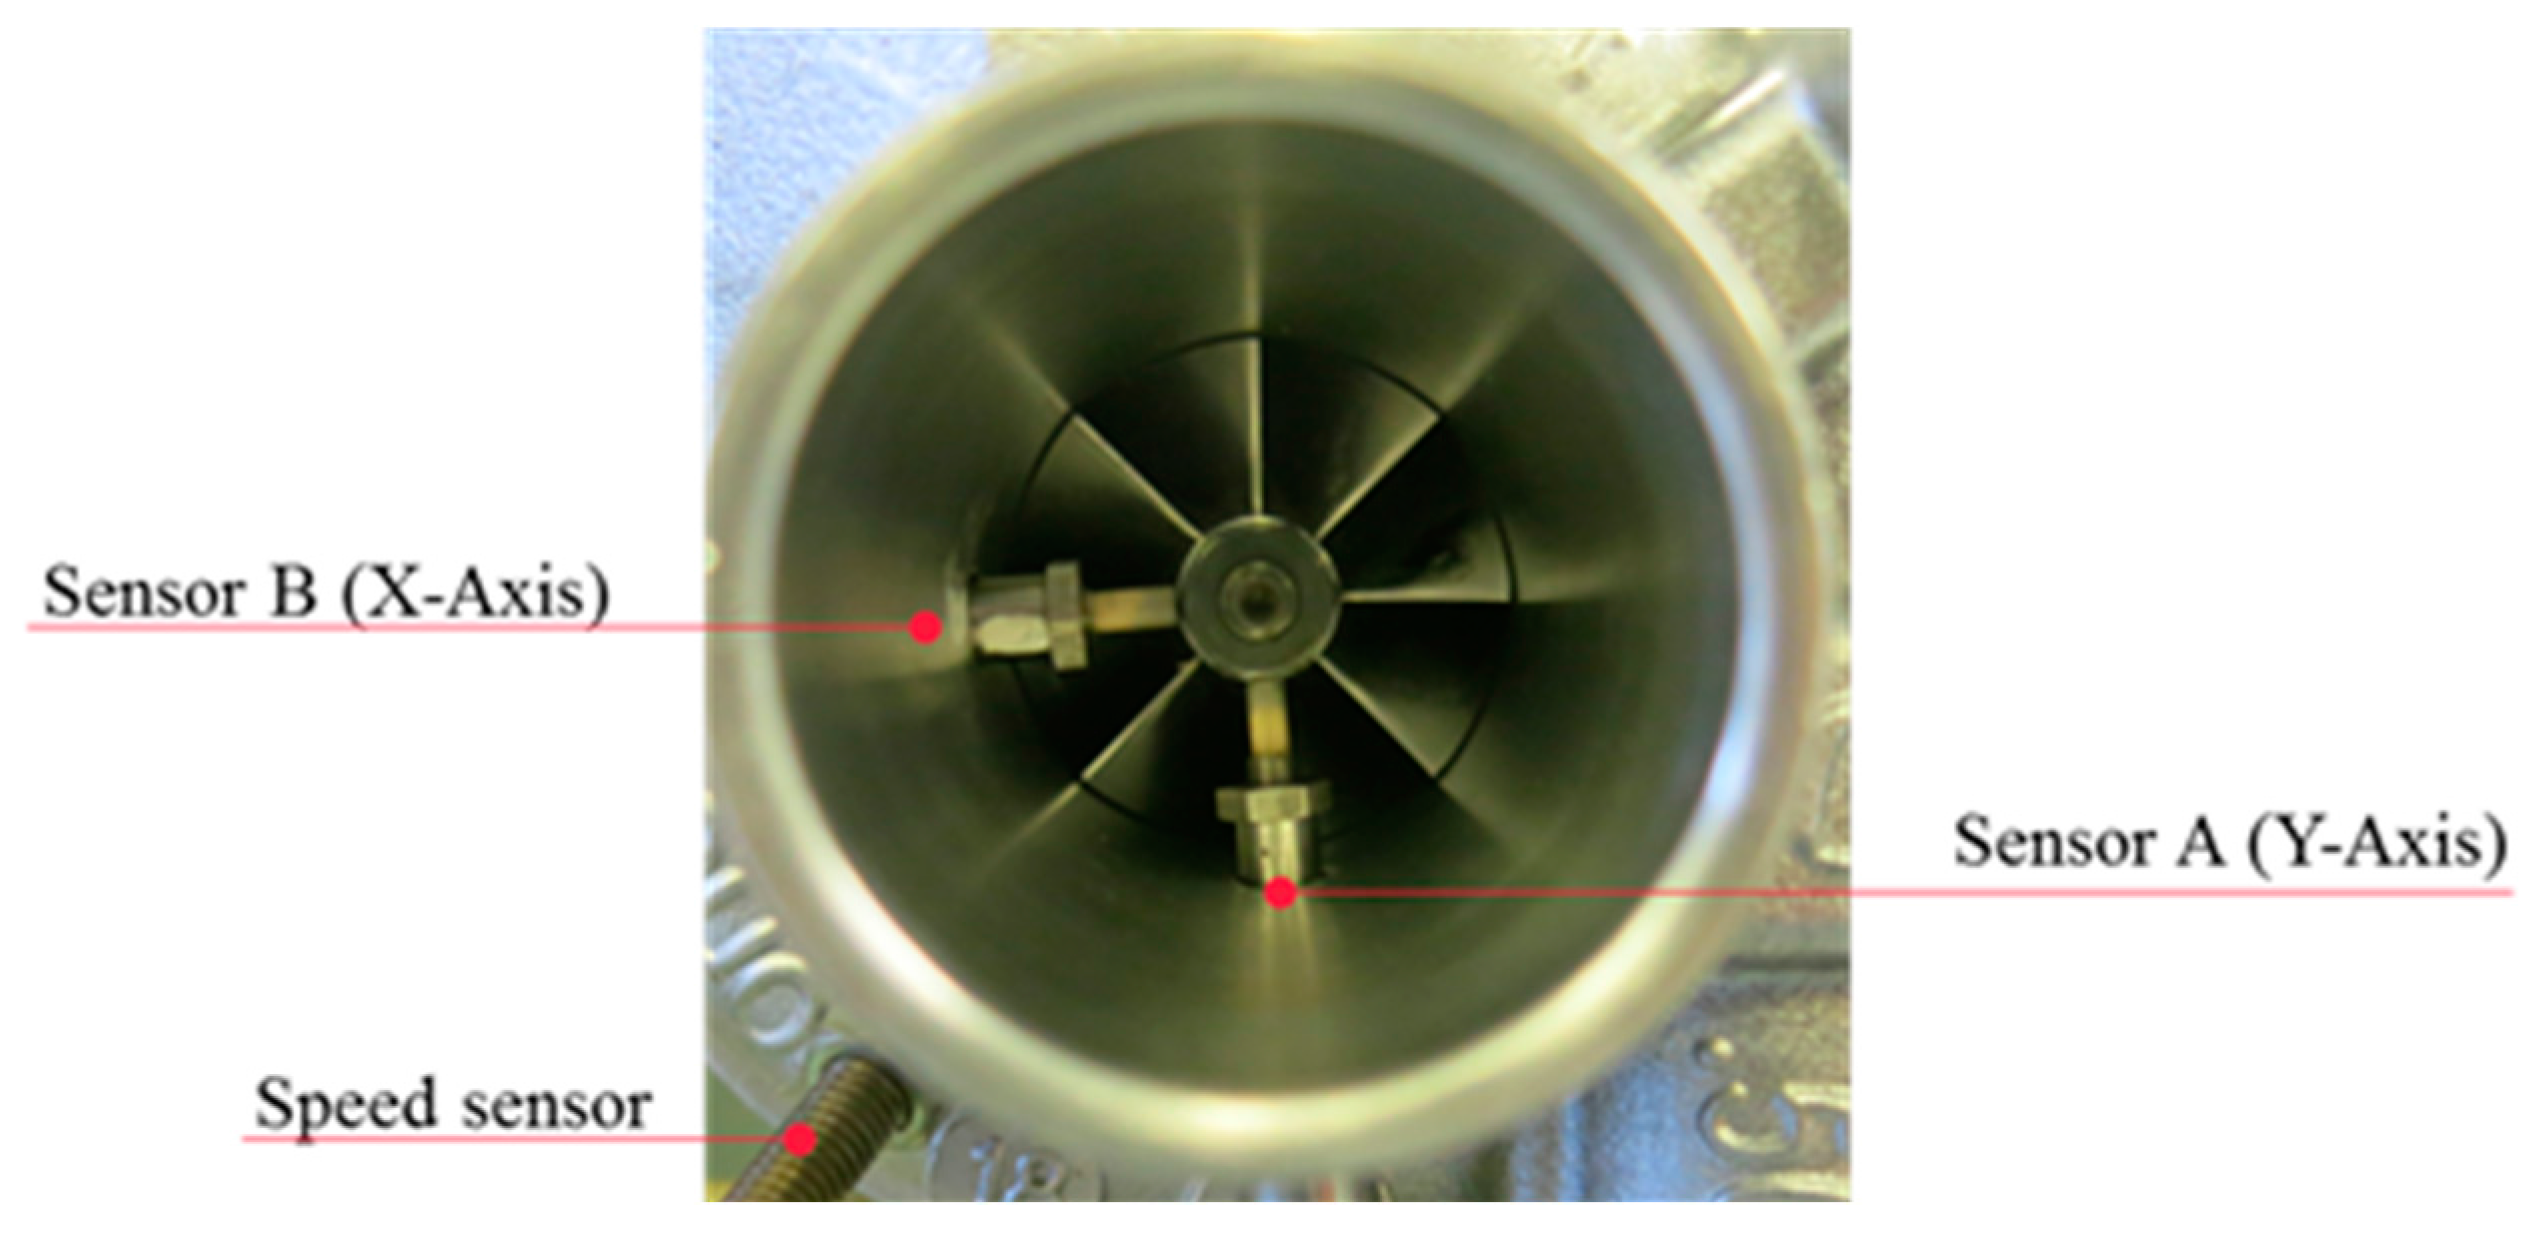
The shaft motion measurement is done on a hot gas test bench as described in Section 2.2.2. The MBS model is adapted to include the full rotor assembly with compressor and turbine wheel and is only supported by journal and thrust bearings—No other support constraints are applied. The shaft displacement is measured and simulated at the compressor nut (cf. Figure 4) for all six operating points, see Table 3.
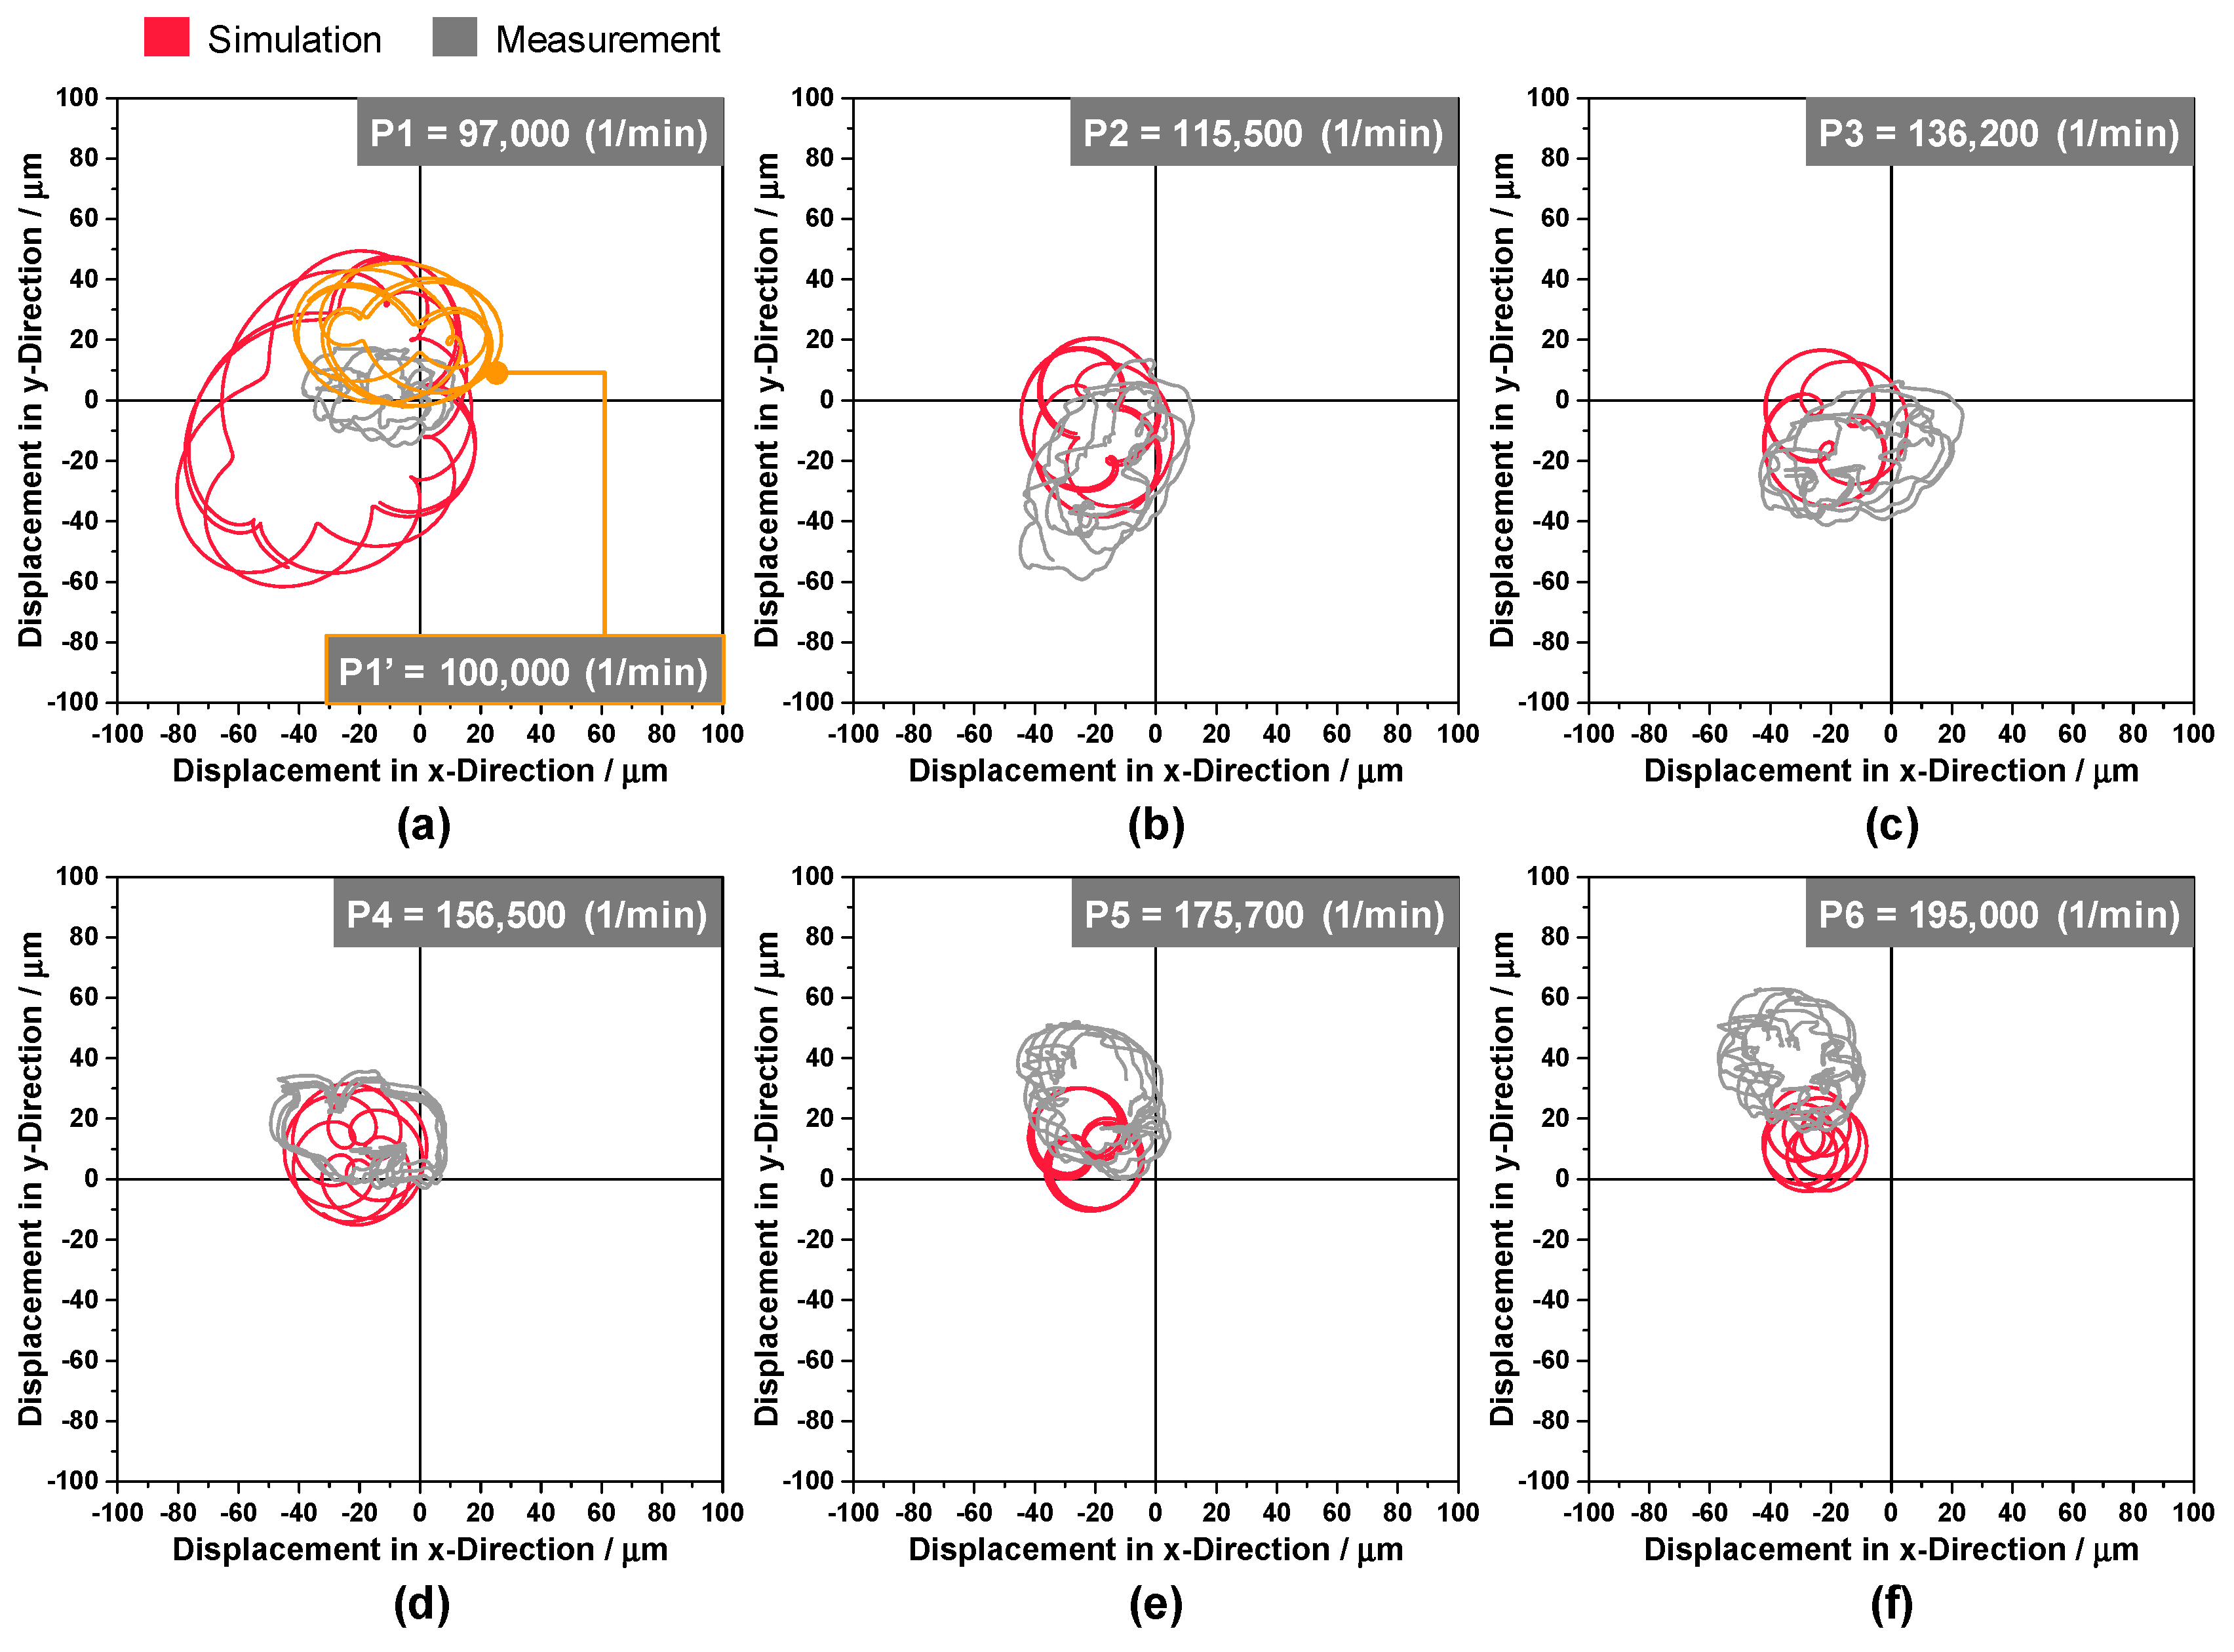
Figure 10 shows the results of measurement (gray orbits) and simulation (red orbits) for 5 shaft revolutions. It can be observed that the orbits of measurement as well as simulation are located in the same quadrant(s). The diameter of measured and simulated orbits of operating points P2–P6 (Figure 10b–f) match well. Inner loops, an indicator for sub-synchronous vibrations, can be observed very clearly from the simulation results. If these inner loops migrate to a new location at each revolution, the motion is quasiperiodic. For P2–P6 two inner loops per revolution are recognizable. With the number of inner loops N, the frequency order X of the sub-synchronous vibration can be determined by 1/(N + 1)-X which results in a (1/3)-X sub-synchronous vibration of operating points P2–P6. These sub-synchronous vibrations occur due to the well-known oil whirl of the inner oil films, cf. e.g., [8,9,10,11]. A large deviation of shape and size between measurement and simulation is seen for operating point P1 (Figure 10a). Here, the simulation shows a large amplitude A with four inner loops as an indicator for a low order sub-synchronous vibration of (1/5)-X. Due to transient speed ramp-up simulations in entire speed range, which were carried out for the investigations of Section 3.3 and Section 3.4, it could be observed that shortly after nTC = 97,000 1/min (P1) there is a discontinuous change from one to another sub-synchronous oscillation. Therefore, a second simulation P1’ with nTC = 100,000 1/min next to operating point P1 was carried out and its simulated shaft orbit is depicted in yellow in Figure 10. Even though this operating point is only 3000 1/min away from P1, the shape and size of the orbit fits very well to the original measured operating point.
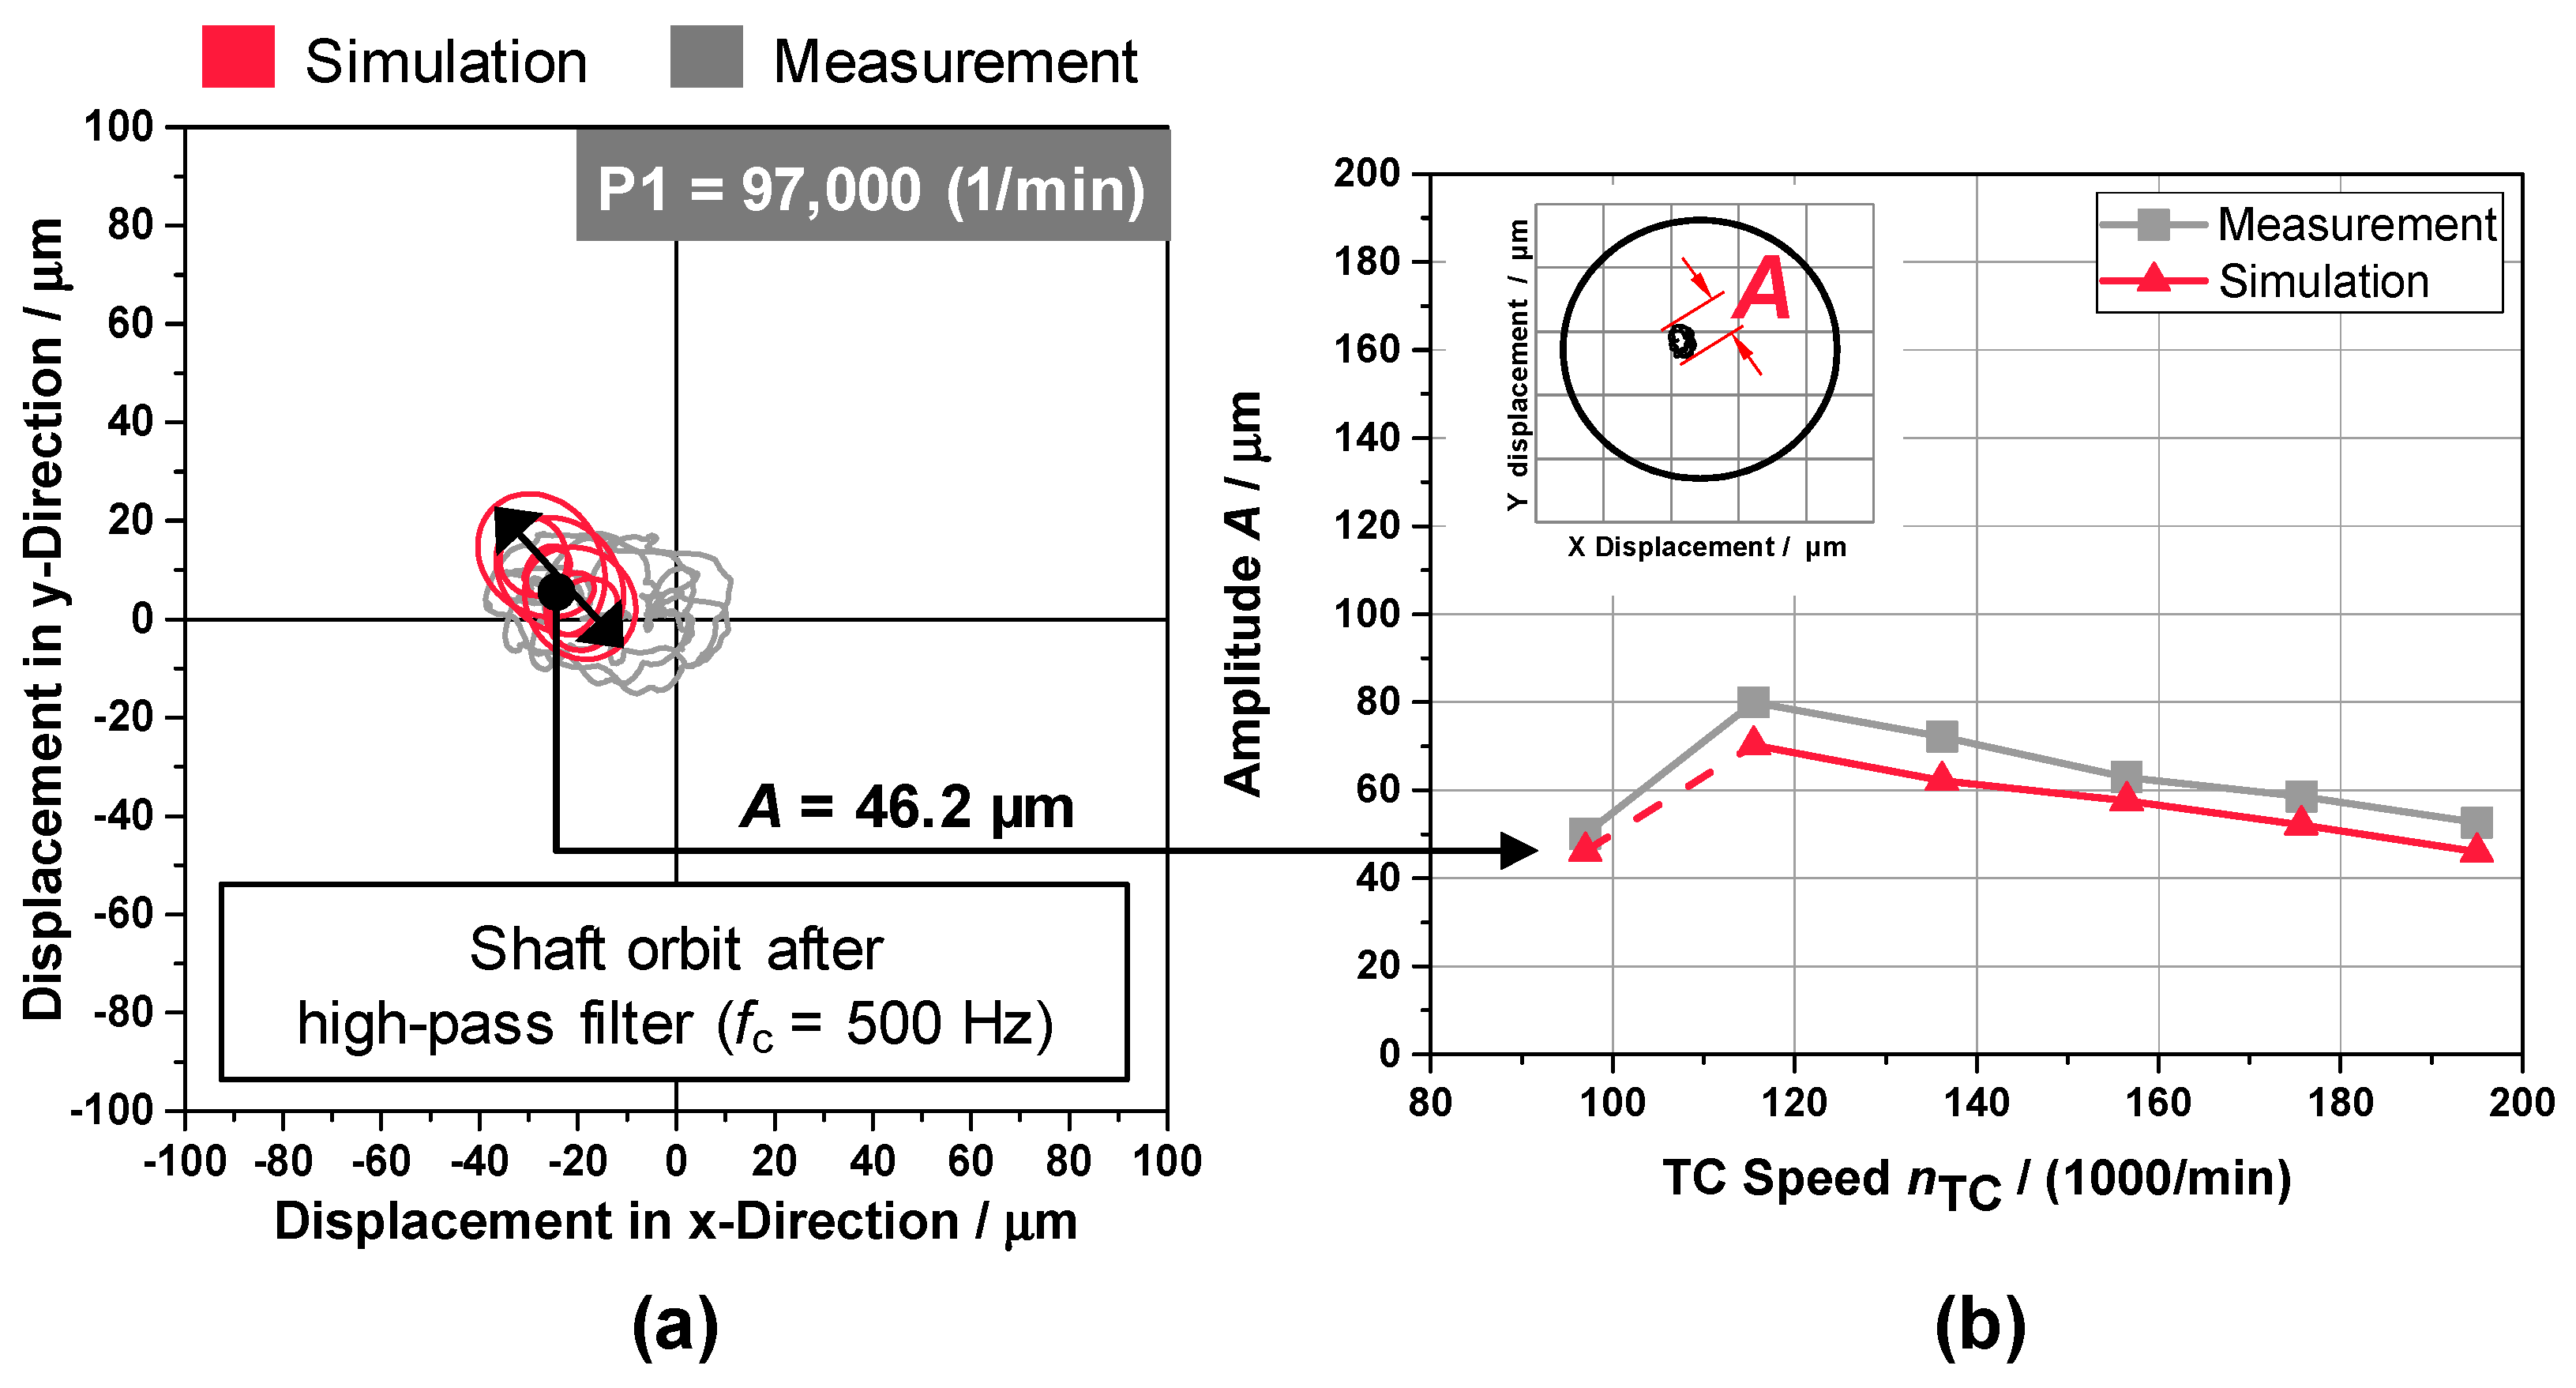
To achieve a quantitative comparison of measurement and simulation, the orbit amplitudes A of the shaft orbits are calculated (maximum distance of two points of one orbit) using Equation (10) and are depicted in Figure 11 as a first step.
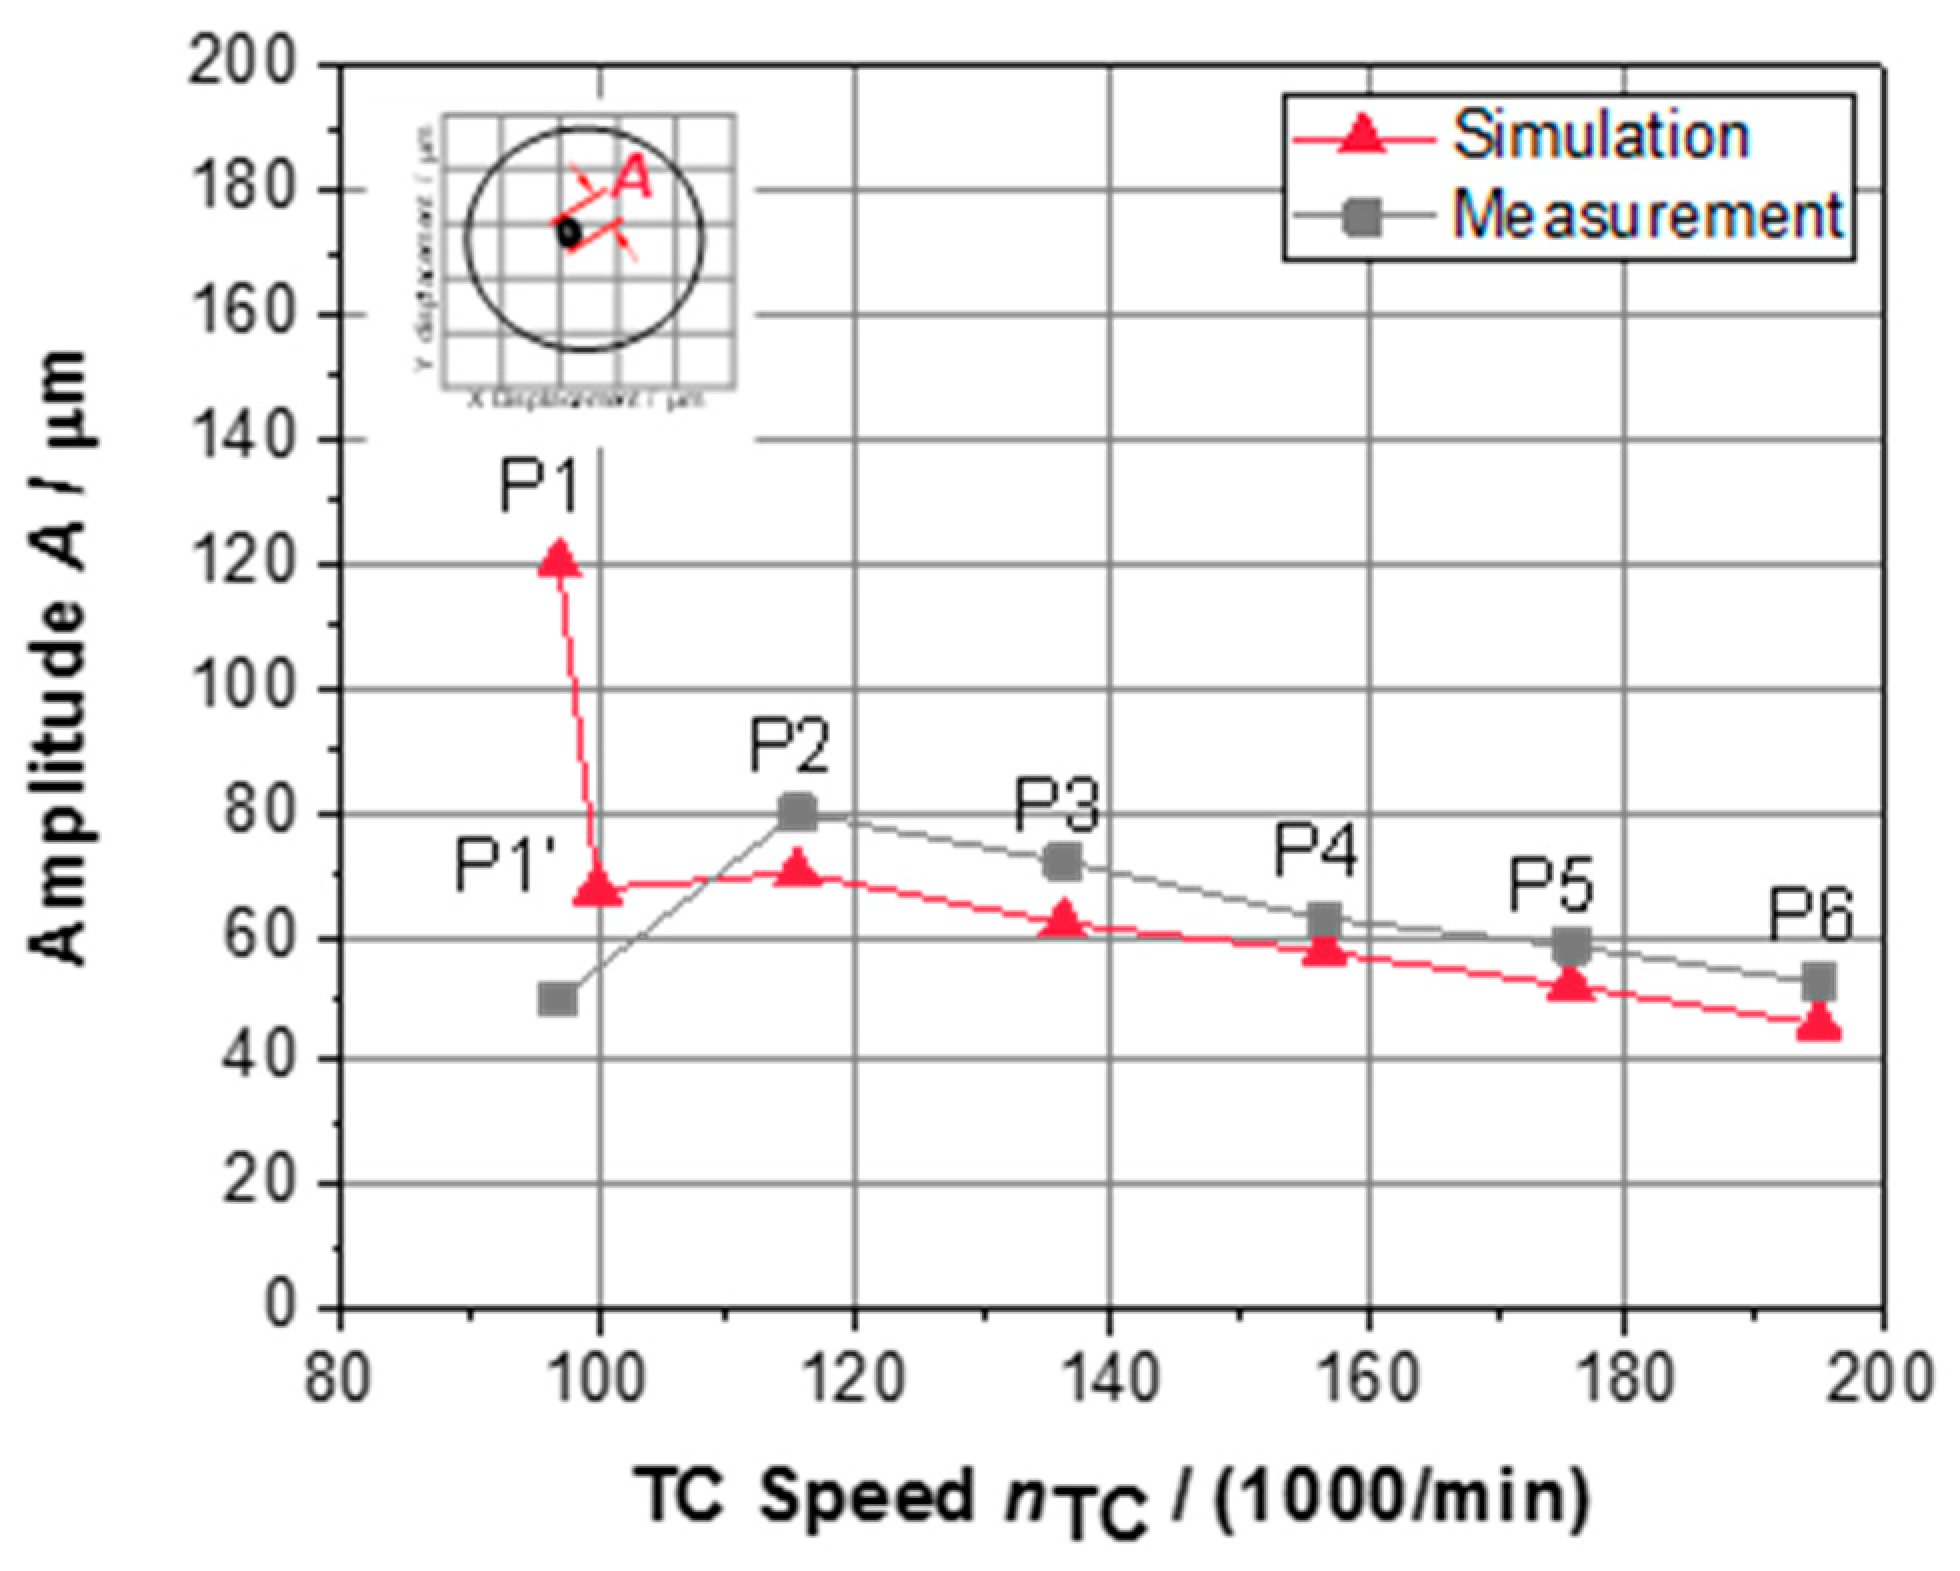
A ( t )   =   x ( t ) 2   +   y ( t ) 2
As Figure 11 shows, the size of the amplitudes of operating points P2–P6 of simulation match well with the measured shaft motion. The deviation of the amplitude is 5–9 µm. With increasing speed the shaft amplitude decreases from P2 on. The calculated amplitude of the additional operating point P1’ is also plotted in the same figure and shows only a difference of 16.6 µm to the measured operating point P1. As expected, the size of the shaft orbit A = 119.9 µm of the simulated operating point P1 is quite far away from the measured result. Of course, it is possible that similar observations of such a large amplitude can be made in measurements for TC speeds lower than nTC,P1 = 97,000 1/min. For this study no shaft motions at lower TC speeds were measured on the hot gas test bench.
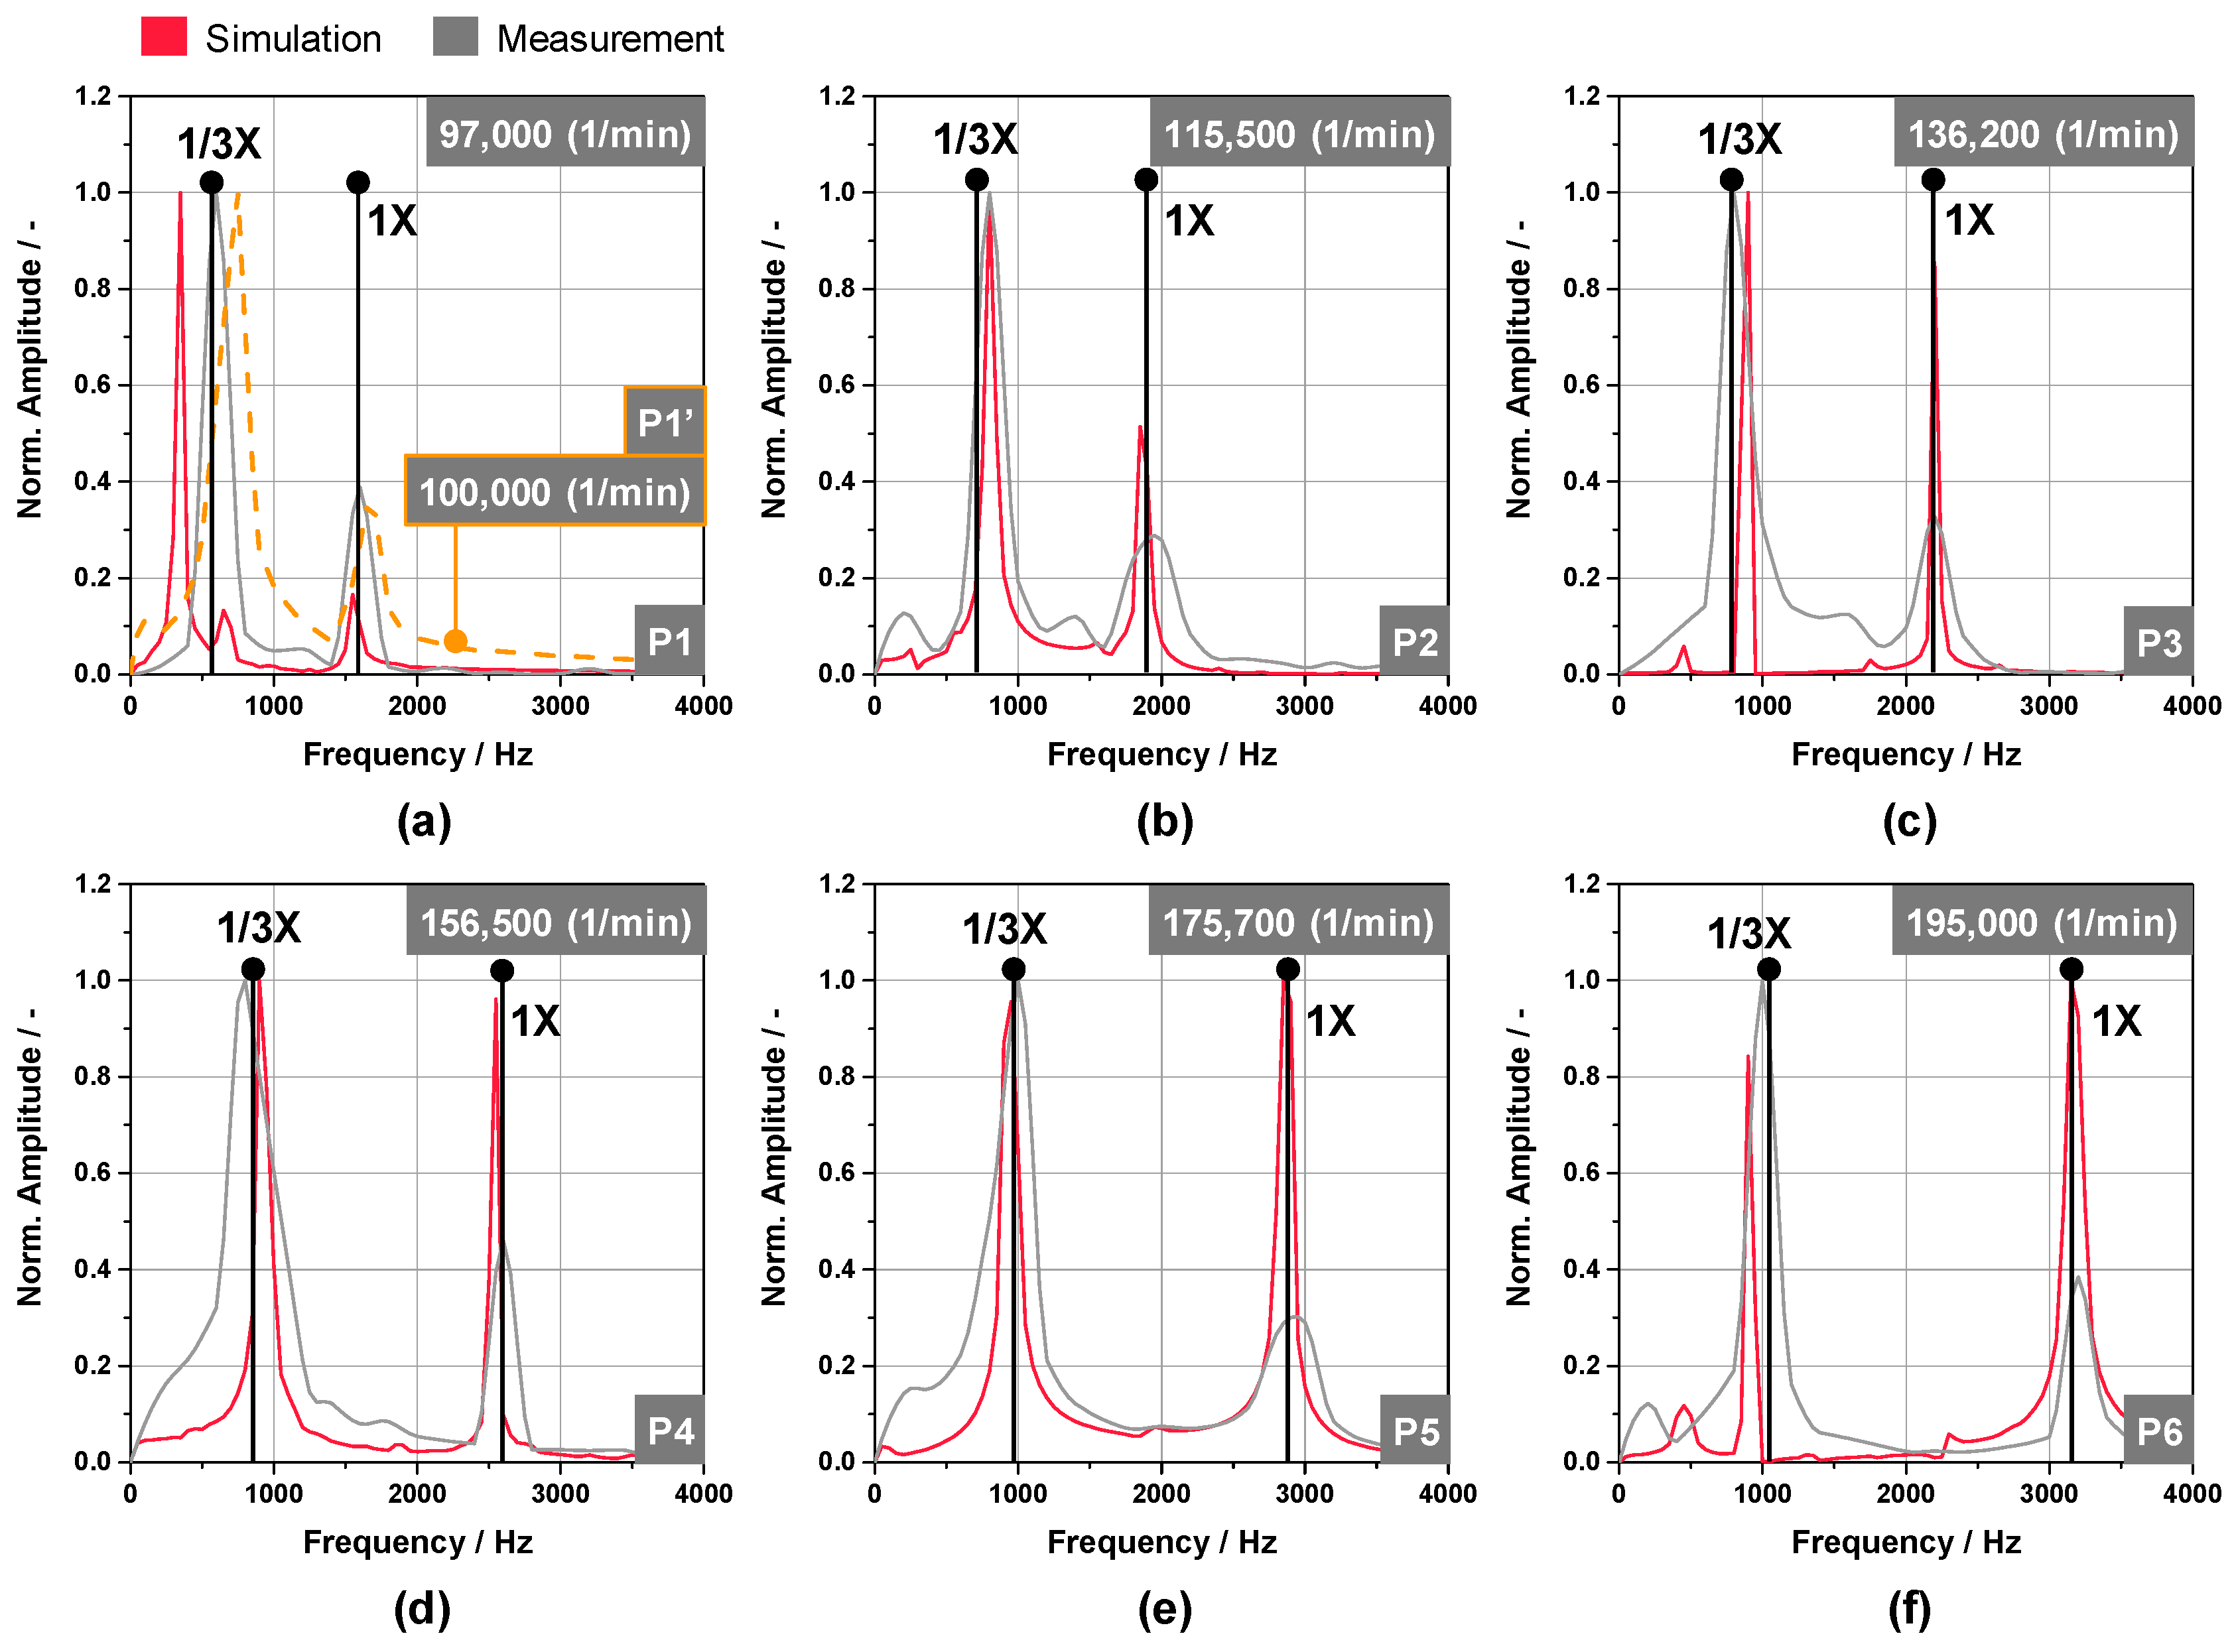
In a second step, the frequency of the measured and the simulated motion is calculated by a fast Fourier transform (FFT) and compared in Figure 11. Measurement and simulation show one synchronous oscillation (1X frequency) for all six operating points due to the unbalanced mass of the system as well as sub-synchronous vibration (1/(N + 1)-X frequency), as seen before in Figure 10.
For all operating points the simulation model shows a higher first order (1X) synchronous oscillation than the measurement, indicating a higher unbalance of the rotor assembly than on the test bench. The 1X amplitude of simulated P1 is smaller than the measured one in Figure 12a, but only due to the normalizing regarding the high amplitude of the low order sub-synchronous vibration. For future investigations regarding the investigated turbocharger, the unbalanced point masses in the simulation model have to be examined in detail. As a further observation, a direct connection between sub-synchronous frequencies and shaft motion orbits (Figure 10), and the number of inner loops N can be studied: Two inner loops of the operating points P2–P6 result in a 1/3-X excitation. This can also be observed in the sub-synchronous frequency peaks of measurement and simulation which are quite near to this excitation as Figure 12 shows.
The frequency calculation also shows the deviation between measurement and simulation of P1: The measured signal shows a 1/3-X excitation, the simulation, however, has a maximum peak at quite a lower order and only a small peak at this 1/3-X order. The frequency peaks of P1’ have a similar behavior as measured P1, but are slightly shifted due to the increased TC speed.
As a result of the FFT analysis it is assumed, that a very low order oscillation (<1/3-X) results in a large shaft motion of the examined turbocharger. To verify this assumption, a high-pass filter with a cut-off frequency of fc = 500 Hz is applied to operating point P1 and the results are depicted in Figure 13. If only frequencies higher than 500 Hz are considered, the simulated shaft orbit amplitude is very close to the measured one.
The reason for the difference between measurement and simulation of operating point P1 will be investigated in a follow up study. The following topics influence the rotor dynamic behavior and could be a possible cause. First, seal rings to reduce the blow-by are not included in the simulation model but in measurement, which can have an additional damping effect according to investigations of Nguyen-Schäfer [
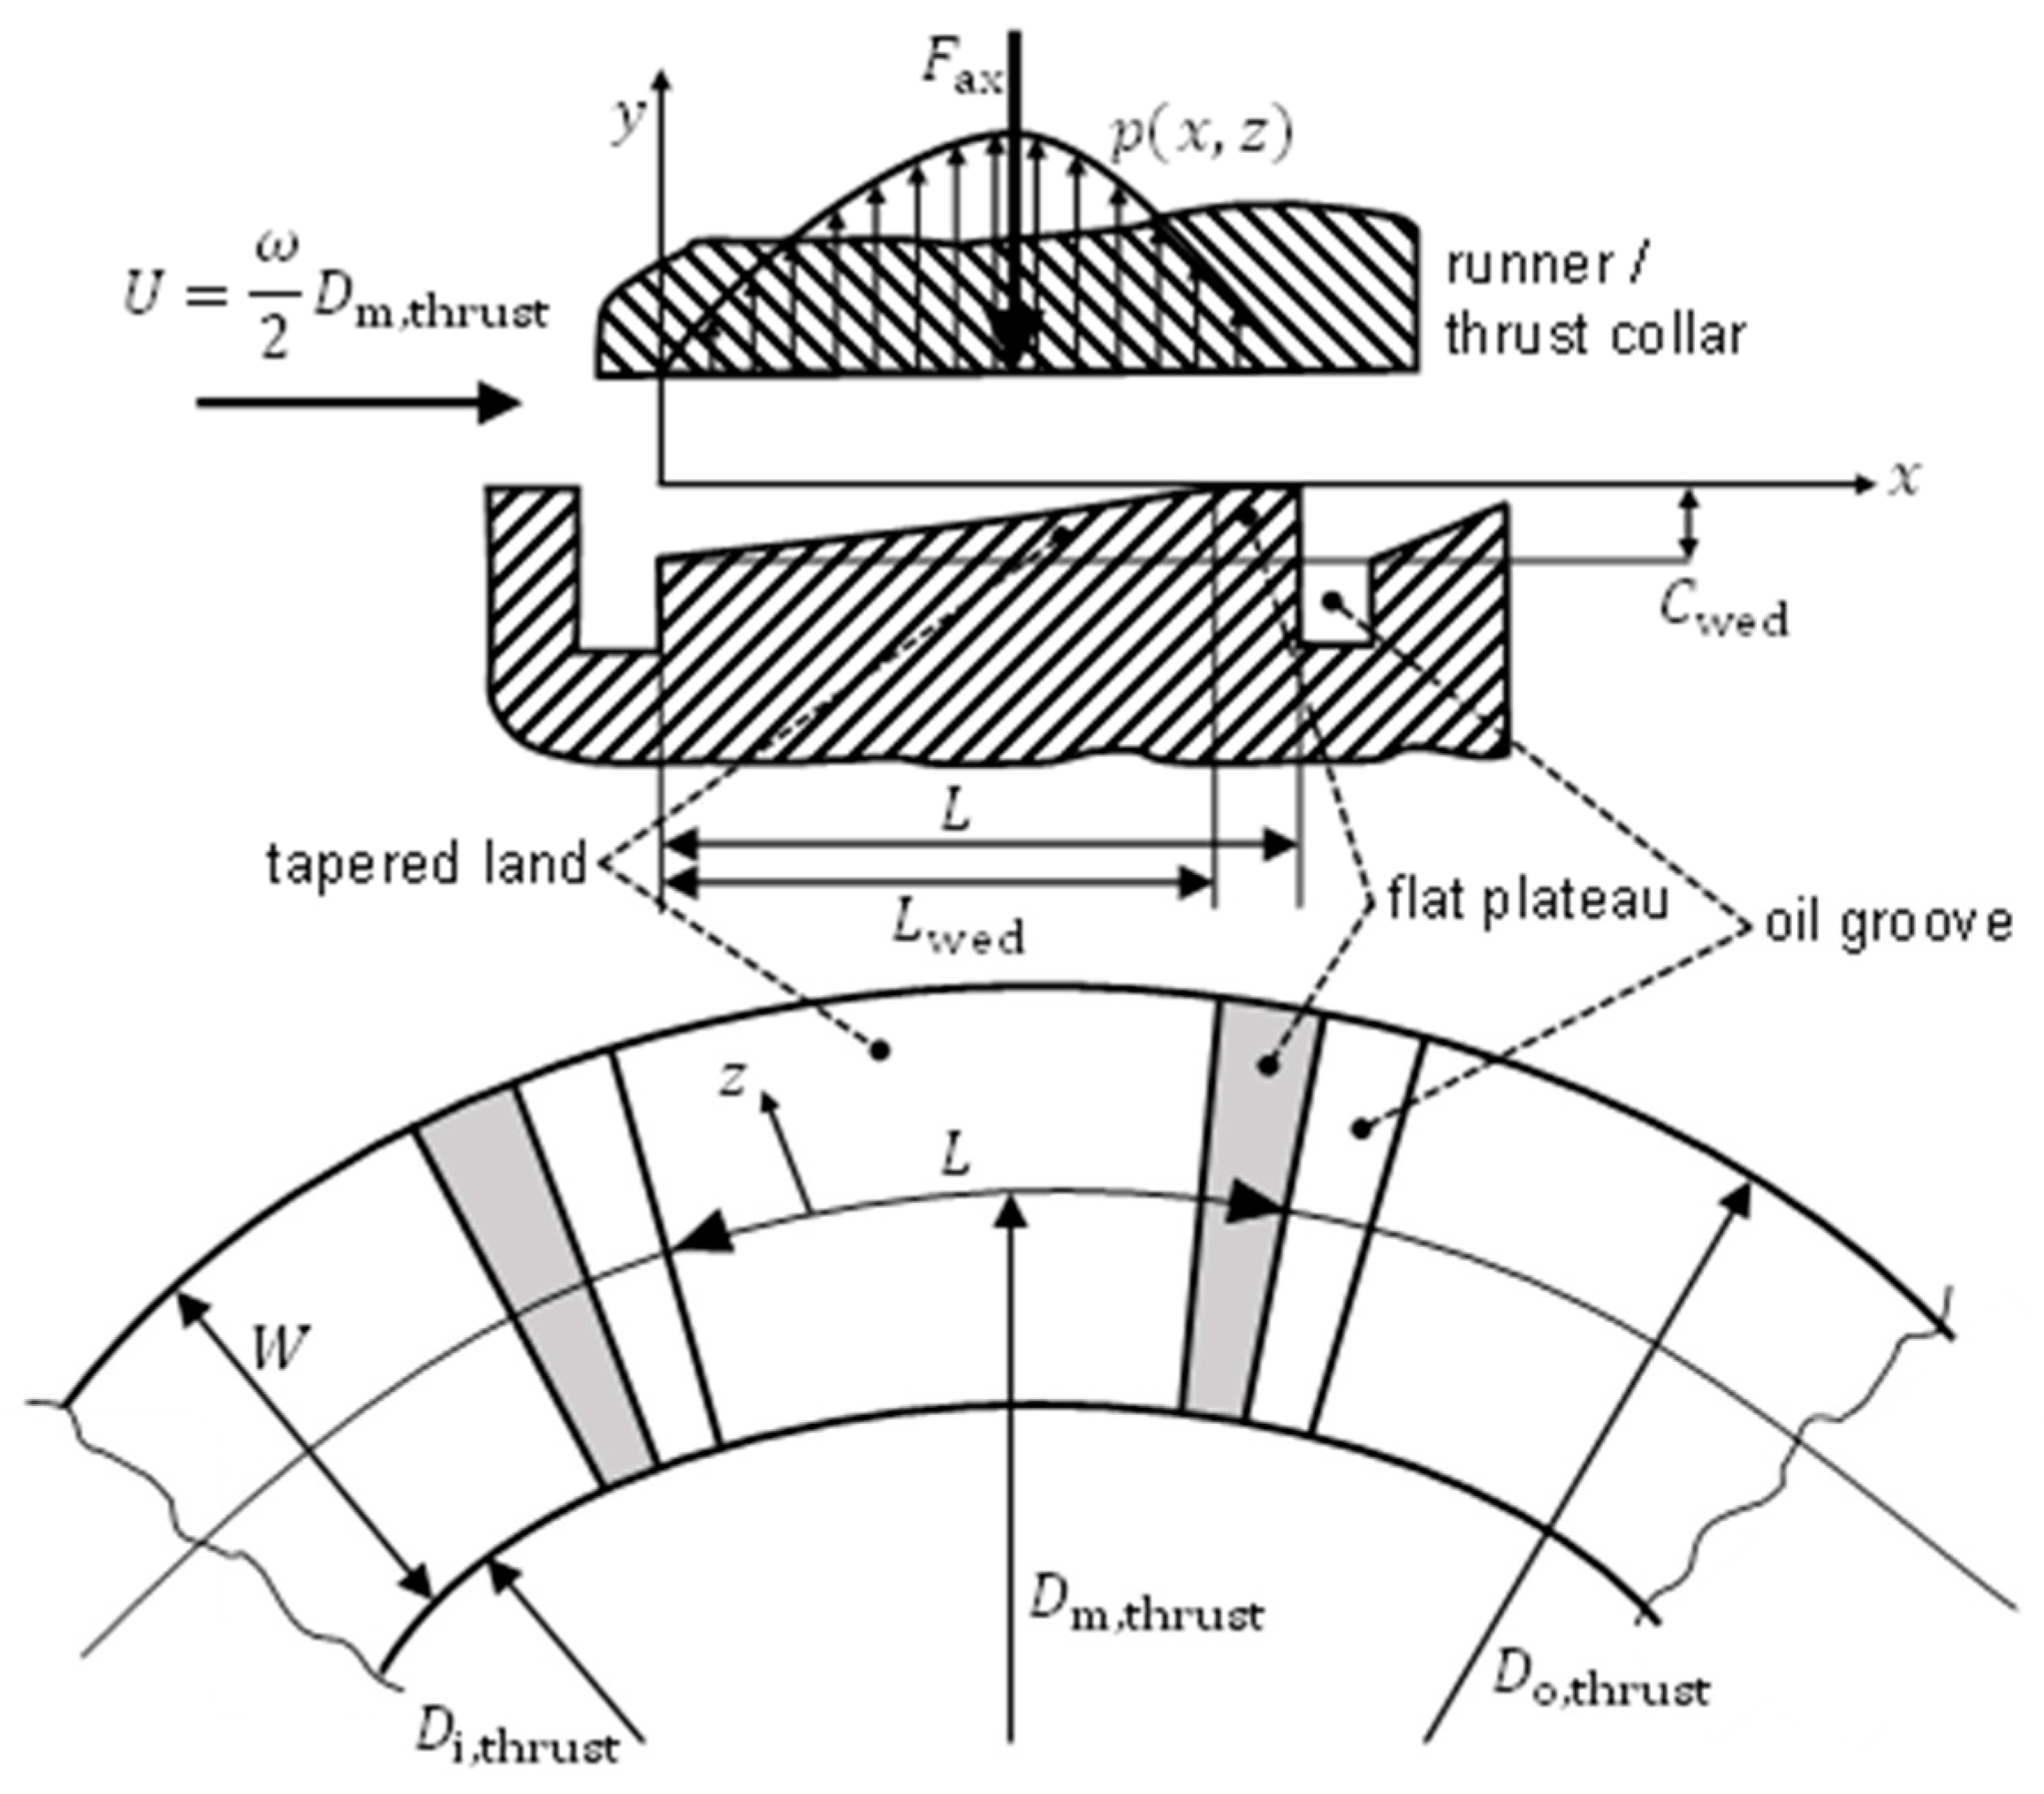
26]. Second, pulsating radial aerodynamic forces act on the turbine and compressor wheel due to pressure variation of the circulating gas and are not considered in the MBS model. Computational fluid dynamics (CFD) calculations with high effort must be carried out to include these forces in a MBS system. Third, a thrust bearing model with an analytical approach of the Reynold’s equation to speed-up the calculations was used for this study as described in Section 2.3.2. Advanced thrust bearing effects, e.g., tilting or misalignment, where the occurring reaction forces of the bearing will change, are not considered. And last, the occurring shaft temperature was only estimated from past measurements to adapt the Young’s modulus and has no transient effect in the MBS model.
In a last step, the mechanical losses occurring in the bearing system of the hot gas test set-up are compared to the friction analysis of the friction test bench set-up to answer the question, whether the bearing friction measurements (w/o TC wheels) are transferable to the bearing behavior of the hot gas test bench with a complete rotor assembly. To compare both simulation set-ups correctly, it is necessary to run a second transient simulation with an unloaded thrust bearing for the hot gas test bench set-up (with attached TC wheels). 
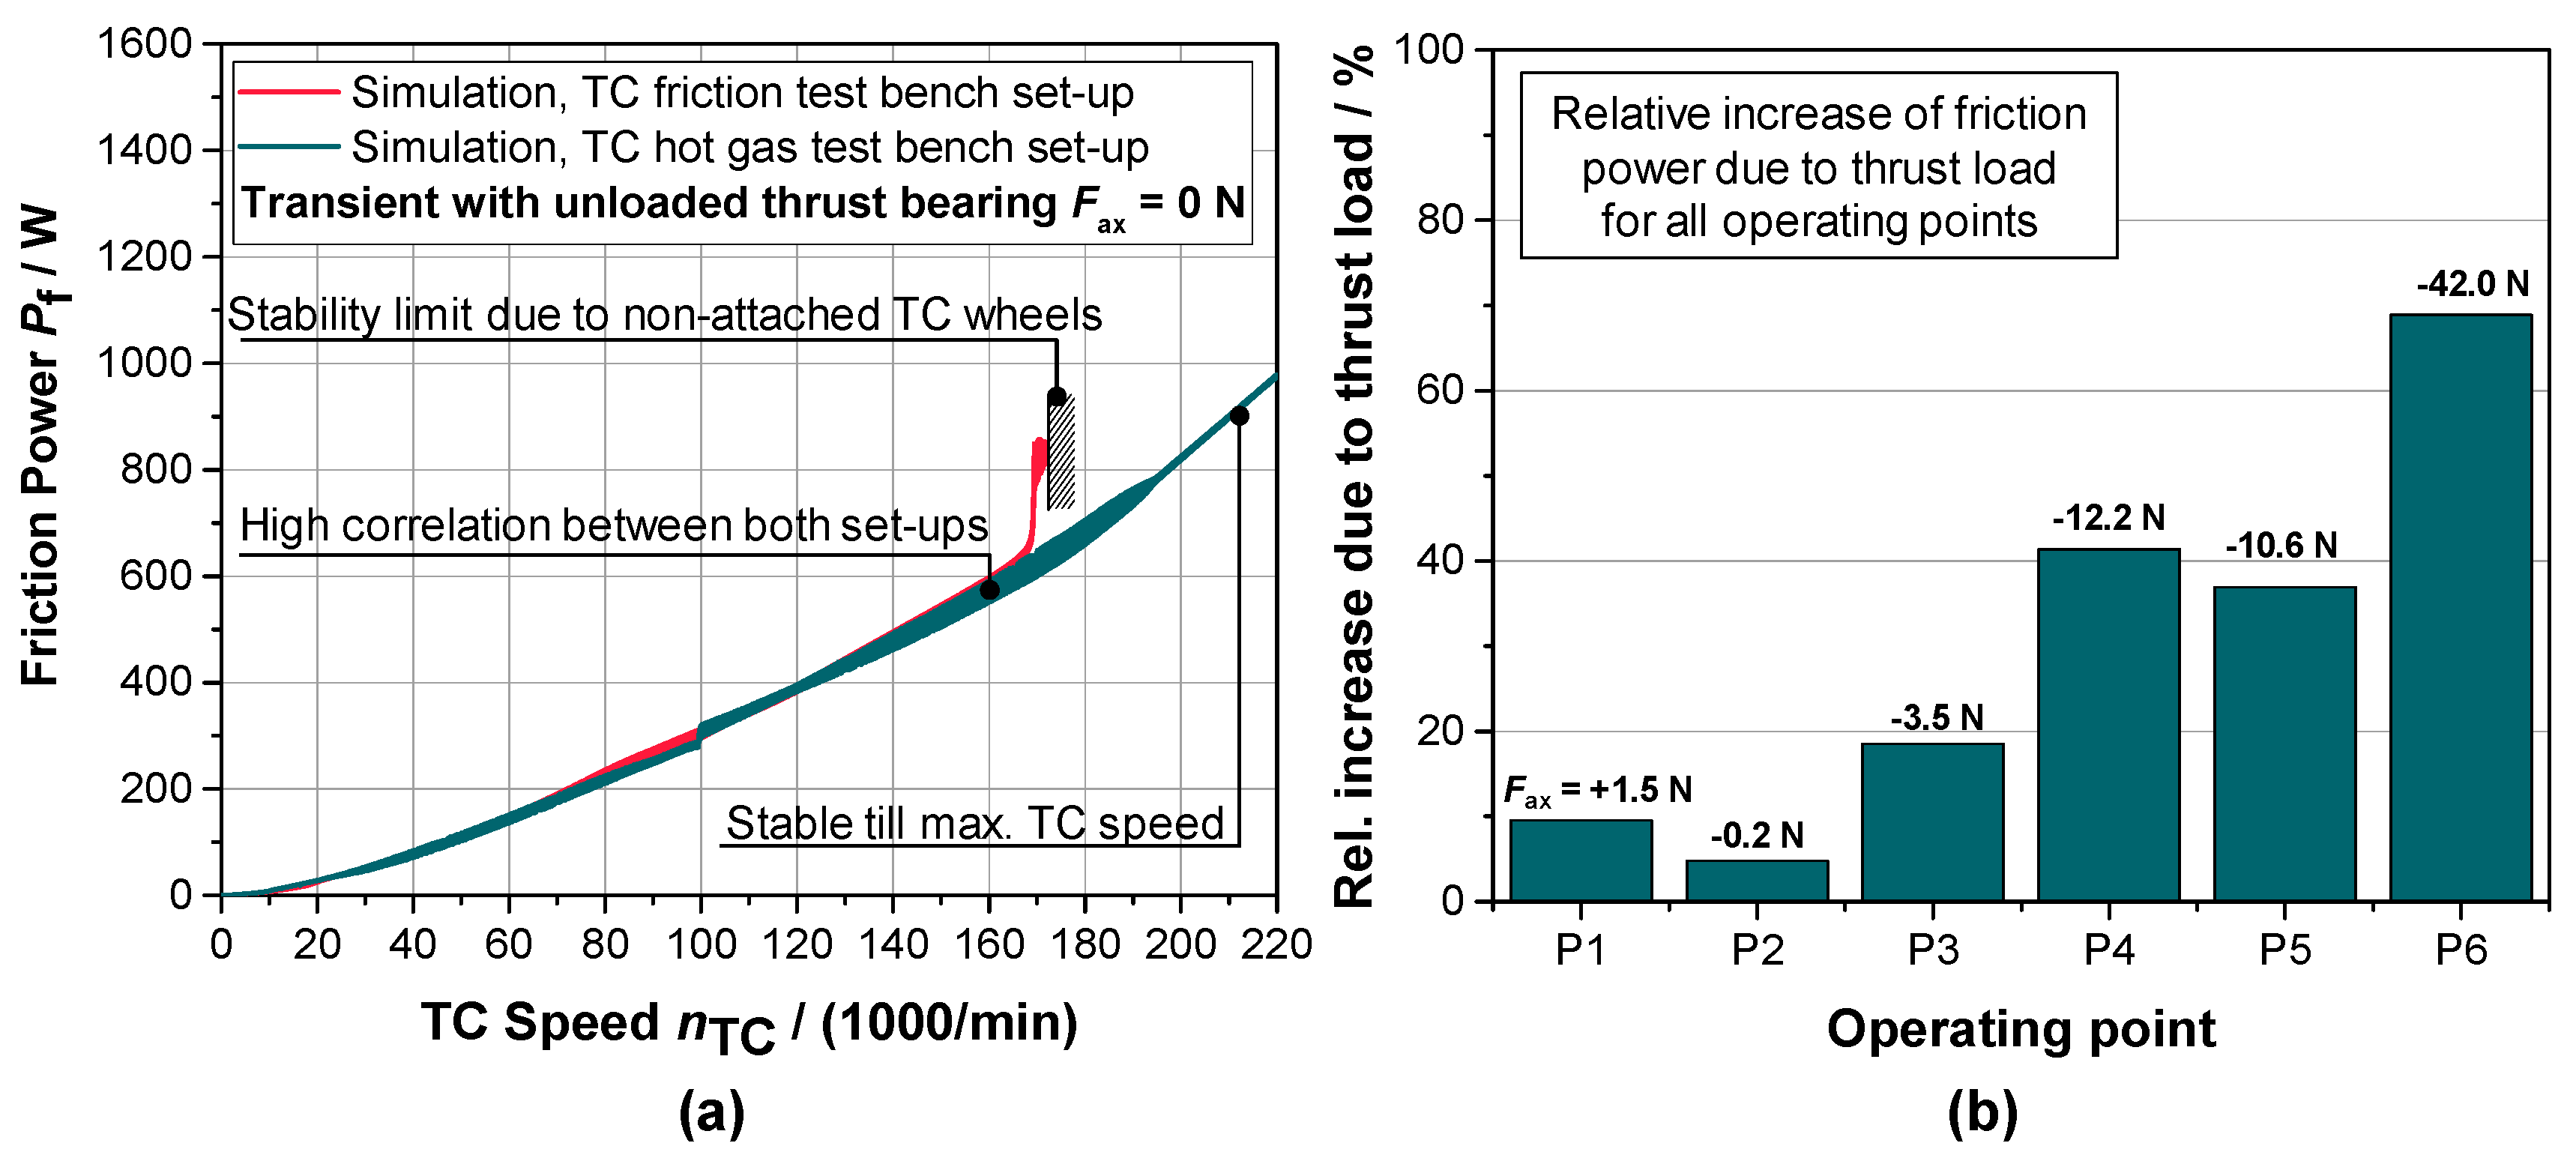
Figure 14a shows the simulated friction power for both configurations. A high correlation between both is observed. Both curves show nearly the same dissipated power. It is noticeable that due to the attached wheels the rotor system is stabilized, so that simulations can be performed up to the maximum operating speed of the TC and no numerical stability limit is reached. Due to the fact that the simulation also estimates the friction losses occurring in the thrust bearing very well (cf. Figure 9), the transfer to the investigated operating points can be made. Figure 14b shows the relative increase of friction power due to the applied thrust load of all operating points. Of course, a small thrust load results only in a small increase of friction power. But, it is also observed, that mean thrust loads (e.g., of P4 and P5) achieve a high increase of friction power, up to 41%. The maximum thrust load of Fax = −42 N is applied at operating point P6 which results in a significant increase of occurring friction of up to 69%.
Nevertheless, it can be summarized that despite measurement without TC wheels the simulated and measured friction corresponds to the friction behavior of a full-assembled turbocharger, and it is legitimate to use the TC friction test bench set-up for upcoming measurements. Whether the TC wheels or different unbalanced masses have any influence on the dissipated bearing power is part of the following investigations in the next section.

3.3. Variation of Wheel Sizes

As a result of the investigations on the friction and hot gas test bench, it is now legitimate to carry out the additional investigations with the validated simulation model.
To have a balance between costs and effort, turbocharger manufactures typically use different frame sizes based on a common bearing section. The CHRA (Center Housing and Rotating Assembly) can be equipped with different sets of wheel sizes. Further information and design guides for the respective CHRA platforms can be found in the book of Nguyen-Schäfer [10]. The examined turbocharger is for this study set up in a type series with five different compressor wheels (CW) and three different turbine wheels (TW). Dimensions, masses and inertias can be found in Table 4. All wheel sizes in this CHRA platform use the same shaft diameter Dshaft of 7.9 mm. The turbocharger which has been considered till now has the compressor wheel CW3 (D2 = 52 mm) and the turbine wheel TW2 (D3 = 43 mm) and is named as Base in the following investigations. To determine the influence of the wheel sizes on the friction occurring in the bearing system, different combinations of compressor and turbine wheel sizes have been set up with respect to a wheel ratio R = D2/D3 between the exducer diameter of compressor wheel and the inducer diameter of turbine wheel in the range of 1.1 and 1.25 and the same unbalanced mass:
  • Case 1:
    CW1 and TW1, wheel ratio of R = 1.2, largest compressor wheel with largest turbine wheel
  • Case 2:
    CW5 and TW3, wheel ratio of R = 1.125, smallest compressor wheel with smallest turbine wheel
  • Case 3:
    CW4 and TW3, wheel ratio of R = 1.25, largest compressor wheel (limited by R = 1.25) with smallest turbine wheel
  • Case 4:
    CW2 and TW1, wheel ratio of R = 1.1, smallest compressor wheel (limited by R = 1.1) with largest turbine wheel
  • Case 5:
    CW3 and TW2, wheel ratio of R = 1.21, base variant (as used in the previous investigations)
For all five cases transient dynamic simulations with an oil inlet temperature of Toil = 90 °C, oil supply pressure poil = 4 bar (abs.) and zero thrust load Fax were performed. 
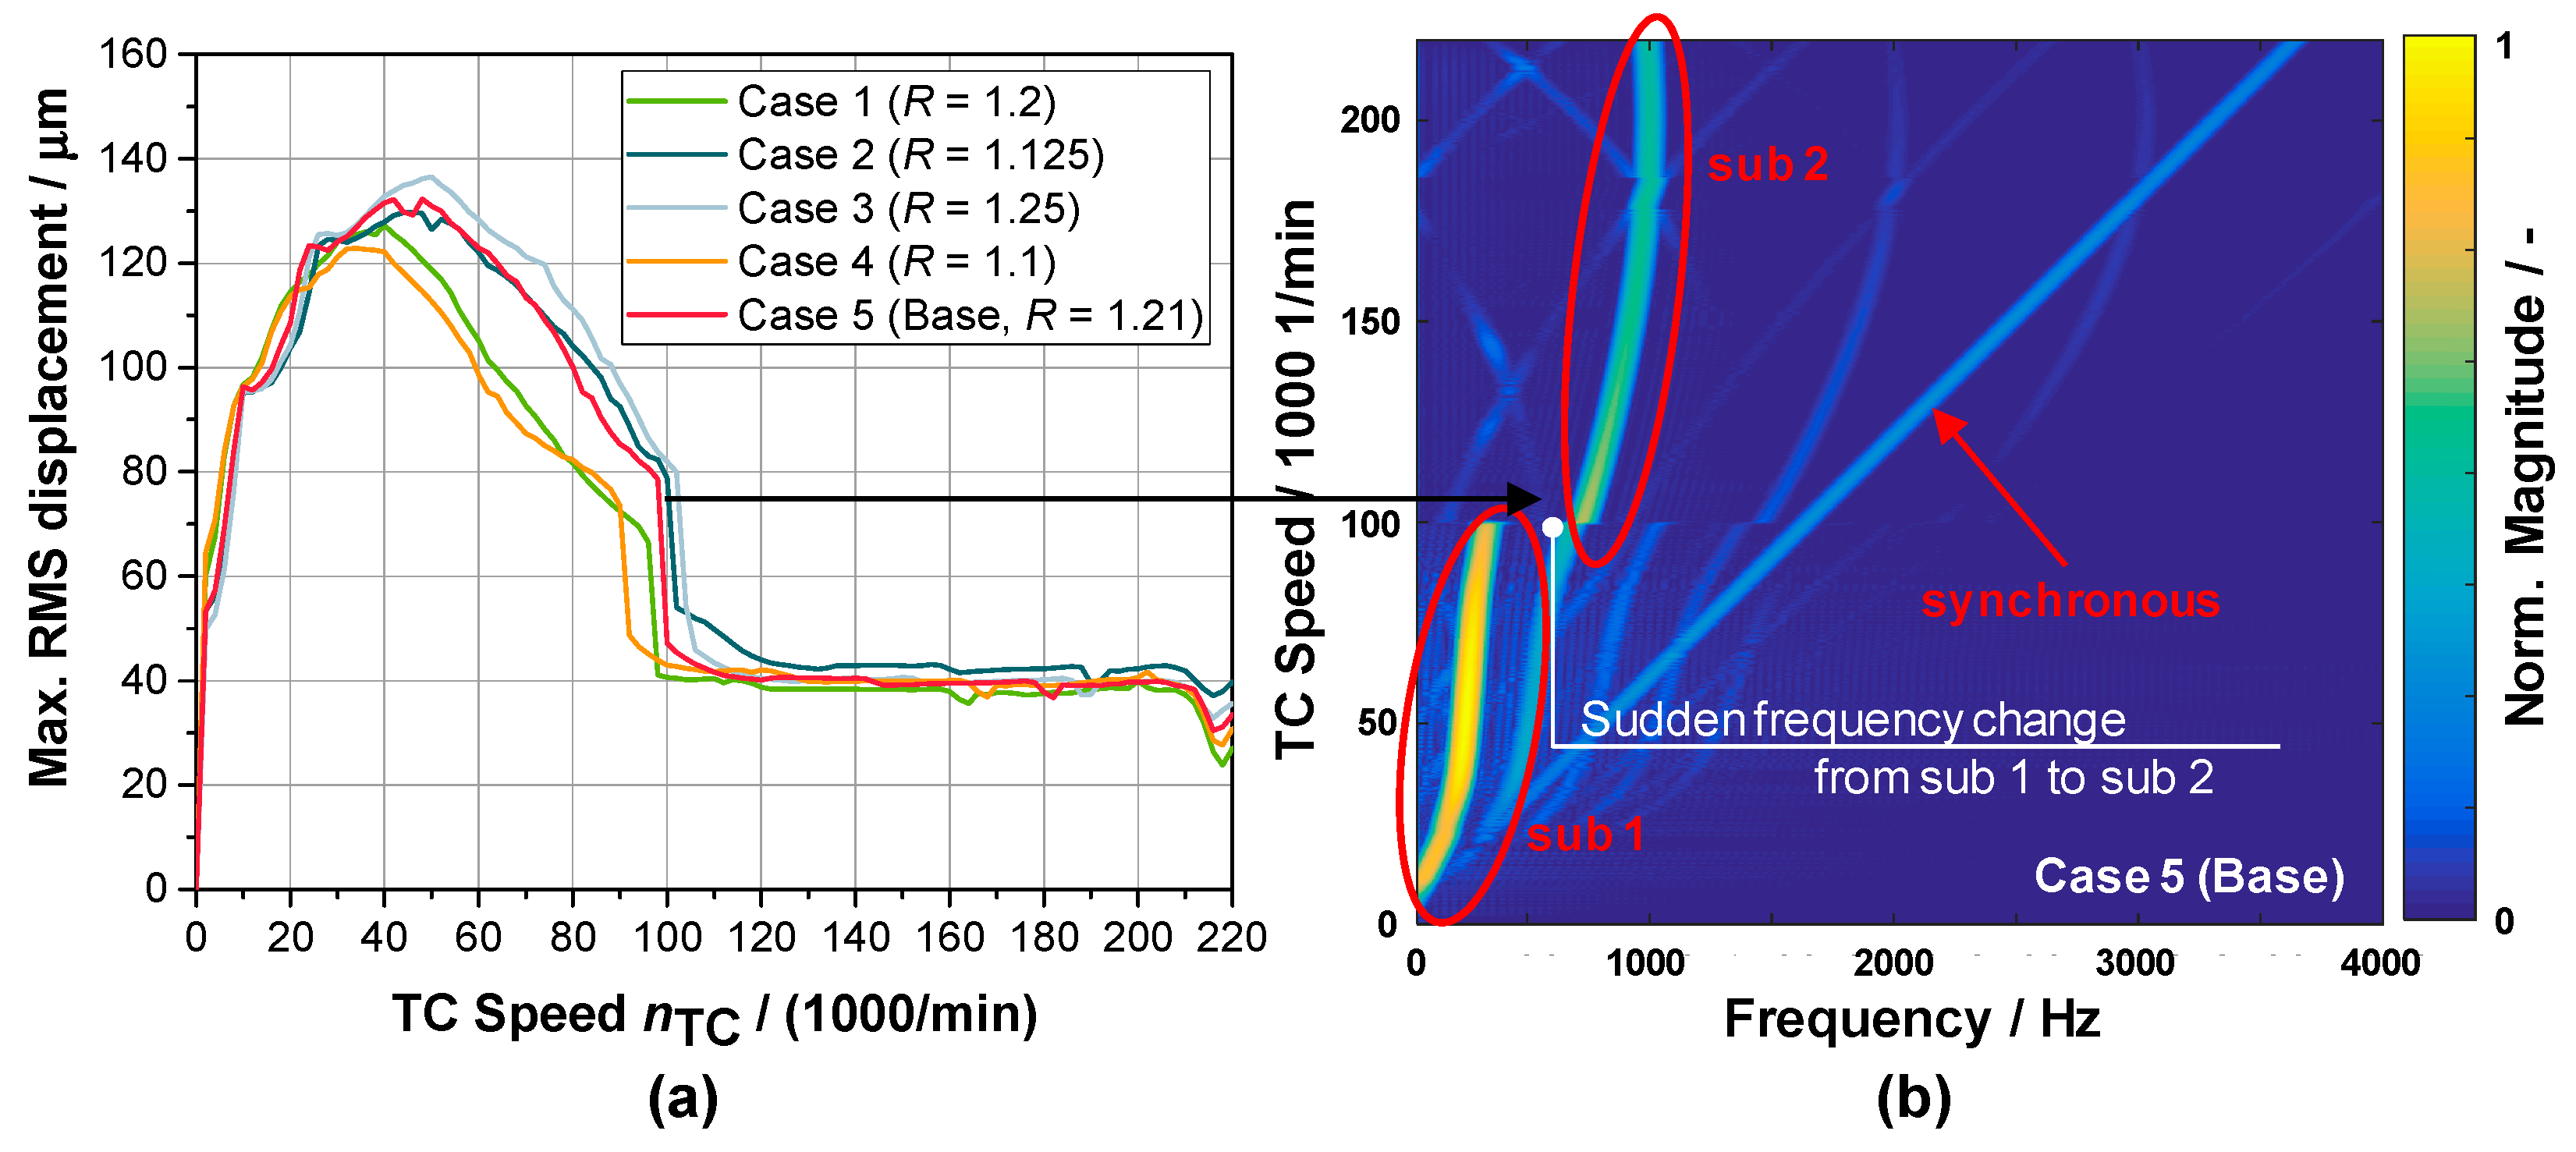
Figure 15a shows the maximum displacement (RMS) of the compressor wheel nut over TC speed. It is seen, that for all combinations a high shaft motion occurs at the compressor wheel nut between nTC = 0–100,000 1/min. Case 3, largest CW with smallest TW, shows the largest displacement with a max. peak of 136.5 µm. The lowest amplitude is achieved by Case 4, smallest CW with largest TW, and is 13.6 µm smaller than Case 3. All variations show a sudden decrease of the motion in radial direction at around nTC = 100,000 1/min, whereby this displacement jump occurs in Case 4 at around nTC = 90,000 1/min. If the results are transferred to a 3D short-time Fourier transform, it can be observed that there is a sudden jump of one sub-synchronous (sub 1) to another sub-synchronous (sub 2) oscillation. Figure 15b depicts this exemplary for Case 5, Base variant. Here, sub 1 is an oscillation with a conical mode shape and sub 2 is an oscillation with a cylindrical mode shape with a maximum frequency of around 1000 Hz. This frequency jump near nTC = 100,000 1/min is also the reason for the difference between measured and simulated shaft motion amplitudes in operating point P1 as discussed in the previous section.
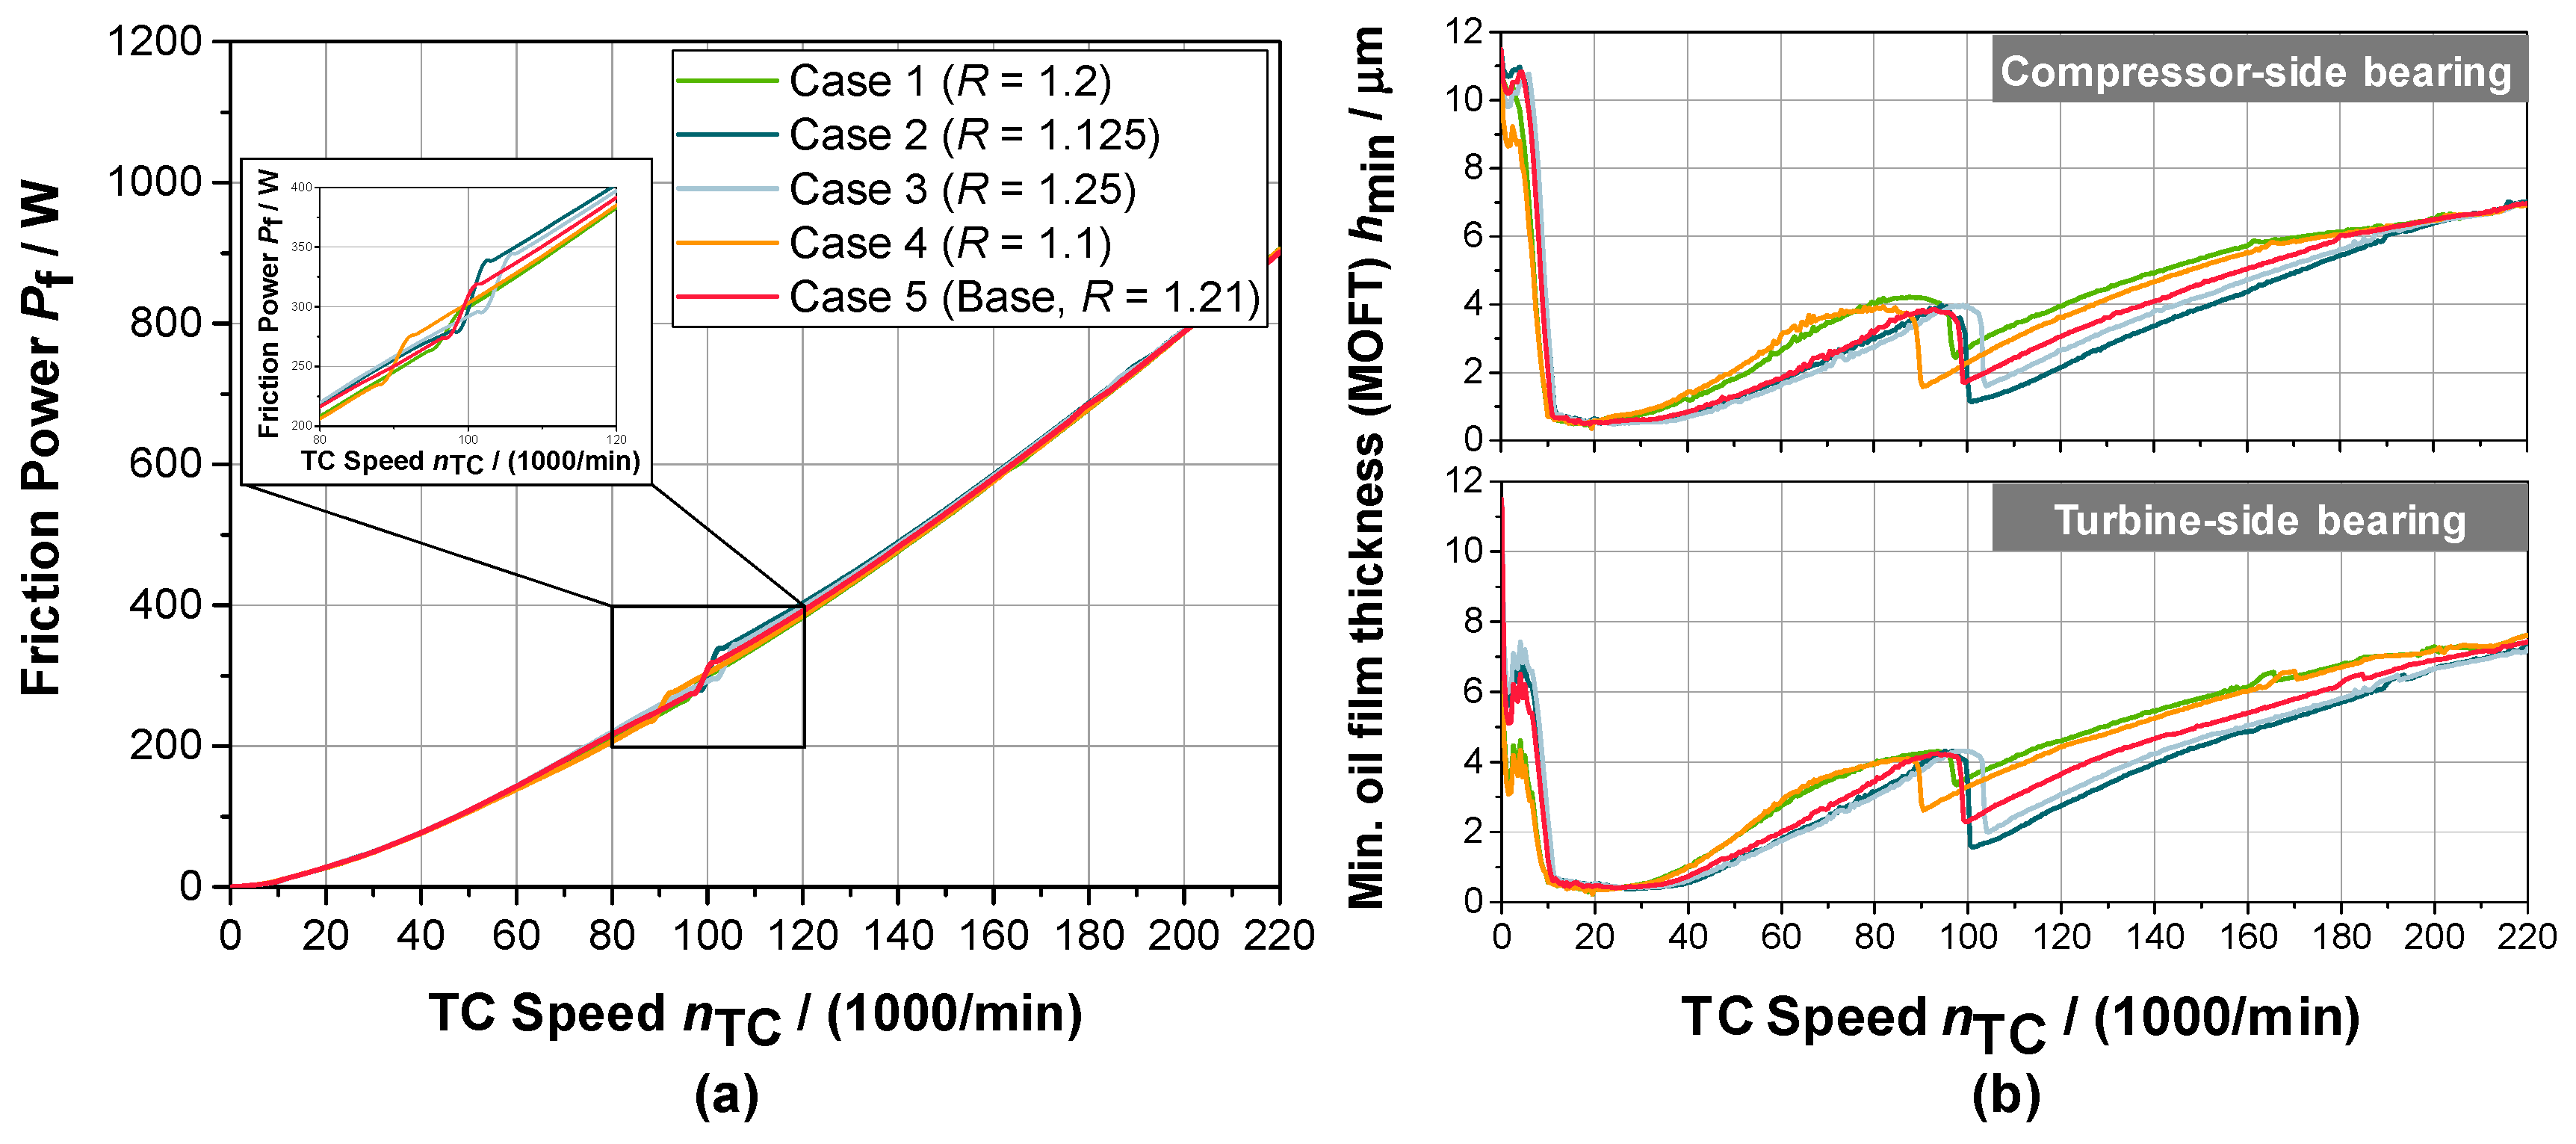
Whether the different displacement amplitudes and jumps from one to another sub-synchronous oscillation have an influence on the occurring bearing friction power can be seen in Figure 16a. The figure shows the averaged friction power over TC speed. Only during the frequency jump (sub 1 to sub 2) the friction power also shows a discontinuous behavior. At the time where the displacements rapidly decreases, the friction jumps to a little higher power level for all five cases. The largest increase during 5000 1/min is observed in Case 2 (ΔPf = 58 W) and Case 3 (ΔPf = 49 W). After nTC = 140,000 1/min, the friction power of all wheel combinations are nearly the same with no change anymore. The reason for this sudden friction increase can be found in the film thickness of the inner oil films of the journal bearing. Figure 16b shows the minimum oil film thickness hmin for both oil films. It can be seen that near nTC = 100,000 1/min the inner film thicknesses drop instantaneously. This drop directly translates into an increase in friction losses. Nevertheless, even though the different wheel combinations in this CHRA platform are quite different, the difference in the occurring bearing friction is small due to changed masses and inertias. In reality, different wheel combinations will lead to different thrust loads, but this was not covered in this sensitivity study.

3.4. Variation of Rotor Unbalance

Rotor balancing is usually applied in the production of automotive and commercial turbochargers to reduce the unbalance force and moment to minimize the induced unbalance excitations and therefore to reduce the TC noise behavior as well as to prevent the journal bearings from being damaged due to asperity contact (Nguyen-Schäfer [10]). In low-speed balancing the residual unbalance must be less than the permissible unbalance Ulim according to the DIN-ISO 1940-1 [27]. Balancing quality grades of G40 and G100 are commonly used for automotive and commercial vehicle turbochargers, which means that e lim Ω   =   40   mm s , respectively e lim Ω   =   100   mm s . The acceptable balance radius e lim is determined at the maximum rotor speed Ω max :
e lim   =   G Ω max
With this, the permissible residual unbalance Ulim can be calculated with Equation (12).
U lim   =   e lim · m rotor
U CW , U TW     U lim 2
In the low-speed balancing process compressor (CW) and turbine wheel (TW, incl. rotor shaft) are balanced separately, thus the residual unbalance for CW and TW should be smaller than one-half of Ulim (Equation (13)). For the following investigation a maximum TC speed of n TC , max   =   240 ,   000   1 min ( Ω max   =   25 , 133   rad sec ) has been set. With a rotor mass mrotor of 116 g (cf. Table 1), the following permissible residual unbalances for CW and TW are calculated:
G 40 :   U CW , 40 , U TW , 40   =   U lim 2   =   e lim · m rotor 2   =   1.592 · 10 3   mm   ·   116   g 2     0.09   gmm
G 100 :   U CW , 100 , U TW , 100   =   U lim 2   =   e lim · m rotor 2   =   3.979 · 10 3   mm   ·   116   g 2     0.23   gmm
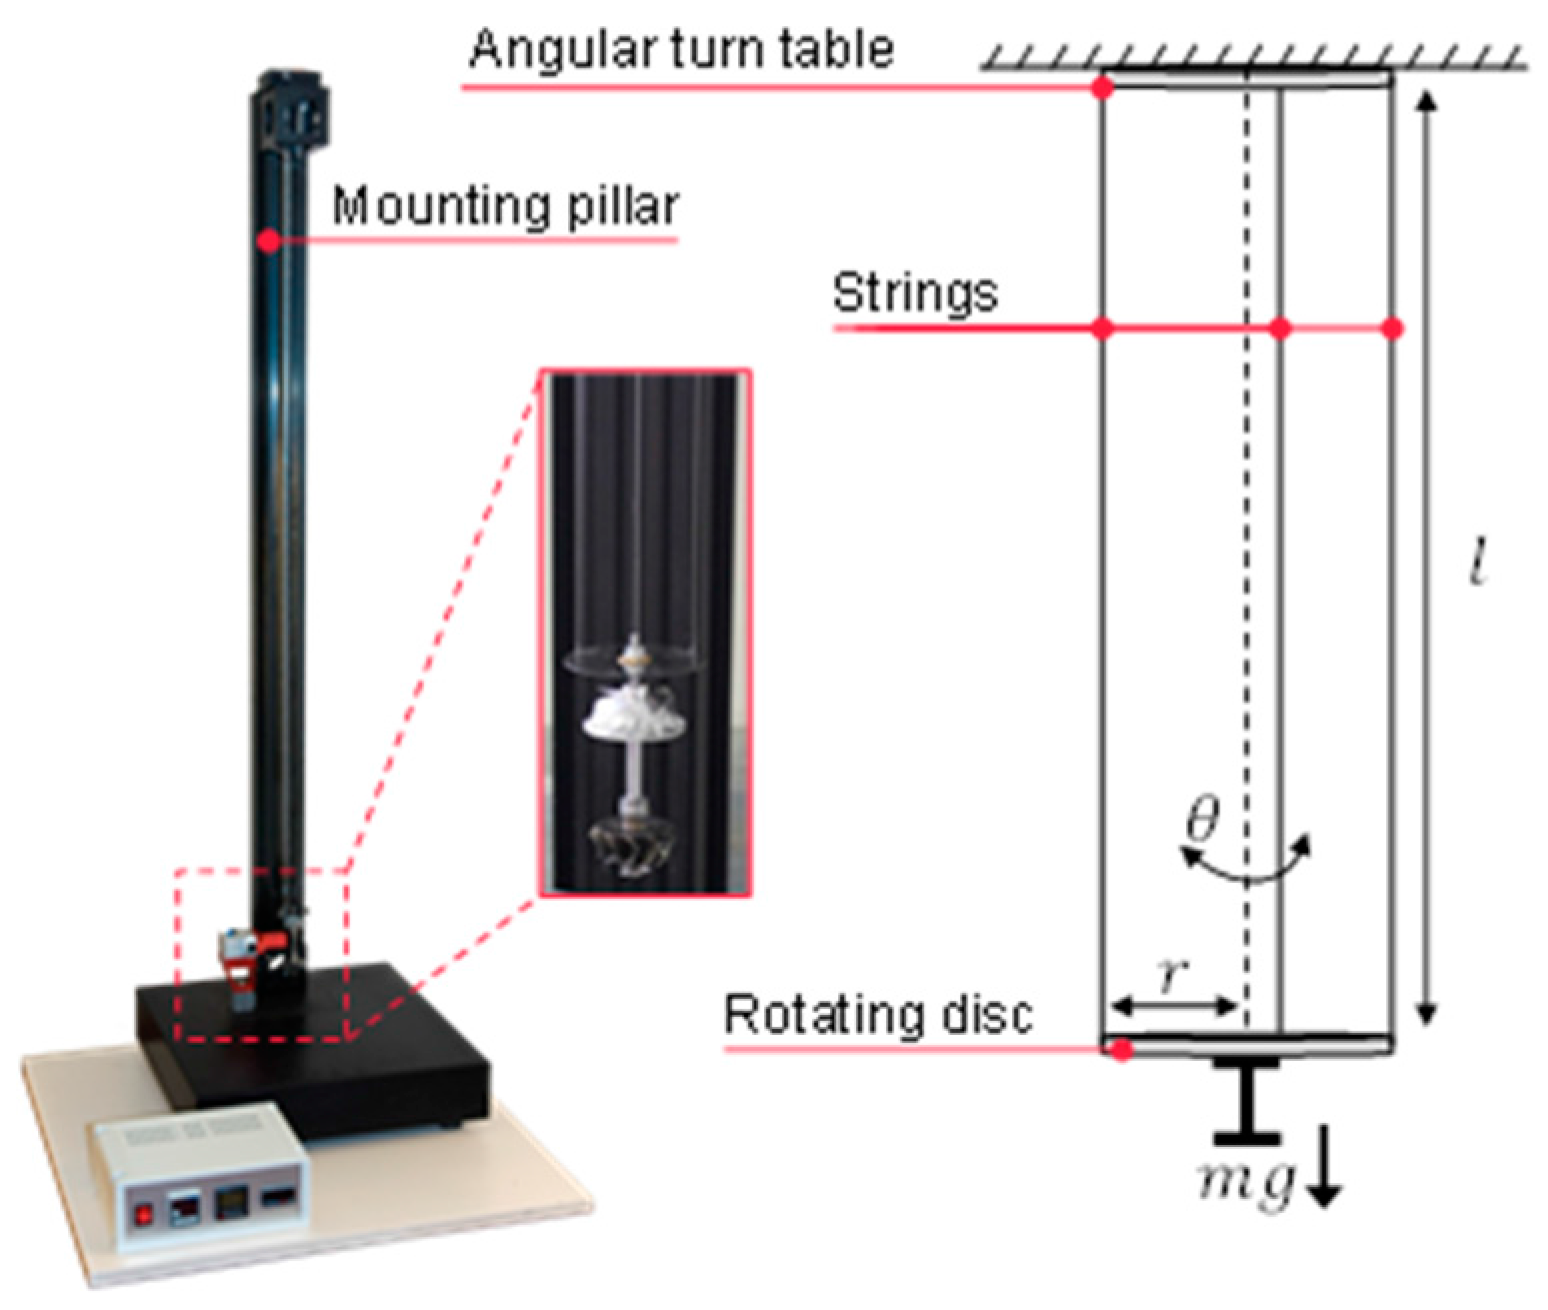
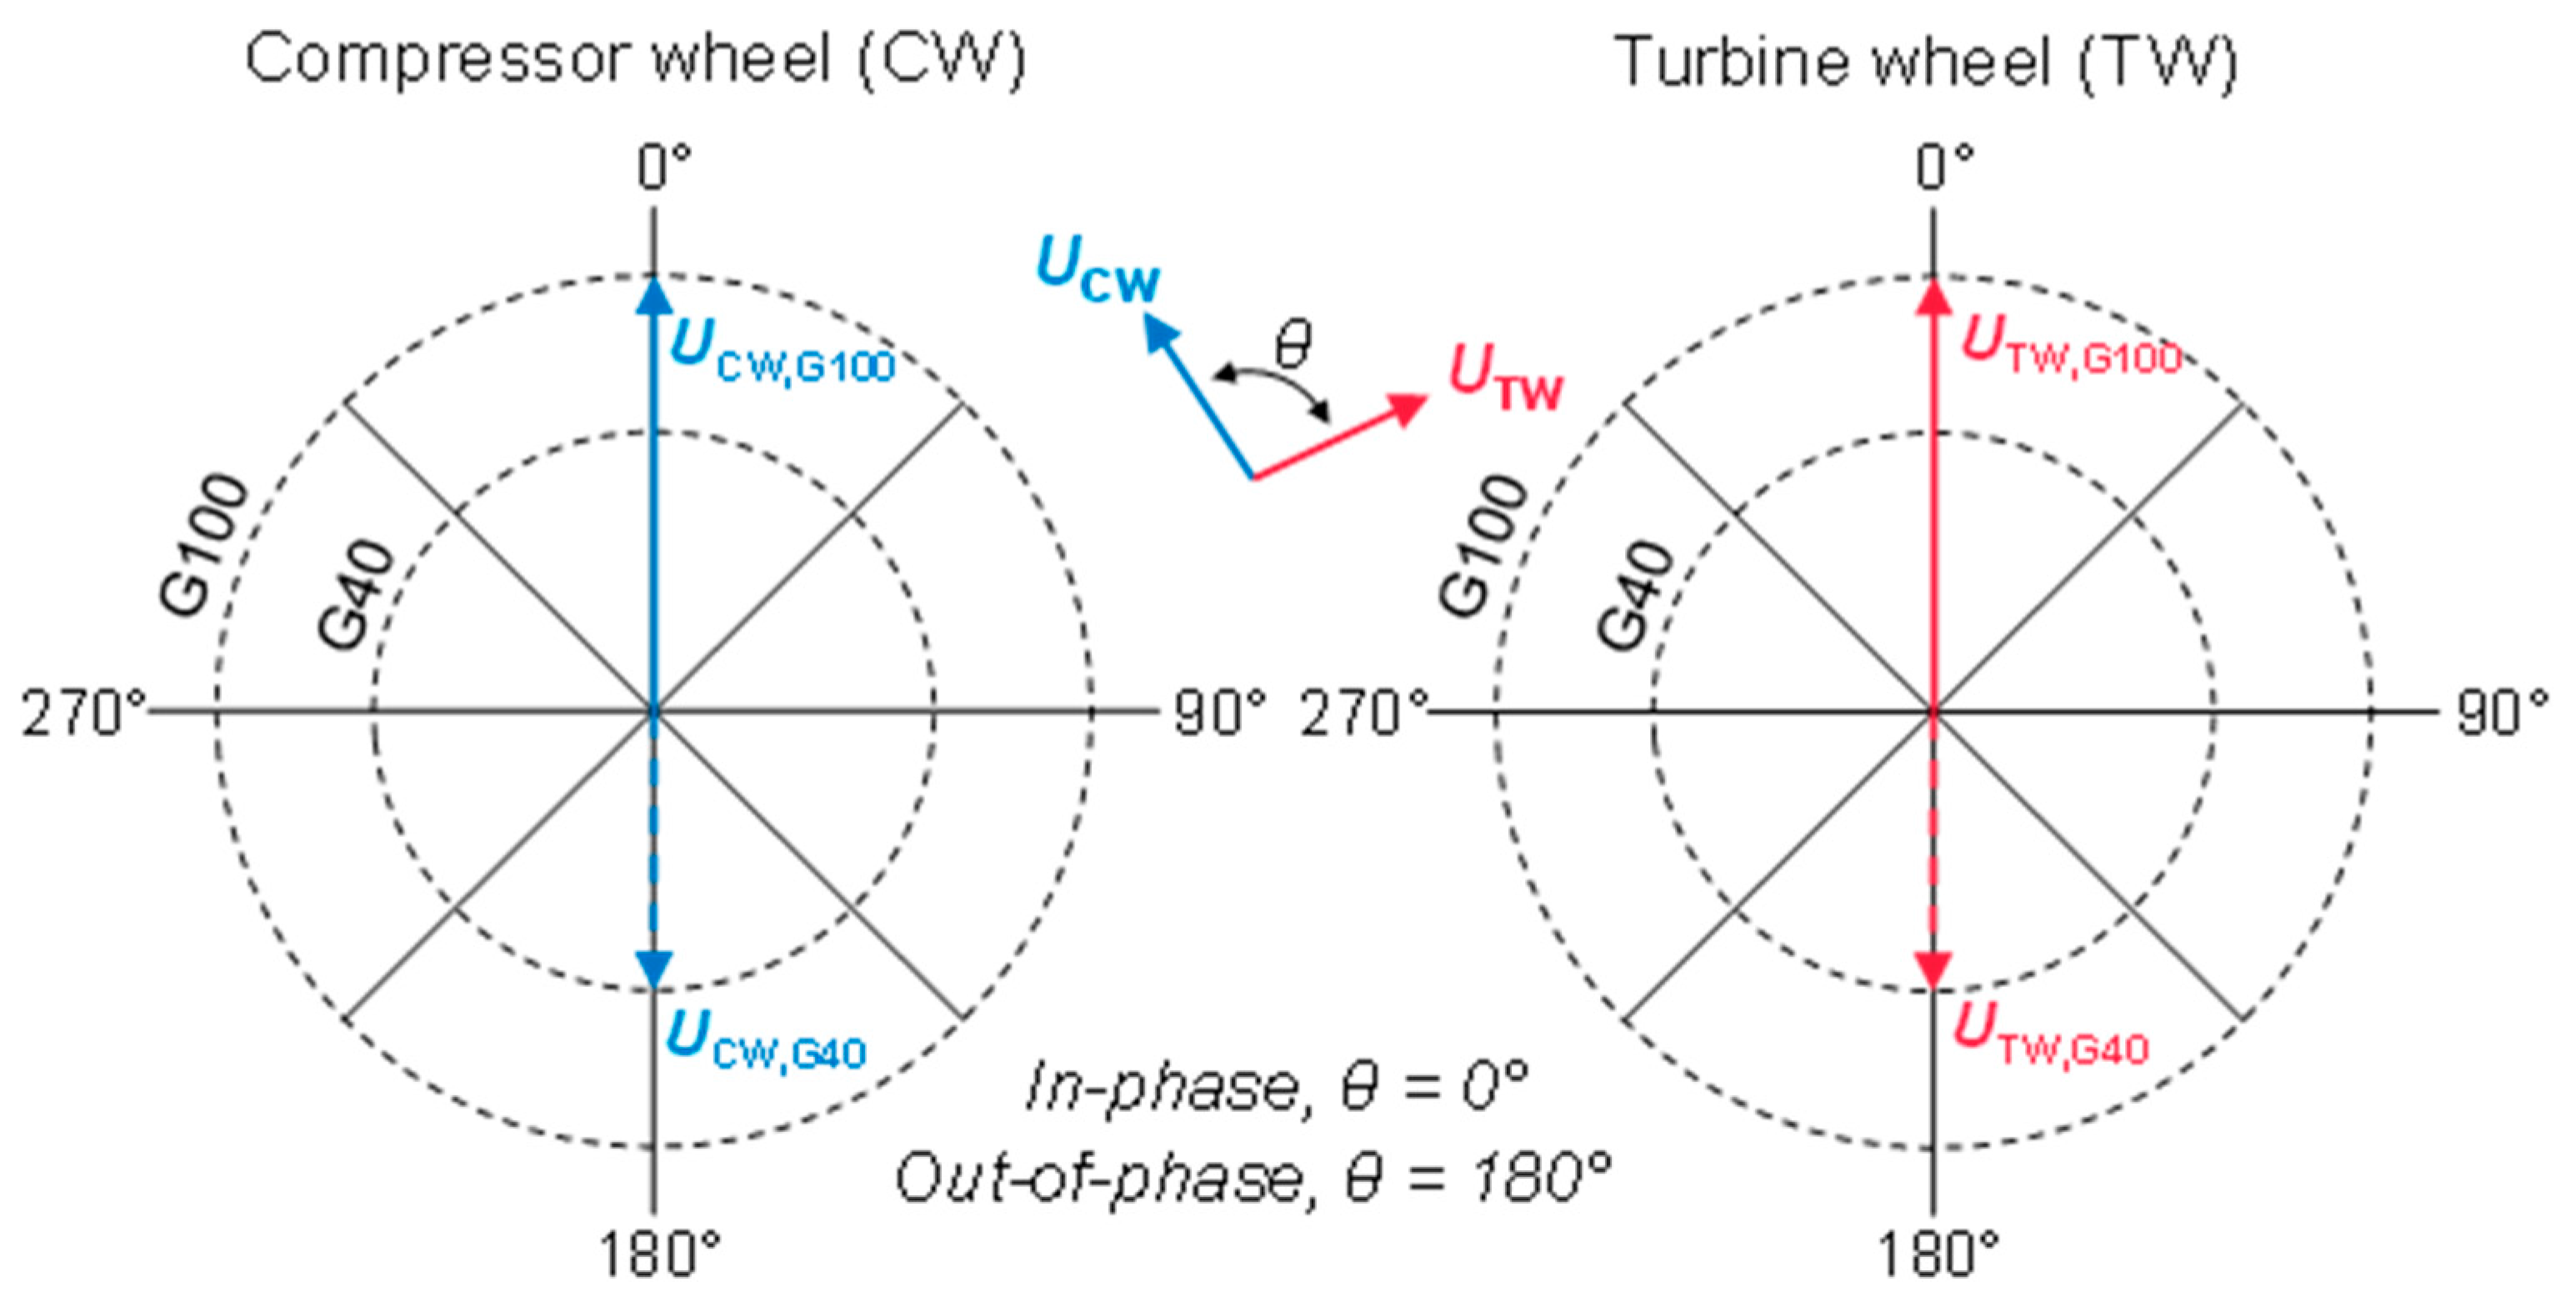
These residual unbalances are attached by point masses with a fixed angle θ in the MBS model. Here, θ describes the angle between the point mass direction of the CW and TW, as depicted in Figure 17. An in-phase couple unbalance (θ = 0°) of the residual unbalance point masses means that they have the same direction; if the point masses are opposite to each other the rotor unbalance is called an out-of-phase couple unbalance (θ = 180°) [10].
To compare the quality grades G40 and G100 as well as in-phase and out-of-phase couple unbalance the following MBS model variations were set-up:
  • G40IN: U C , G 40 and U T , G 40 with θ   =   0 ° (in-phase couple unbalance)
  • G40OUT: U C , G 40 and U T , G 40 with θ   =   180 ° (out-of-phase couple unbalance)
  • G100IN: U C , G 100 and U T , G 100 with θ   =   0 ° (in-phase couple unbalance)
  • G100OUT: U C , G 100 and U T , G 100 with θ   =   180 ° (out-of-phase couple unbalance)
  • w/o unbalanced mass: No unbalance distribution is added to the MBS model
For all variations transient dynamic simulations with an oil inlet temperature of Toil = 90 °C, oil supply pressure poil = 4 bar (abs.) and zero thrust load Fax were performed. 
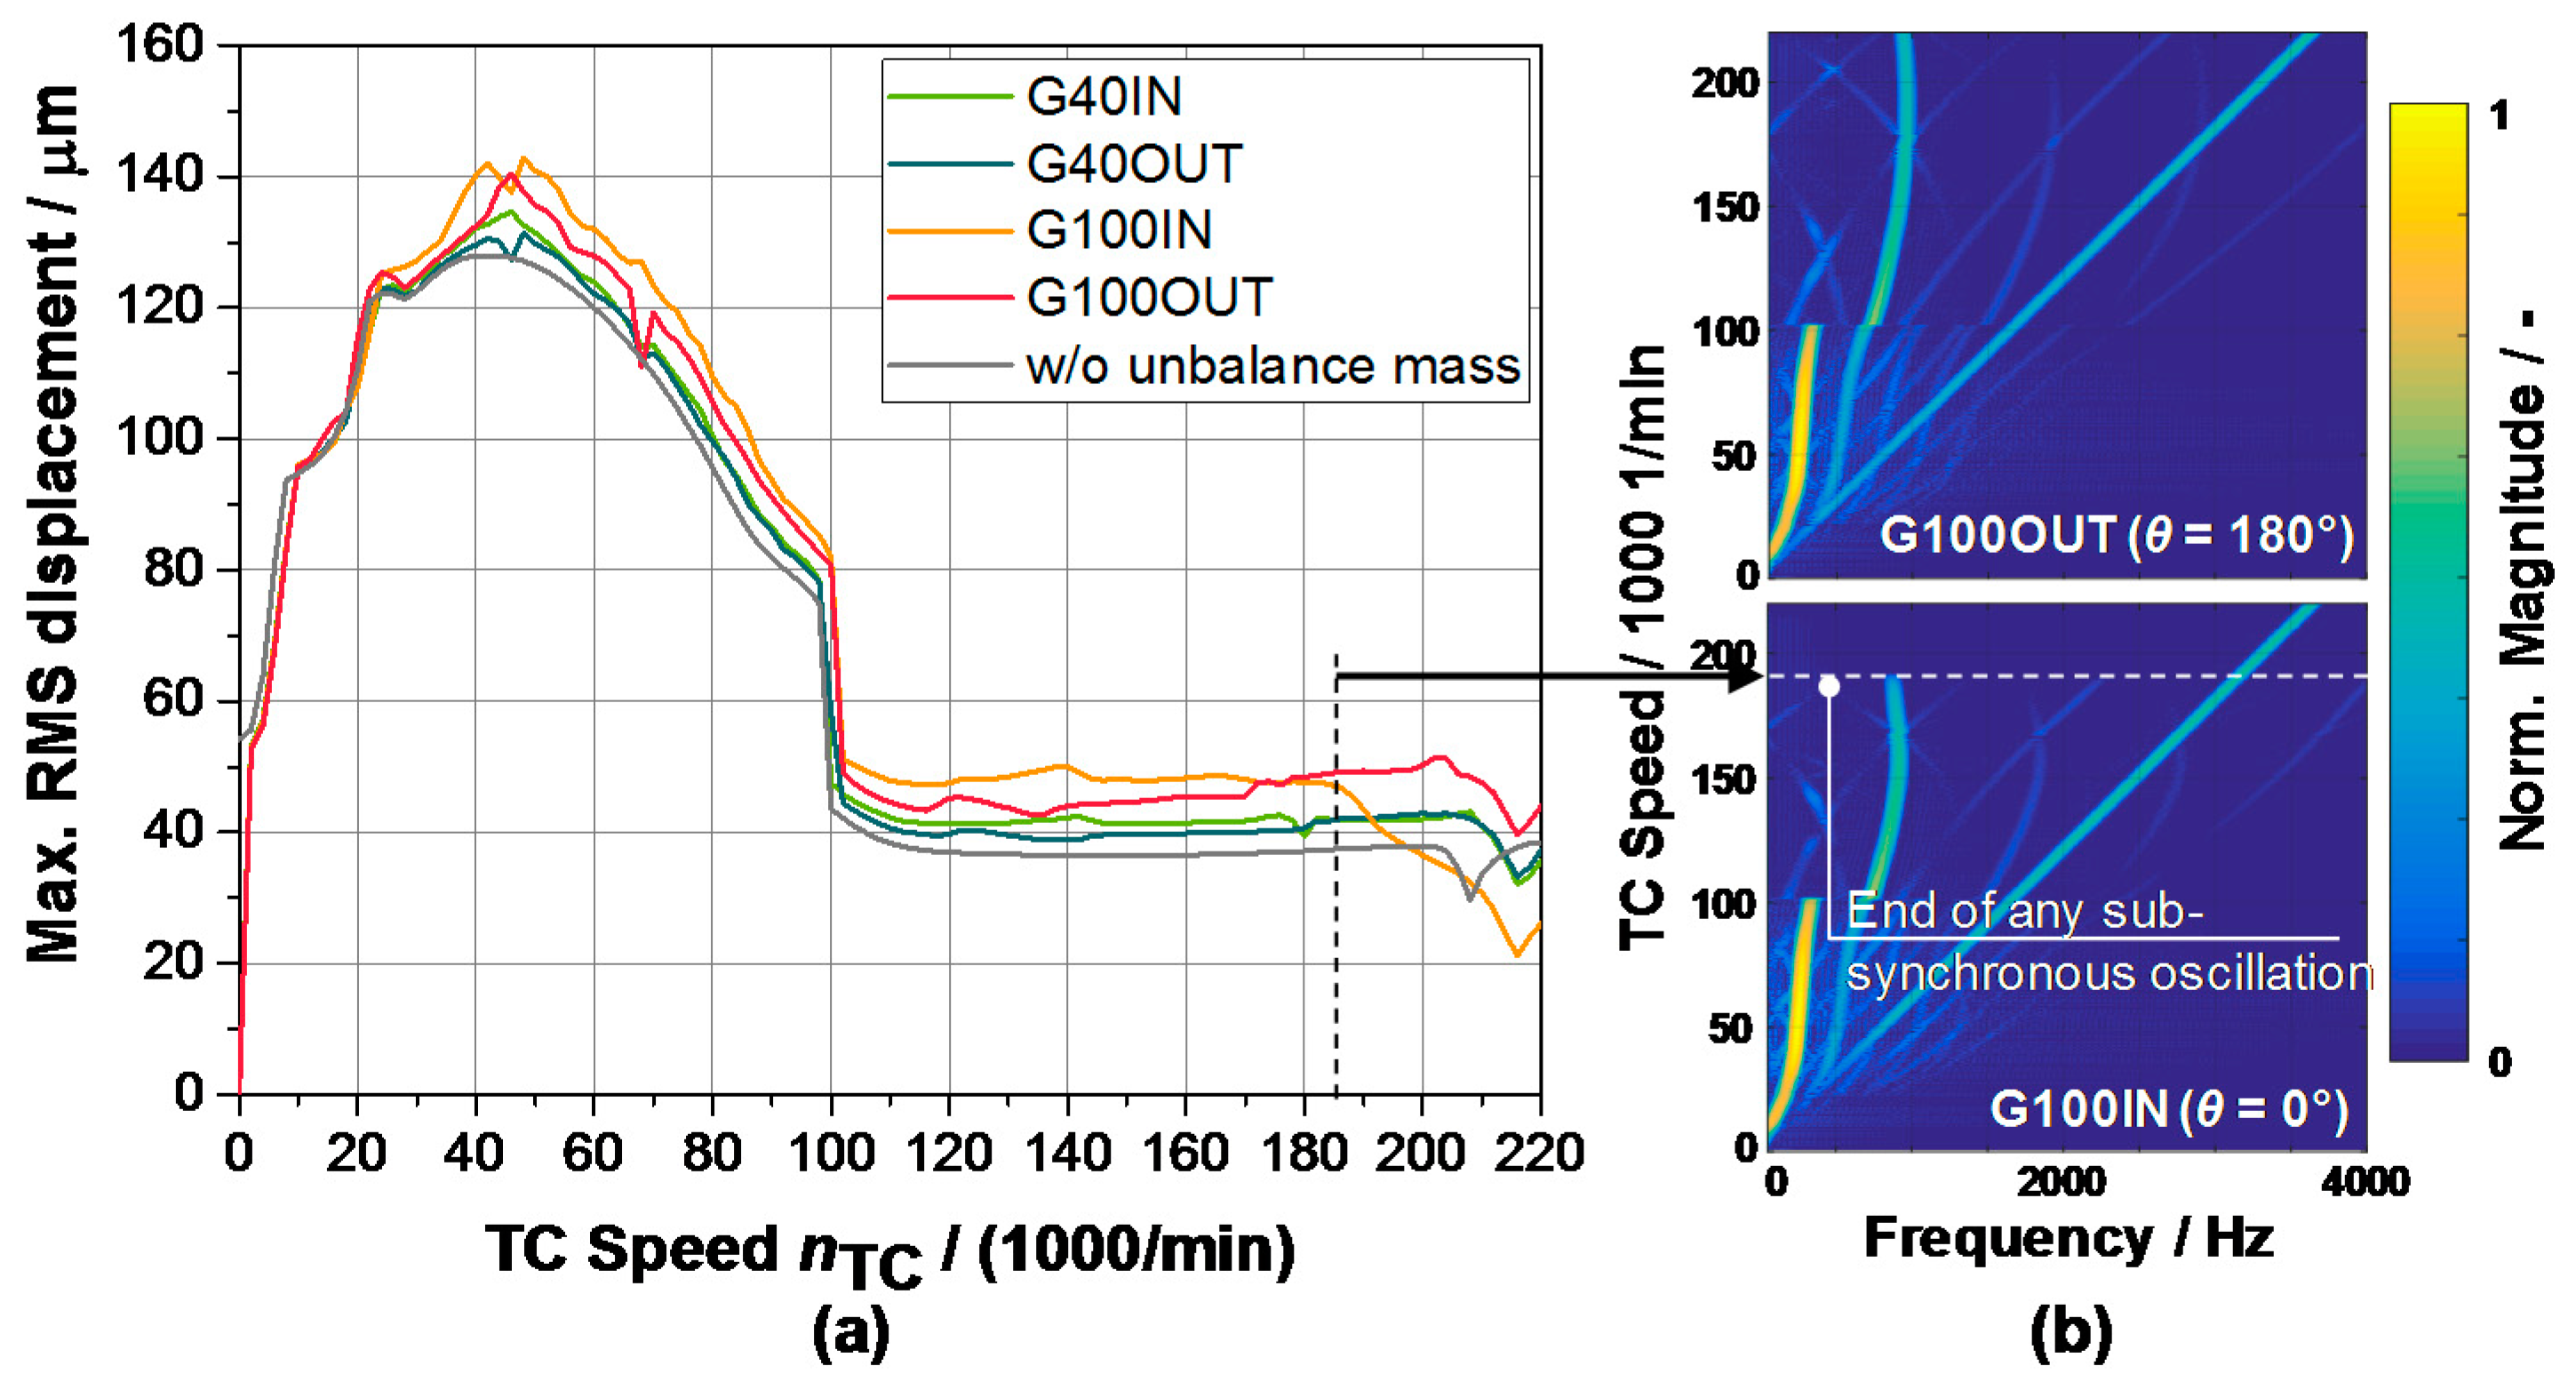
Figure 18a shows the maximum displacement (RMS) of the compressor wheel nut over TC speed. A clear trend of the unbalanced mass on the shaft motion can be observed: With higher unbalanced mass, the maximum displacement is increasing. Similar results can be found in literature, e.g., current measurements on a high speed Laval rotor by Eling et al. [28]. Here, the authors show that with increasing rotor unbalance chiefly the synchronous vibration is increasing as expected but they show as well, that the rotor unbalance can suppress and extend sub-synchronous vibrations (oil whirls). As a second trend, Figure 18a shows that the out-of-phase couple unbalance achieve a lower shaft motion oscillation than the in-phase couple unbalance and these differences grow with higher quality grades. A peculiarity can be observed for G100IN, where the maximum displacement rapidly decreases at nTC = 185,000 1/min. If G100IN and G100OUT are compared with waterfall plots (Figure 18b) it is seen that the second sub-synchronous vibration of G100IN is suppressed at this speed (nTC = 185,000 1/min).
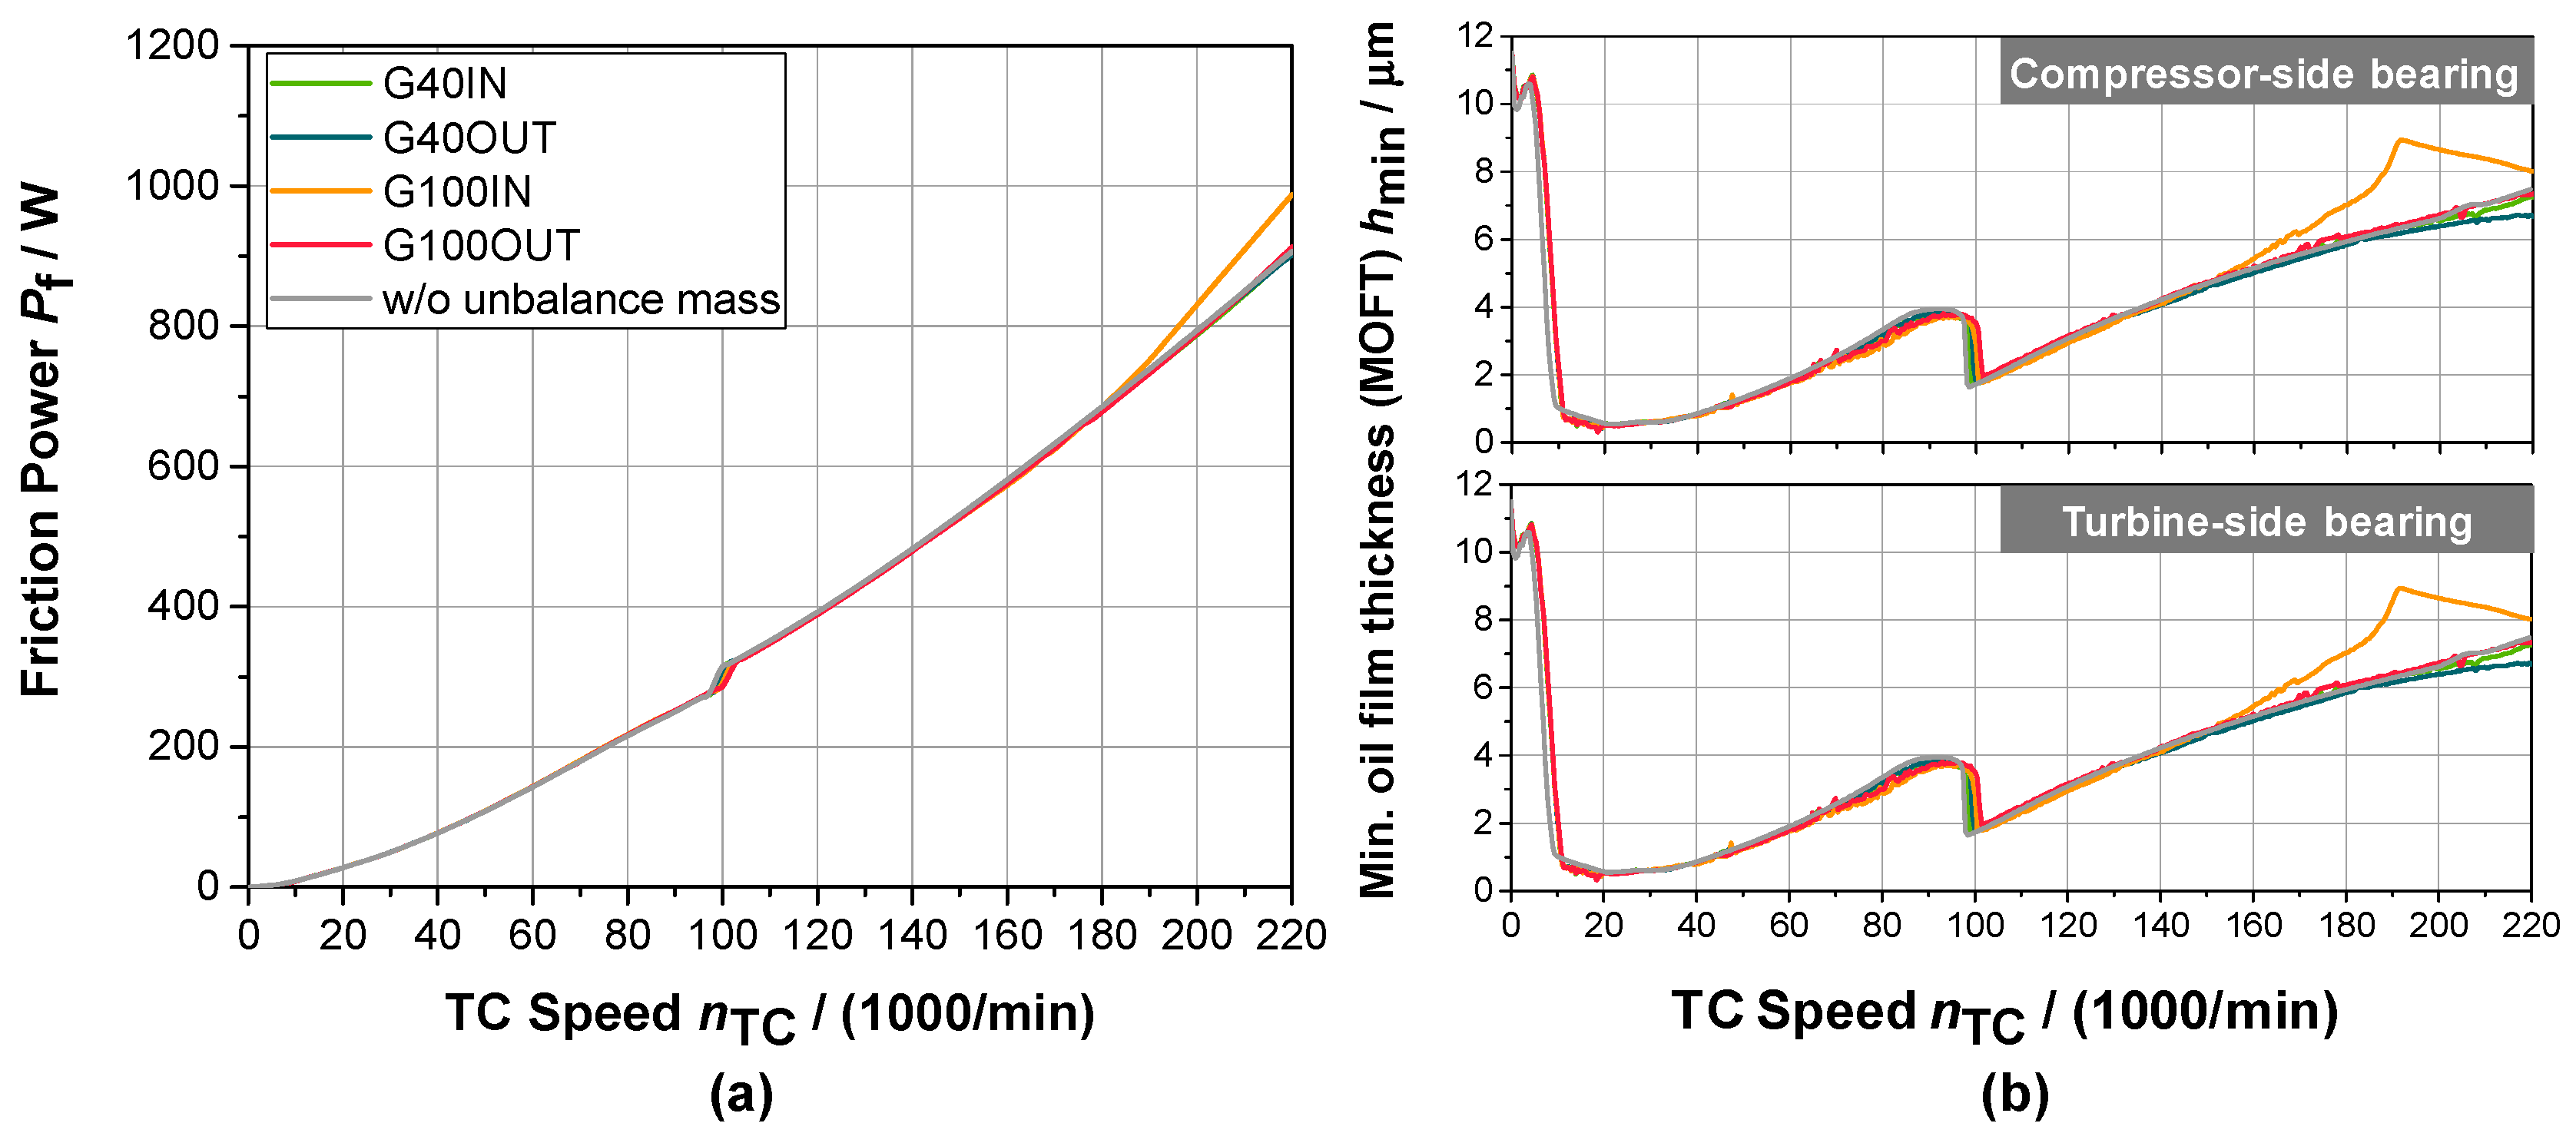
Figure 19a shows the occurring averaged friction power in the bearing system for all five unbalance cases. It can be summarized, that no influence of the rotor unbalance on the friction power can be observed. Only for G100IN, where the sub-synchronous vibration is suppressed, the bearings dissipate more bearing friction than the other cases above nTC = 190,000 1/min. Figure 19b shows the inner min. oil film thickness hmin for both side bearings. Although hmin of G100IN from nTC = 160,000 1/min is higher than hmin of the other cases, the friction is also higher. Due to the sudden suppression of the sub-synchronous oscillation at nTC = 180,000 1/min, hmin is decreasing but remains with a higher value till end of the speed range. It is assumed, that the friction increase is caused by an increase of the oil flow, which shall be part of future investigations. The founding that the unbalance amount does not significantly affect the friction losses is supported by the study of Eling et al. [28]. Here, the measured friction power was also similar for all examined unbalanced masses.

4. Conclusions

The results of measured and simulated friction losses as well as dynamic behavior for a turbocharger of light duty and passenger vehicles have been presented. The key objective was to examine the influence of the rotor dynamics on bearing friction without changing the geometry of the bearing system. The manuscript starts with three main questions which can be answered with the insights of the presented investigations.
It is shown that the friction power losses measured on the friction test bench are transferable to the hot gas test bench. In Section 3.1 and Section 3.2 the simulation model was validated through measurements and it was shown, that the friction occurring in the bearings are nearly the same for friction test bench set-up and hot gas test bench set-up. Although at certain operating points the dynamic behavior is different, in general no major differences in bearing friction could be observed.
In Section 3.3 the influence of the wheel sizes on the mechanical losses was examined, which has not yet been covered in literature. Through the changed masses and inertias the rotor dynamic behavior changed for all investigated cases but also here only little changes of the dissipated bearing power could be found. The TC speed, at which the rotor dynamics transition from one to another sub-synchronous oscillation was changed, is also associated with a change in friction power loss. Due to the different surfaces of the wheel back discs, the thrust load of the investigated configurations will be different. This however, was not part of this sensitivity study and will be analyzed in future investigations.
Finally, a variation of rotor unbalance was carried out to investigate the dependency of unbalance on the resulting bearing friction. Simulations with two different balancing quality grades and in-phase and out-of-phase couple unbalance were performed. It was shown that the unbalance amount does not significantly affect the bearing friction losses. It seems that out-of-phase couple unbalance reduces the maximum deflection of the rotor, but with no change in occurring friction power. Only in one case the in-phase couple unbalance (θ = 0°) leads to a suppressing of a sub-synchronous vibration at high TC speeds. As a result, the bearing friction increases.

Author Contributions

Björn Höpke set up the examined turbocharger on the friction test bench and measured the bearing friction. Max Stadermann set up the examined turbocharger on the hot-gas test bench and performed the experiments. Both wrote the section about the experimental investigations. Julius Perge and Arthur Back built up the simulation model. Julius Perge analyzed the data and wrote the majority of the manuscript. Dominik Lückmann, Tolga Uhlmann and Stefan Pischinger added useful information and discussions relevant to this manuscript.

Conflicts of Interest

The authors declare no conflict of interest.

References

  1. Golloch, R. Downsizing bei Verbrennungsmotoren; Springer: Berlin, Germany, 2005. [Google Scholar]
  2. Weinowski, R.; Sehr, A.; Dieterich, C. Auf dem Weg zu 95 g/km CO2—Konzept eines aufgeladenen 3-Zylinder DI-SOHC-Ottomotors mit kleinem Bohrungsdurchmesser. In Proceedings of the 19th Aachen Automobile and Engine Technology Colloquium, Aachen, Germany, 4–6 October 2010. [Google Scholar]
  3. O’Conner, G.; Smith, M. Variable Nozzle Turbochargers for Passenger Car Applications; SAE Technical Paper 880121; SAE International: Warrendale, PA, USA; Troy, MI, USA, 1988. [Google Scholar]
  4. Lückmann, D.; Uhlmann, T.; Pischinger, S.; Kindl, S. Separation in Double Entry Turbine Housings at Boosted Gasoline Engines. MTZ Worldw. 2013, 10, 4–9. [Google Scholar] [CrossRef]
  5. Perge, J.; Höpke, B.; Uhlmann, T.; Lehmann, J. Turbocharger bearing friction measurement and simulation. In Proceedings of the ATZLive Reibungsminimierung im Antriebsstrang, Esslingen, Germany, 2015. [Google Scholar]
  6. Höpke, B.; Uhlmann, T.; Pischinger, S.; Lueddecke, B.; Filsinger, D. Analysis of Thrust Bearing Impact on Friction Losses in Automotive Turbochargers. J. Eng. Gas Turbines Power 2015, 137. [Google Scholar] [CrossRef]
  7. Uhlmann, T. Vermessung Und Modellierung Von Abgasturboladern Für Die Motorprozessrechnung. Ph.D. Thesis, RWTH Aachen University, Aachen, Germany, 2013. [Google Scholar]
  8. Myers, C. Bifurcation Theory Applied to Oil Whirl in Plain Cylindrical Journal Bearings. J. Appl. Mech. 1984, 51, 244–250. [Google Scholar] [CrossRef]
  9. Muszynska, A. Whirl and whip-rotor/bearing stability problems. J. Sound Vib. 1986, 110, 443–462. [Google Scholar] [CrossRef]
  10. Nguyen-Schäfer, H. Rotordynamics of Automotive Turbochargers; Springer: Berlin, Germany, 2015. [Google Scholar]
  11. Schweizer, B. Oil whirl, oil whip and whirl/whip synchronization occuring in rotor systems with full-floating ring bearings. Nonlinear Dyn. 2009, 57, 509–532. [Google Scholar] [CrossRef]
  12. Schweizer, B. Dynamics and stability of turbocharger rotors. Arch. Appl. Mech. 2010, 80, 1017–1043. [Google Scholar] [CrossRef]
  13. Koutsouvasilis, P.; Driot, N.; Lu, D.; Schweizer, B. Quantification of sub-synchronous vibrations for turbocharger rotors with full-floating ring bearings. Arch. Appl. Mech. 2015, 85, 481–502. [Google Scholar] [CrossRef]
  14. Koutsovasilis, P.; Driot, N. Turbocharger rotors with oil-film bearings: Sensitity and optimization analysis in virtual prototyping. In Proceedings of the Internation Conference on Vibrations in Rotating Machines (SIRM), Magdeburg, Germany, 23–25 February 2015. [Google Scholar]
  15. Daniel, C.; Göbel, S.; Nitzschke, S.E.W.; Strackeljan, J. Numerical simulation of the dynamic behaviour of turbochargers under consideration of full-floating-ring bearings and ball bearings. In Proceedings of the 11th International Conference on Vibration Problems (ICOVP), Lisbon, Portugal, 9–12 September 2013. [Google Scholar]
  16. Lückmann, D.; Stadermann, M.; Pischinger, S.; Kindl, H. Advanced Measurement and Modeling Methods of Turbochargers. MTZ Worldw. 2016, 6, 80–87. [Google Scholar] [CrossRef]
  17. Craig, R.R., Jr.; Bampton, M.C.C. Coupling of substructures for dynamic analyses. AIAA J. 1968, 6, 1313–1319. [Google Scholar]
  18. Dowson, D. A generalized Reynolds equation for fluid-film lubrication. Int. J. Mech. Sci. 1962, 4, 159–170. [Google Scholar] [CrossRef]
  19. Jakobsson, B.; Floberg, L. The Finite Journal Bearing Considering Vaporization. Chalmers Tekniska Hogskolas Handlingar 1957, 10, 1–116. [Google Scholar]
  20. Olsson, K.O. Cavitation in Dynamically Loaded Bearings. Chalmers Tekniska Hogskolas Handlingar 1965, 34, 1–60. [Google Scholar]
  21. Rienäcker, A. Instationäre Elastohydrodynamik Von Gleitlagern Mit Rauhen Oberflächen Und Inverse Bestimmung Der Warmkonturen. Ph.D. Thesis, RWTH Aachen University, Aachen, Germany, 1995. [Google Scholar]
  22. Lagemann, V. Numerische Verfahren Zur Tribologischen Charakterisierung Bearbeitungsbedingter Rauher Oberflächen Bei Mikrohydrodynamik Und Mischreibung. Ph.D. Thesis, Universität Kassel, Kassel, Germany, 2000. [Google Scholar]
  23. Greenwood, J.A.; Tripp, J.H. The Contact of Two Nominally Flat Rough Surfaces. Proc. Instution Mech. Eng. 1970, 185, 625–633. [Google Scholar] [CrossRef]
  24. Vogel, H. Das Temperaturabhängigkeitsgesetz der Viskosität von Flüssigkeiten. Phys. Z. 1921, 22, 645–646. [Google Scholar]
  25. Cameron, A. The Principles of Lubrication; Longmans Green & Ltd.: London, UK, 1966. [Google Scholar]
  26. Nguyen-Schäfer, H. Nonlinear Rotordynamic Computations of Automotive Turbochargers Using Rotating Floating Ring Bearings at High Rotor Speeds. In Proceedings of the SIRM, Berlin, Germany, 25–27 February 2013. [Google Scholar]
  27. DIN ISO 1940–1. Mechanical Vibration—Balance Quality Requirements for Rotors in A Constand (Rigid) State—Part 1: Specification and Verification of Balance Tolerances; ISO: Geneva, Switzerland, 2003. [Google Scholar]
  28. Eling, R.; te Wierik, M.; van Ostayen, R.; Rixen, D. Rotordynamic and Friction Loss Measurements on a High Speed Laval Rotor Supported by Floating Ring Bearings. Lubricants 2017, 5, 7. [Google Scholar] [CrossRef]
Figure 1. Rotational inertia/pendulum test bench and schematic representation of it.
Lubricants 05 00029 g001
Figure 2. Test setup for turbocharger friction measurement.
Lubricants 05 00029 g002
Figure 3. Test setup for the hot gas test bench.
Lubricants 05 00029 g003
Figure 4. Setup of high frequency eddy current sensors to measure shaft motion on hot gas test bench.
Lubricants 05 00029 g004
Figure 5. Schematic of the simulation process.
Lubricants 05 00029 g005
Figure 6. Schematic representation of semi-floating ring journal bearing and oil film pressure distributions with one bearing sleeve for two journal bearings (compressor and turbine side).
Lubricants 05 00029 g006
Figure 7. Dynamic oil viscosity vs. temperature curve for the 5W30 oil type which was used.
Lubricants 05 00029 g007
Figure 8. Schematic representation of thrust bearing and film pressure distribution.
Lubricants 05 00029 g008
Figure 9. (a) Impact of thrust load (“compressor pulls”) on friction power for three different TC speeds with Toil = 90 °C and poil = 4 bar (abs.) (stationary); (b) Simulation (transient) and measurement of friction power for different oil inlet temperatures with poil = 4 bar (abs.) and unloaded thrust bearing (Fax = 0 N).
Lubricants 05 00029 g009
Figure 10. (af) Shaft motion orbits of measurement (gray) and simulation (red) for all six operating points. In addition, simulated operating point P1’ (yellow) at nTC = 100,000 1/min which shows similar result to measured operating point P1 at nTC = 97,000 1/min.
Lubricants 05 00029 g010
Figure 11. Amplitudes of shaft motion orbits of measurement (gray) and simulation (red) for all six operating points.
Lubricants 05 00029 g011
Figure 12. (af) Fourier transform (FFT) plots of measurement (gray) and simulation (red) for all six operating points.
Lubricants 05 00029 g012
Figure 13. (a) Friction power over TC speed for transient simulation with unloaded thrust bearing (Fax = 0 N) for TC friction test bench set-up and TC hot gas test bench (FEV Europe GmbH, Aachen, Germany) set-up with Toil = 90 °C and poil = 4 bar (abs.); (b) Stationary simulation results of friction power of all operating points with Toil = 90 °C, poil = 4 bar (abs.) and varying thrust load Fax.
Lubricants 05 00029 g013
Figure 14. (a) Friction power over TC speed for transient simulation with unloaded thrust bearing (Fax = 0 N) for TC friction test bench set-up and TC hot gas test bench set-up with Toil = 90 °C and poil = 4 bar (abs.); (b) Relative increase of friction power due to thrust load for all operating points.
Lubricants 05 00029 g014
Figure 15. (a) Max. displacement (RMS) at the compressor wheel nut; (b) Waterfall plot of the displacement at the compressor wheel nut for Case 5.
Lubricants 05 00029 g015
Figure 16. (a) Averaged friction power over TC speed for all five wheel-size cases; (b) Min. oil film thickness (MOFT) over TC speed for the inner oil film of compressor-side bearing (above) and turbine-side bearing (below).
Lubricants 05 00029 g016
Figure 17. Scheme of the residual unbalance point masses in the compressor and turbine wheel as well as description of in- and out-of-phase unbalance couple.
Lubricants 05 00029 g017
Figure 18. (a) Max. displacement (RMS) at the compressor wheel nut. (b) Waterfall plots of the displacement at the compressor wheel nut for G100OUT (above) and G100IN (below). Suppress of second sub-synchronous oscillation at nTC = 185,000 1/min with unbalance case G100IN.
Lubricants 05 00029 g018
Figure 19. (a) Averaged friction power over TC speed for all five unbalance cases. (b) Min. oil film thickness (MOFT) over TC speed for the inner oil film of compressor-side bearing (above) and turbine-side bearing (below).
Lubricants 05 00029 g019
Table 1. Masses and rotational inertias of the turbocharger.
Mass/gInertia/kg mm²
Turbine and shaft11610.6
Compressor wheel366.4
Assembled rotor incl. seal rings and thrust washer16117.0
Table 2. Main dimensions of the bearing system.
ParameterValueUnit
Inner diameter/width7.9/4.7mm
Outer diameter/width13.8/8.3mm
Inner/outer clearance23/85µm
Number of thrust pads per side6-
Pad arrangement360°
Pad width2.35mm
Pad length (circumferential)5.70mm
Wedge height0.03mm
Wedge length (circumferential)4.25mm
Axial clearance80µm
Table 3. Turbochargers (TC) Speed and thrust load of the six measured operating points.
Operating PointTC Speed/1/minThrust Load/N
P197,000+1.5
P2115,500−0.2
P3136,200−3.5
P4156,500−12.2
P5175,700−10.6
P6195,000−42.0
Table 4. Compressor wheels (CW) and turbine wheels (TW) of same Center Housing and Rotating Assembly (CHRA) platform.
Short NameD2/mmm/gIxx/Iyy/kg mm2Izz/kg mm²
CW16053.568.2811.86
CW25541.265.367.67
CW3 (Base)5235.684.216.02
CW45031.003.334.77
CW54522.601.962.81
TW150140.5922.0621.91
TW2 (Base)4389.4210.3810.31
TW34071.987.237.18

