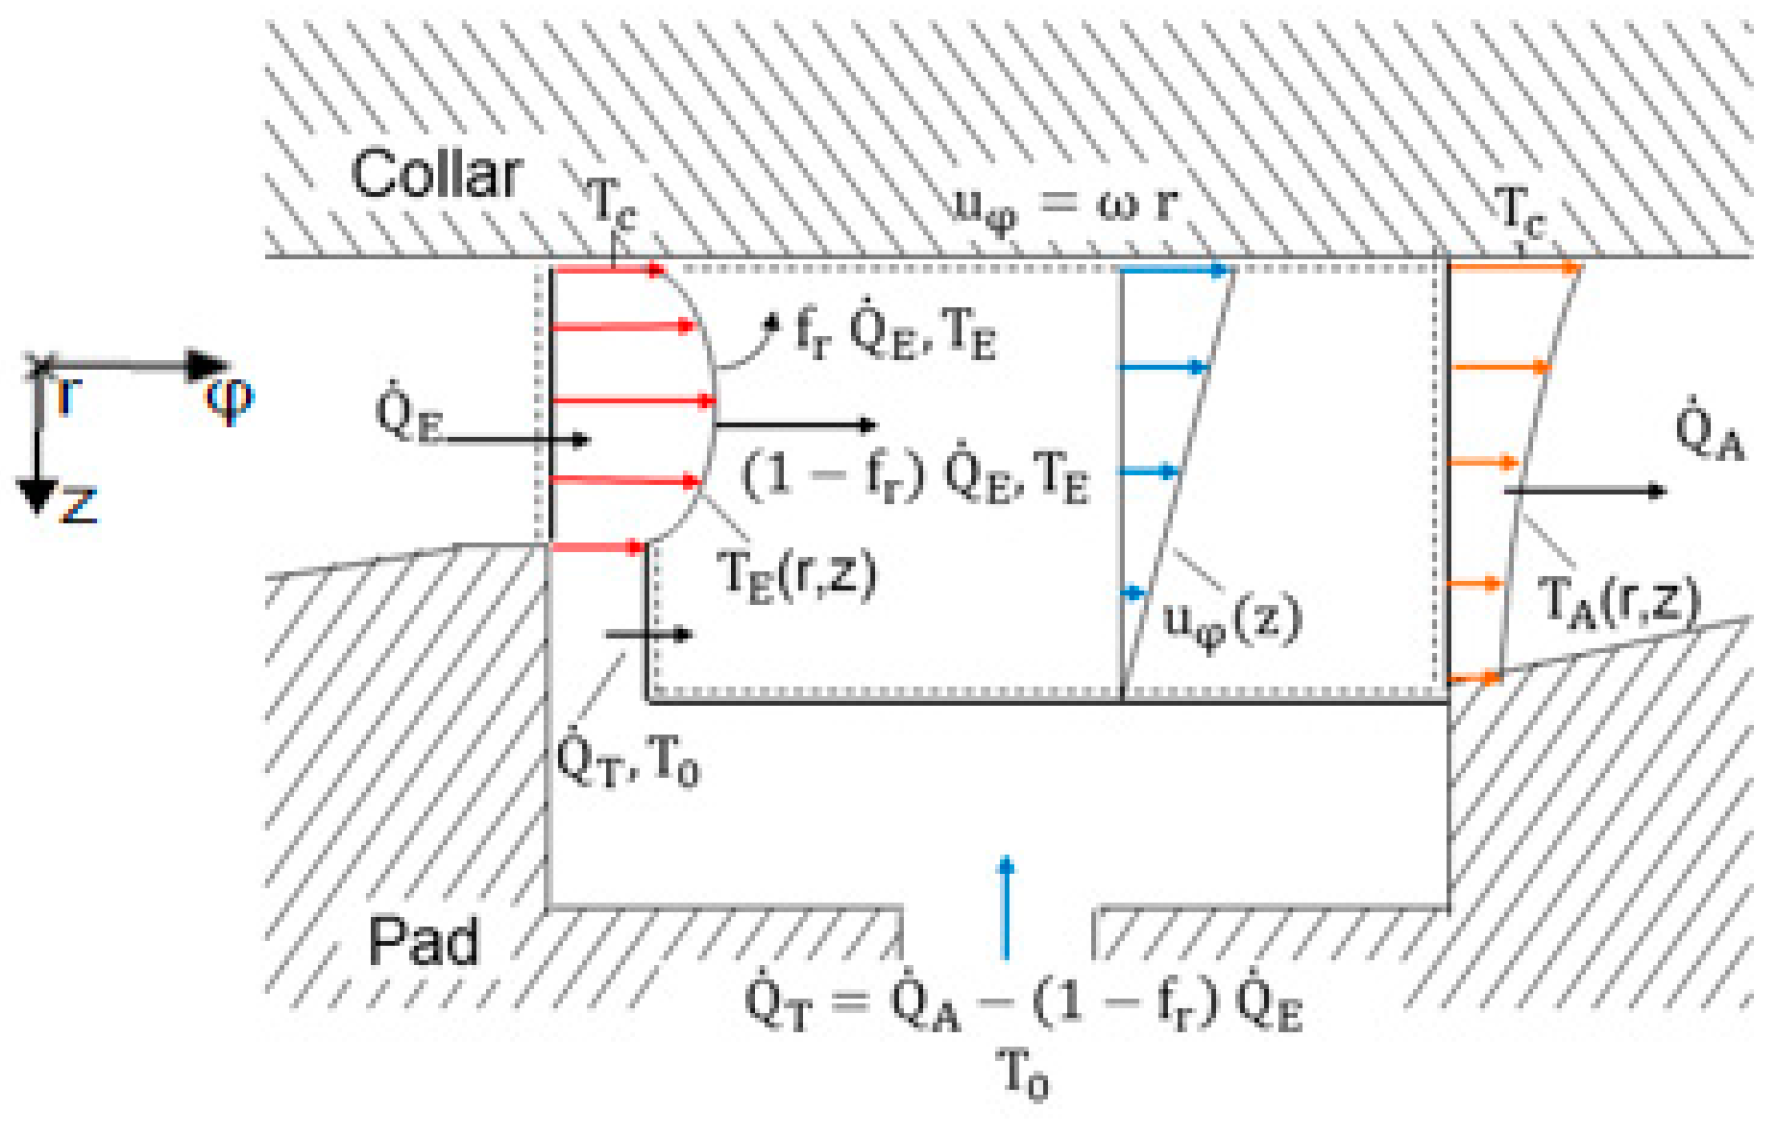
Figure 1.
Model of the oil mixing in the space between the pads.
Figure 1.
Model of the oil mixing in the space between the pads.
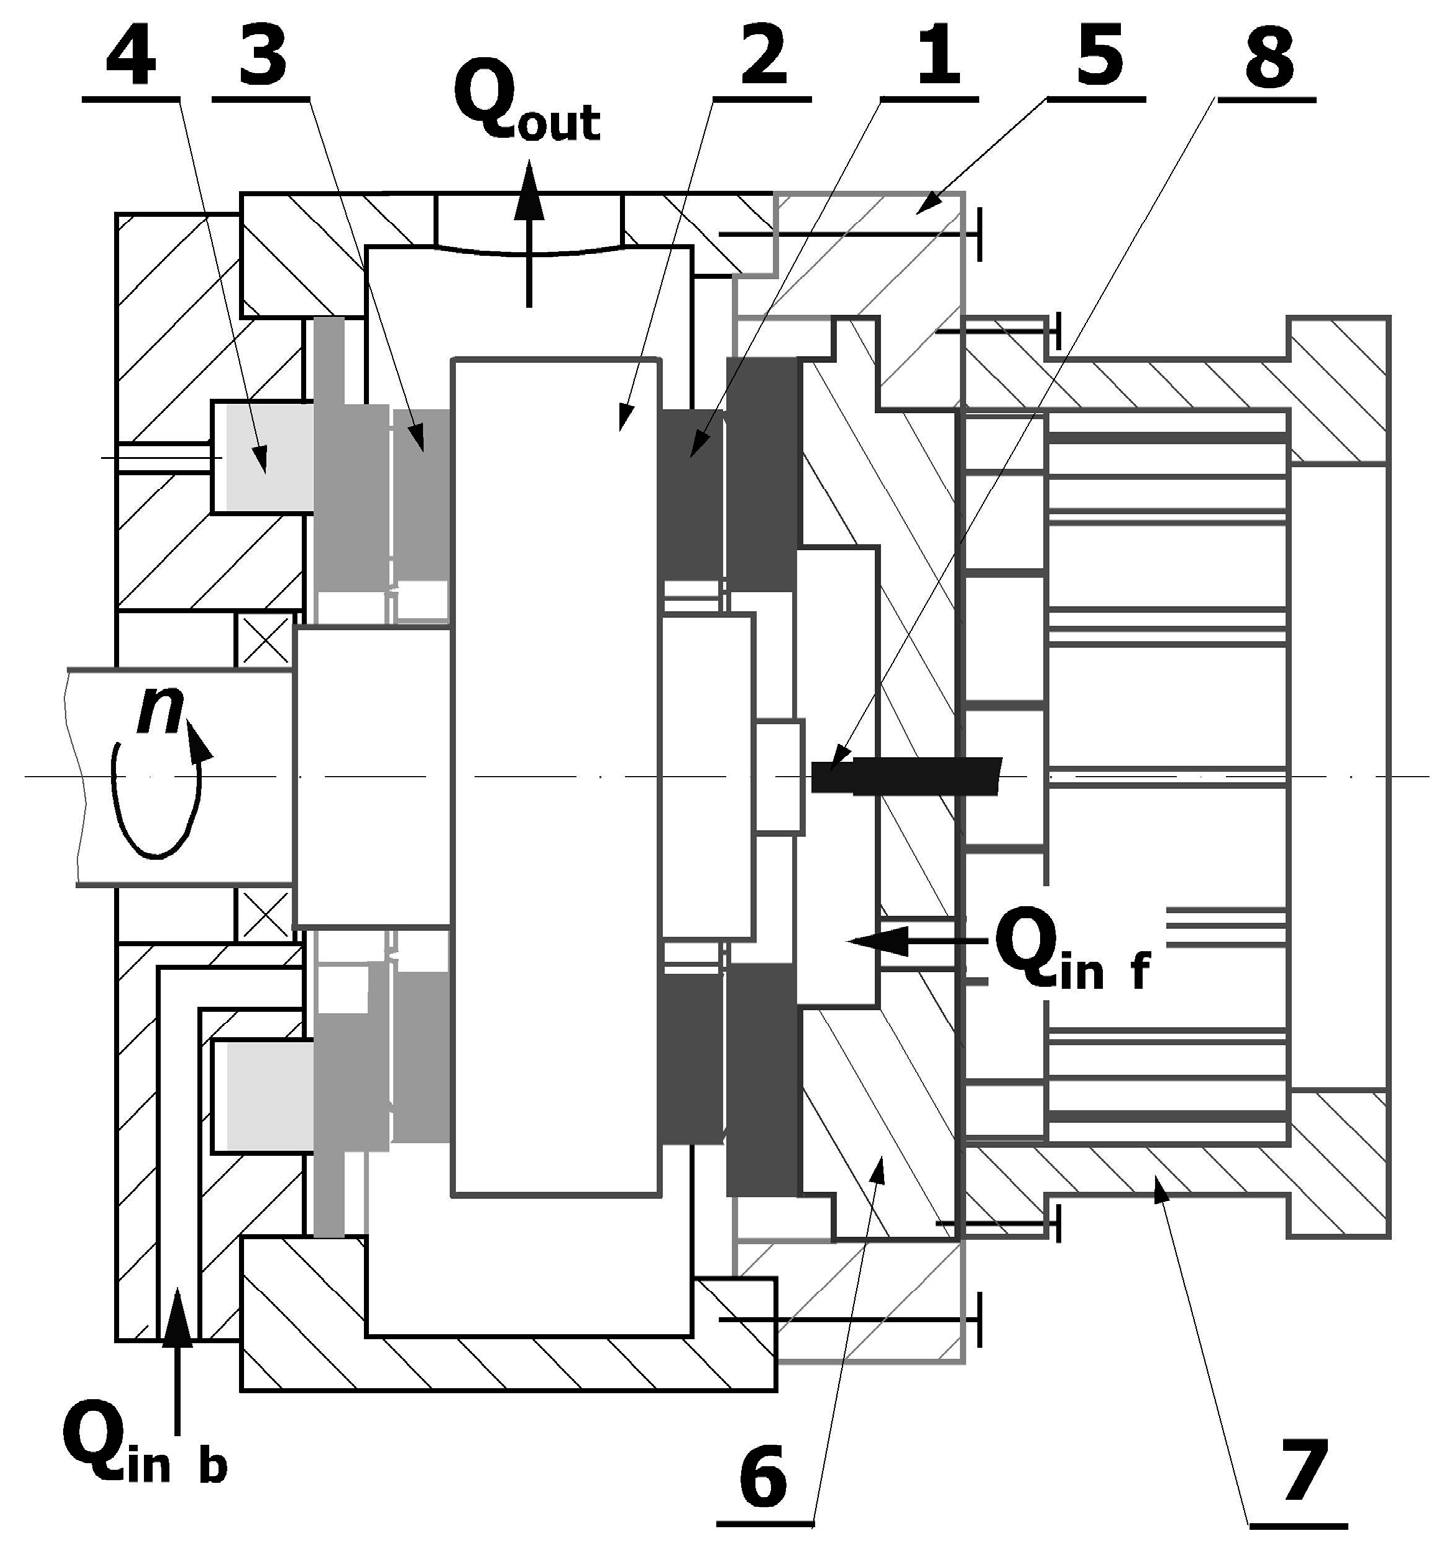
Figure 2.
Cross section of the bearing test rig: 1—front thrust bearing, 2—runner, 3—rear thrust bearing, 4—loading system, 5—bearing housing, 6—plate, 7—torque sensor, 8—proximity probe.
Figure 2.
Cross section of the bearing test rig: 1—front thrust bearing, 2—runner, 3—rear thrust bearing, 4—loading system, 5—bearing housing, 6—plate, 7—torque sensor, 8—proximity probe.
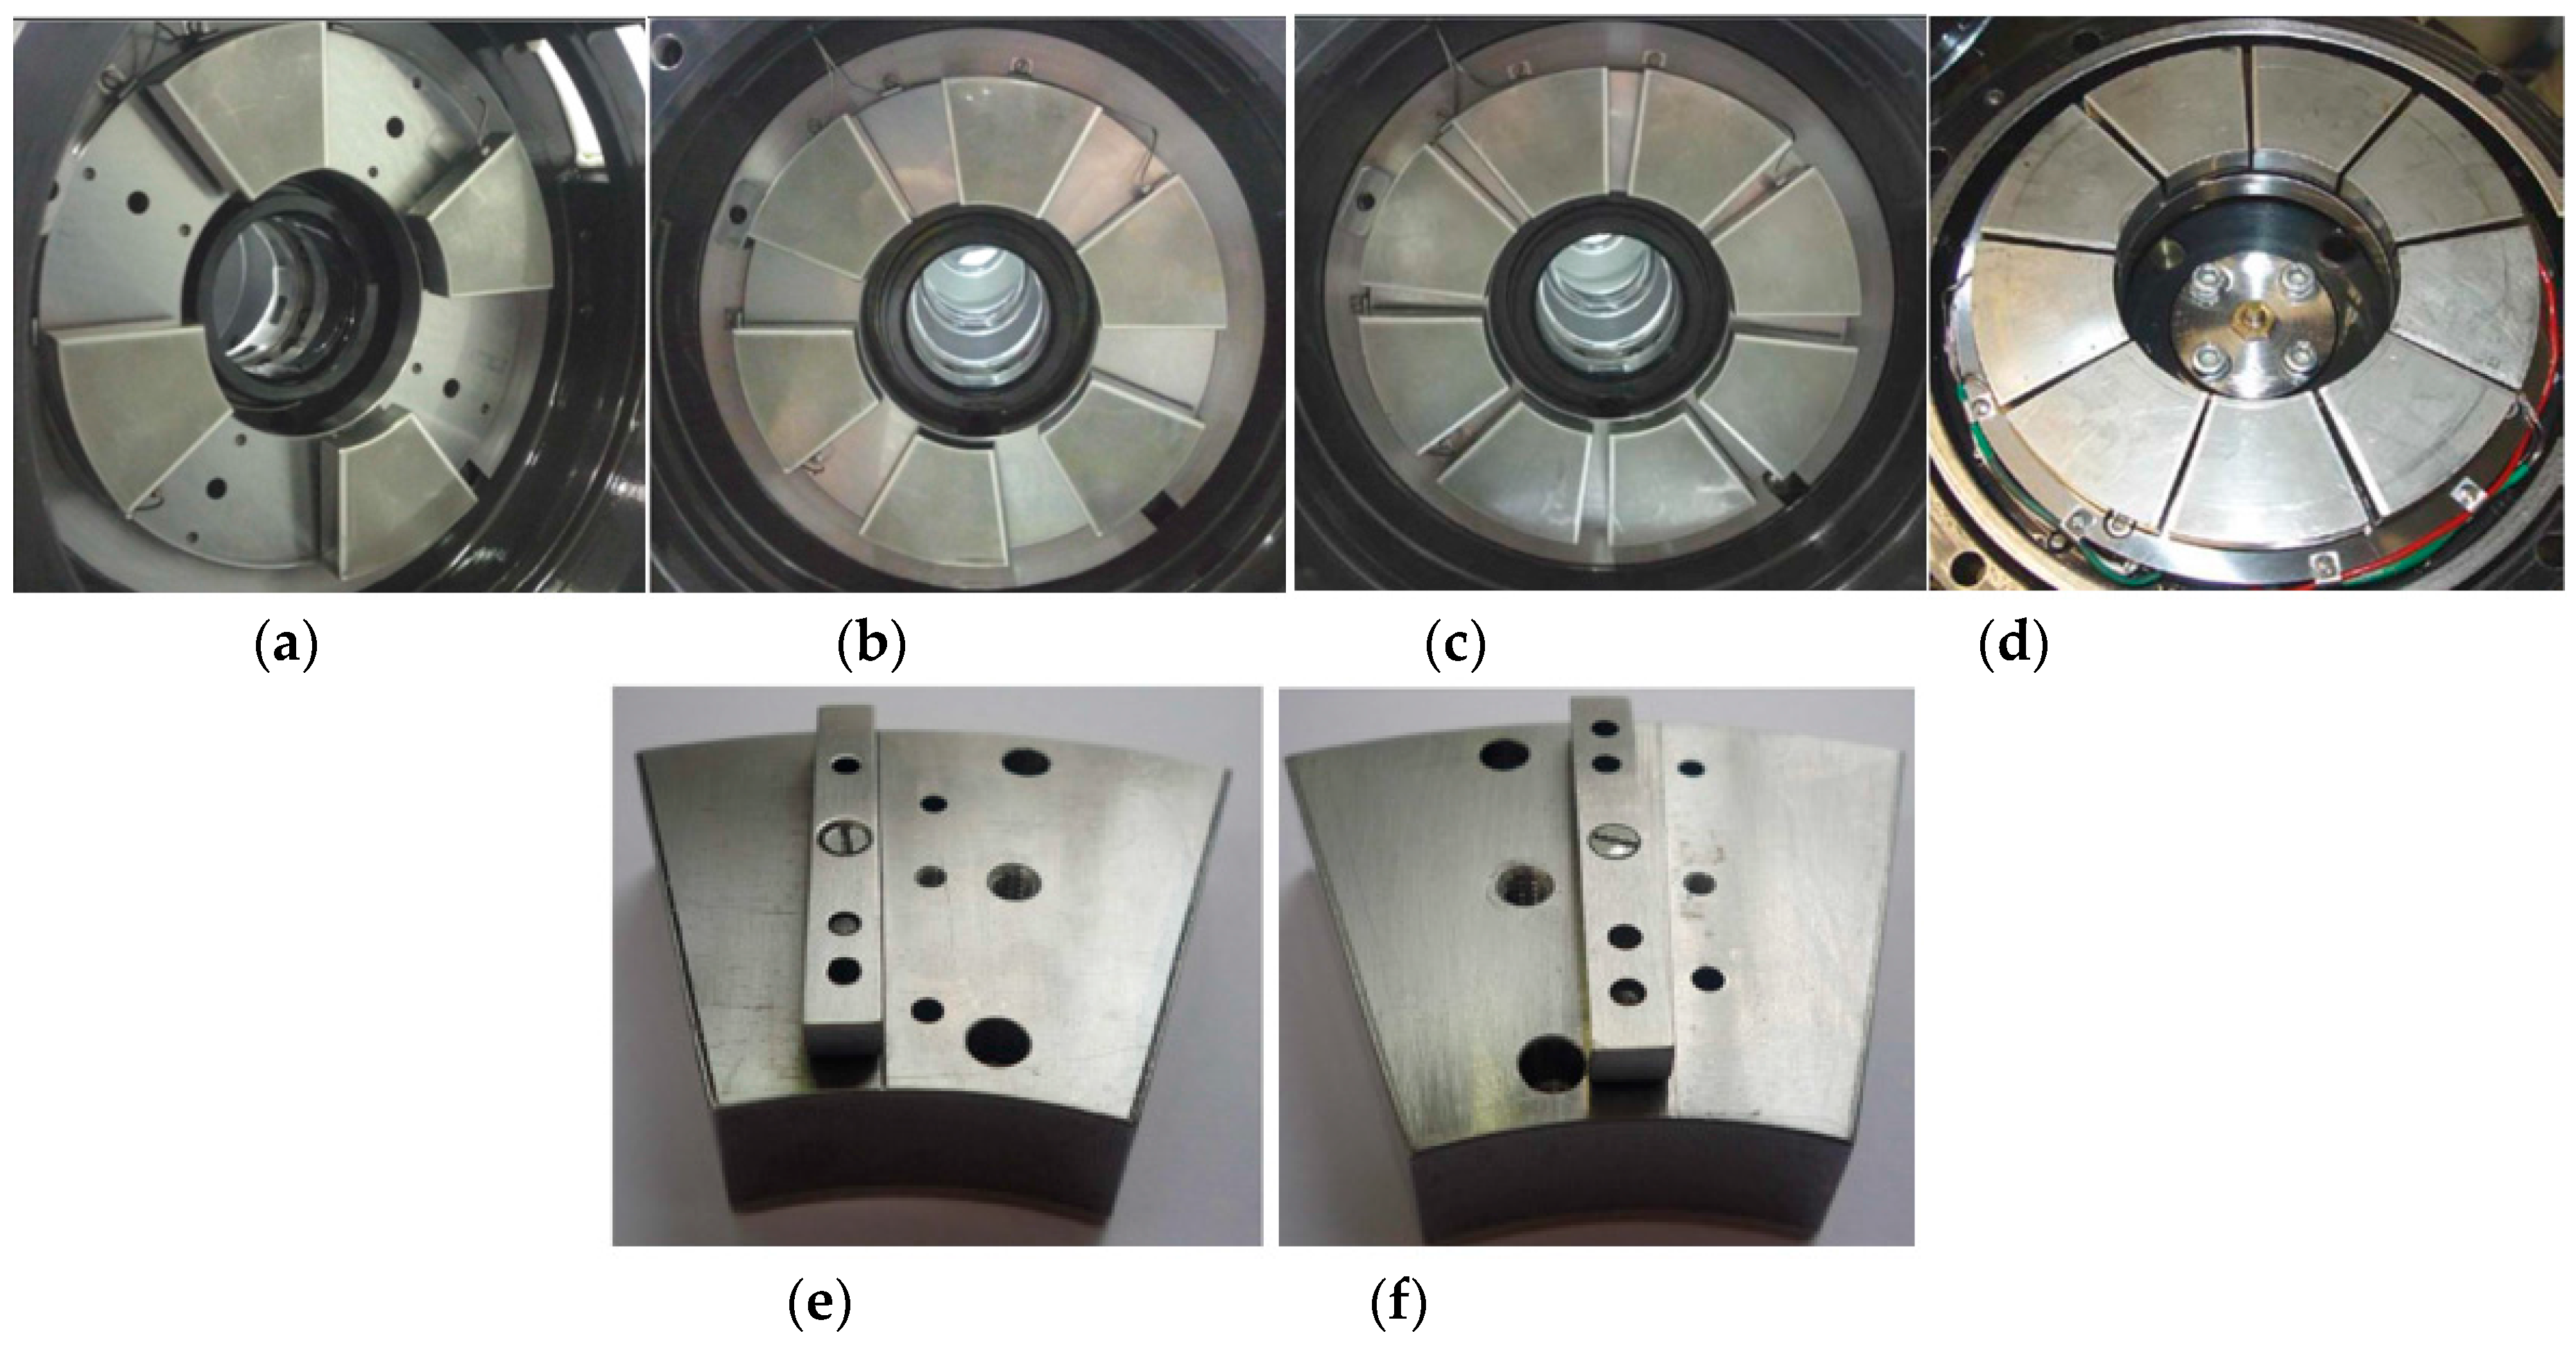
Figure 3.
Arrangement of pads at test rig,
Npad = 4/6/8/9 pads (
a–
d), supporting rib: offset support (
e), central support (
f) [
14].
Figure 3.
Arrangement of pads at test rig,
Npad = 4/6/8/9 pads (
a–
d), supporting rib: offset support (
e), central support (
f) [
14].
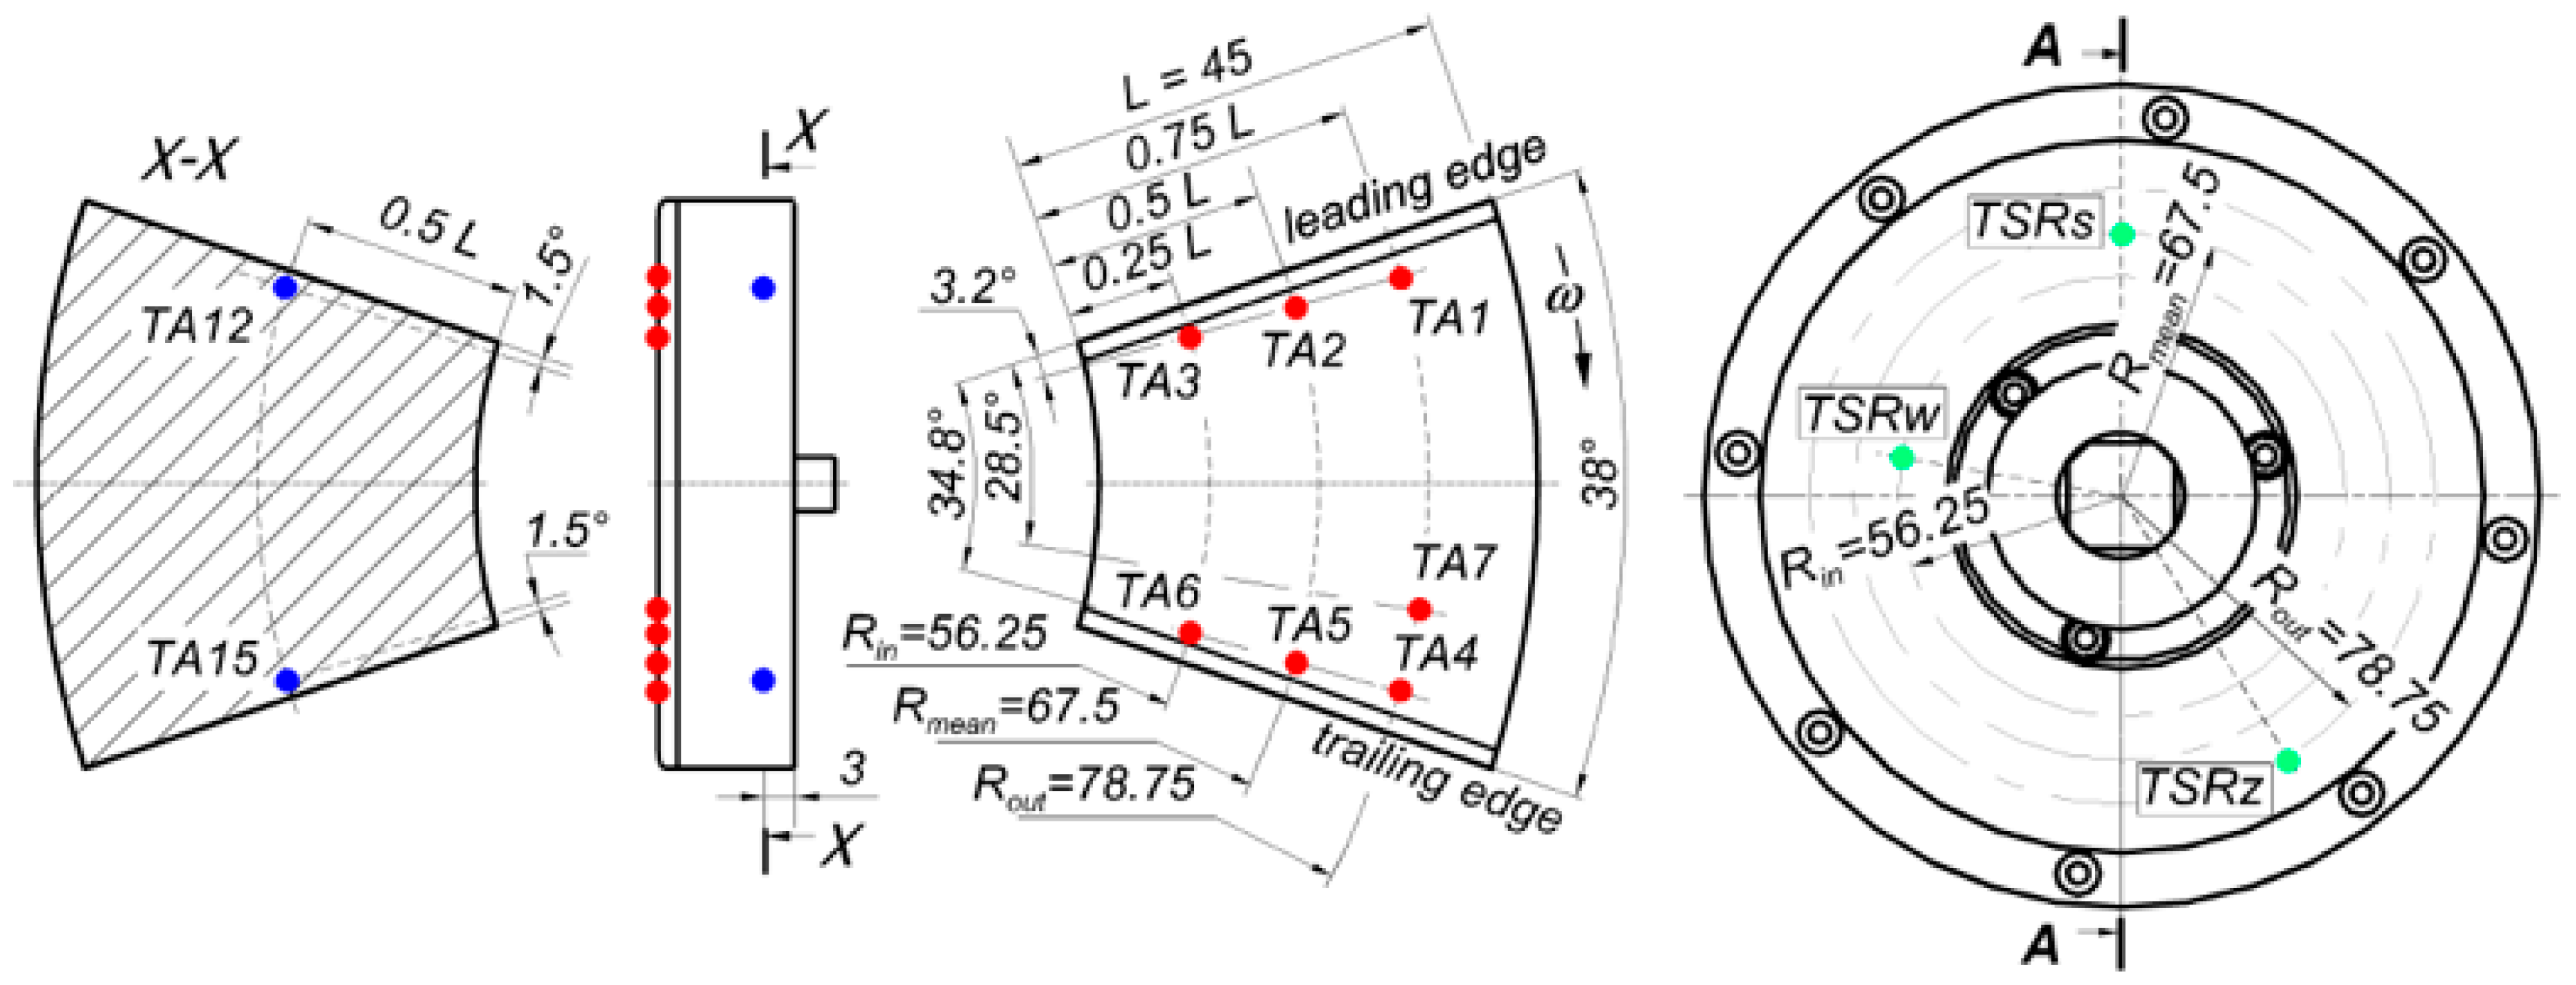
Figure 4.
Arrangement of pad and collar temperature sensors, pad (
left), collar (
right), [
14].
Figure 4.
Arrangement of pad and collar temperature sensors, pad (
left), collar (
right), [
14].
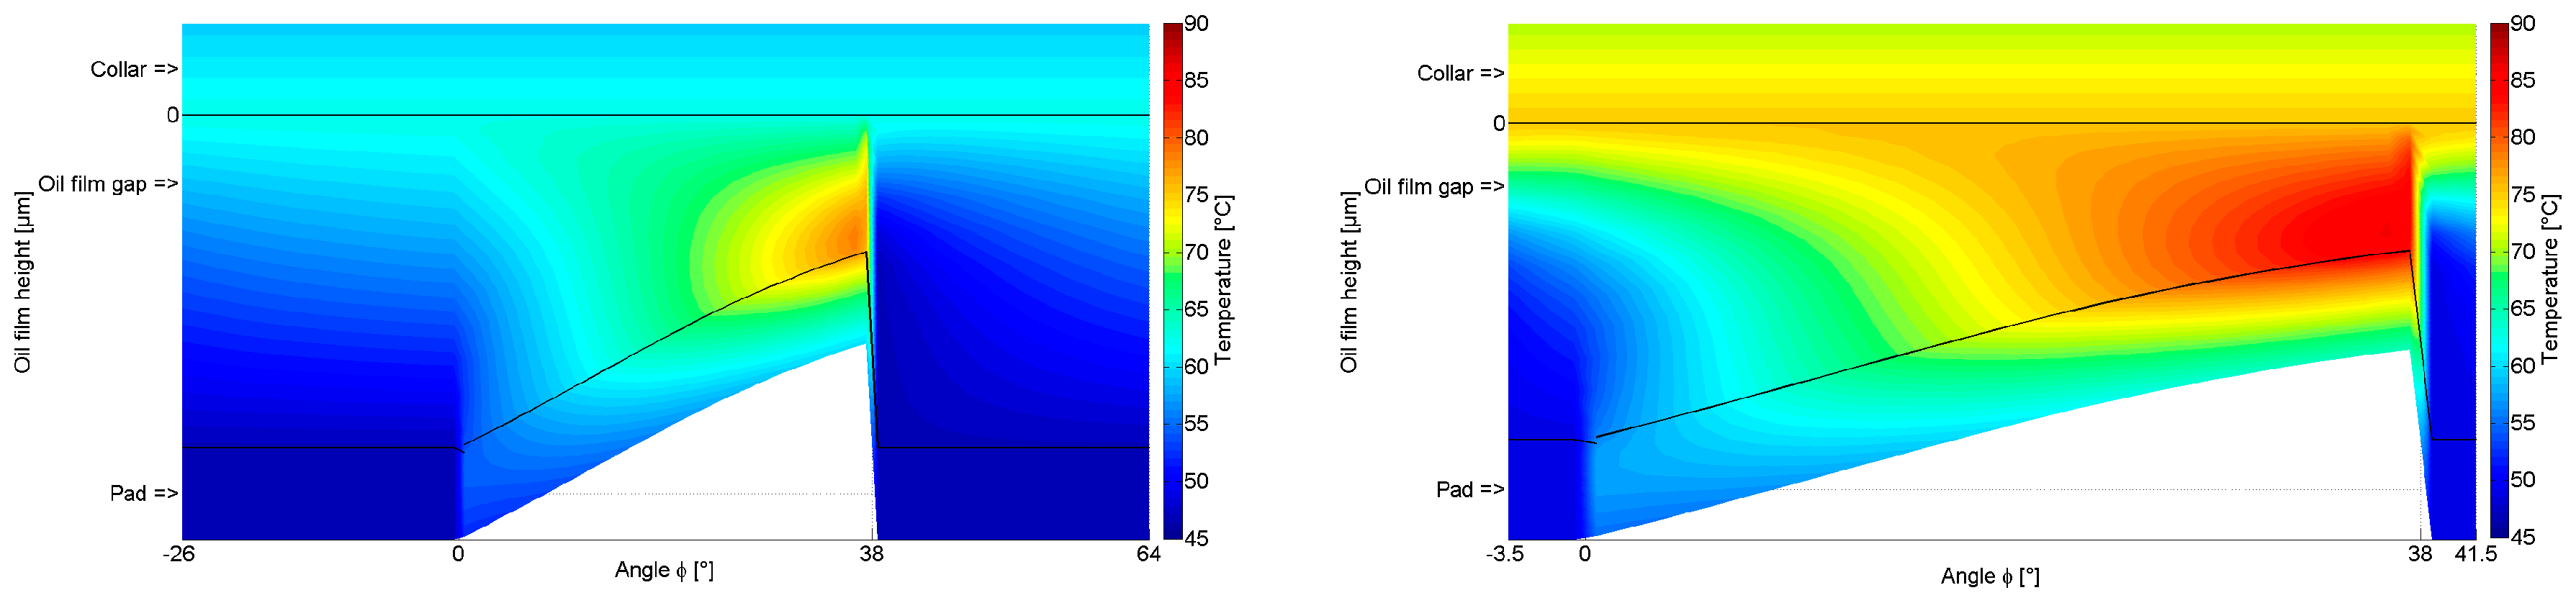
Figure 5.
Calculated temperature field at the mean diameter, offset pivot. Npad = 4 (left)/8 (right), rotational speed 4000 rpm, specific pressure 3 MPa, T0,4pads = 46.9 °C, T0,8pads = 48.7 °C.
Figure 5.
Calculated temperature field at the mean diameter, offset pivot. Npad = 4 (left)/8 (right), rotational speed 4000 rpm, specific pressure 3 MPa, T0,4pads = 46.9 °C, T0,8pads = 48.7 °C.
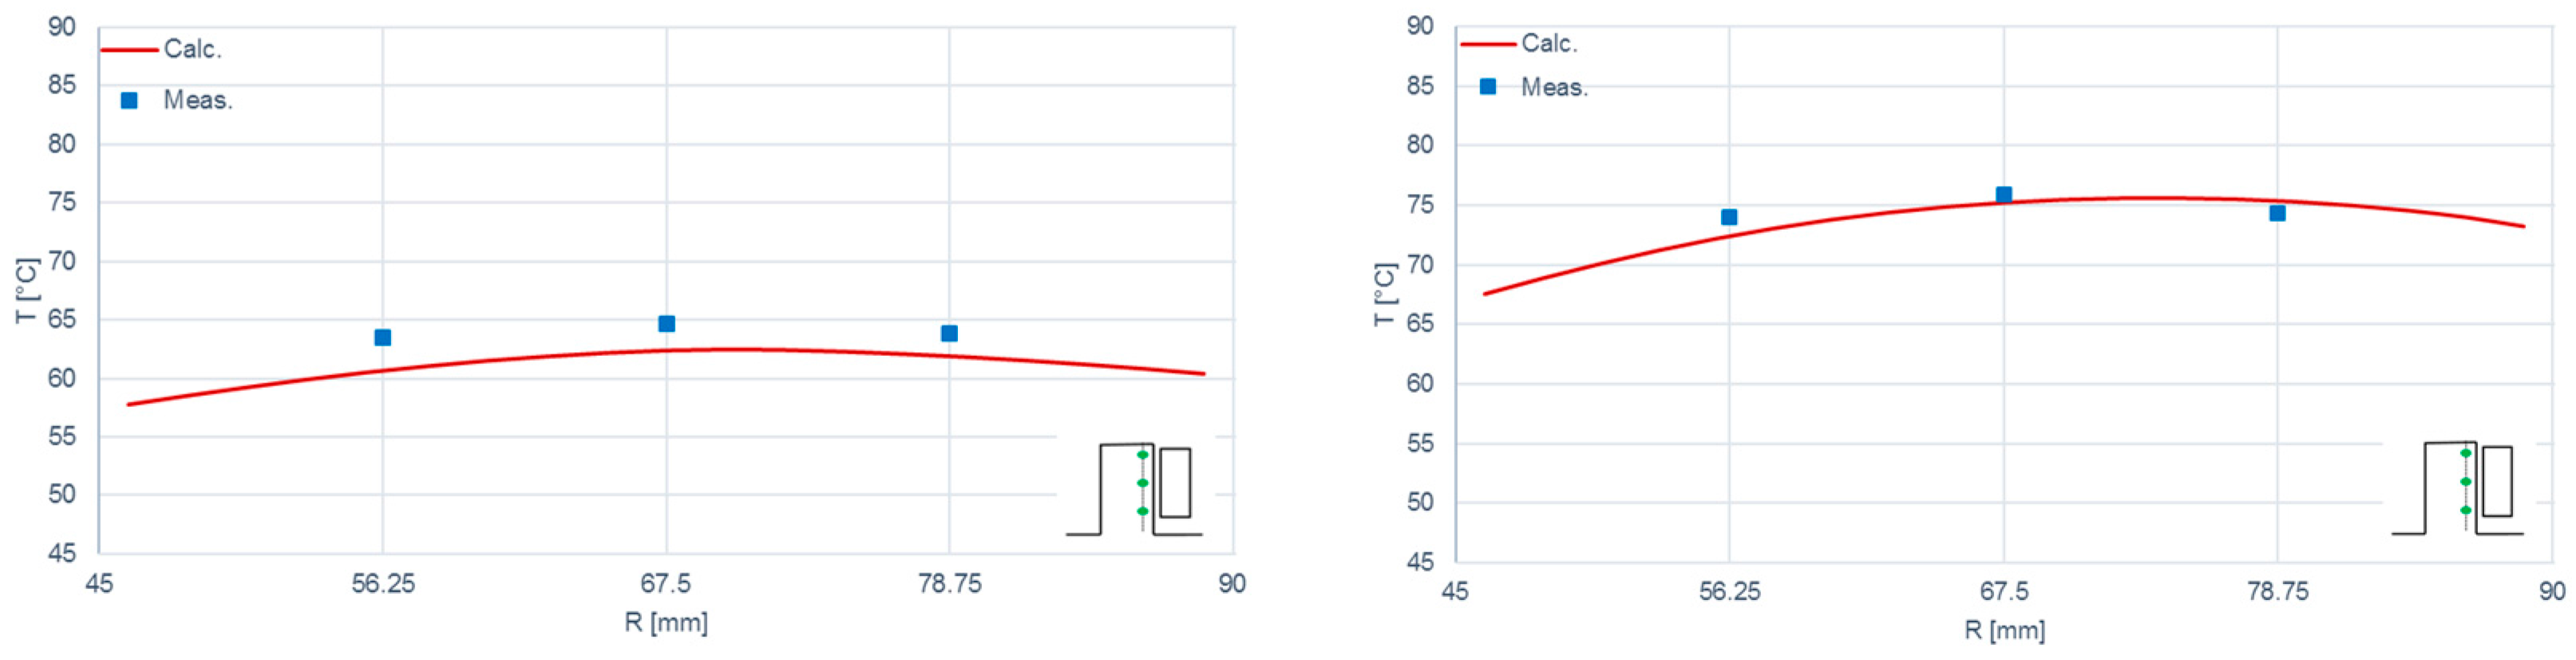
Figure 6.
Comparison of calculated and measured collar temperatures, offset pivot. Sensors: TSRw TSRs, TSRz, Npad = 4 (left)/8 (right), rotational speed 4000 rpm, specific pressure 3 MPa.
Figure 6.
Comparison of calculated and measured collar temperatures, offset pivot. Sensors: TSRw TSRs, TSRz, Npad = 4 (left)/8 (right), rotational speed 4000 rpm, specific pressure 3 MPa.
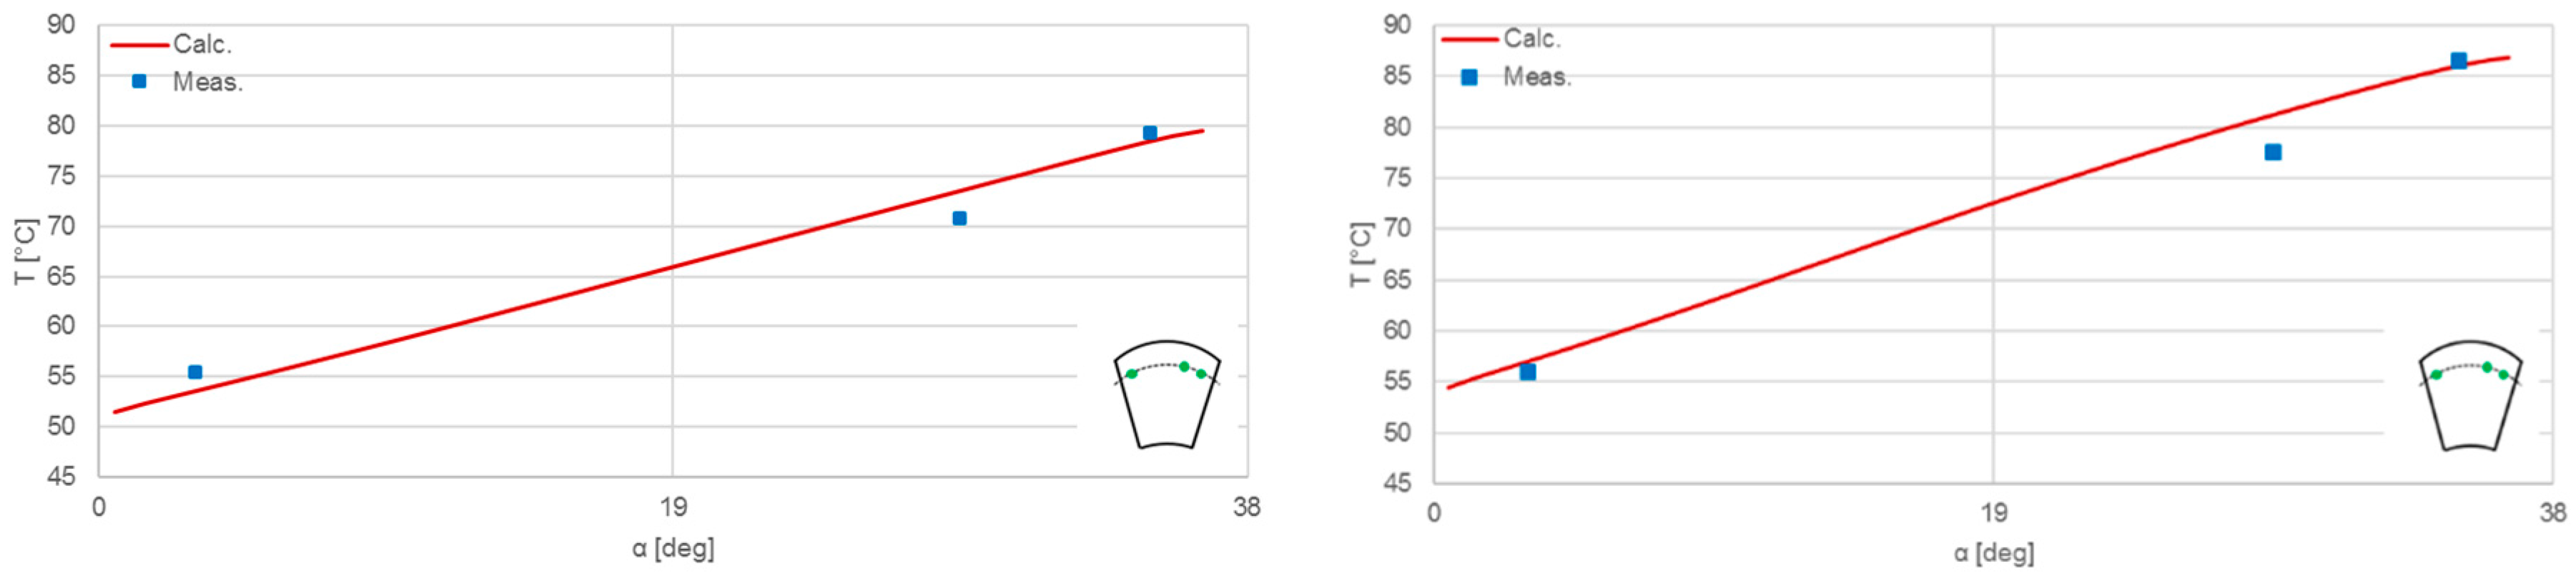
Figure 7.
Comparison of calculated and measured pad temperatures, offset pivot. Sensors: TA1, TA7, TA4, Npad = 4 (left)/8 (right), rotational speed 4000 rpm, specific pressure 3 MPa.
Figure 7.
Comparison of calculated and measured pad temperatures, offset pivot. Sensors: TA1, TA7, TA4, Npad = 4 (left)/8 (right), rotational speed 4000 rpm, specific pressure 3 MPa.
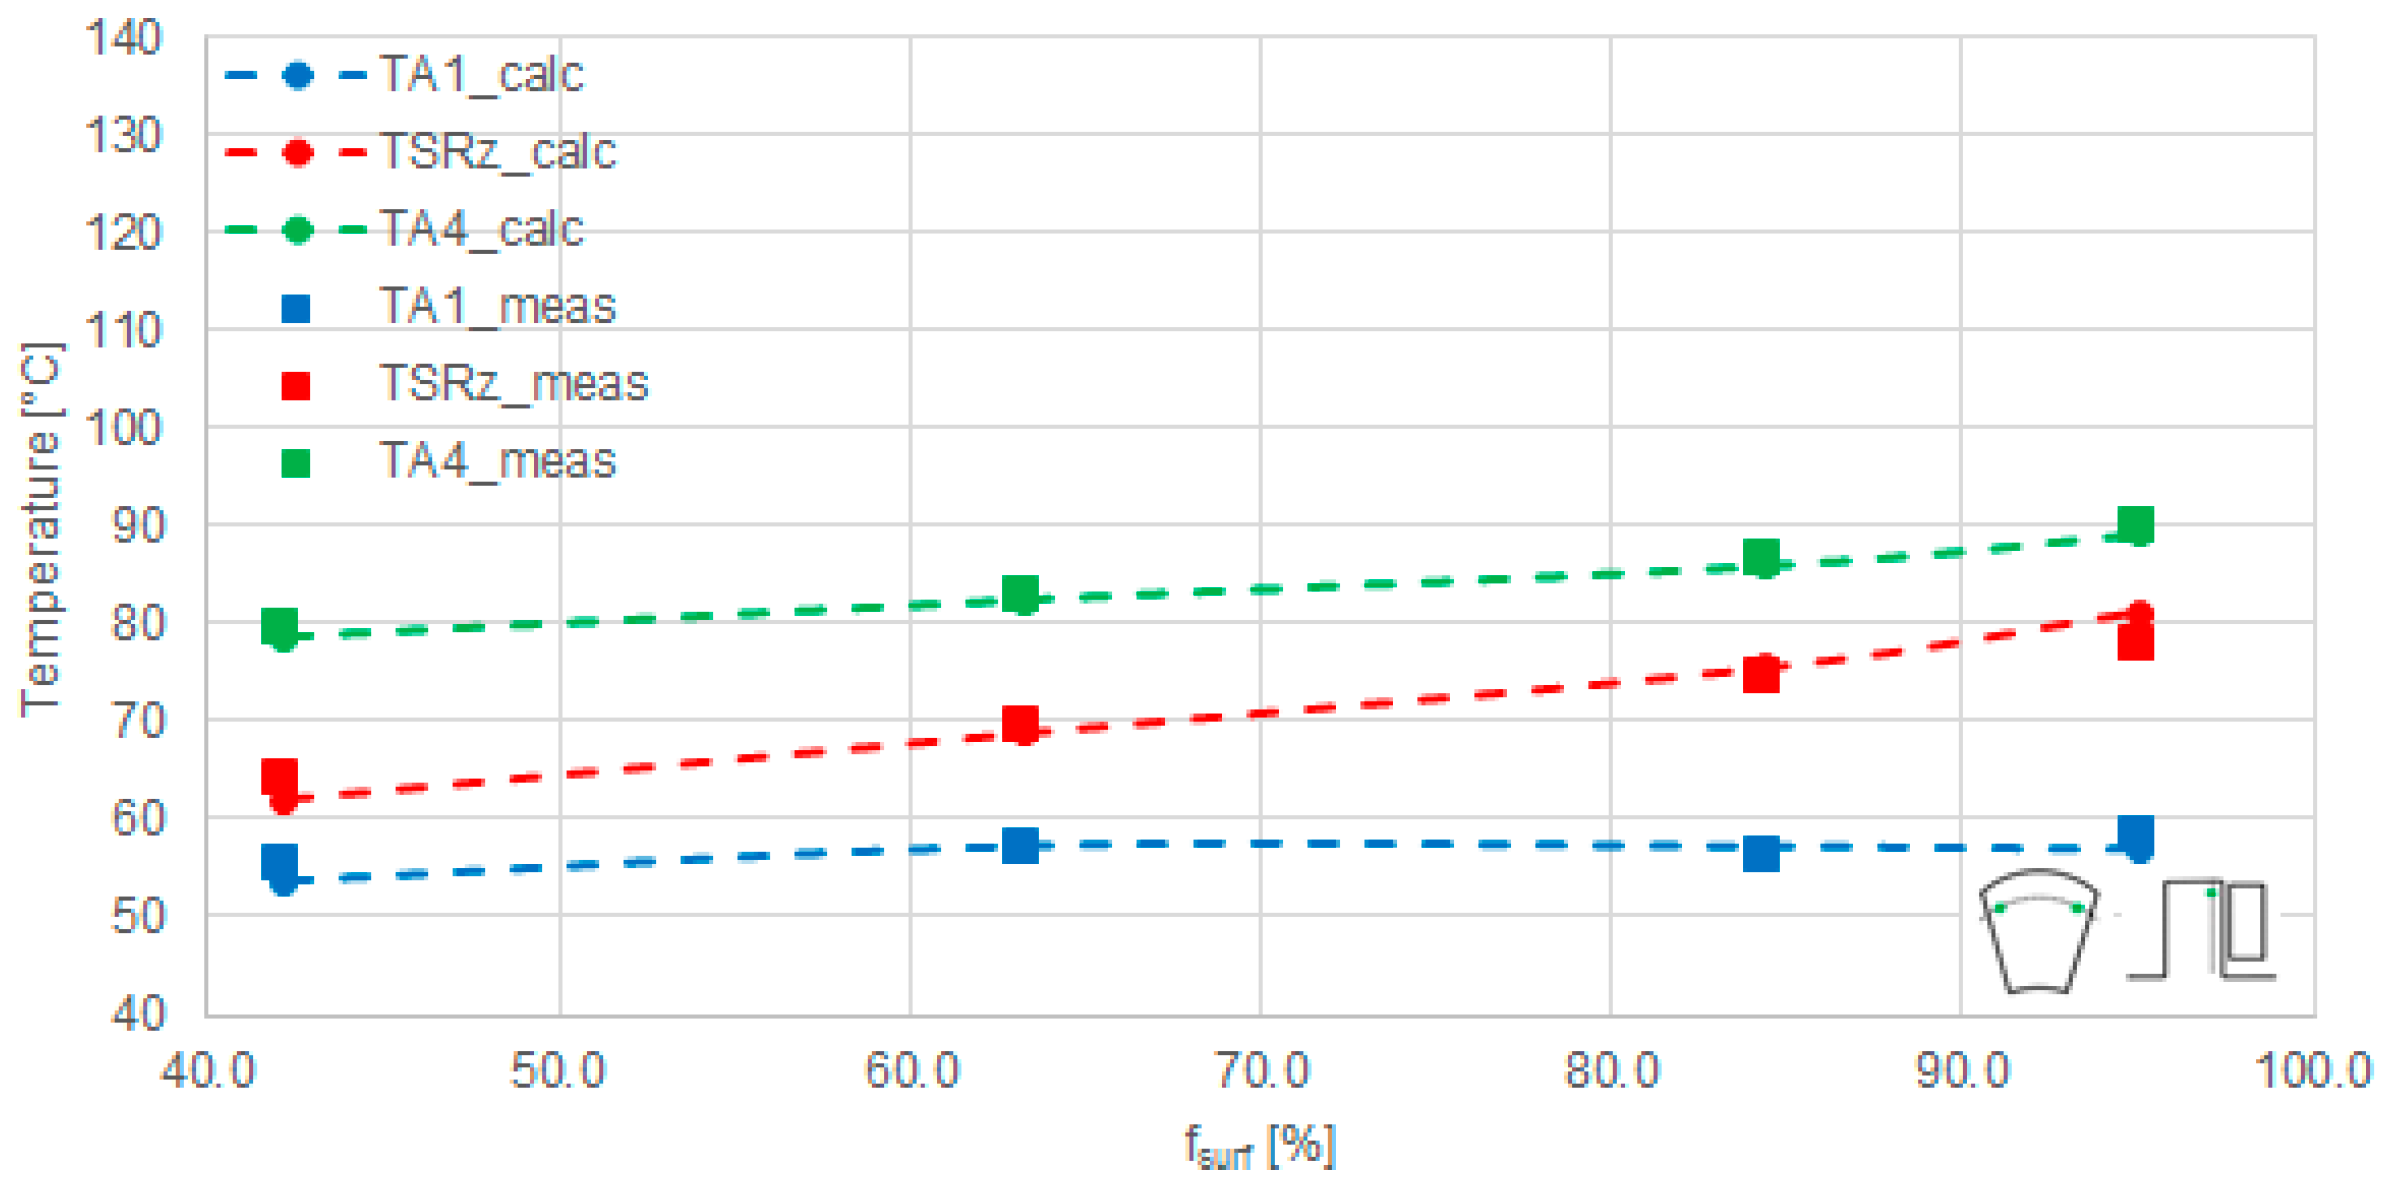
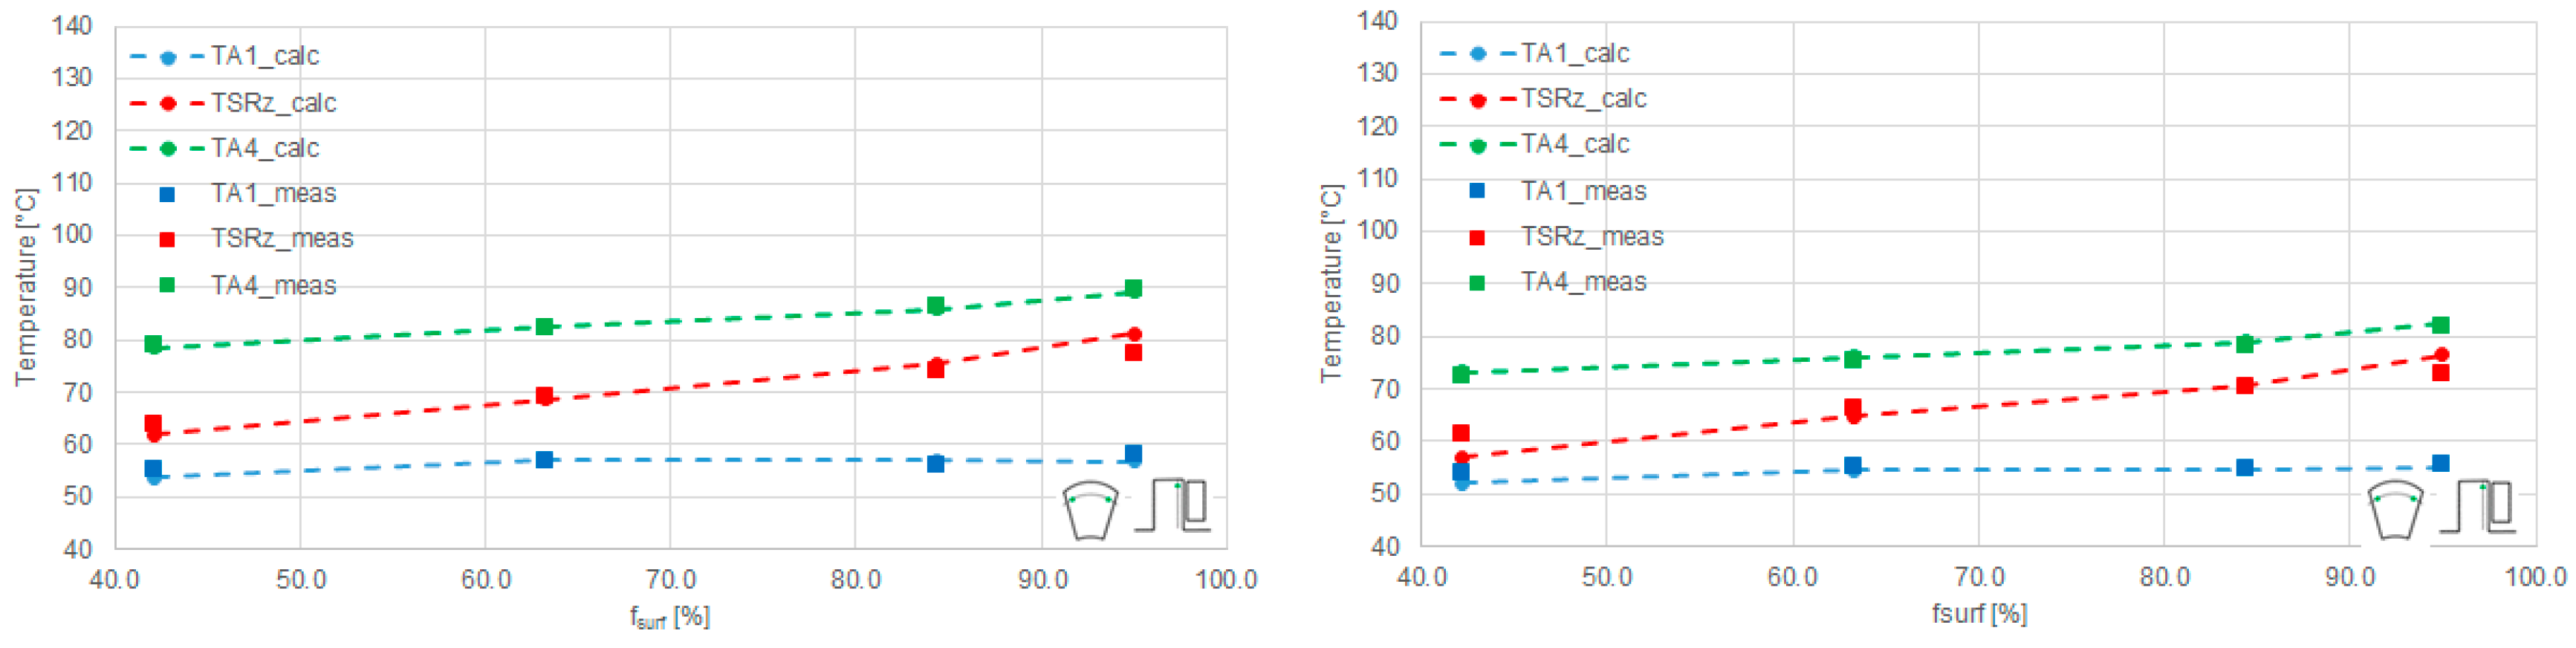
Figure 8.
Calculated and measured temperatures as a function of surface factor, offset pivot. Sensors: TA1, TSRz, TA4, Npad = 4/6/8/9, rotational speed 4000 rpm, specific pressure 3 MPa.
Figure 8.
Calculated and measured temperatures as a function of surface factor, offset pivot. Sensors: TA1, TSRz, TA4, Npad = 4/6/8/9, rotational speed 4000 rpm, specific pressure 3 MPa.
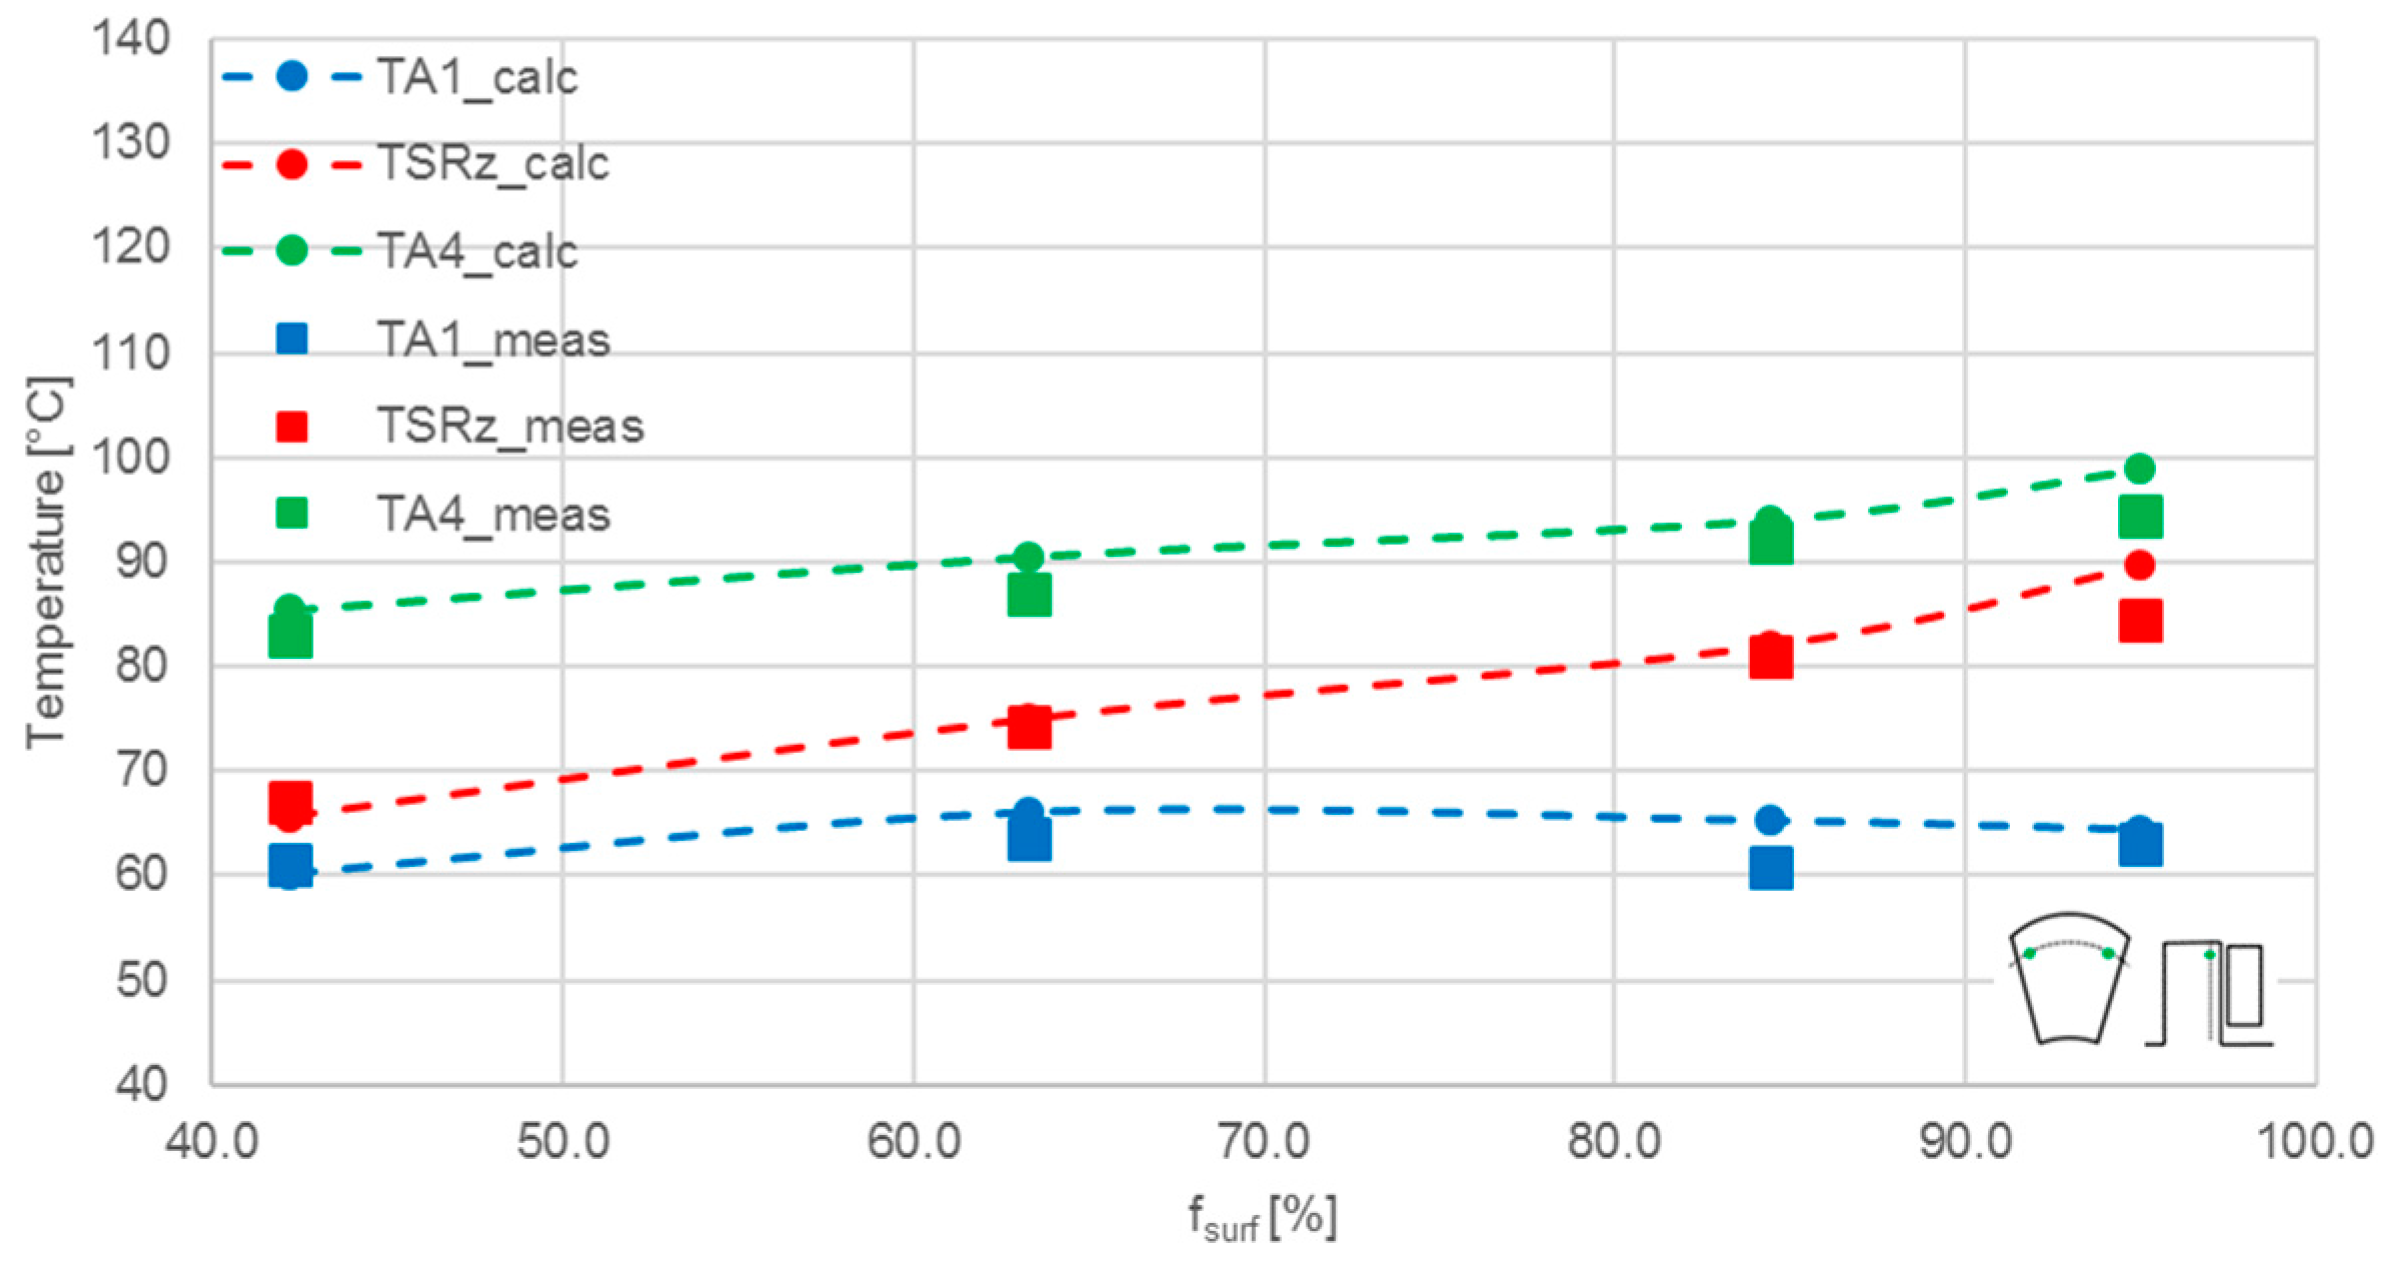
Figure 9.
Calculated and measured temperatures as a function of surface factor, central pivot. Sensors: TA1, TSRz, TA4, Npad = 4/6/8/9, rotational speed 4000 rpm, specific pressure 3 MPa.
Figure 9.
Calculated and measured temperatures as a function of surface factor, central pivot. Sensors: TA1, TSRz, TA4, Npad = 4/6/8/9, rotational speed 4000 rpm, specific pressure 3 MPa.
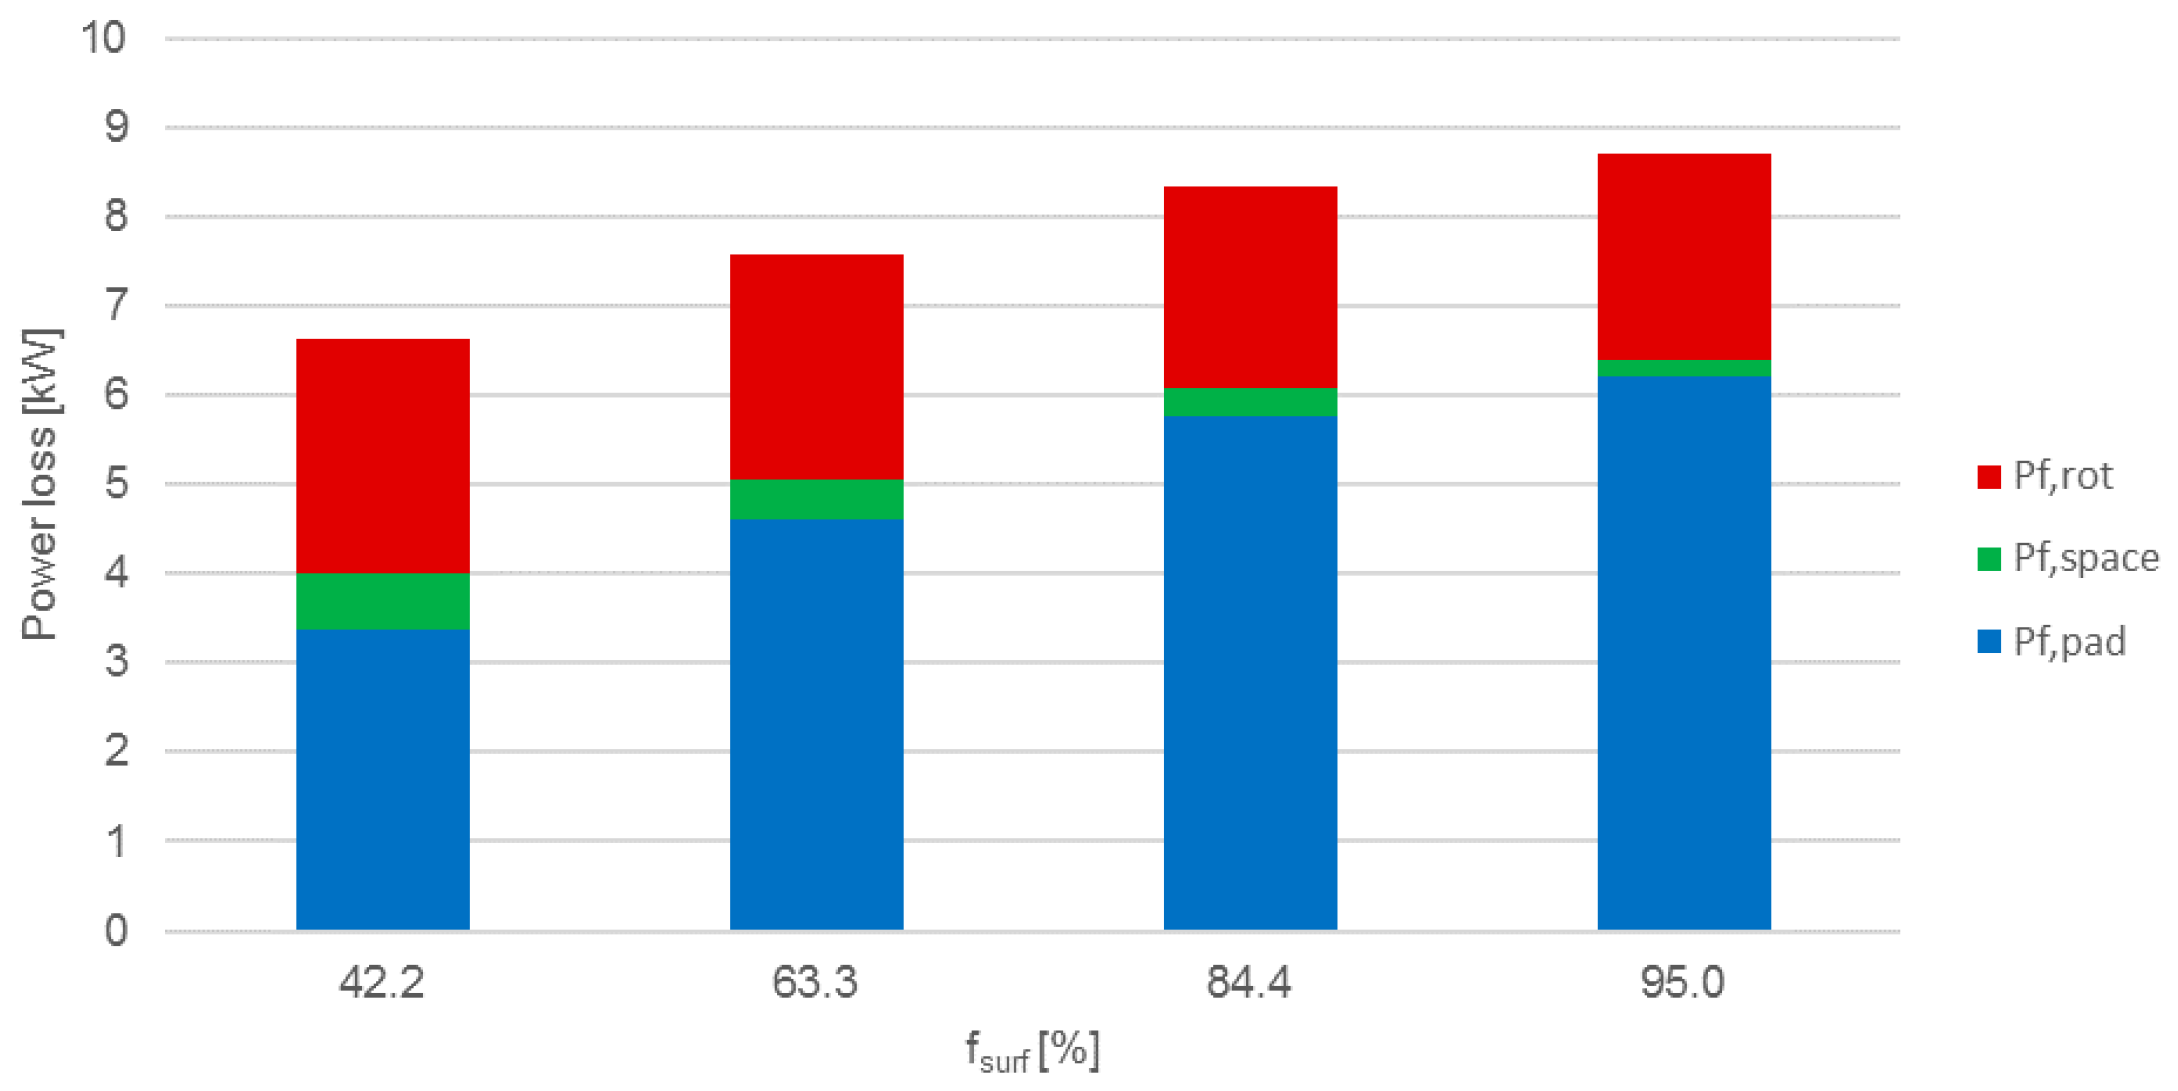
Figure 10.
Power losses as a function of surface factor, offset pivot. Npad = 4/6/8/9, rotational speed 4000 rpm, specific pressure 3 MPa.
Figure 10.
Power losses as a function of surface factor, offset pivot. Npad = 4/6/8/9, rotational speed 4000 rpm, specific pressure 3 MPa.
Figure 11.
Power losses as a function of surface factor, central pivot. Npad = 4/6/8/9, rotational speed 4000 rpm, specific pressure 3 MPa.
Figure 11.
Power losses as a function of surface factor, central pivot. Npad = 4/6/8/9, rotational speed 4000 rpm, specific pressure 3 MPa.
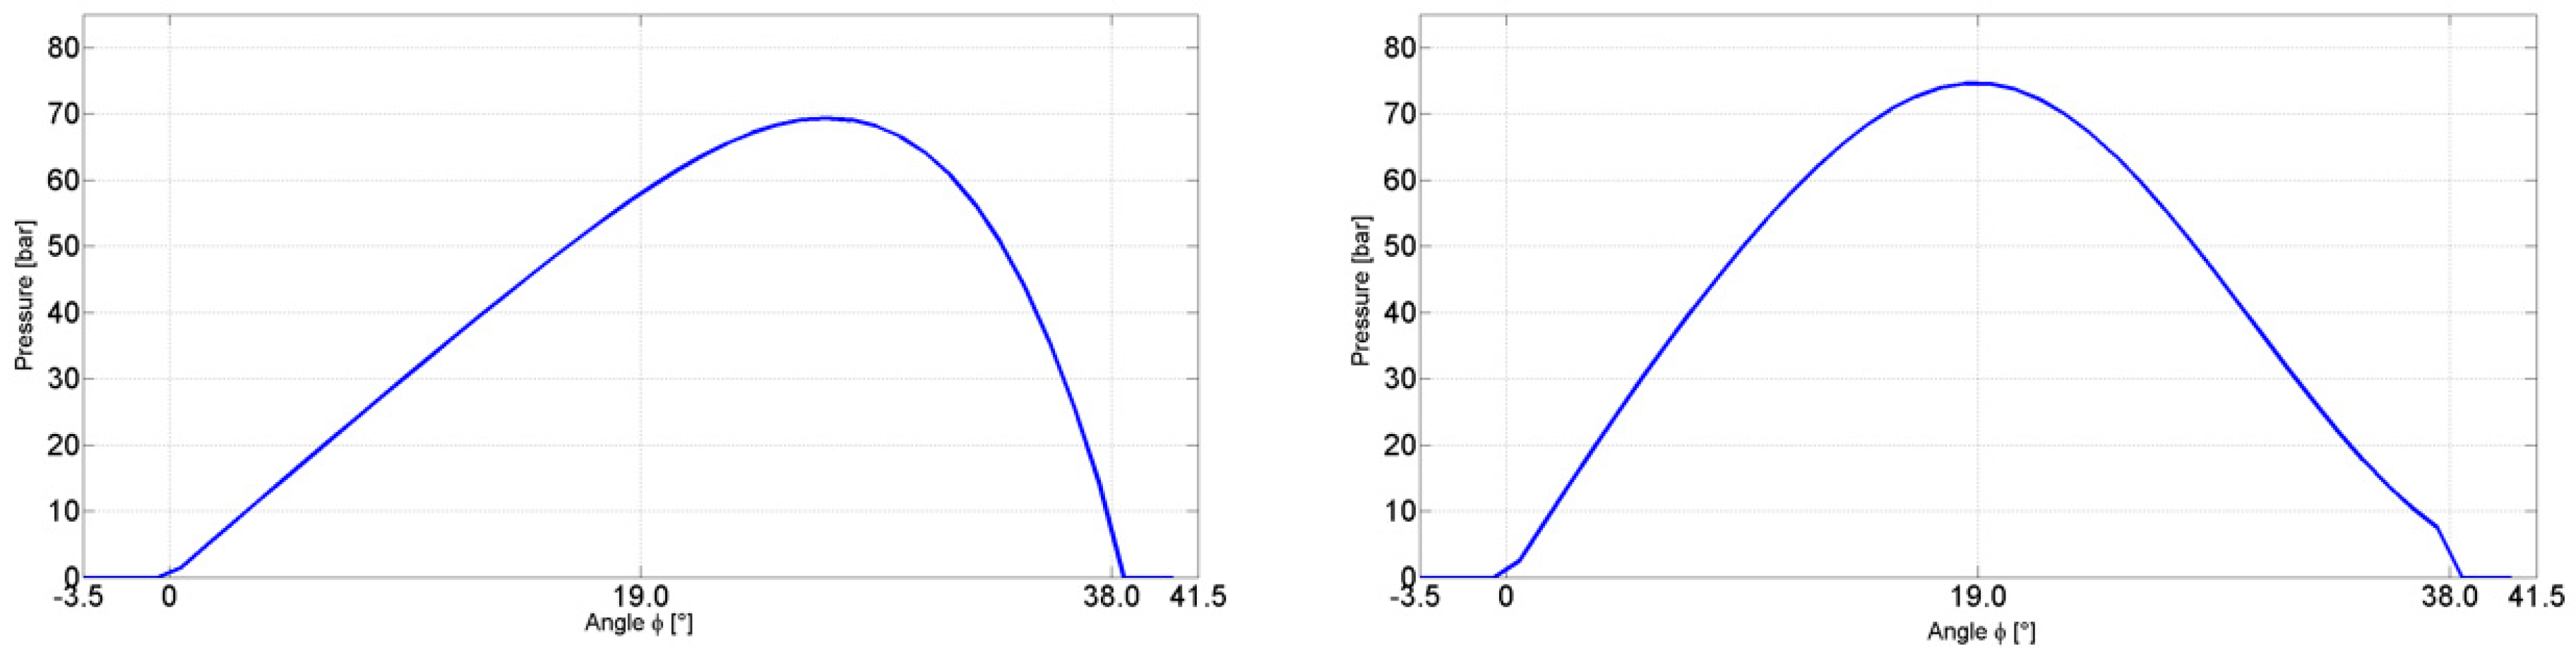
Figure 12.
Calculated oil film pressure at mean radius, pivot: offset (left), central (right). Npad = 8, rotational speed 4000 rpm, specific pressure 3 MPa.
Figure 12.
Calculated oil film pressure at mean radius, pivot: offset (left), central (right). Npad = 8, rotational speed 4000 rpm, specific pressure 3 MPa.
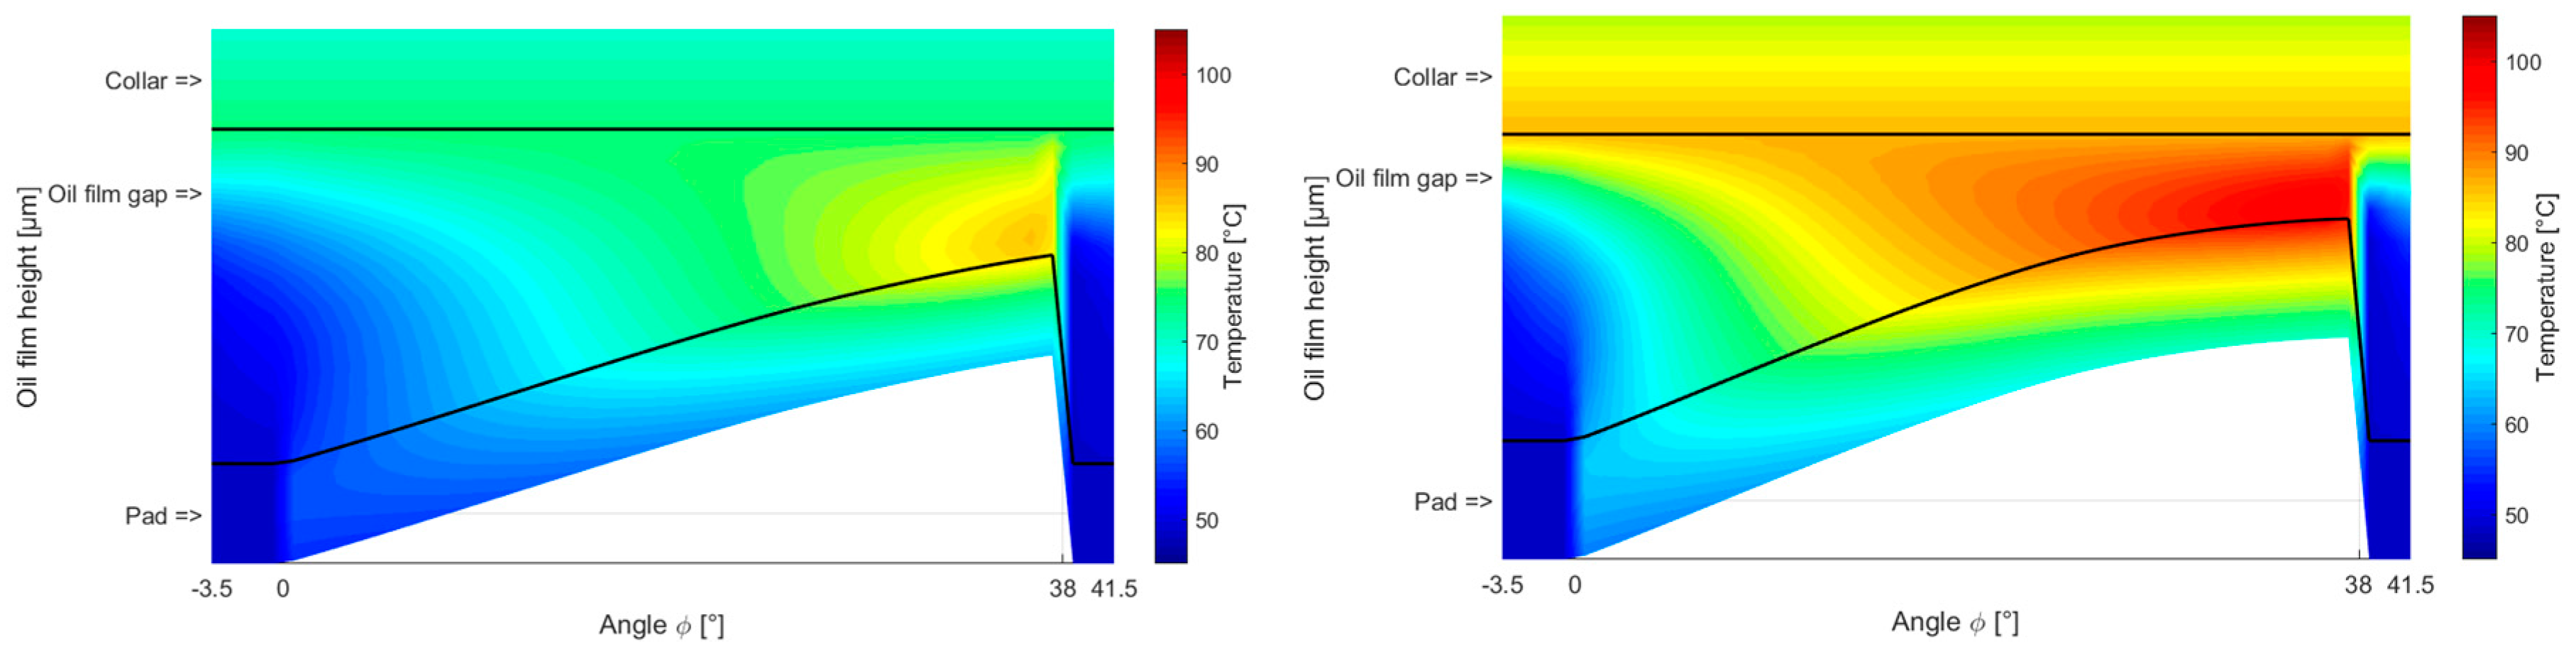
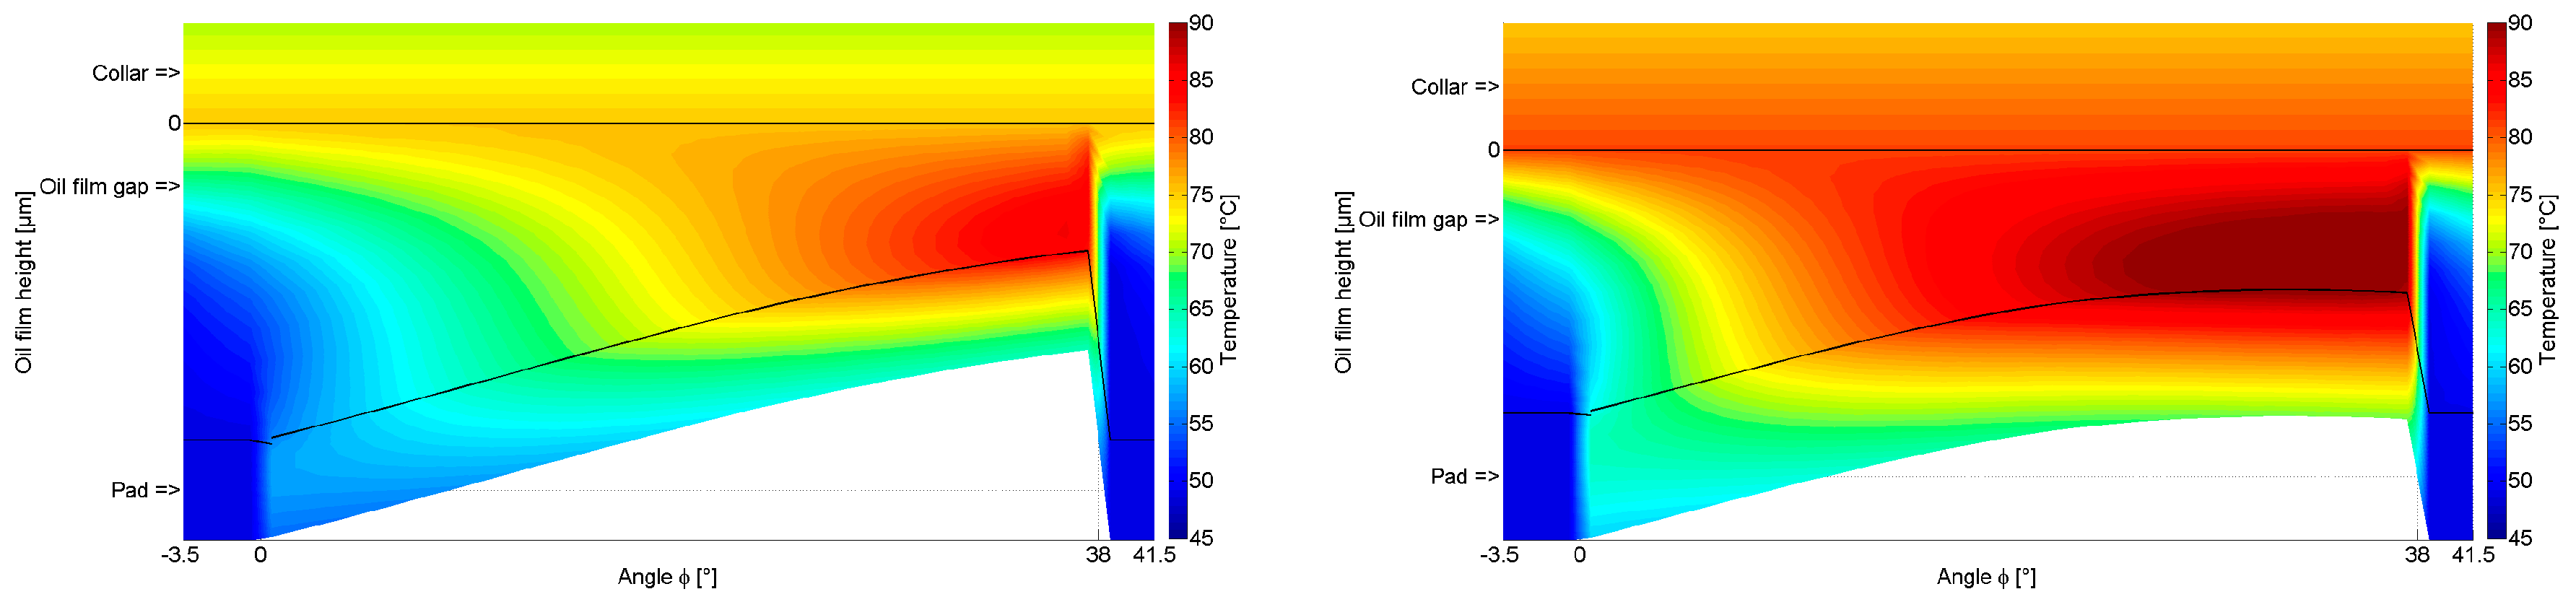
Figure 13.
Calculated temperature fields at mean diameter, pivot: offset (left), central (right). Npad = 8, rotational speed 4000 rpm, specific pressure 3 MPa, T0,offset = 48.7 °C, T0,central = 49.1 °C.
Figure 13.
Calculated temperature fields at mean diameter, pivot: offset (left), central (right). Npad = 8, rotational speed 4000 rpm, specific pressure 3 MPa, T0,offset = 48.7 °C, T0,central = 49.1 °C.
Figure 14.
Calculated oil film inlet/outlet gap and temperature fields, pivot: offset (a/b), central (c/d).
Figure 14.
Calculated oil film inlet/outlet gap and temperature fields, pivot: offset (a/b), central (c/d).
Figure 15.
Calculated and measured temperatures as a function of surface factor, offset pivot. Sensors: TA1, TSRz, TA4, Npad = 4/6/8/9, rotational speed 4000 (left)/2000 (right) rpm, specific pressure 3 MPa.
Figure 15.
Calculated and measured temperatures as a function of surface factor, offset pivot. Sensors: TA1, TSRz, TA4, Npad = 4/6/8/9, rotational speed 4000 (left)/2000 (right) rpm, specific pressure 3 MPa.
Figure 16.
Calculated and measured temperatures as a function of surface factor, offset pivot. Sensors: TA1, TSRz, TA4, Npad = 4/6/8/9, rotational speed 4000 rpm, specific pressure 3 (left)/2 (right) MPa.
Figure 16.
Calculated and measured temperatures as a function of surface factor, offset pivot. Sensors: TA1, TSRz, TA4, Npad = 4/6/8/9, rotational speed 4000 rpm, specific pressure 3 (left)/2 (right) MPa.
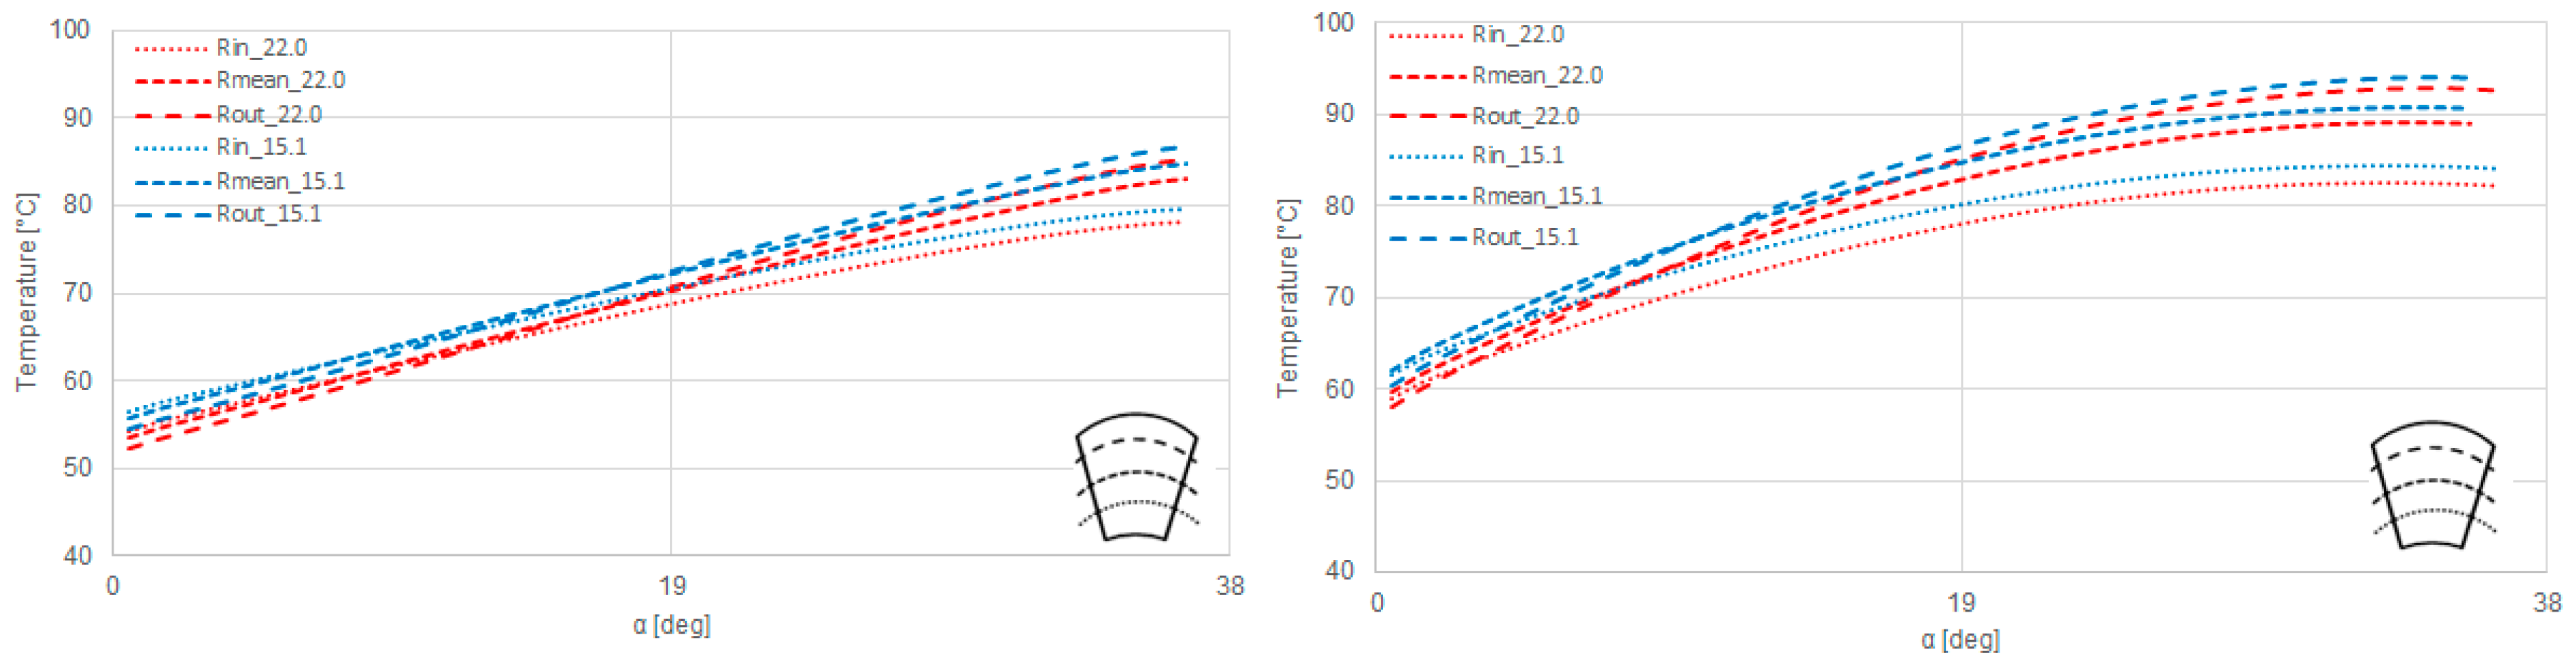
Figure 17.
Influence of the oil flow on calculated pad temperatures, Offset pivot (left), central pivot (right). Npad = 8, rotational speed 4000 rpm, mean pressure 3 MPa.
Figure 17.
Influence of the oil flow on calculated pad temperatures, Offset pivot (left), central pivot (right). Npad = 8, rotational speed 4000 rpm, mean pressure 3 MPa.
Figure 18.
Calculated temperature fields at mean diameter, pivot: offset. Npad = 8, rotational speed 4000 rpm, specific pressure 3 (left)/6 MPa (right).
Figure 18.
Calculated temperature fields at mean diameter, pivot: offset. Npad = 8, rotational speed 4000 rpm, specific pressure 3 (left)/6 MPa (right).
Table 1.
Geometry and operating data [
14].
Table 1.
Geometry and operating data [
14].
| Parameter | Value |
|---|
| Outer/mean/inner diameter | 180/135/90 mm |
| Pad angle, αpad | 38° |
| Number of pads, Npad | 4/6/8/9 |
| Angular pivot position | 0.6 (offset)/0.5 (central) |
| Body pad-/Total pad thickness | 14/18.2 mm |
| Collar thickness | 50 mm |
| Specific pressure | 2/3 MPa |
| Rotational speed | 2000/3000/4000 rpm |
| Oil grade | ISO VG 32 |
| Oil inlet temperature | 40 °C |
| Oil flow rate, Qin | 15.1/22.0 L/min |
Table 2.
Fresh oil replacing factor.
Table 2.
Fresh oil replacing factor.
| Npad | fsurf | Pivot | Tin (°C) | Tout (°C) | T0 (°C) | fr |
|---|
| 4 | 0.422 | offset | 40.0 | 53.8 | 46.9 | 0.600 |
| 6 | 0.633 | offset | 40.0 | 55.8 | 47.9 | 0.520 |
| 8 | 0.844 | offset | 40.0 | 57.4 | 48.7 | 0.440 |
| 9 | 0.950 | offset | 40.3 | 59.2 | 49.8 | 0.400 |
| 4 | 0.422 | central | 40.0 | 54.4 | 47.2 | 0.800 |
| 6 | 0.633 | central | 40.0 | 56.4 | 48.2 | 0.720 |
| 8 | 0.844 | central | 40.0 | 58.1 | 49.1 | 0.640 |
| 9 | 0.950 | central | 40.5 | 59.5 | 50.0 | 0.600 |
Table 3.
Heat convection coefficient at the pad surfaces for calculation.
Table 3.
Heat convection coefficient at the pad surfaces for calculation.
| Surface Side | Heat Convection Coefficient (W/m2/K) |
|---|
| Leading | 350 |
| Trailing | 175 |
| Outer radius | 175 |
| Inner radius | 175 |
| Bottom | 3500 |
Table 4.
Heat convection coefficient at the collar surfaces for calculation.
Table 4.
Heat convection coefficient at the collar surfaces for calculation.
| Surface Side | Heat Convection Coefficient (W/m2/K) |
|---|
| Middle | 10 |
| Outer radius | 1000 |
| Inner radius | 1000 |
Table 5.
Calculated power losses and heat flows: rotational speed 4000 rpm, specific pressure 3 MPa.
Table 5.
Calculated power losses and heat flows: rotational speed 4000 rpm, specific pressure 3 MPa.
| Power | 4 Pads Offset | 8 Pads Offset |
|---|
| Pf,pad (kW) | 2.881 | 5.209 |
| Pf,space (kW) | 0.628 | 0.328 |
| Heat flow into pads (kW) | 0.287 (8.2%) | 0.698 (12.6%) |
| Heat flow into collar (kW) | 0.194 (5.5%) | 0.363 (6.6%) |
Table 6.
Rotational power loss Pf,rot rotational speed 4000 rpm, specific pressure 3 MPa.
Table 6.
Rotational power loss Pf,rot rotational speed 4000 rpm, specific pressure 3 MPa.
| Power | 4 Pads Offset | 8 Pads Offset |
|---|
| Pbear (kW) | 6.37 | 8.03 |
| Pf,pad (kW) | 2.881 | 5.209 |
| Pf,space (kW) | 0.628 | 0.328 |
| Pf,rot (kW) | 2.861 | 2.493 |


