Article

Characterization of High-Power Turbomachinery Tilting Pad Journal Bearings: First Results Obtained on a Novel Test Bench

1
Department of Civil and Industrial Engineering, University of Pisa, Largo Lazzarino, 56122 Pisa, Italy
2
GE Oil & Gas, Via Felice Matteucci 2, 50127 Firenze, Italy
3
AM Testing srl, Via Padre Eugenio Barsanti 10, 56121 Pisa, Italy
*
Author to whom correspondence should be addressed.
Lubricants 2018, 6(1), 4; https://doi.org/10.3390/lubricants6010004
Submission received: 27 November 2017 / Revised: 29 December 2017 / Accepted: 3 January 2018 / Published: 6 January 2018
(This article belongs to the Special Issue Friction and Lubrication of Sliding Bearings)

Abstract

:
Tilting pad journal bearings are usually employed in turbomachines for their stable behavior at high rotational speeds. Devoted test rigs have been realized to validate the predictions of theoretical models. However, the design of new high-performance and large-size bearings needs to be supported by experimental investigations on high-performance large test rigs. The main characteristics of a recently built facility for testing large tilting pad journal bearings with diameters from 150 to 300 mm are described in this work. The test rig is versatile and can be used to test bearings of different size, configurations and to investigate the influence of many parameters, even the effect of misalignment. Sample results of the static characterization of a four-pad high-performance tilting pad journal bearing are reported evidencing some transient effects. A few sample dynamic results are also reported. The presented experimental results demonstrated the capabilities of the rig for investigating the static and the dynamic characteristics of the bearings accurately measuring slow and fast variables.

Graphical Abstract

1. Introduction

As is well known, tilting pad journal bearings are usually employed in turbomachines for their stable behavior at high rotational speeds. Their steady and dynamic characteristics have been investigated extensively by several researchers. Devoted test rigs have been realized to validate the predictions of theoretical models. The effects of operating parameters such as static load, speed, oil inlet flow rate, pressure and temperature, as well as the thermal deformation on the steady performance of the bearings in terms of journal eccentricity, attitude angle, film thickness, power loss and pad temperature have been analyzed [1,2,3,4,5]. More recently, transient effects due for example to start-up or varying speed on friction, temperature and consequently thermo-elastic deformation of hydrodynamic bearings have gained interest, for energy saving implications and for safety reasons [6,7].
Moreover, the rotor dynamics is influenced by the characteristics of the bearings. Therefore the determination of the bearing stiffness and damping coefficients is quite important. This is usually done experimentally, applying dynamic loads to the rotor or to the bearing and measuring their relative displacement [8,9,10]. Identification methods are then used for the determination of the dynamic coefficients, mainly in the frequency domain [11,12].
A novel experimental apparatus has been set up by the Department of Civil and Industrial Engineering of the University of Pisa in collaboration with GE Oil & Gas and AM Testing. With such an apparatus, bearings with diameters from 150 to 300 mm can be statically and dynamically characterized at peripheral speeds up to 150 m/s with static load up to 270 kN and dynamic loads up to 30 kN. The latter loads can be single tone or multitone with excitation frequencies up to 350 Hz. Several sensors allow the simultaneous measurements of significant quantities to highlight the characteristics of the test bearing and monitor the condition of the test facility. The capability of the test bench to investigate large-size bearings of different diameter, at high peripheral speeds and loads, is the principal innovation that makes it unique worldwide. This work reports the main features of the test rig as well as the results of the first static and dynamic tests on a four-pad high-performance tilting pad journal bearing. Further details of the test rig are reported in [13,14,15].

2. The Test Bench

The test bench was designed adopting the configuration with the test bearing floating and the rotor with fixed axis supported by rolling bearings. A schematic drawing and a picture of the test rig are shown in Figure 1.
The rotor is driven by an electric motor connected to a multiplier with a gear ratio of 6. A torque meter is used for measuring the torque. Three pitch stabilizers, one of which is visible in the schematic drawing of Figure 1, placed at 120 degrees around the bearing, constrain the bearing housing longitudinally. Their screw and nut connections allow for adjusting the parallelism between the housing and the shaft axes before the test execution, but they could also be employed for obtaining some misalignment in specific tests aimed at investigating this issue experimentally, analyzed for instance in [16].
The loads are applied to the housing of the bearing by hydraulic actuators. The static load acts in the vertical direction, upwards. The dynamic loads are applied by two identical mutually orthogonal hydraulic actuators positioned at 45° with respect to the vertical direction (Figure 2) that can work independently or simultaneously in phase, producing a vertical force, or in anti-phase, generating a horizontal force. The main characteristics of the test rig are reported in Table 1.
All significant forces acting on the bearing housing are measured. Three-axial load cells connect the dynamic actuators to the housing: the applied static load is measured by a load cell with 300 kN full scale and another load cell with 2 kN full scale measures the reaction exerted by the anti-roll arm visible on the right of Figure 2.
High-resolution proximity sensors with 0.8 mm full scale are used for the measurement of the relative displacements between the bearing housing and the rotor located along the U (Z left) and the V (Z right) directions shown in Figure 2. Four sensors are used, located on two different planes orthogonal to the bearing axis. Additional proximity sensors of medium precision are also located at each section in diametrically opposite positions with respect to the high-resolution ones.
The bench frame is made by a main 4 m long structure, composed of hollow rectangular beams. It supports the weight of the components, spanning over the inground basin of the oil tank. A second structure makes it possible to align the motor and the multiplier inlet shaft axes and the multiplier outlet shaft and the test cell rotor axes. The frame has anti-vibration pads and can be filled eventually with granular material to dampen vibrations.
Three independent oil systems are used: one for the lubricant of the tilting pad journal bearing, one for the load application system and one for the multiplication gearbox.
A very complex control and data acquisition system is used for managing the tests. High-frequency data (about 30 signals) are stored at 100 kHz and low-frequency data (about 60 signals) are stored at 1 Hz.

3. Experimental Results

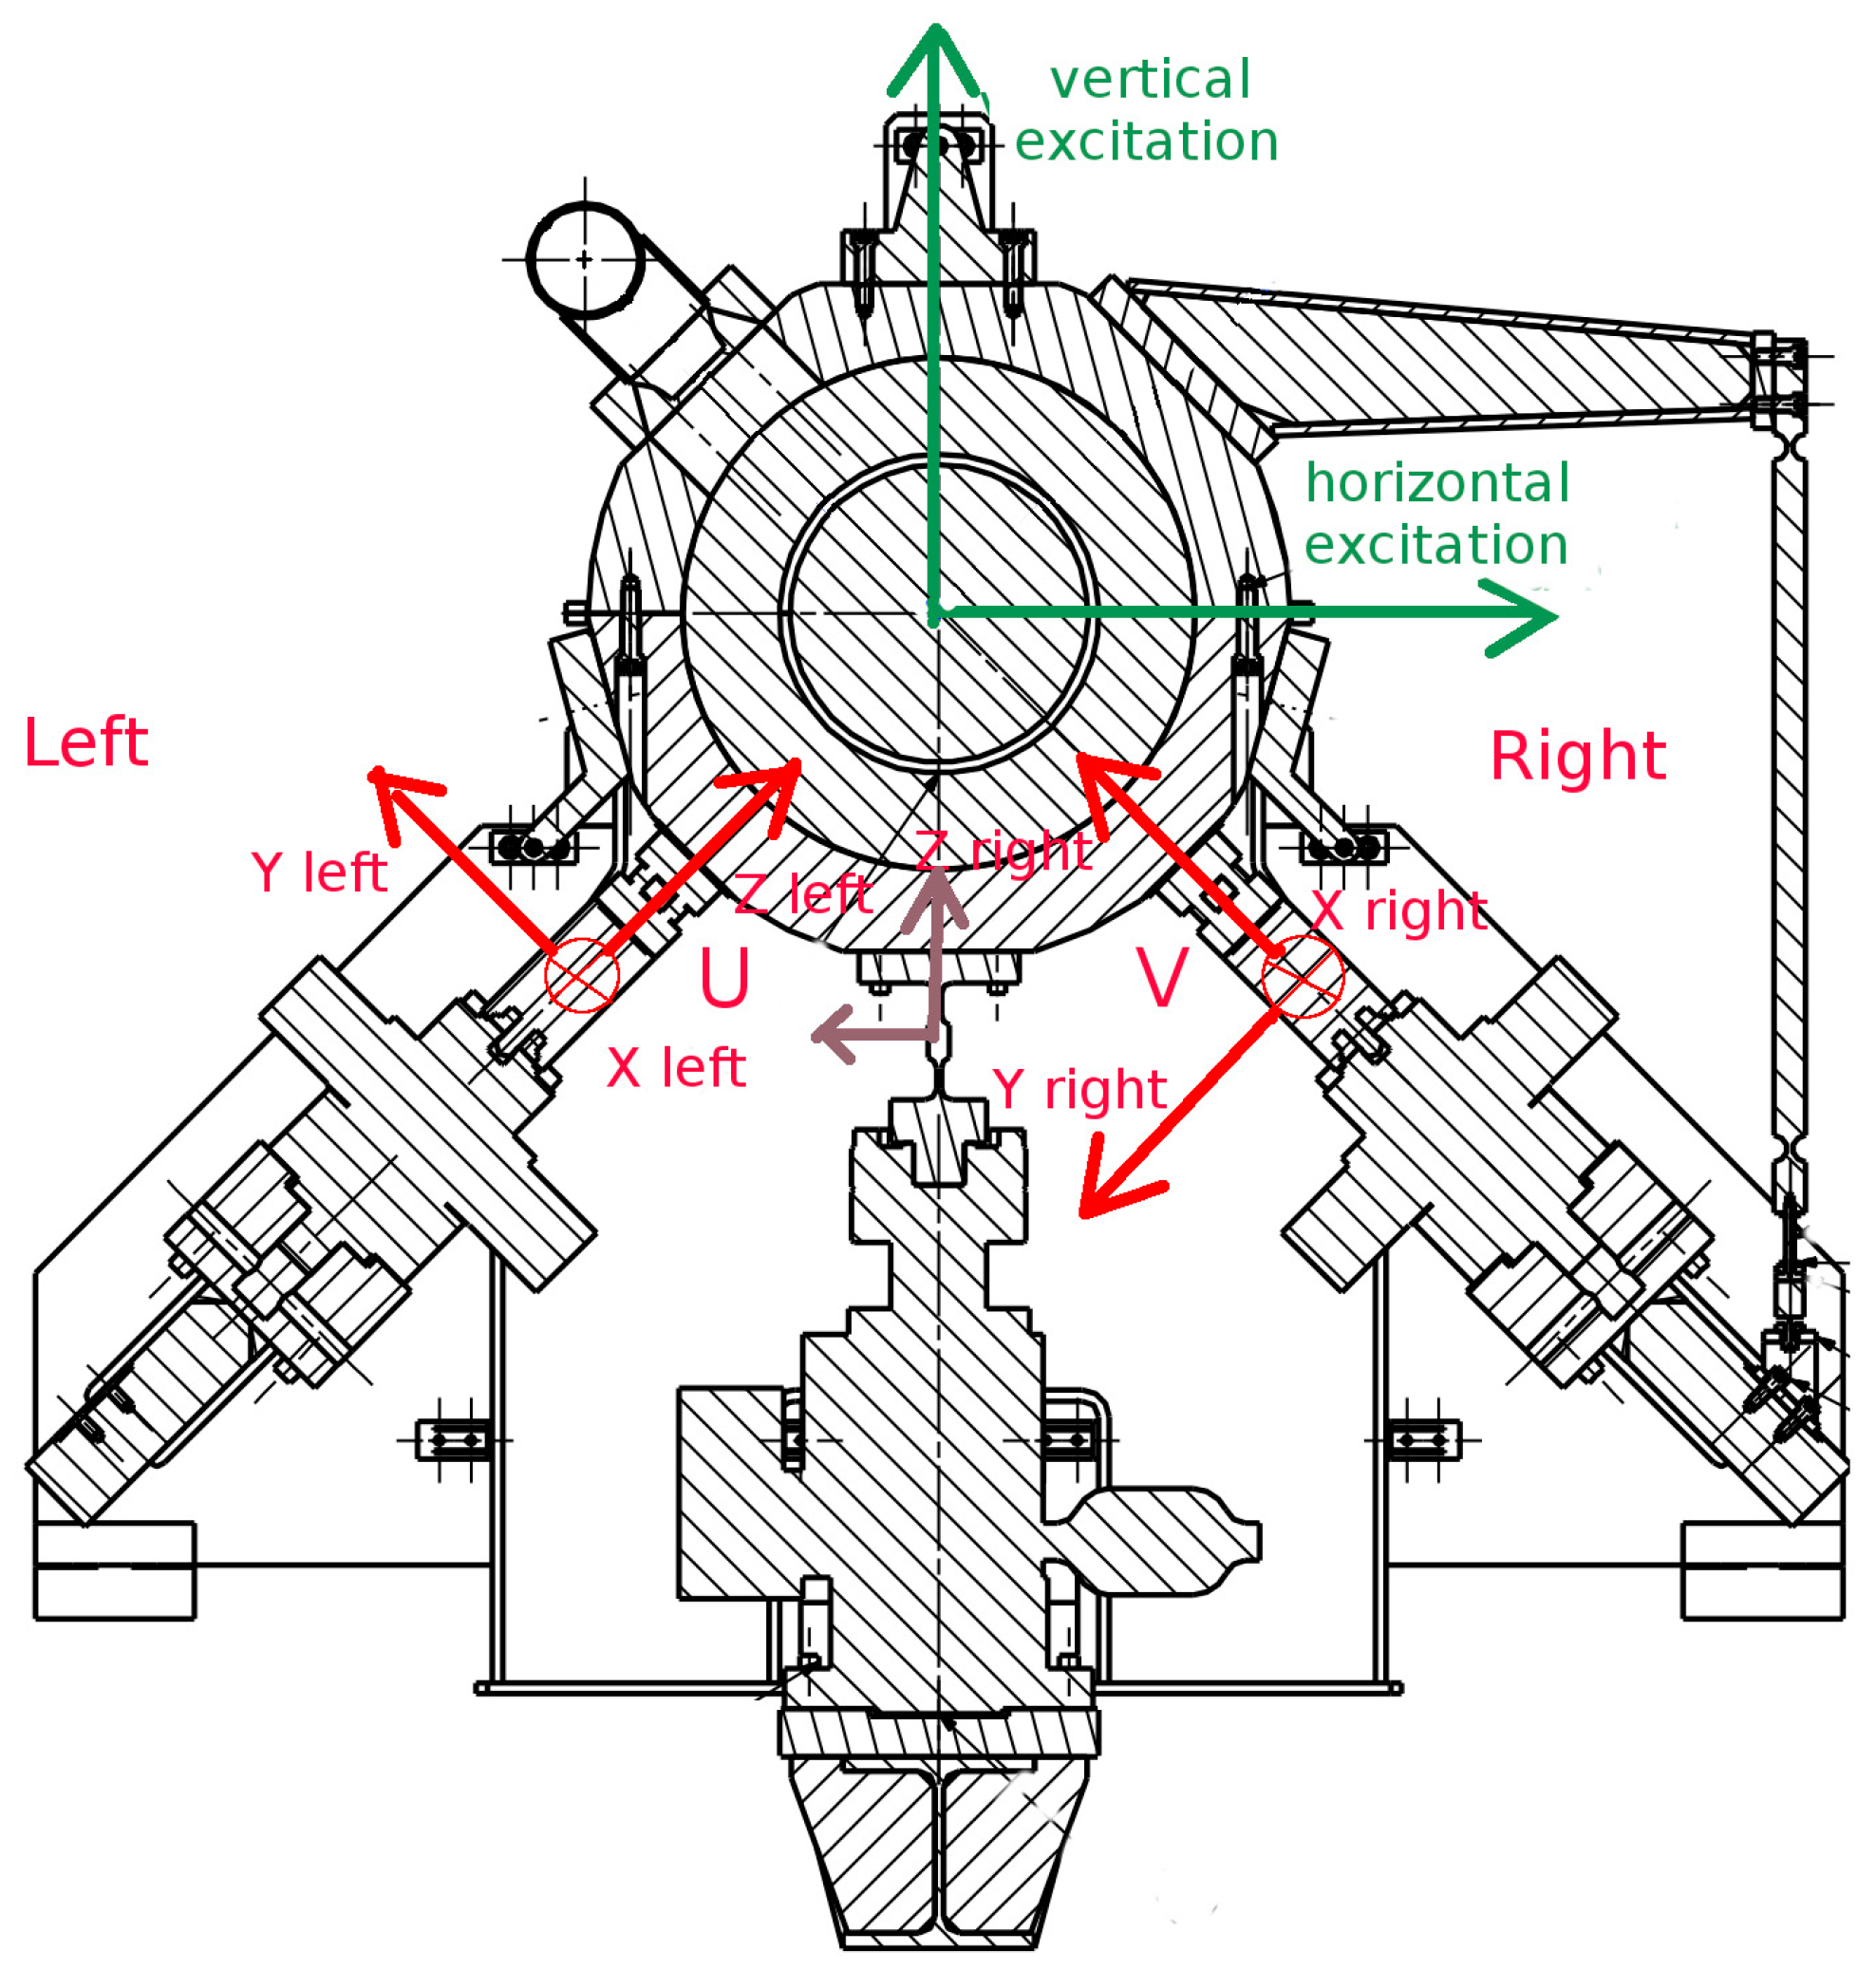
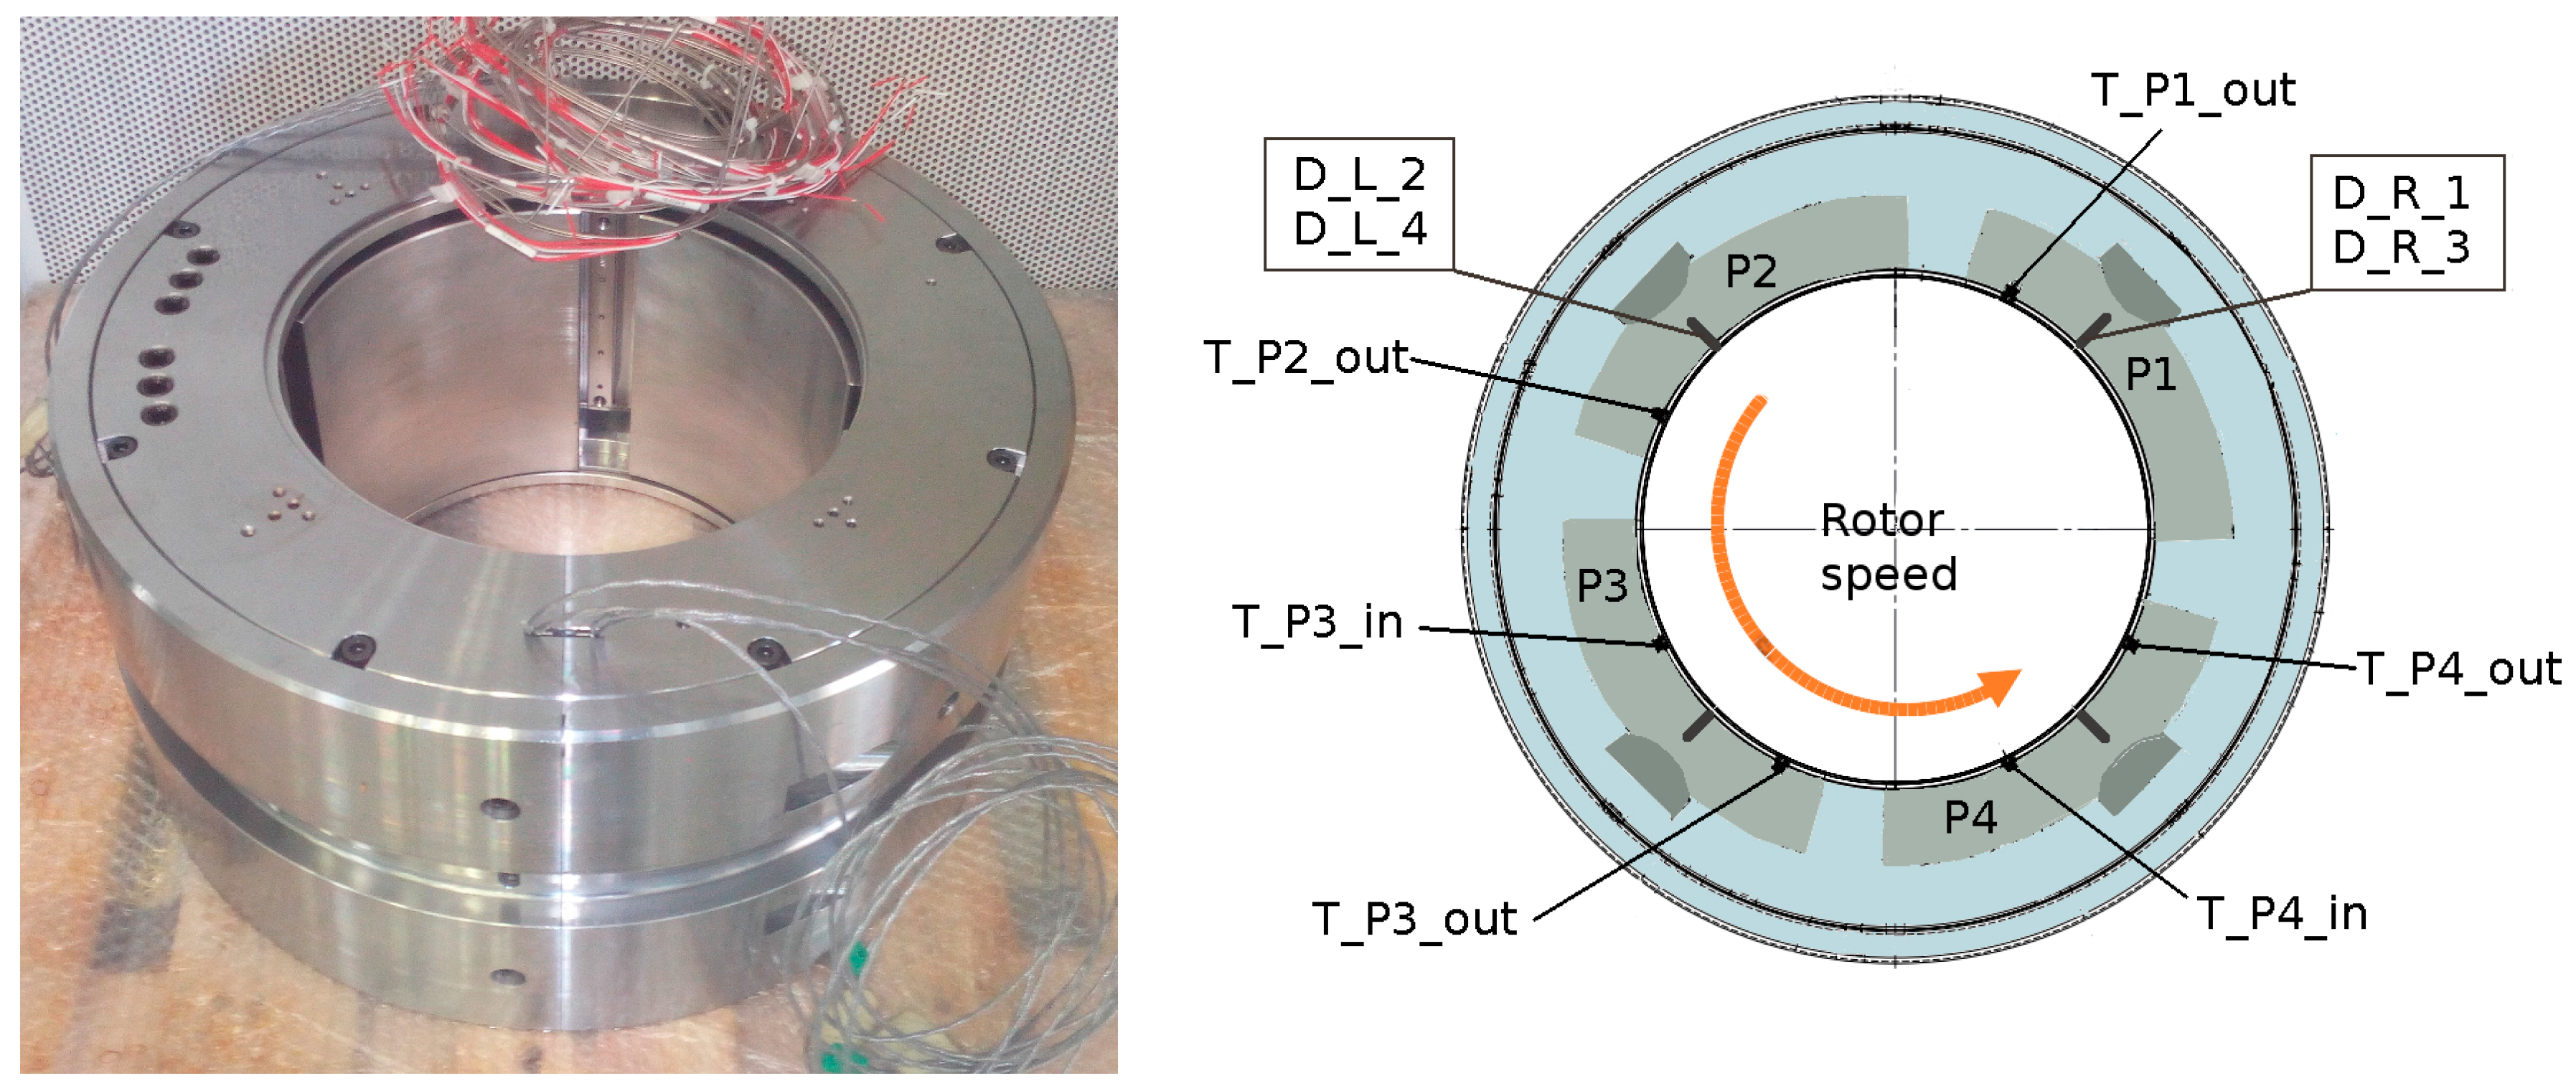
A 280-mm diameter four-pad ball-in-socket tilting pad journal bearing was used for the test bench commissioning. The bearing length to diameter ratio is 0.7 and the diametral clearance 470 μm ± 20 μm. The bearing is equipped with six thermocouples for detecting the pad temperatures; two thermocouples are located in each of the lower and more loaded pads (Figure 3). In the same figure the proximity sensors, mentioned in the previous section, are indicated with the letter D in the label, sensors 1 and 2 on a plane, 3 and 4 on the other one.
The standard procedure for recording the data necessary for the identification of the bearing dynamic stiffness and damping coefficients starts once the desired steady state working conditions are reached and then sinusoidal forces are applied in the frequency range of interest for a short time (30 s). Depending on the ambient temperature, about one or two hours are necessary for reaching the steady state conditions (in terms of rotor speed, eccentricity and pad temperatures).
Several tests were performed in the load between pad configuration for different steady state working conditions in terms of rotational speed, static load, inlet oil temperature and oil flow rate. Multiple frequency sinusoidal forces in the frequency range of interest were imposed by the dynamic actuators for the identification of the bearing dynamic coefficients.
Some sample slow variable and high-frequency results are reported and discussed in the following sections. Tests were performed using an ISO VG32 mineral oil with a density of 850 kg/m3 at 40 °C and a viscosity index of 118.

3.1. Slow Variable Results

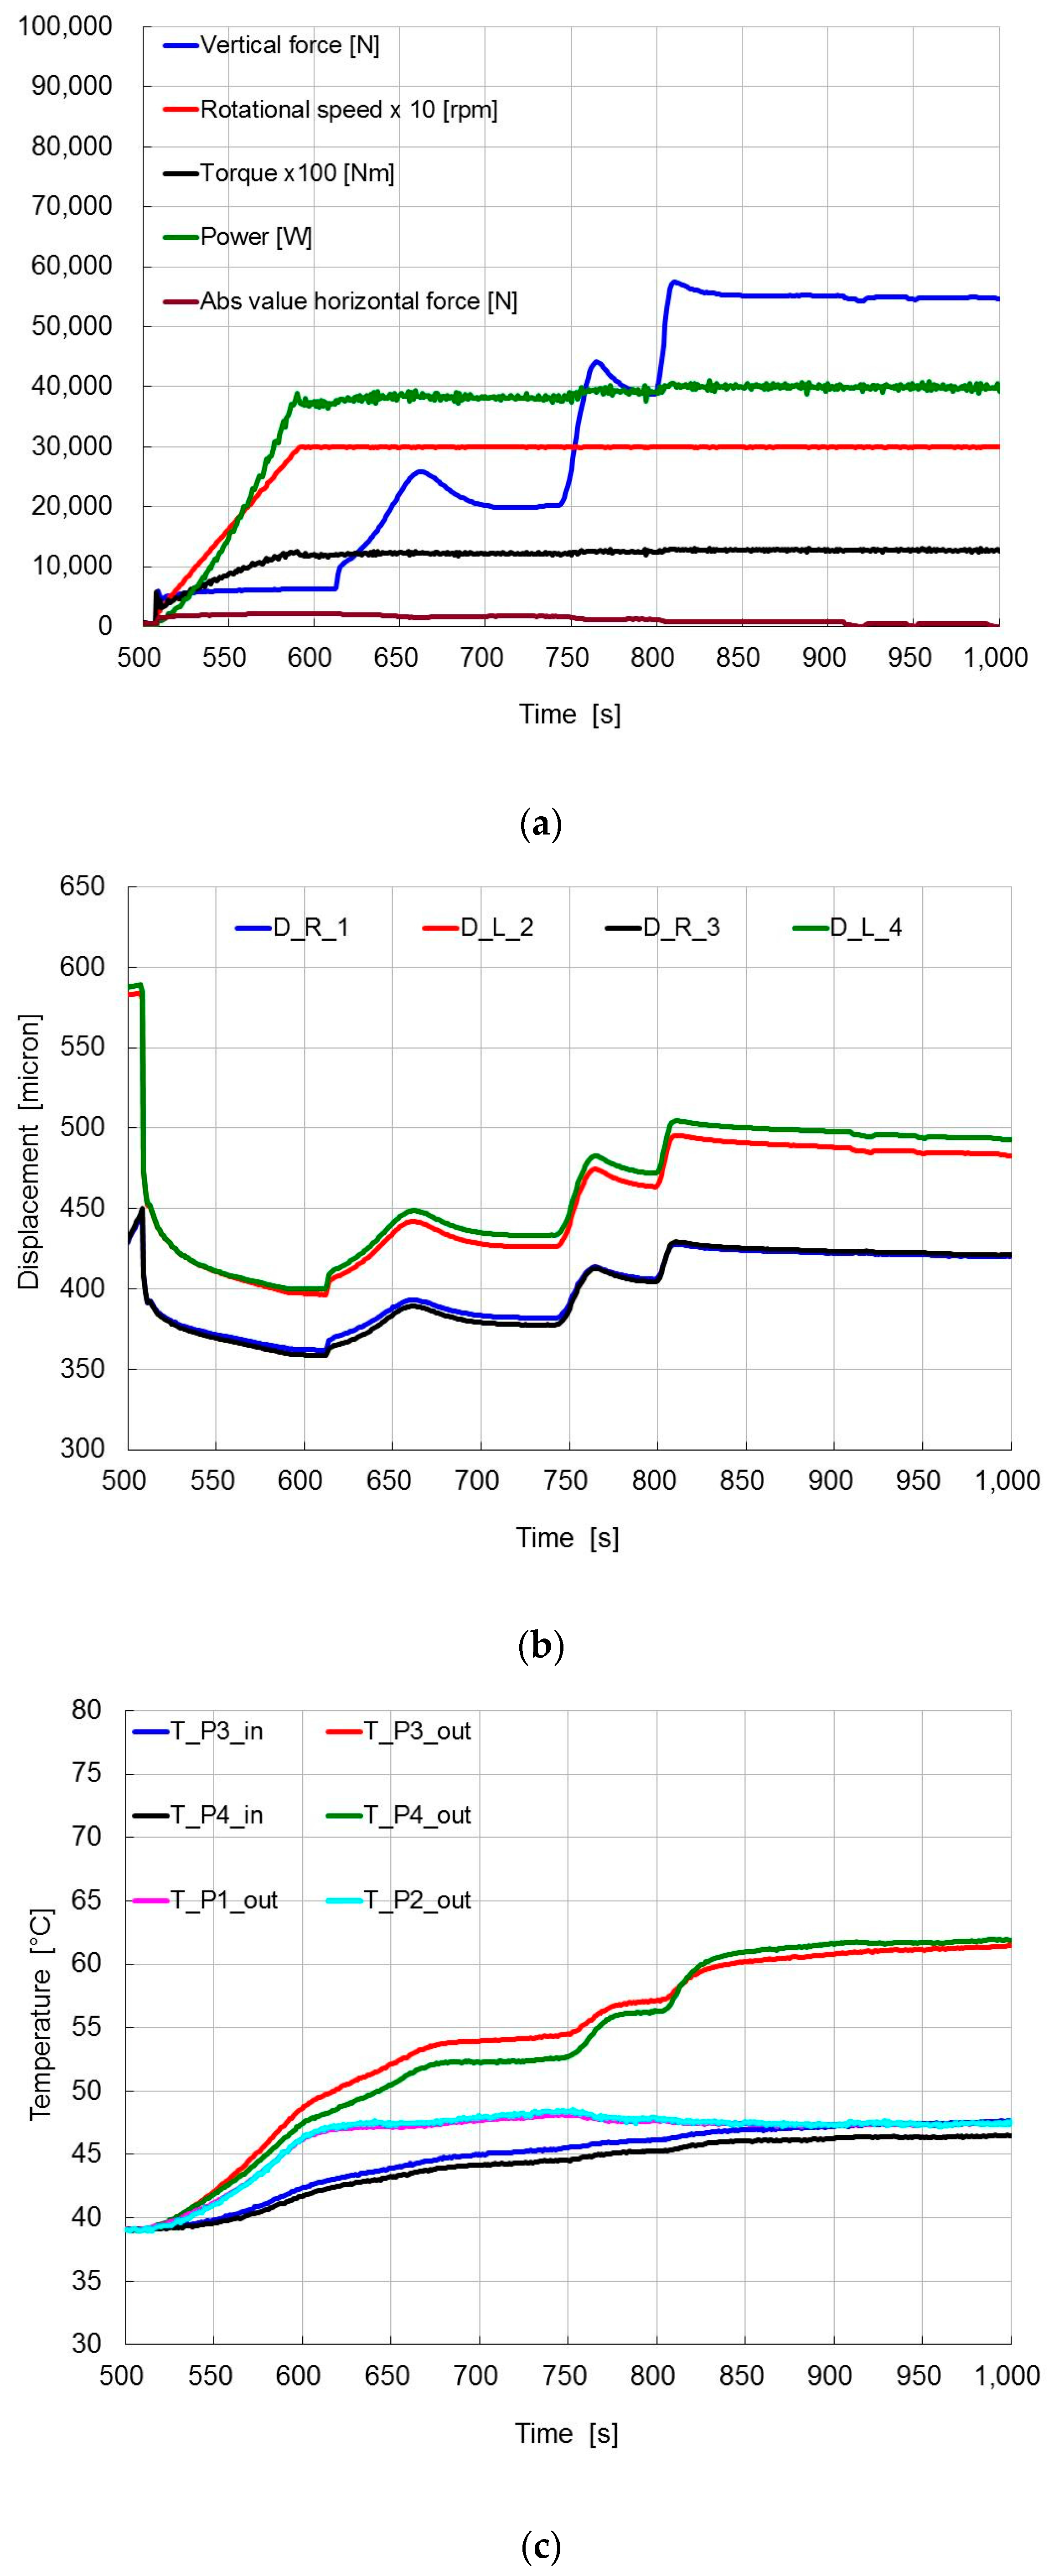
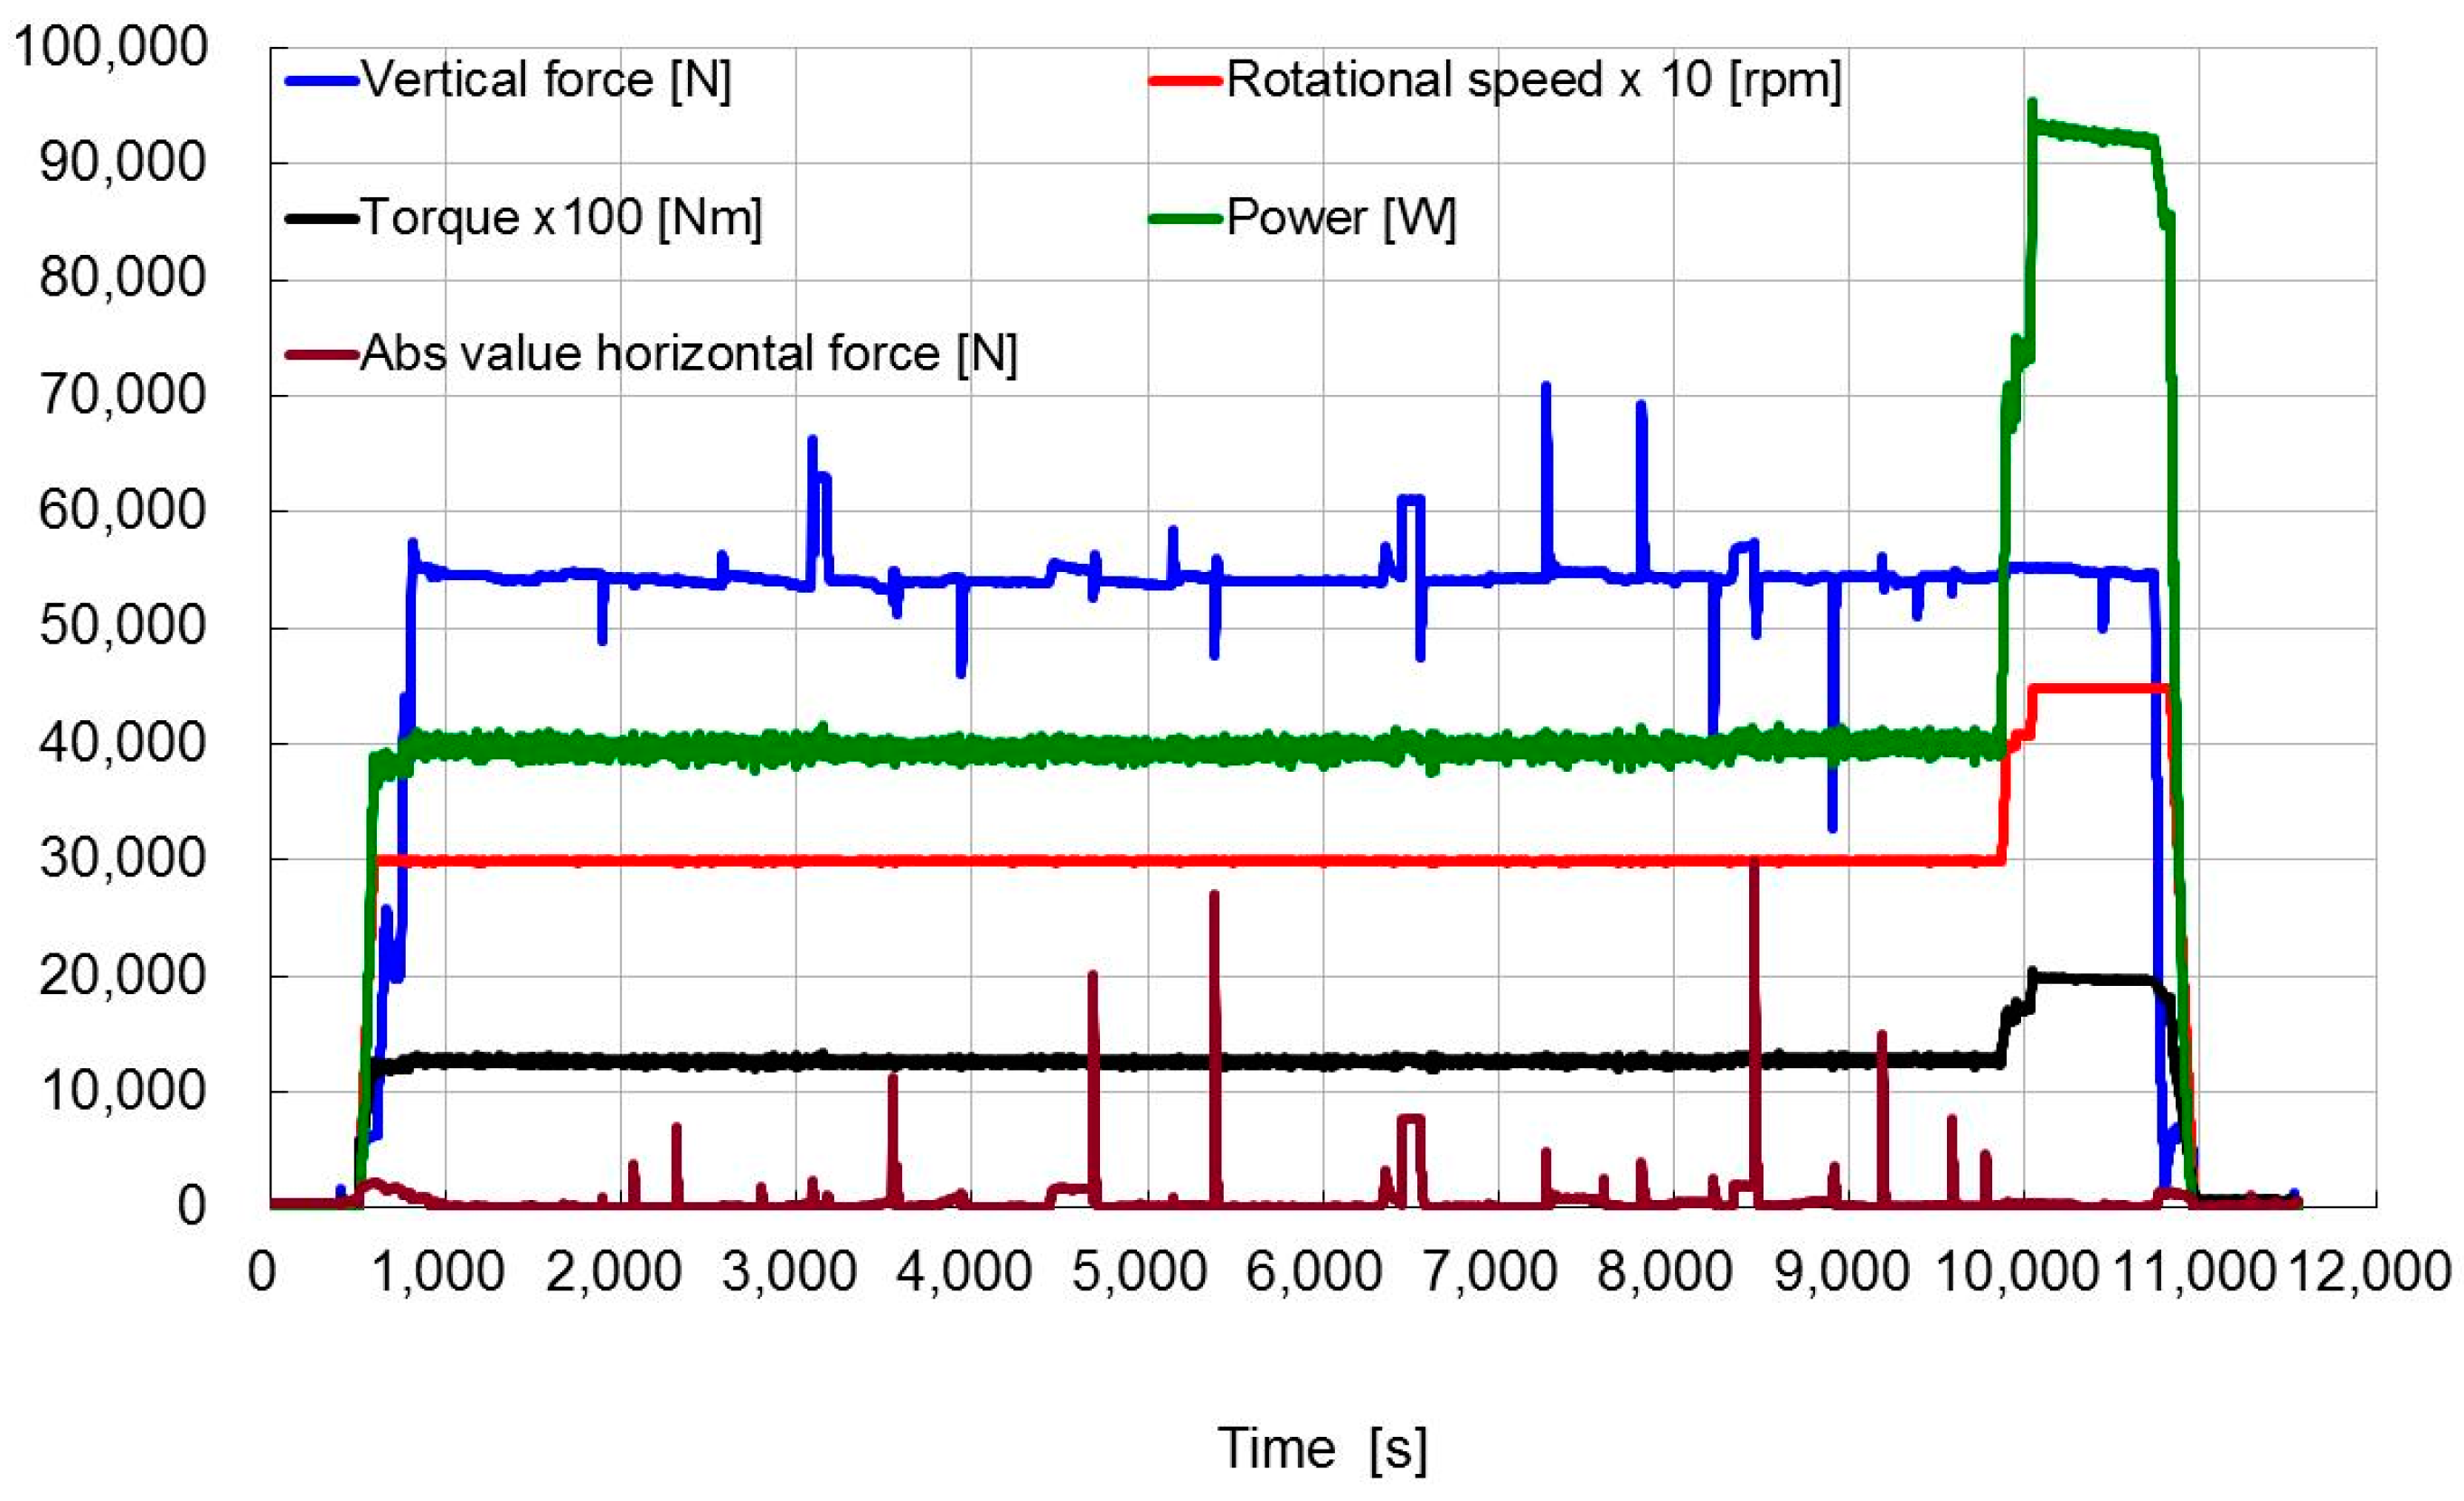
Data of all sensors are recorded at 1 Hz including the ones that are also recorded at high frequency. Particularly all force components, the total torque (including the friction contribution of rolling bearings and seals), the rotational speed, the displacements and the pads temperatures are recorded. In Figure 4 the data recorded during a test with an oil flow rate of 160 L/min with 40 °C inlet temperature are shown. The vertical and horizontal forces are calculated from the corresponding components measured by all load cells and the power from the torque and the rotational speed. The test bearing worked under fully flooded conditions.
The test was mainly carried out for verifying the behavior of the rig during long time tests. Some fluctuations of the forces were present due to some software problems related to the closed-loop control system, solved later on.
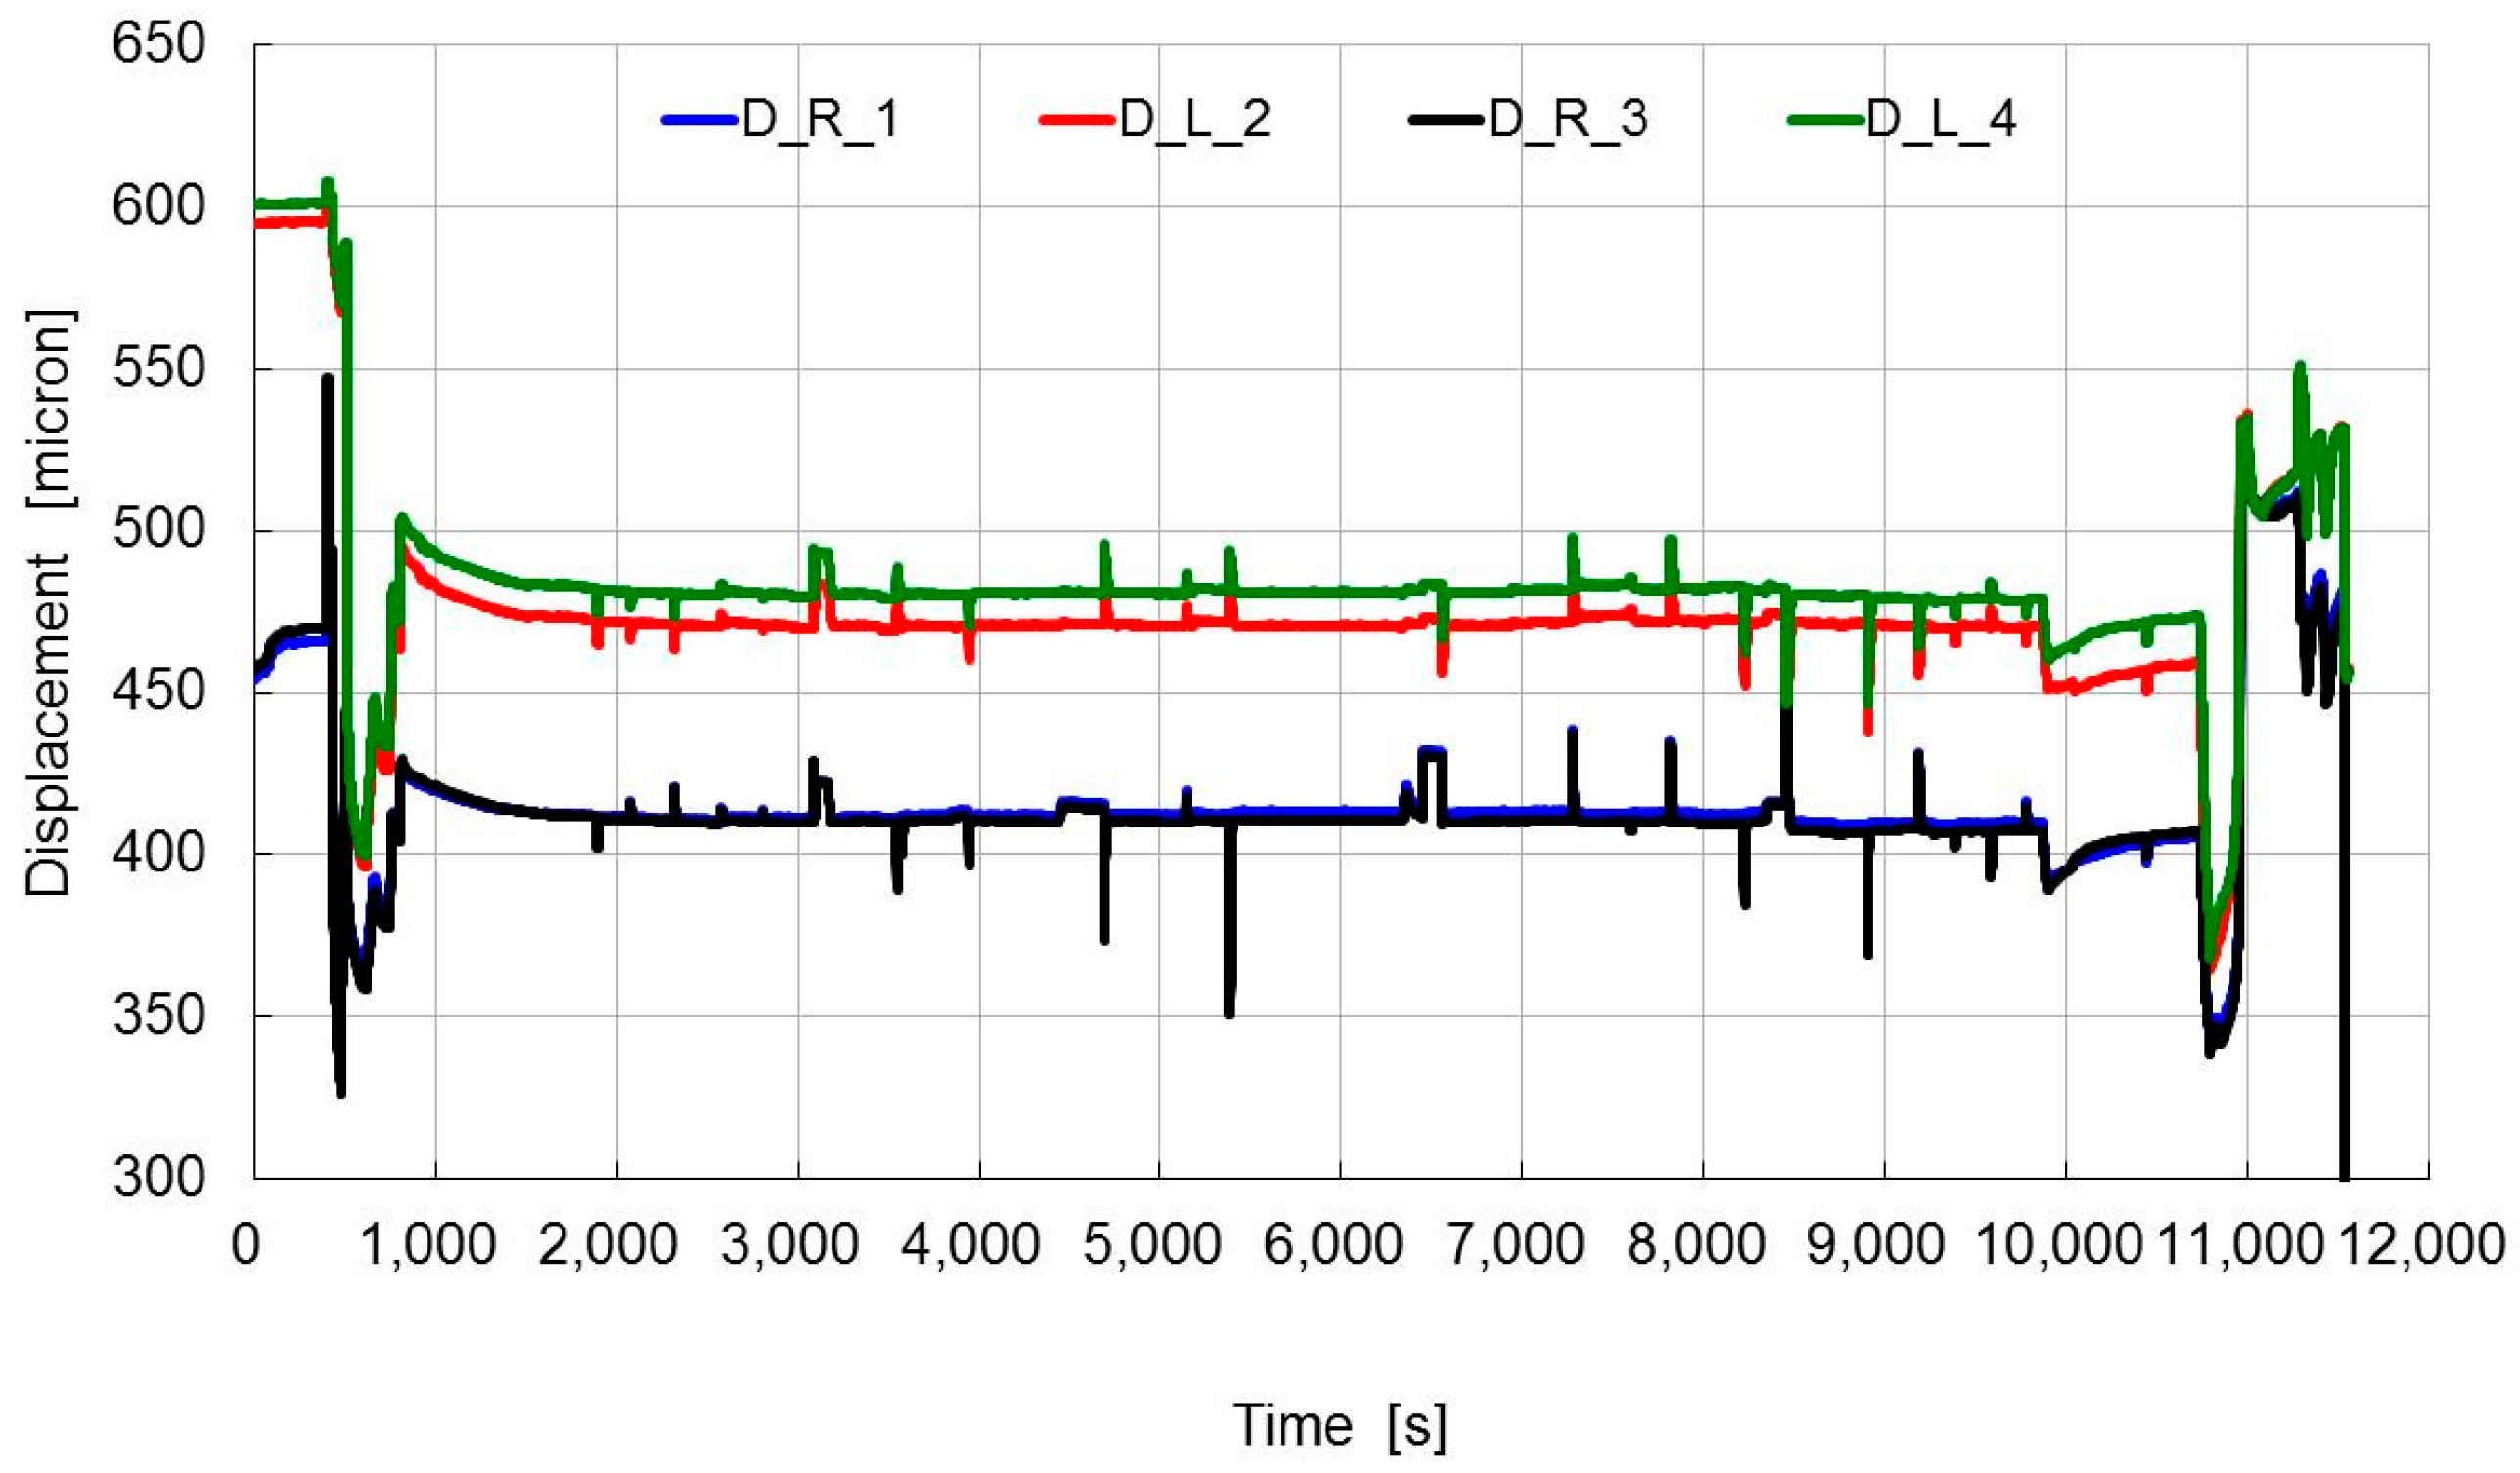
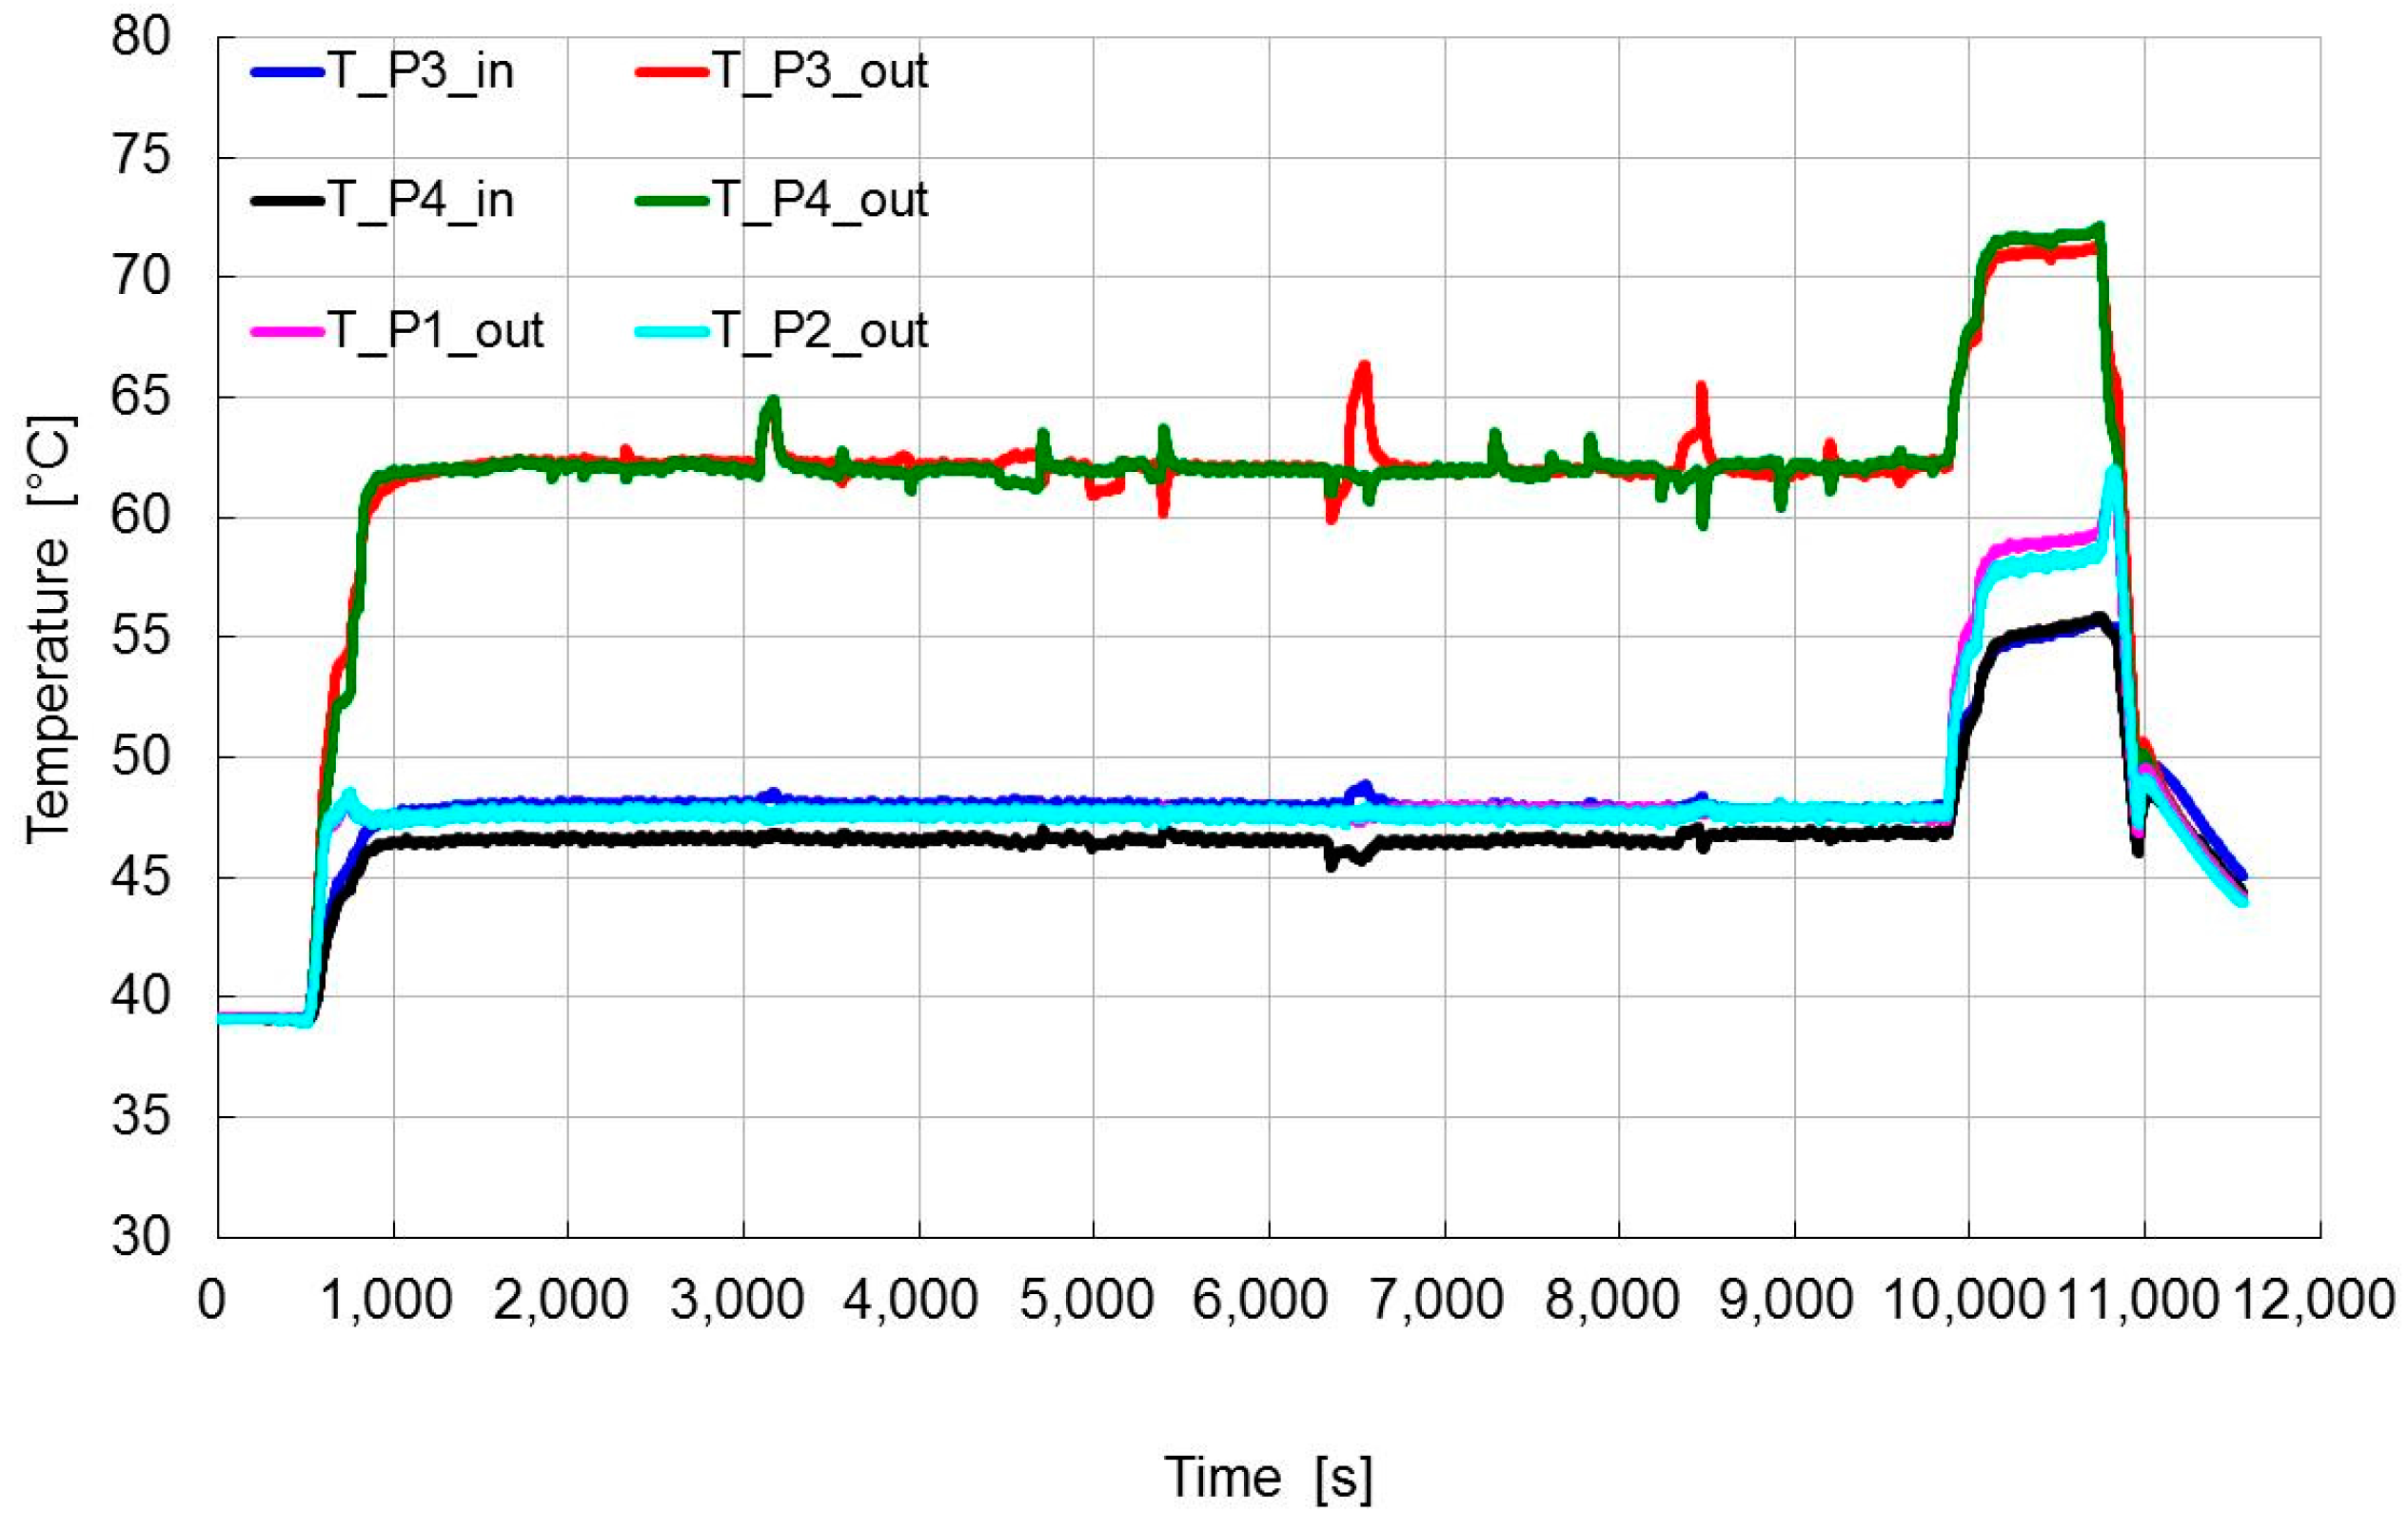
Fluctuations apart, under constant conditions of load and speed (about 55 kN and 3000 rpm, corresponding to a specific load of 1 MPa and 44 m/s respectively) the recorded differences among the values measured by the same sensors after 1 h 40 min (from 2000 to 8000 s) are about 1 micron for the displacements and some tenths of degree for the temperatures (Figure 5 and Figure 6). Note that the proximity sensors have not the same zero though the two on the same side (left or right) are very close. Having the same zero value is not important for the dynamic tests where the variations matter and in any case data can be corrected with an adequate shift.
Both inlet and outlet temperatures of the lower pads are monitored while only the outlet temperature is monitored for the upper pads. As expected, the temperatures measured close to the outlet zone are significantly higher than the ones close to the inlet and the lower pad outlet temperatures are significantly higher than the ones of the upper pads.
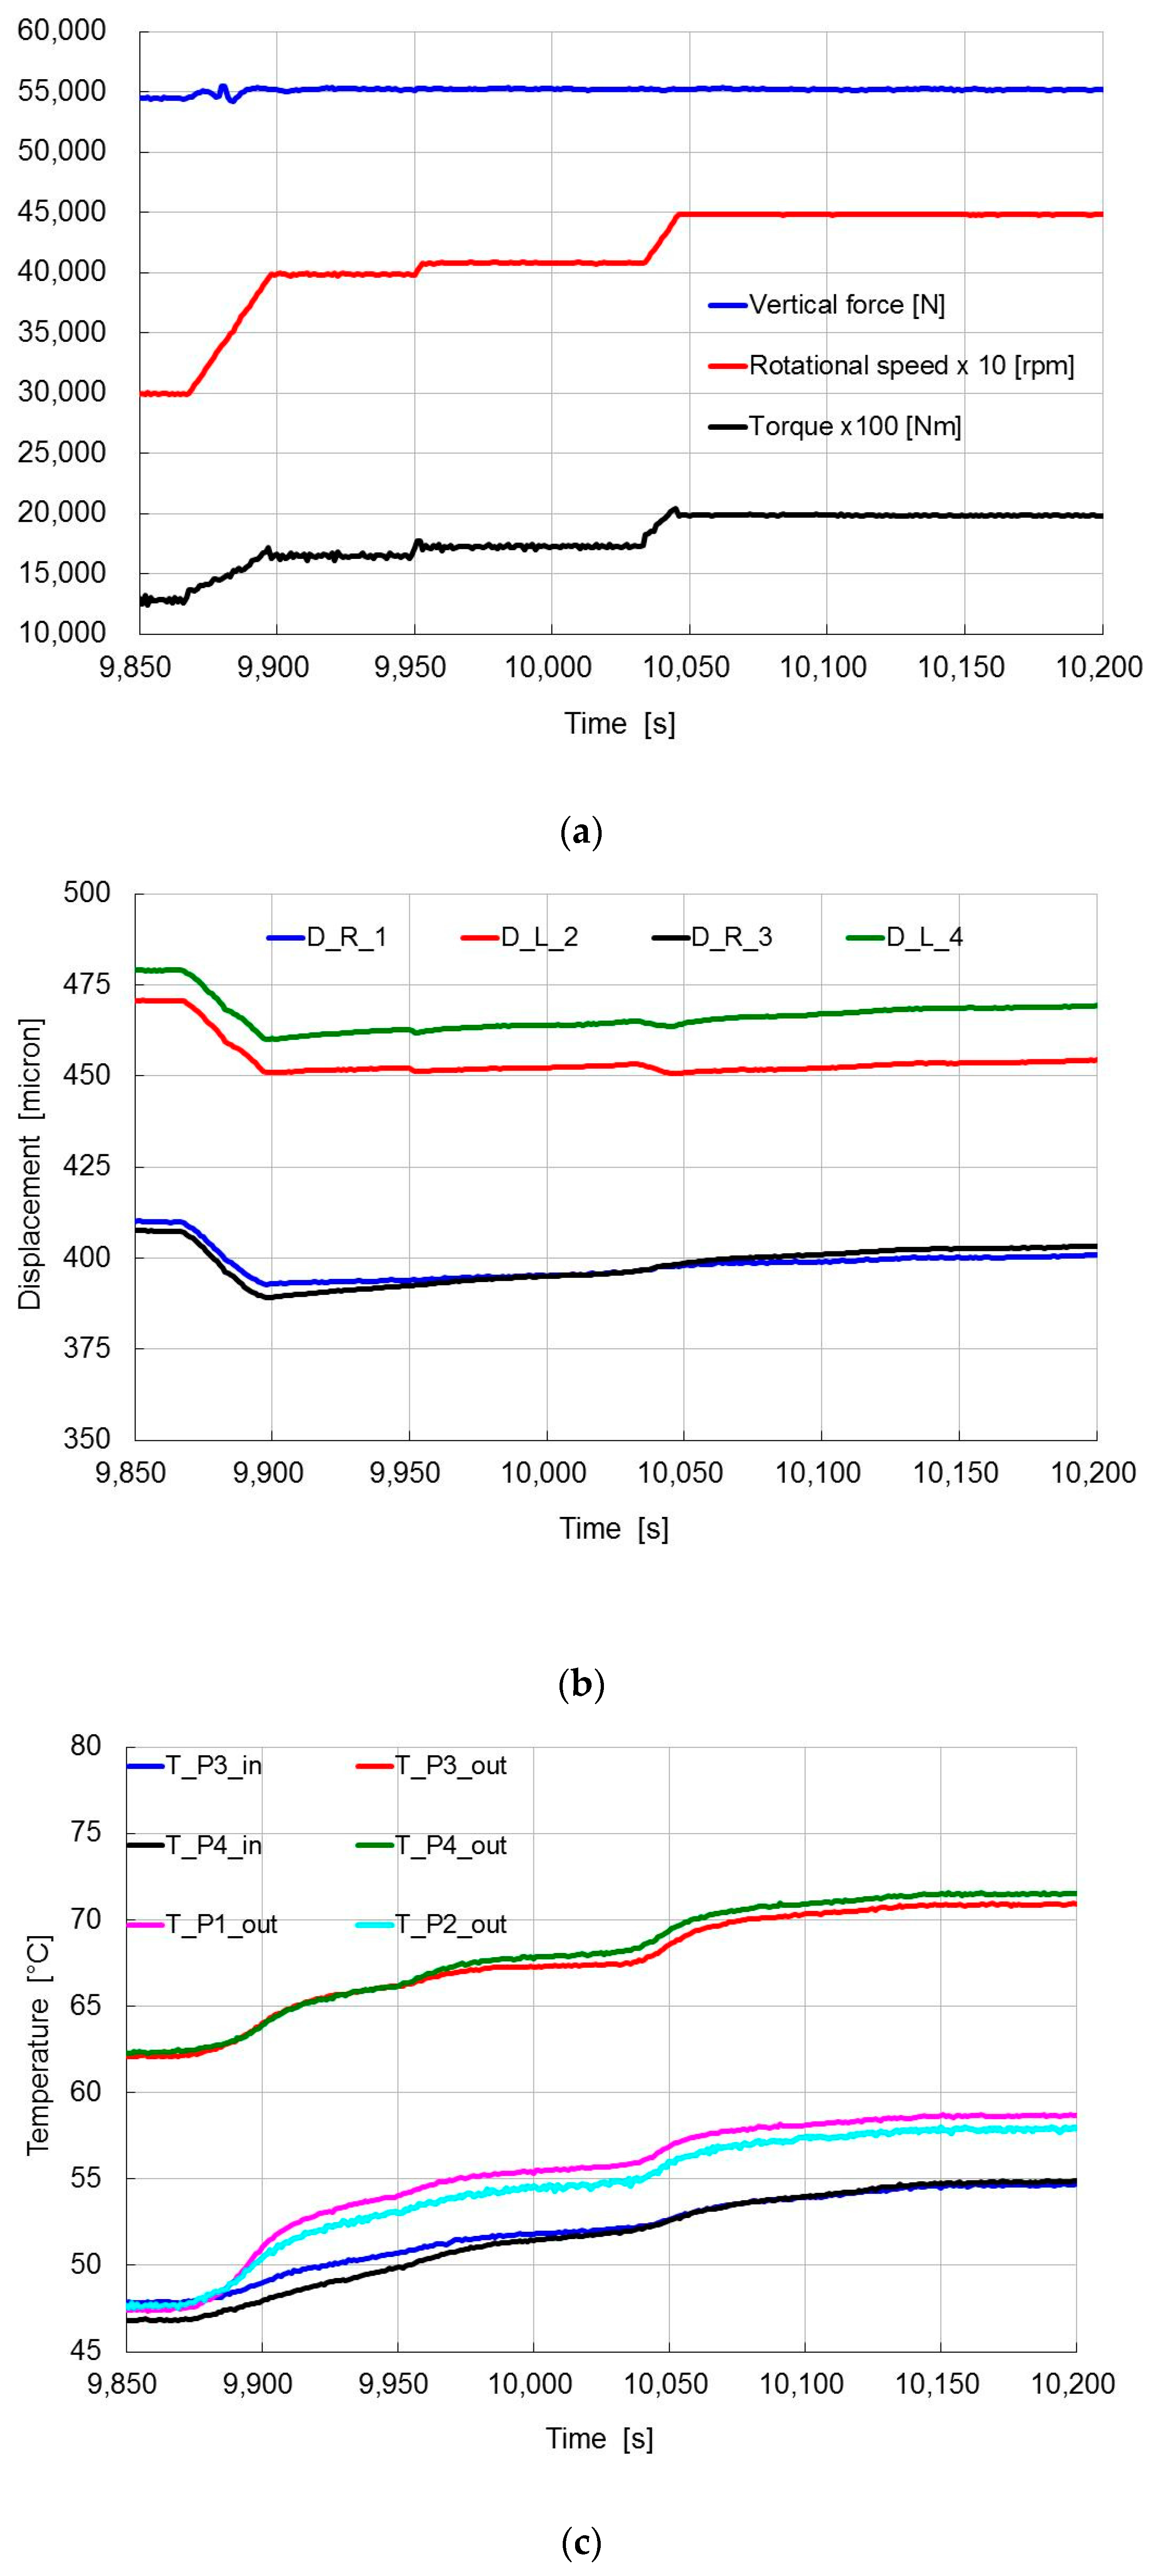
It is interesting to note that the response of the system to the variations of speed is quite rapid. As better evidenced in the diagrams of Figure 7, where the time interval with the stepwise speed increased from 3000 to 4500 rpm is shown, an increase of speed corresponds as expected to an increase of the friction torque, a decrease of the displacements and an increase of temperature. Note that the related lower value of eccentricity corresponds to a reduction of the gap in the upper part of the bearing where the proximity sensors are placed.
There is a delay in the temperature response of the order of the minute (Figure 7c), due also to the fact that the thermocouples are inside the pads. The temperature increase produces a viscosity reduction and therefore an increase of eccentricity (Figure 7b). However, both temperatures and displacements reach stationary values after less than a few minutes, as it can be noted from the variations after the last speed step of 500 rpm at about 10,040 s. Actually three minutes were sufficient for the temperature stabilization inside one degree, while excitations in dynamic tests usually started only after 5 to 7 min. Less obvious is the observation that when the speed is increased from 3000 to 4500 rpm, the increase of temperature of the upper pads is greater than that of the bottom pads. In fact, apart from a small difference between the left and right pads of the order of less than one degree, the upper pads temperature increases of about 11 °C (from 47 to 58 °C) and the lower pads temperature of 9 °C (from 62 to 71 °C). This can probably be explained by a greater viscosity of the lubricant in the upper less loaded part and to a possible transition from the laminar to the turbulent lubrication regime in the region where the oil film thickness is greater. In fact, at 4000 rpm, the estimated local Reynolds number for the upper pads reached the value of 1120 for the less loaded pad and 875 for the more loaded one.
The situation at the beginning of the test is better evidenced in the diagrams of Figure 8. When the shaft begins to rotate, there is a decrease of the measured displacements starting from a random initial position with the shaft in contact with the pads corresponding to an applied static load equal to the bearing weight (most probably the contact was in the lower part in the case shown in Figure 8). The rotation generates the formation of a lubricant film in the lower part that causes the upper gaps to diminish. Increasing the speed (for about 600 s) the eccentricity continues to decrease and the temperatures increase. Since the load is low the eccentricity is low as well and the temperatures are similar in all pads. Each increment of load produces an increase in film thickness in the upper part (remember that the load is applied vertically upwards to the bearing housing) and correspondingly an increase in the lower pads temperatures, particularly of the outlet temperatures, and a decrease in the upper pads temperature.
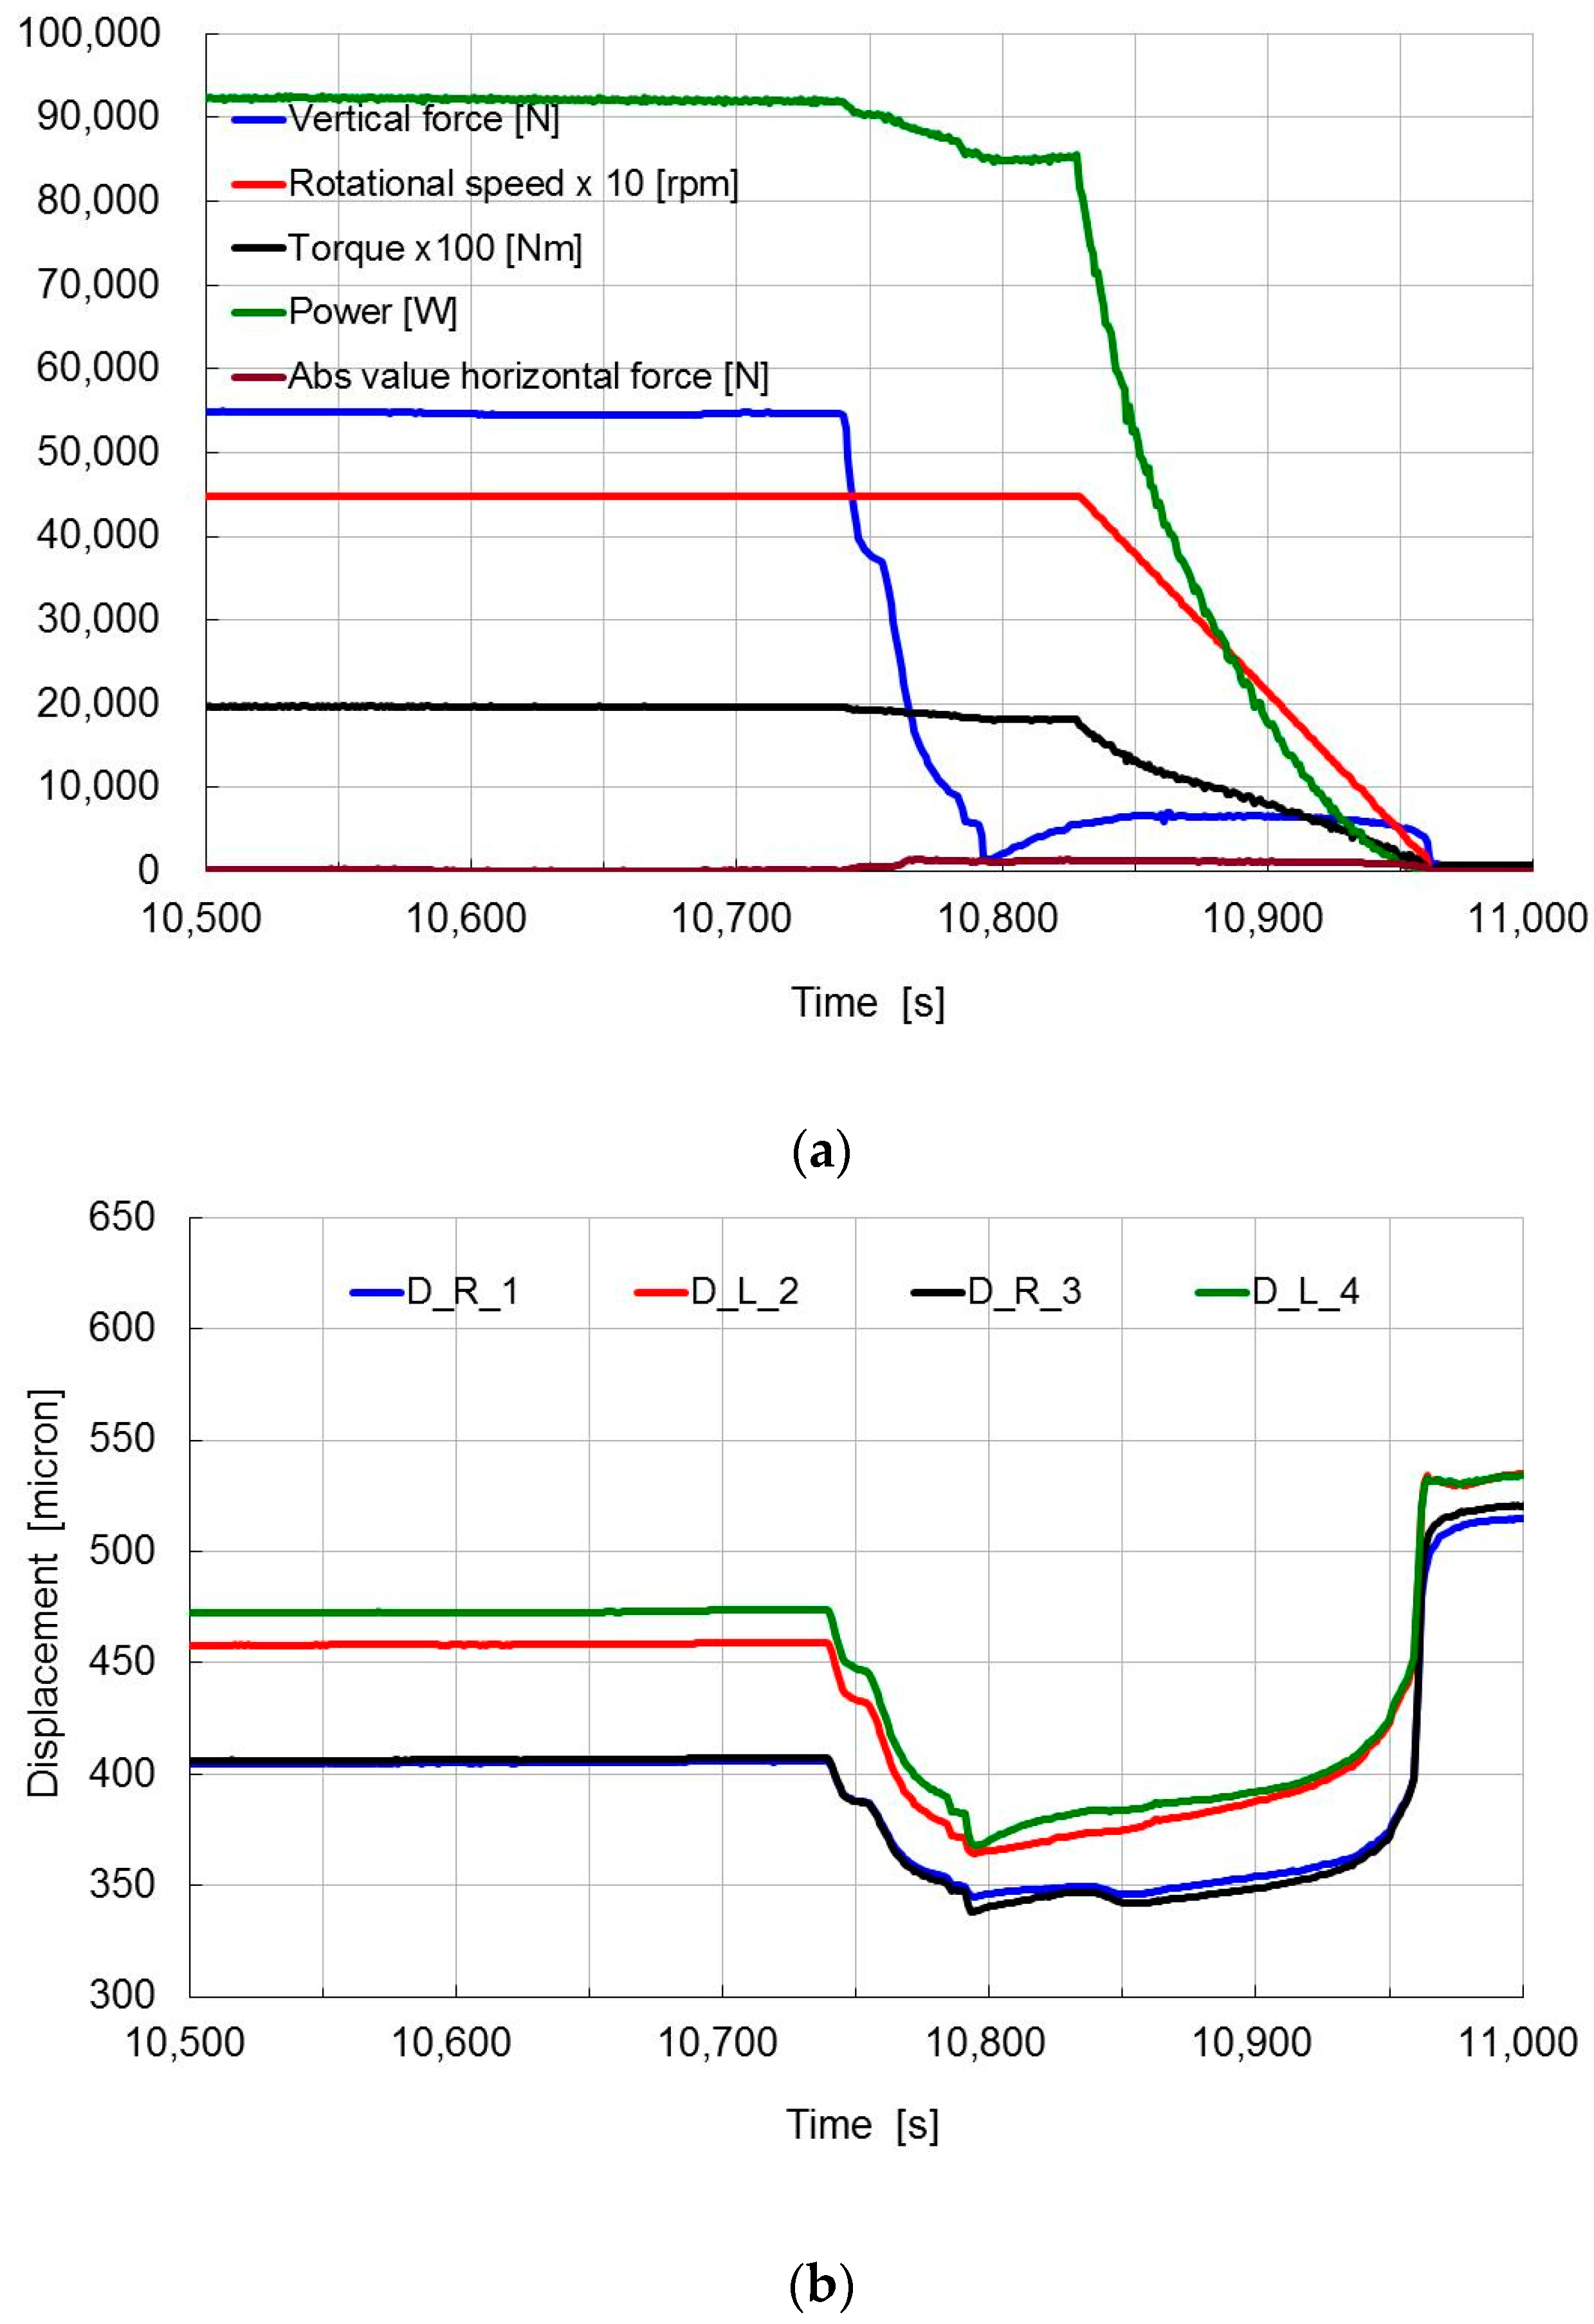
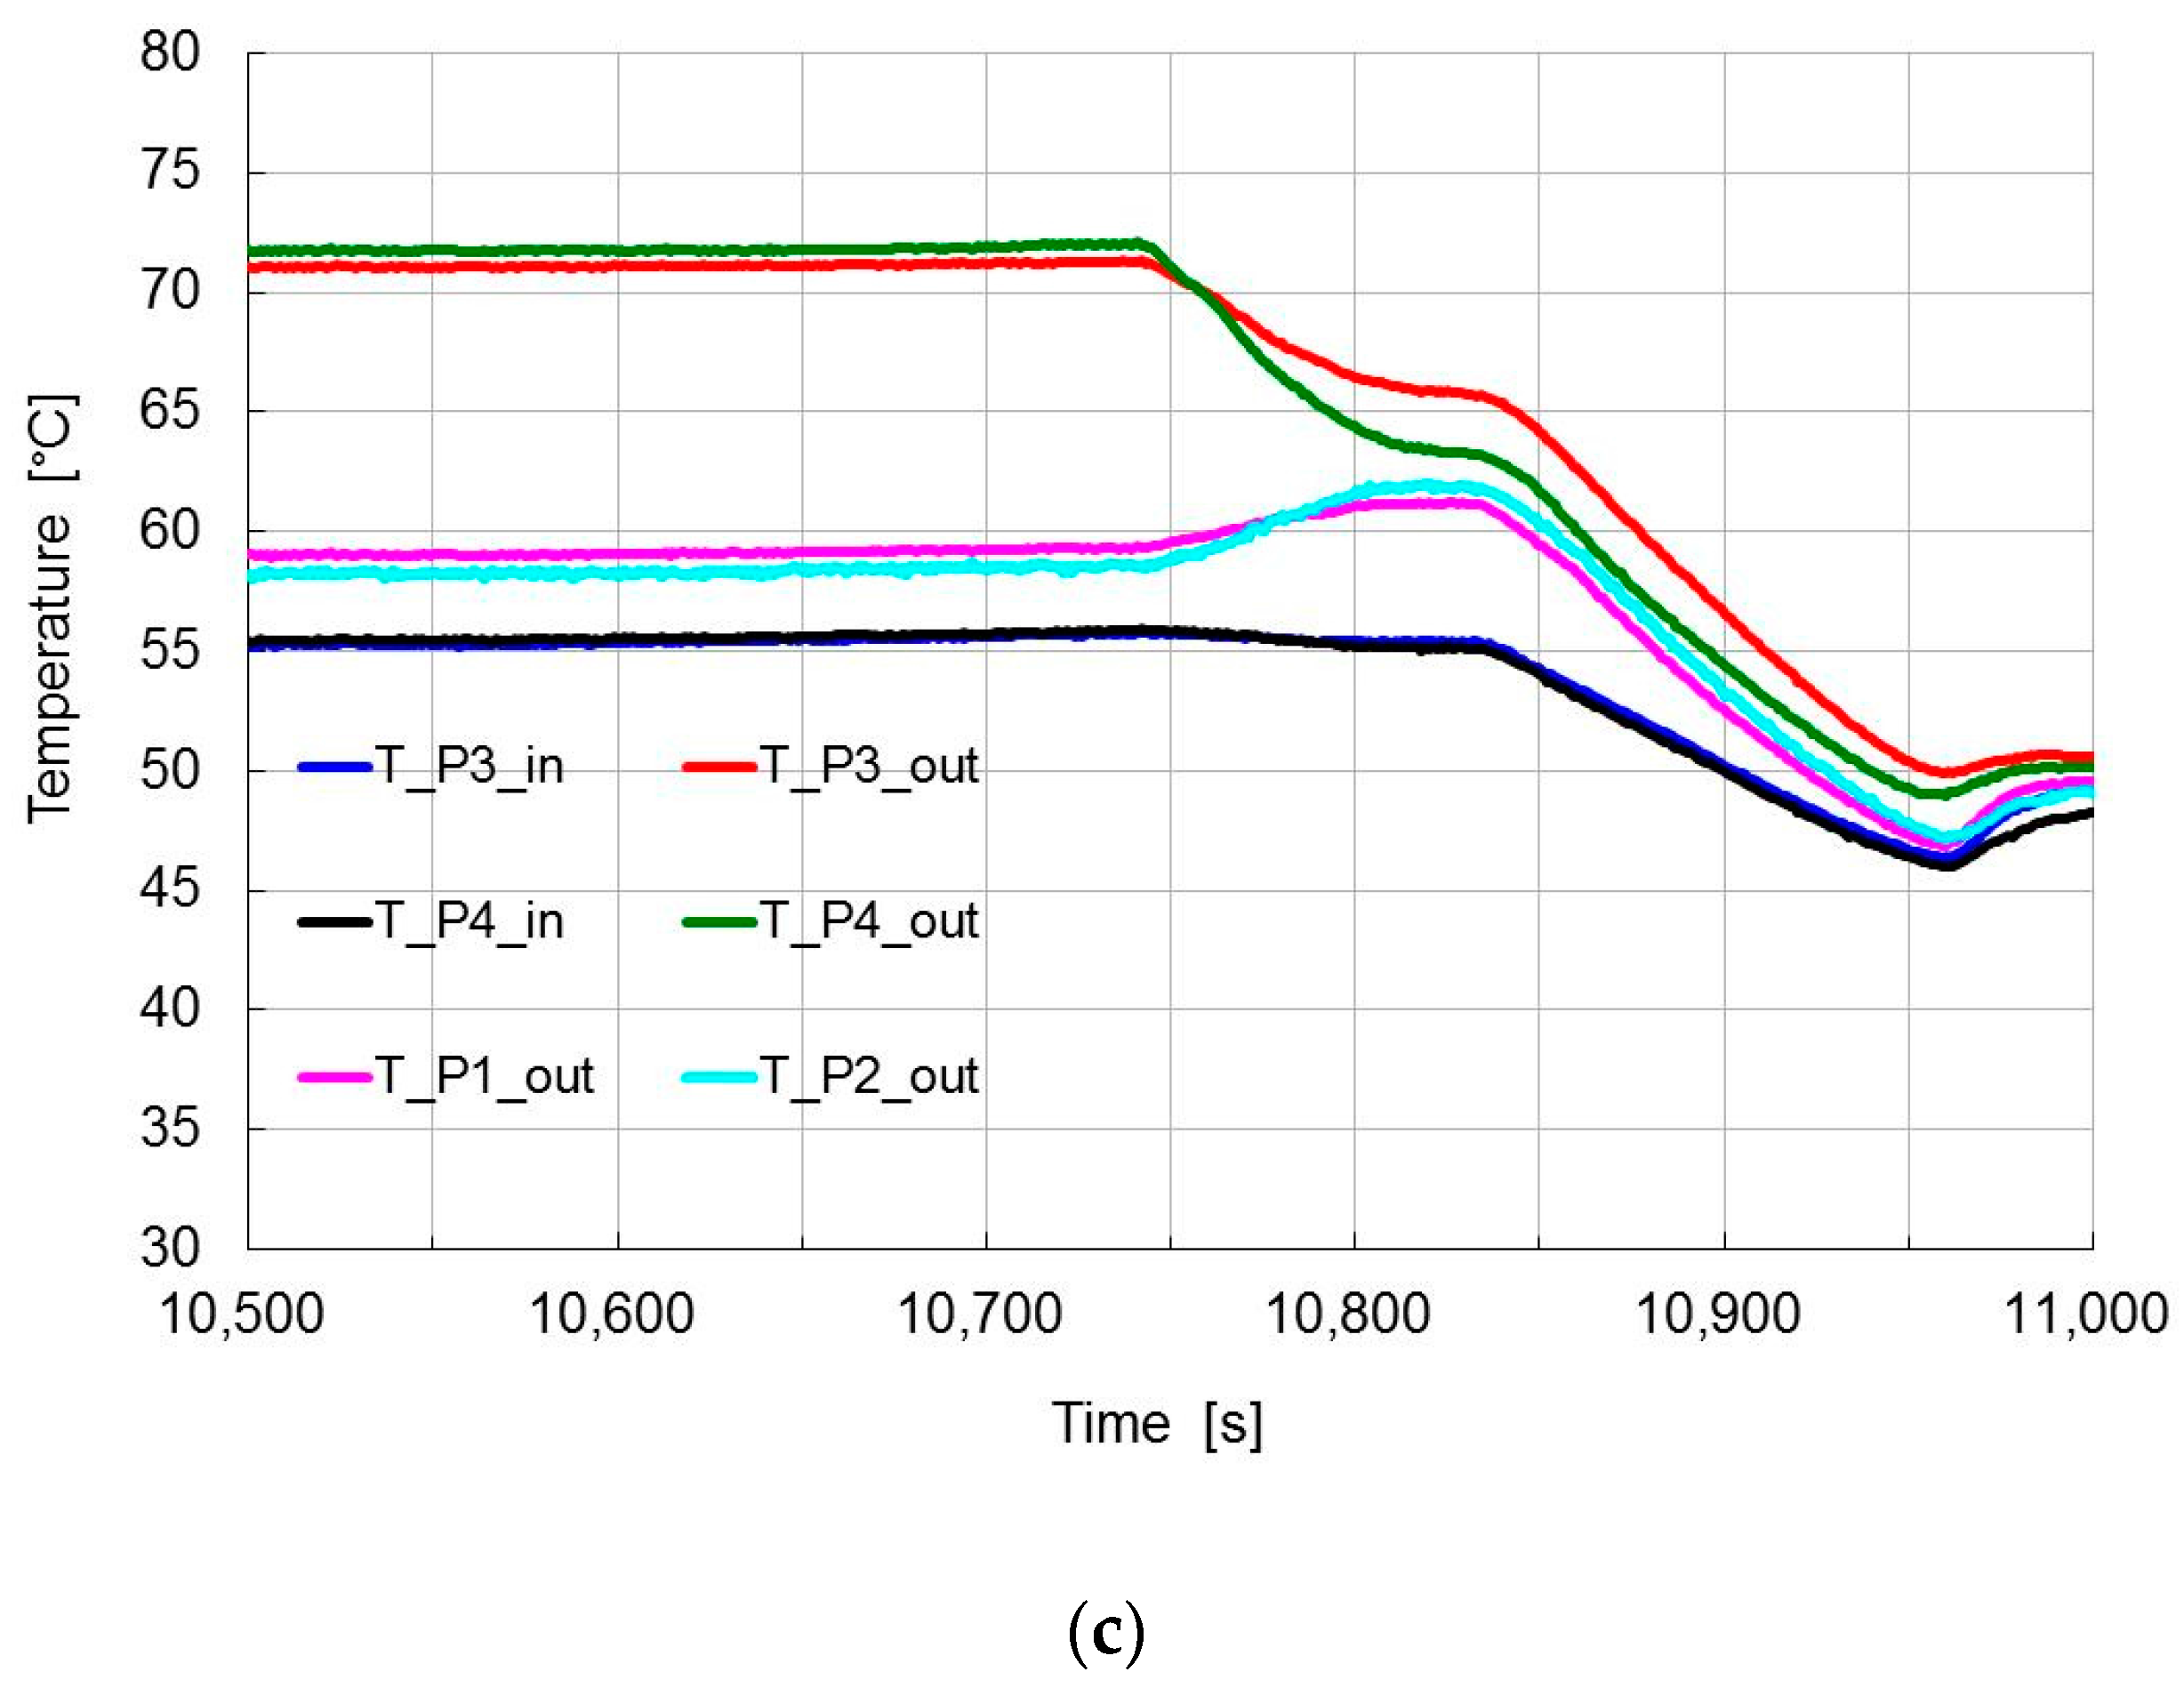
The situation at the end of the test is better evidenced in the diagrams of Figure 9. In this sample test, performed for investigating the performances of all systems, the load was decreased at first to a value close to zero, then increased a little and maintained constant when decreasing the speed. The final step was a contemporaneous decrease to zero of both quantities. Decreasing the load, the upper film thickness and the lower pads outlet temperature decreases while the upper pad outlet temperature increases as expected. When the speed decreases, the upper gaps increase, eccentricity increases, and upper and lower pad outlet temperatures tend to converge. When the static load goes to zero, the upper gaps increase significantly to maximum, eccentricity increases and all temperatures decrease to the inlet temperature. Note that all quantities are very stable before the first reduction of load.
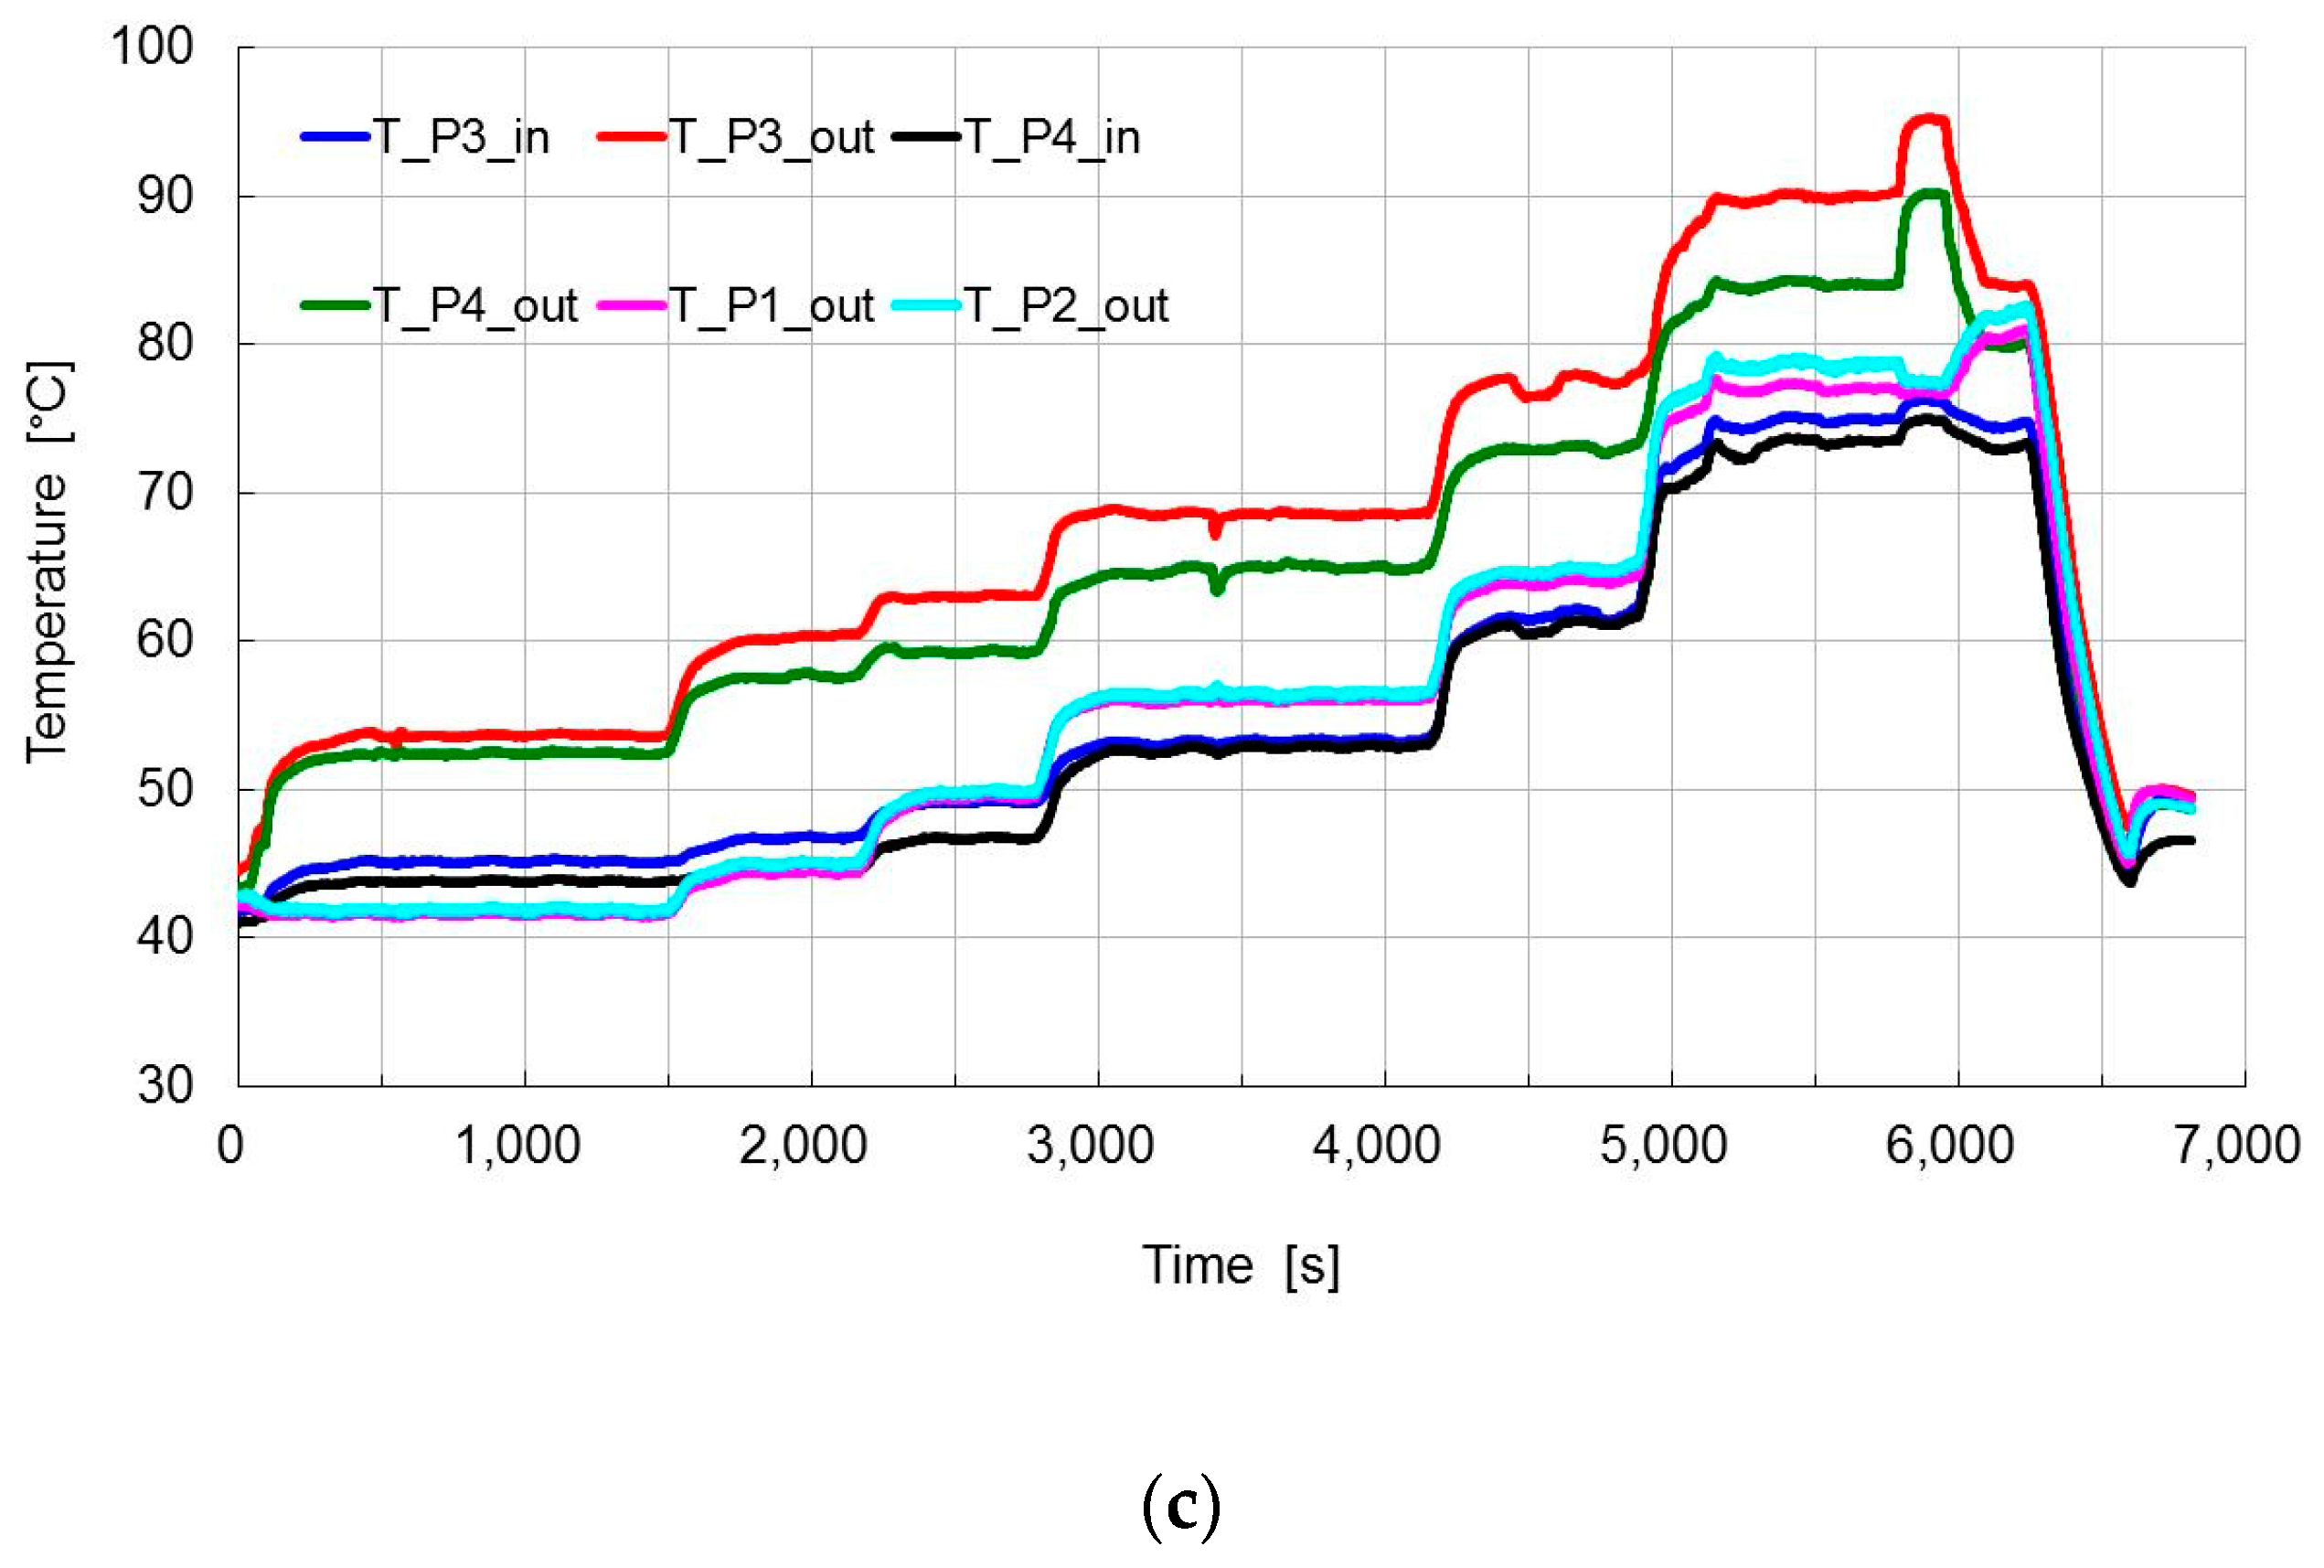
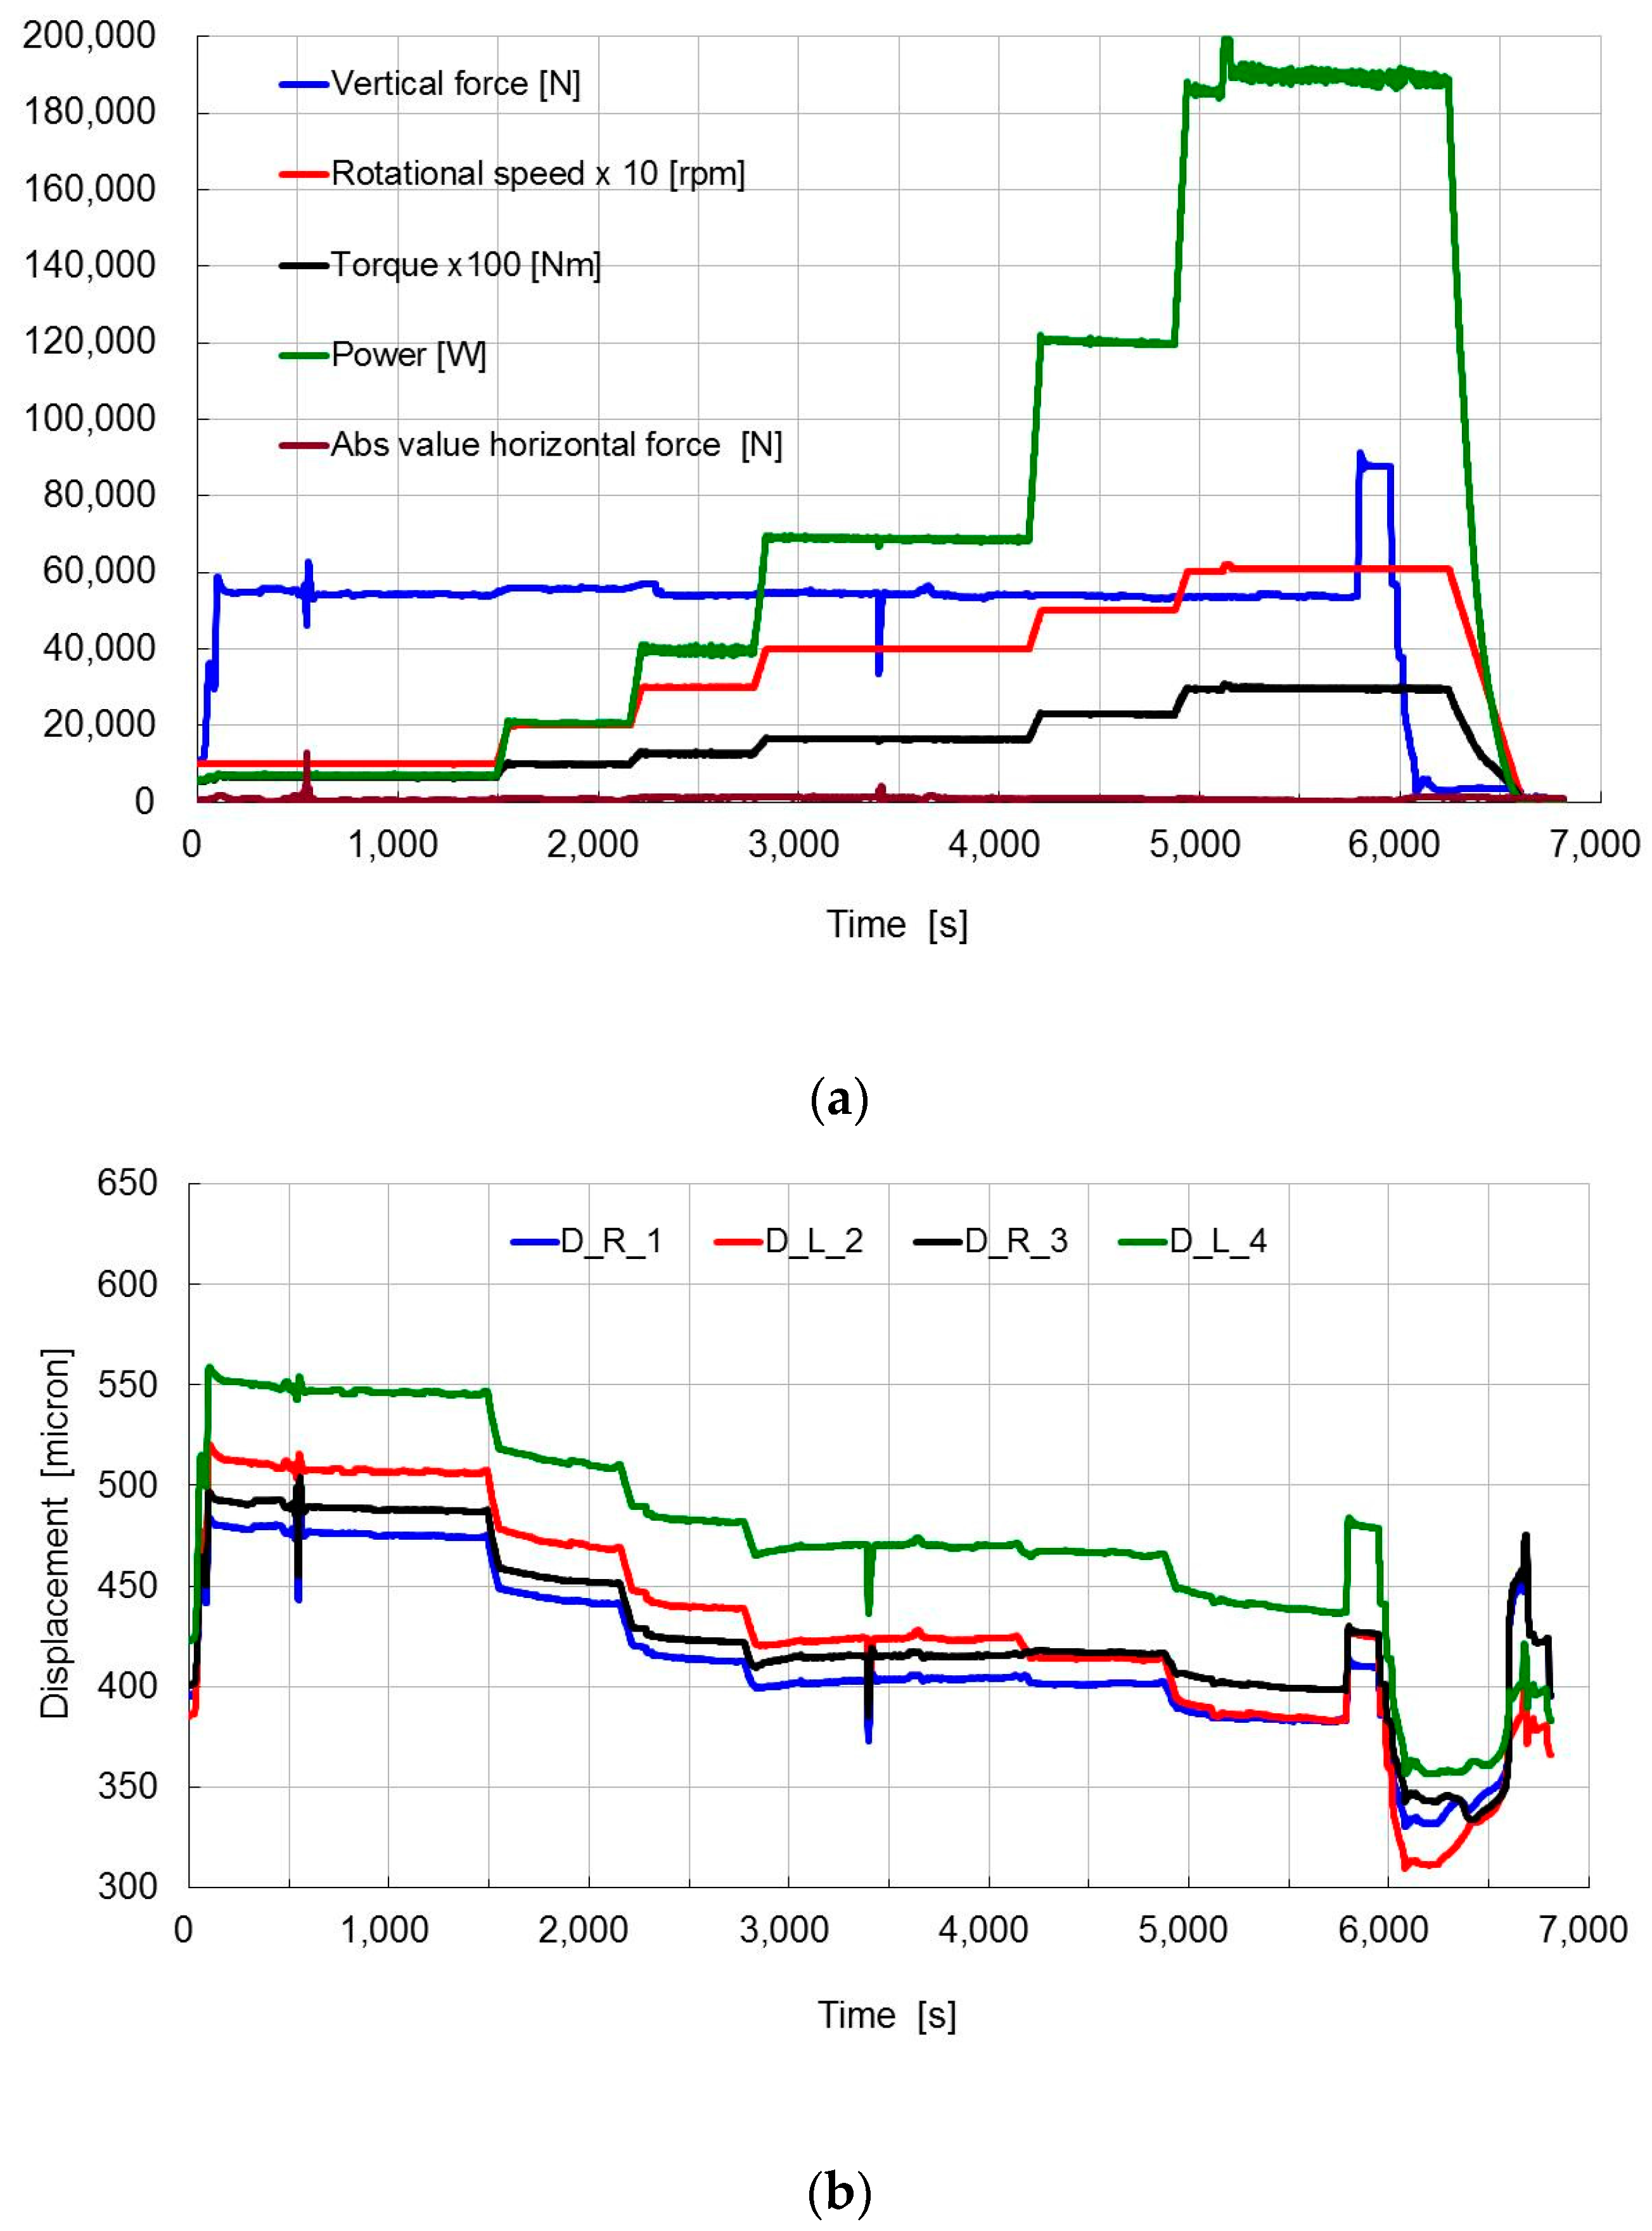
The influence of speed was investigated in another successive test with the same lubricant conditions and a load of 58 kN for most of the test time and a final step at about 90 kN (Figure 10). It can be noted that the fluctuation problems, present in the diagrams of Figure 4, were almost completely solved. The speed was increased with steps of 1000 rpm. As seen in the previous example, each step of increasing speed corresponds to a decrease in the measured displacements, related to an eccentricity reduction, and to an increase of temperatures. It is interesting to note that the temperature steps should always increase by increasing the speed, but this did not happen for the speed step from 3000 to 4000 rpm due most probably to the transition from laminar to turbulent flow conditions.
The increase of load around 5800 s is associated with an increase of the upper displacements and an increase of both inlet and outlet temperatures of the lower pads but a decrease of temperatures of the upper pads, as expected.

3.2. Identification Results

The dynamic investigation was performed by applying forces containing one (“single tone” test) or more (“multitone” test) frequency components.
Data of all forces and displacements measured along the U and V directions shown in 
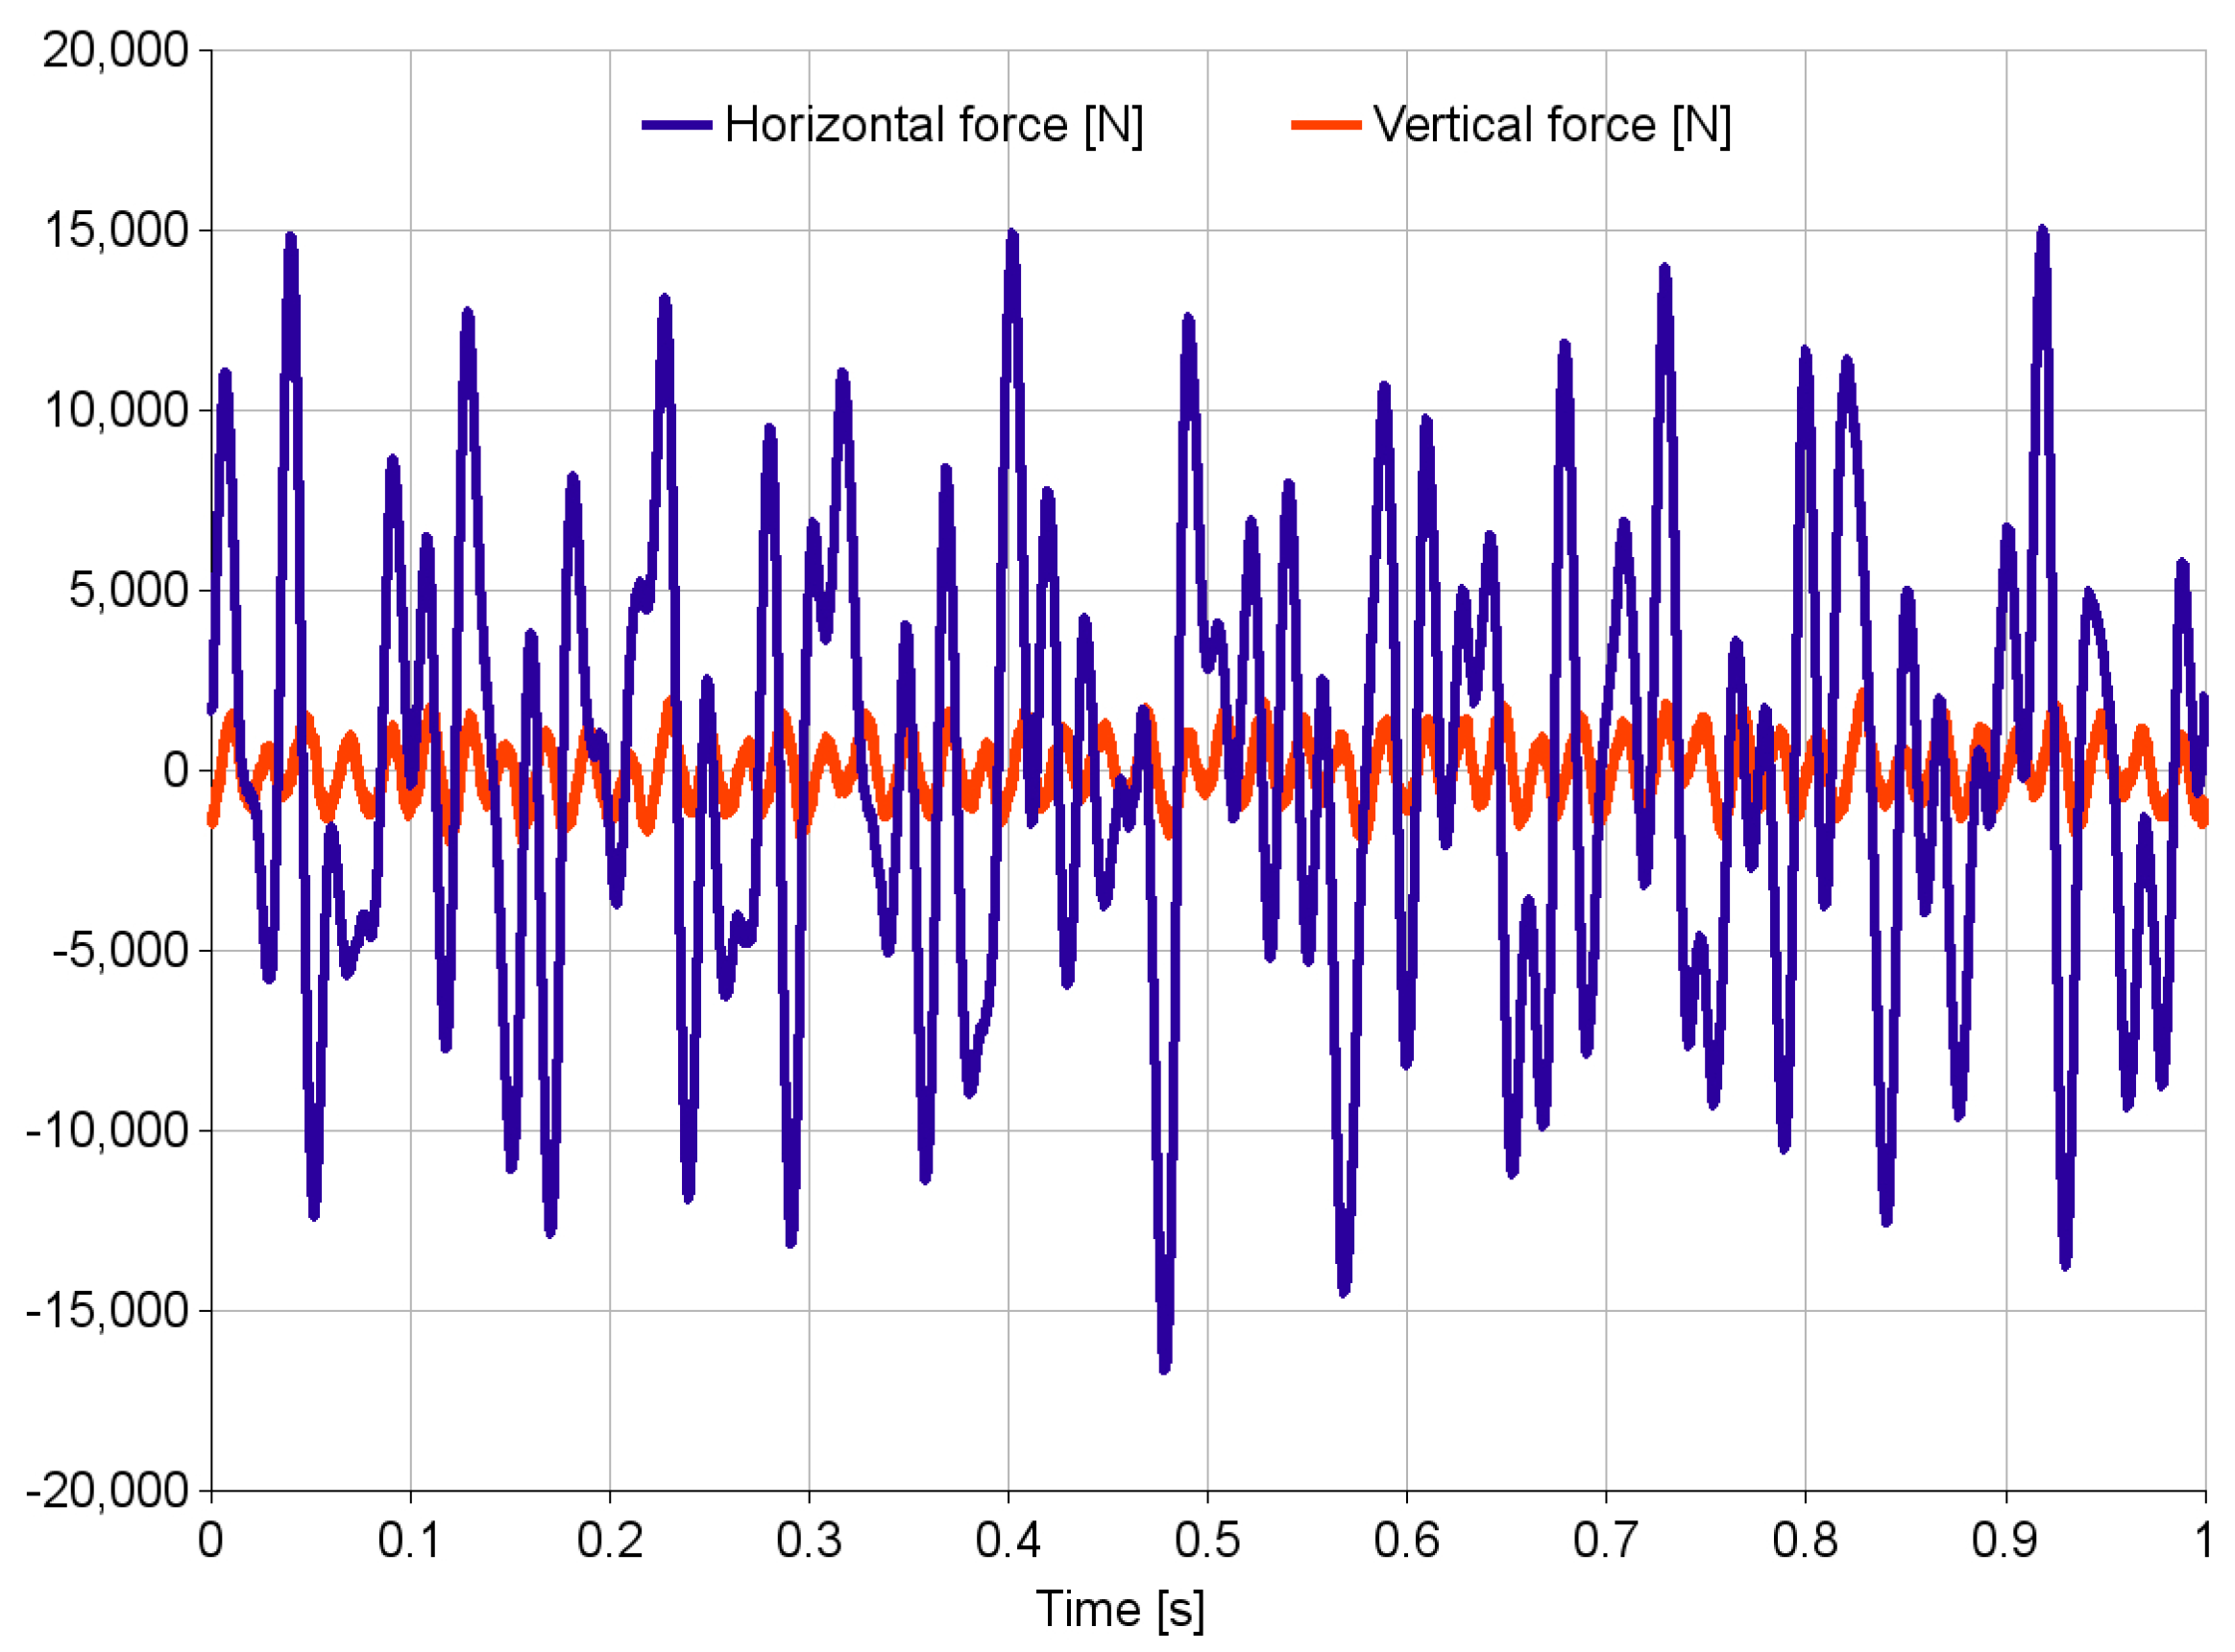
Figure 2 are then combined in order to obtain the corresponding values along the vertical and horizontal directions. An example of the total forces acting along the horizontal and the vertical directions during an antiphase test is shown in Figure 11. Data refer to the working conditions of 3000 rpm and 58 kN with a multitone excitation of nominal amplitude of 4 kN at 10, 22, 33, 42 and 58 Hz.
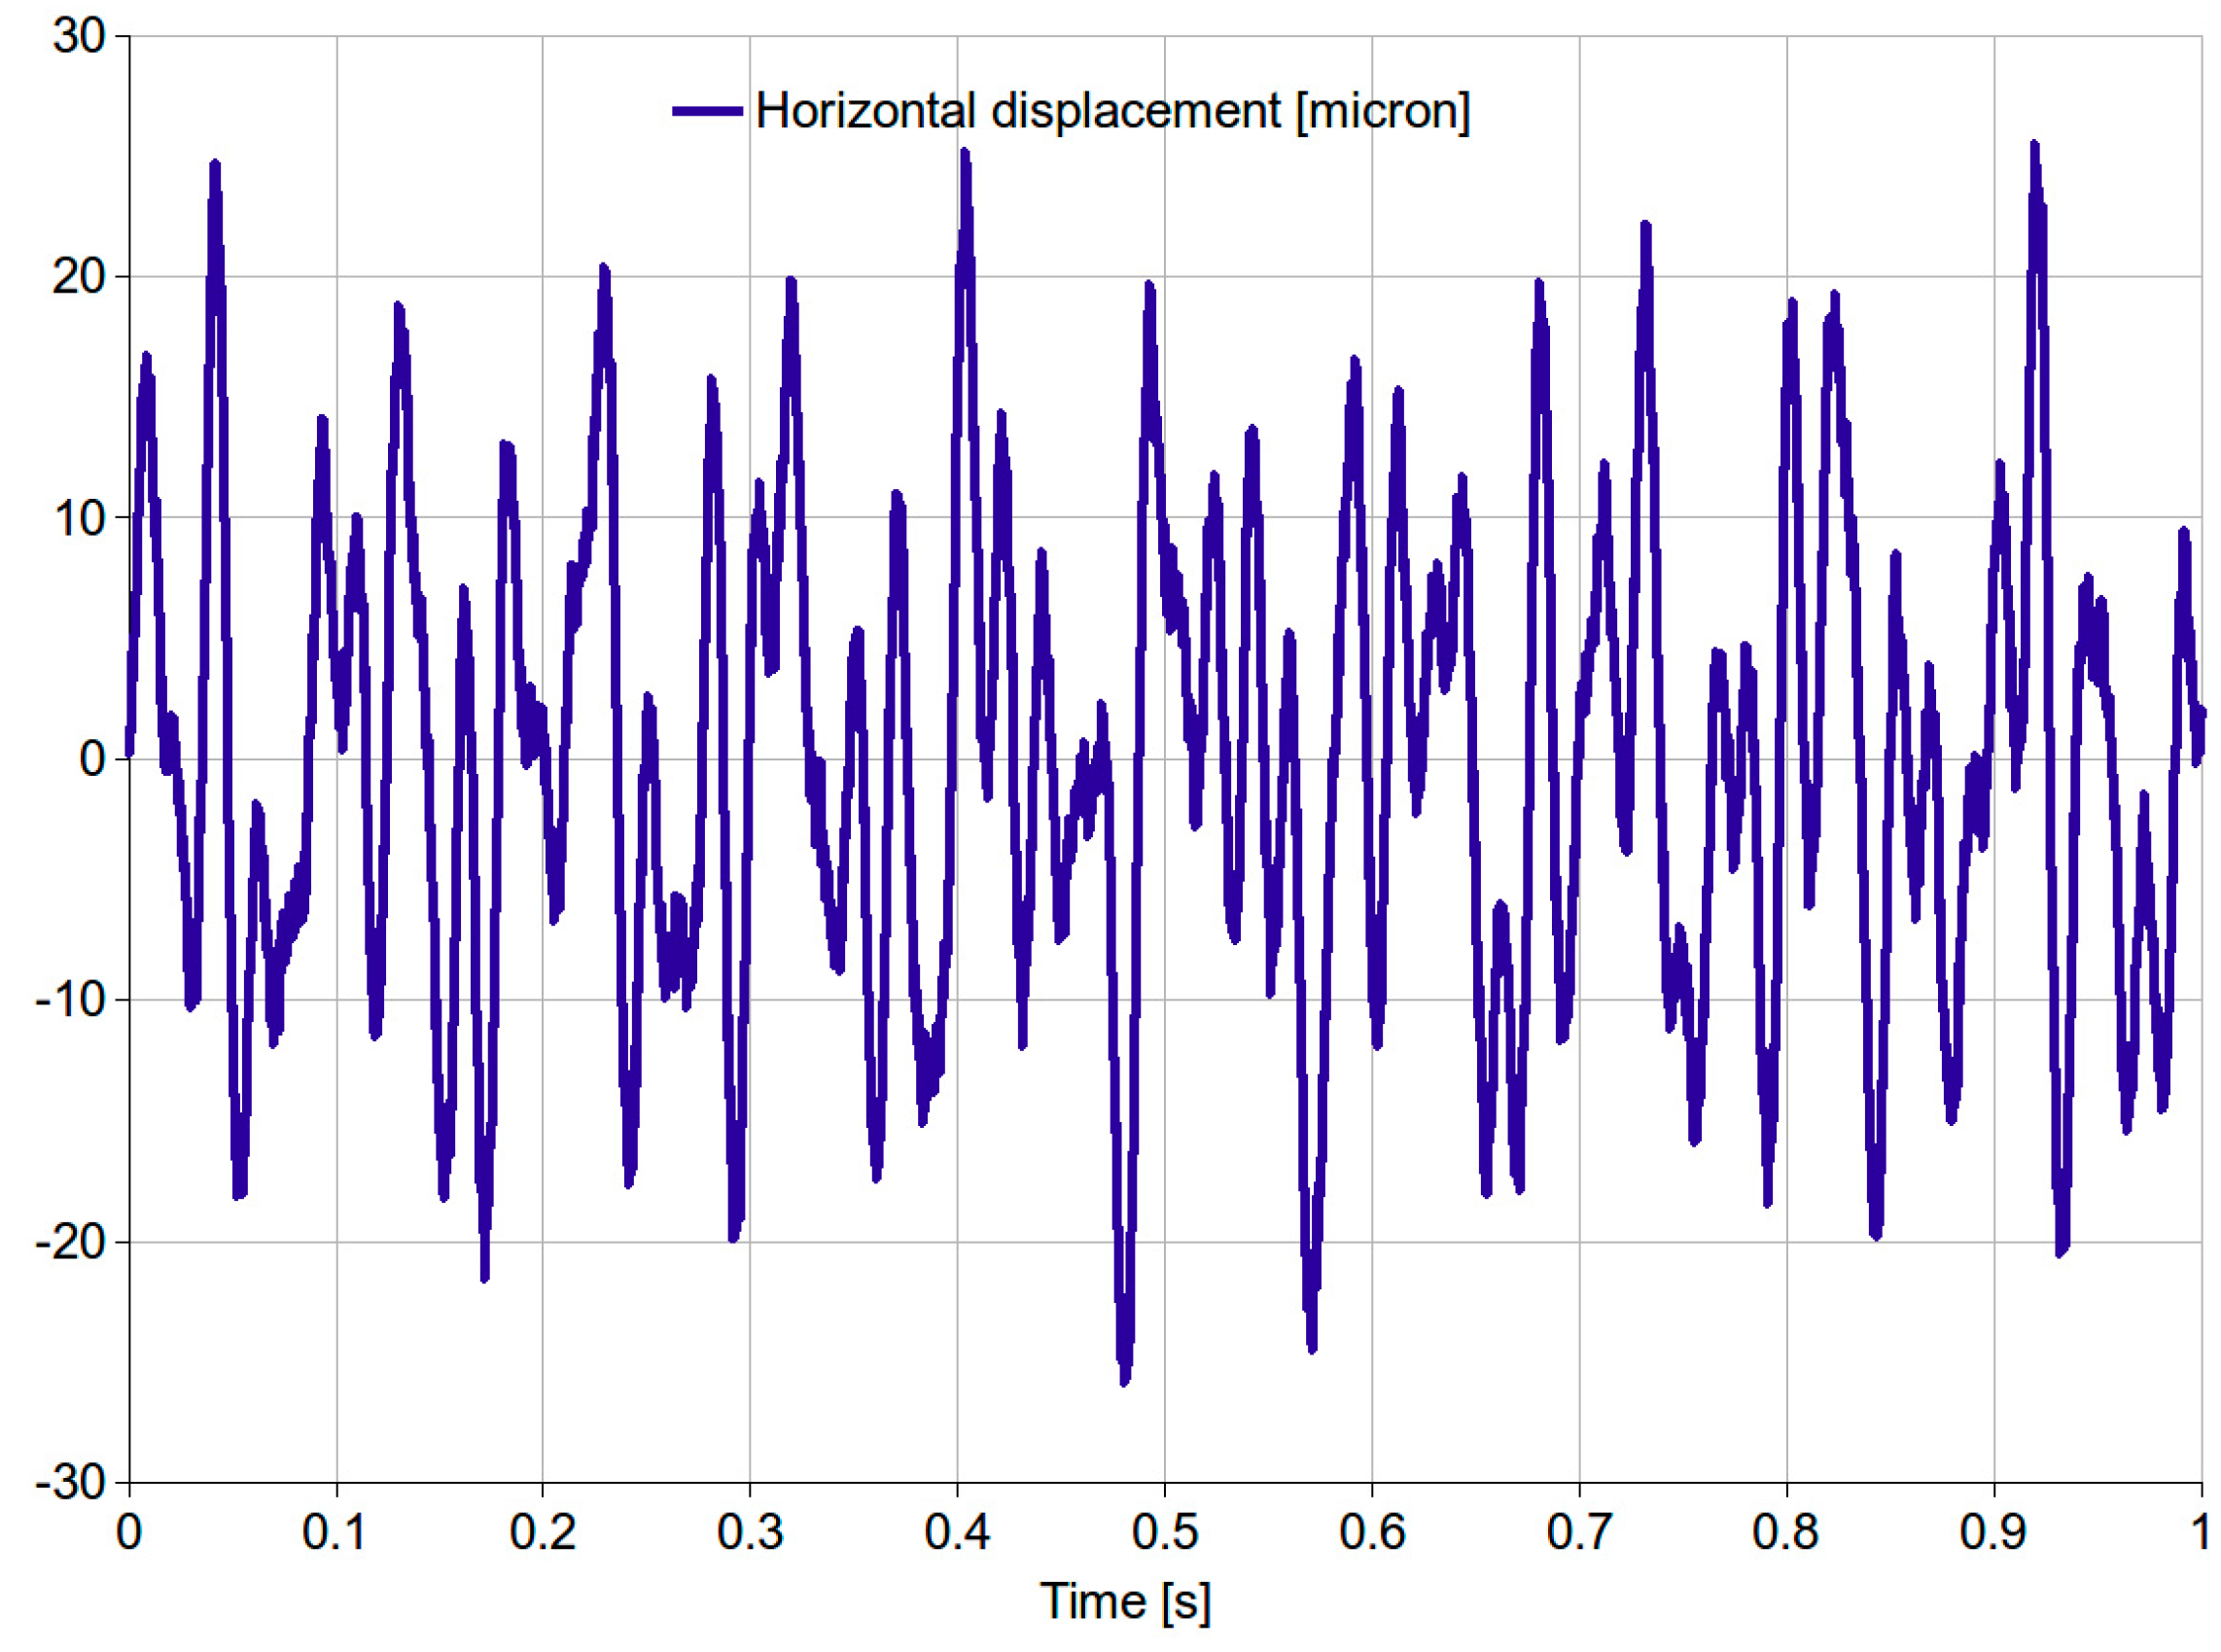
It can be noted that even in the antiphase test, with a nominal horizontal excitation force, small vertical forces are present in which the contribution of rotor unbalancing can be recognized. The corresponding displacement measured along the horizontal direction is shown in Figure 12.
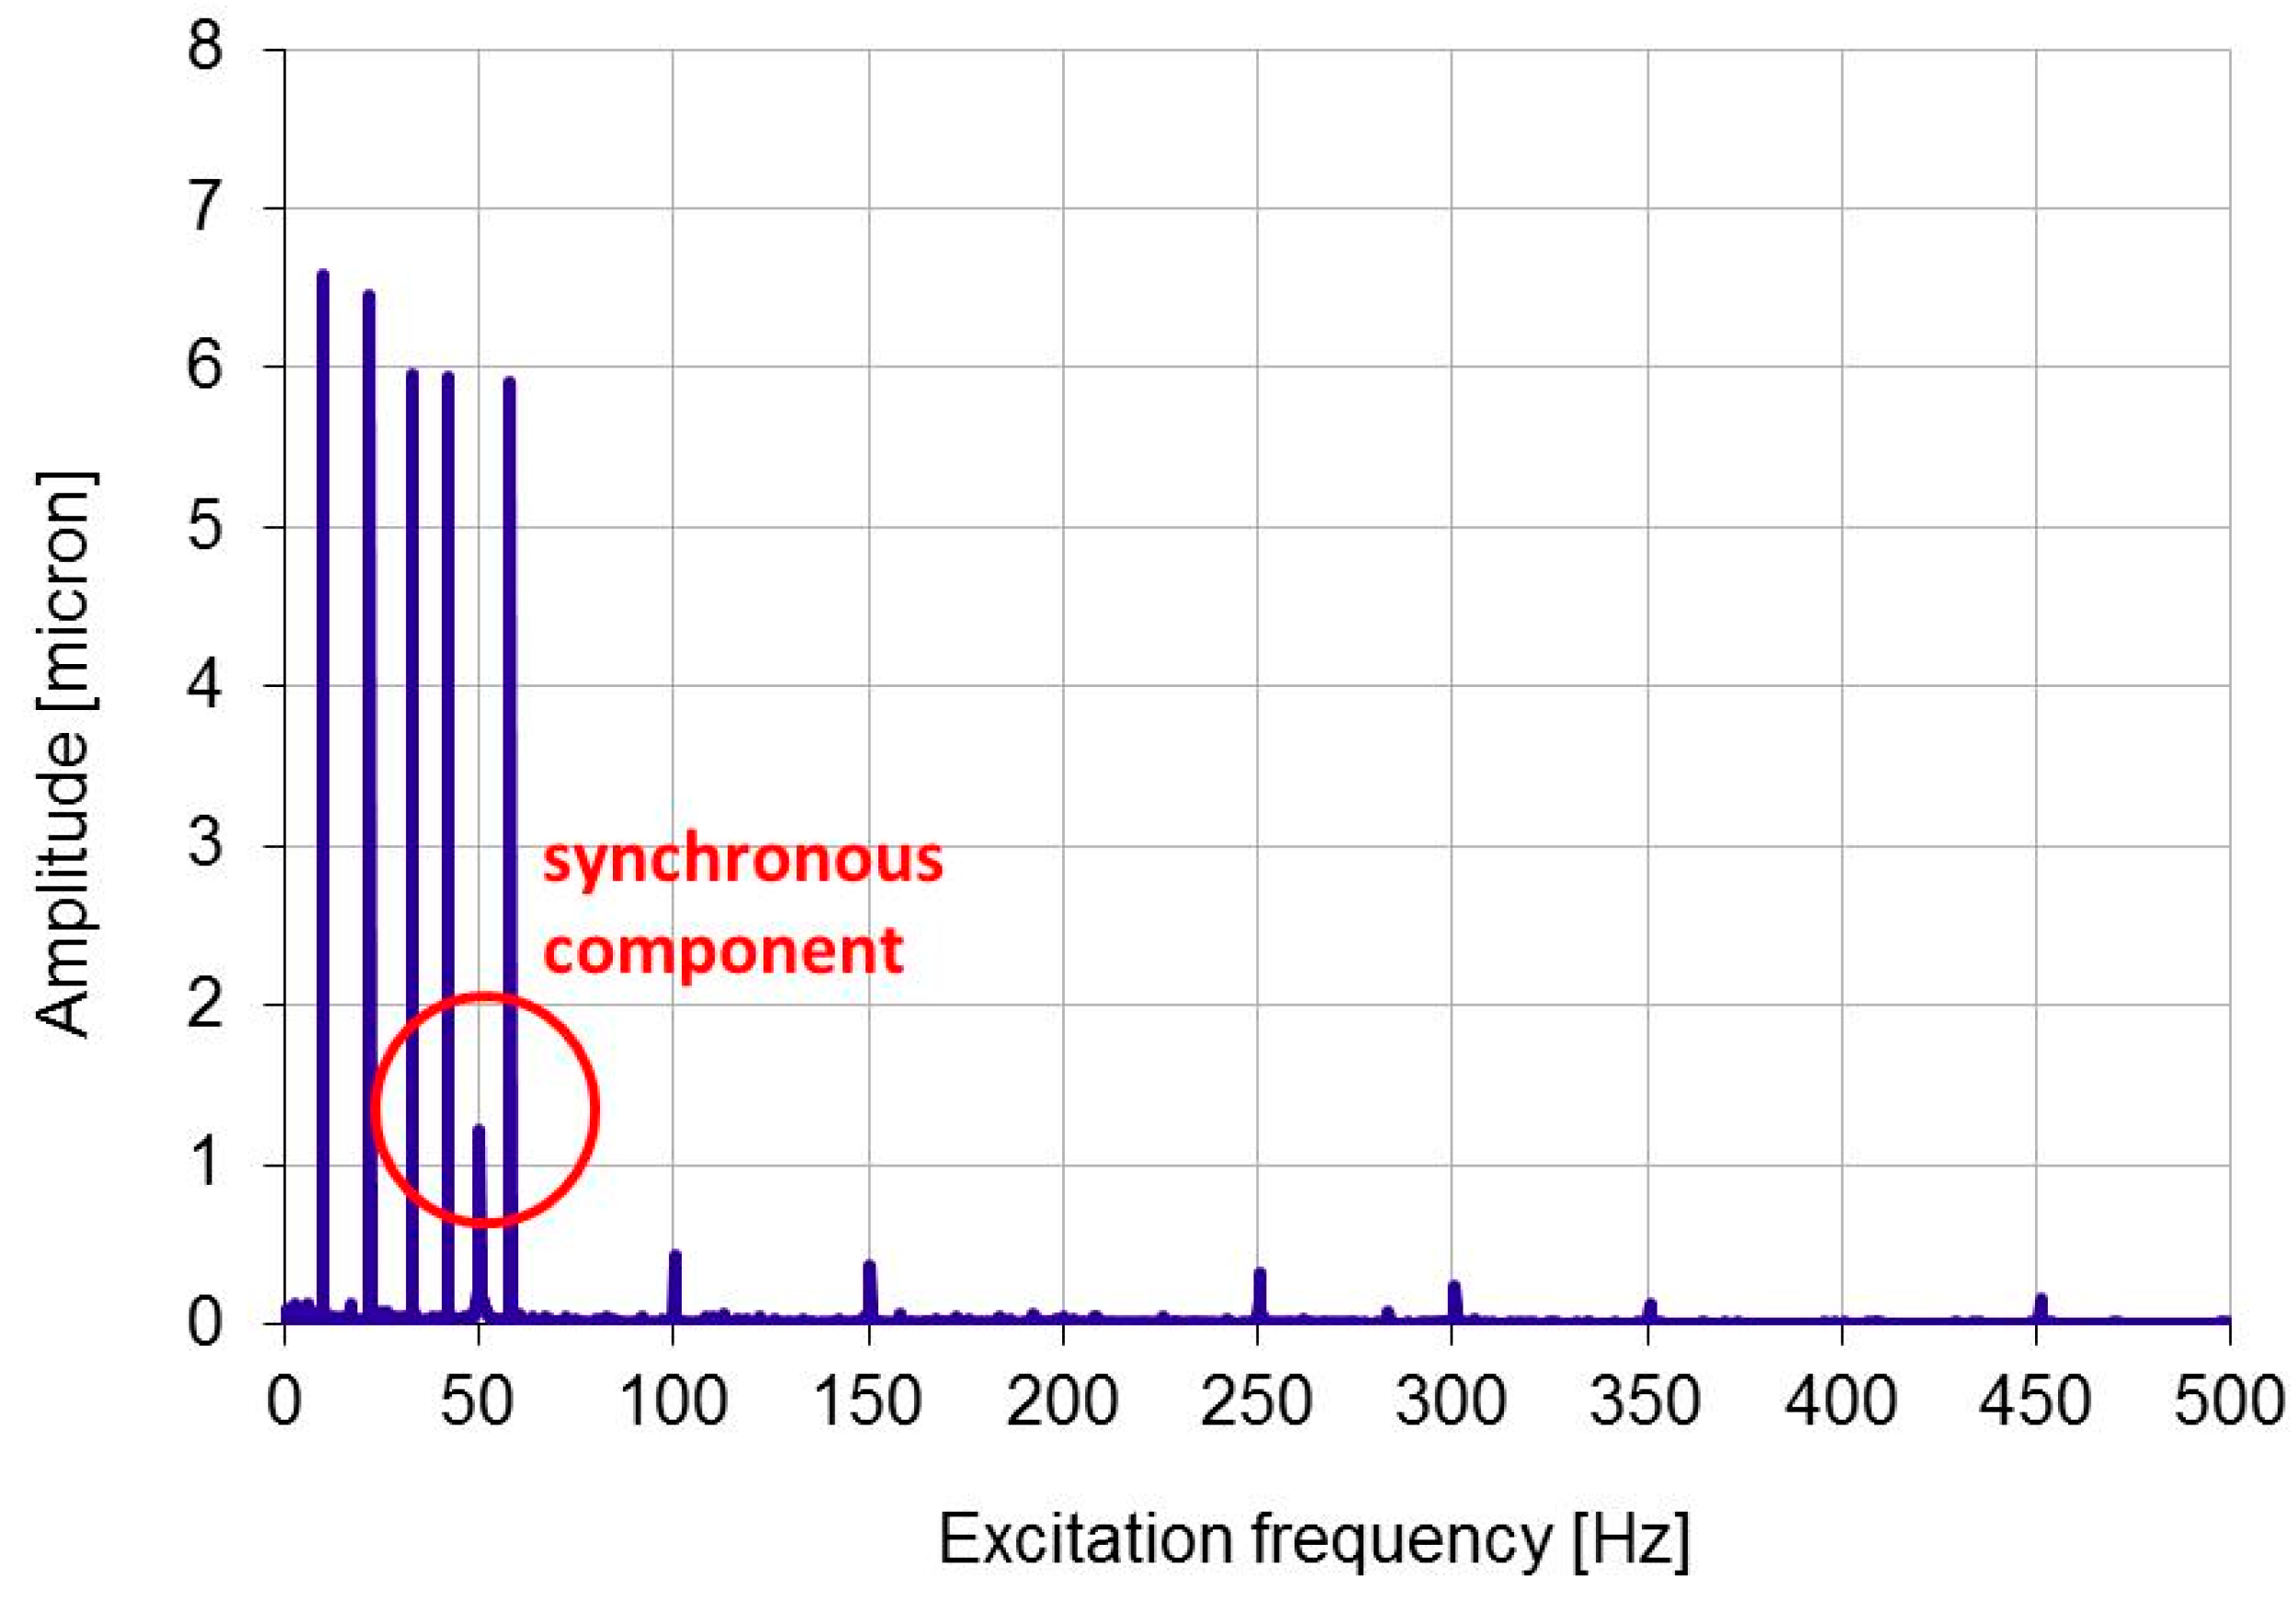
It is evident that the time dependent data cannot be used for identification purposes and processing in the frequency domain is necessary. 
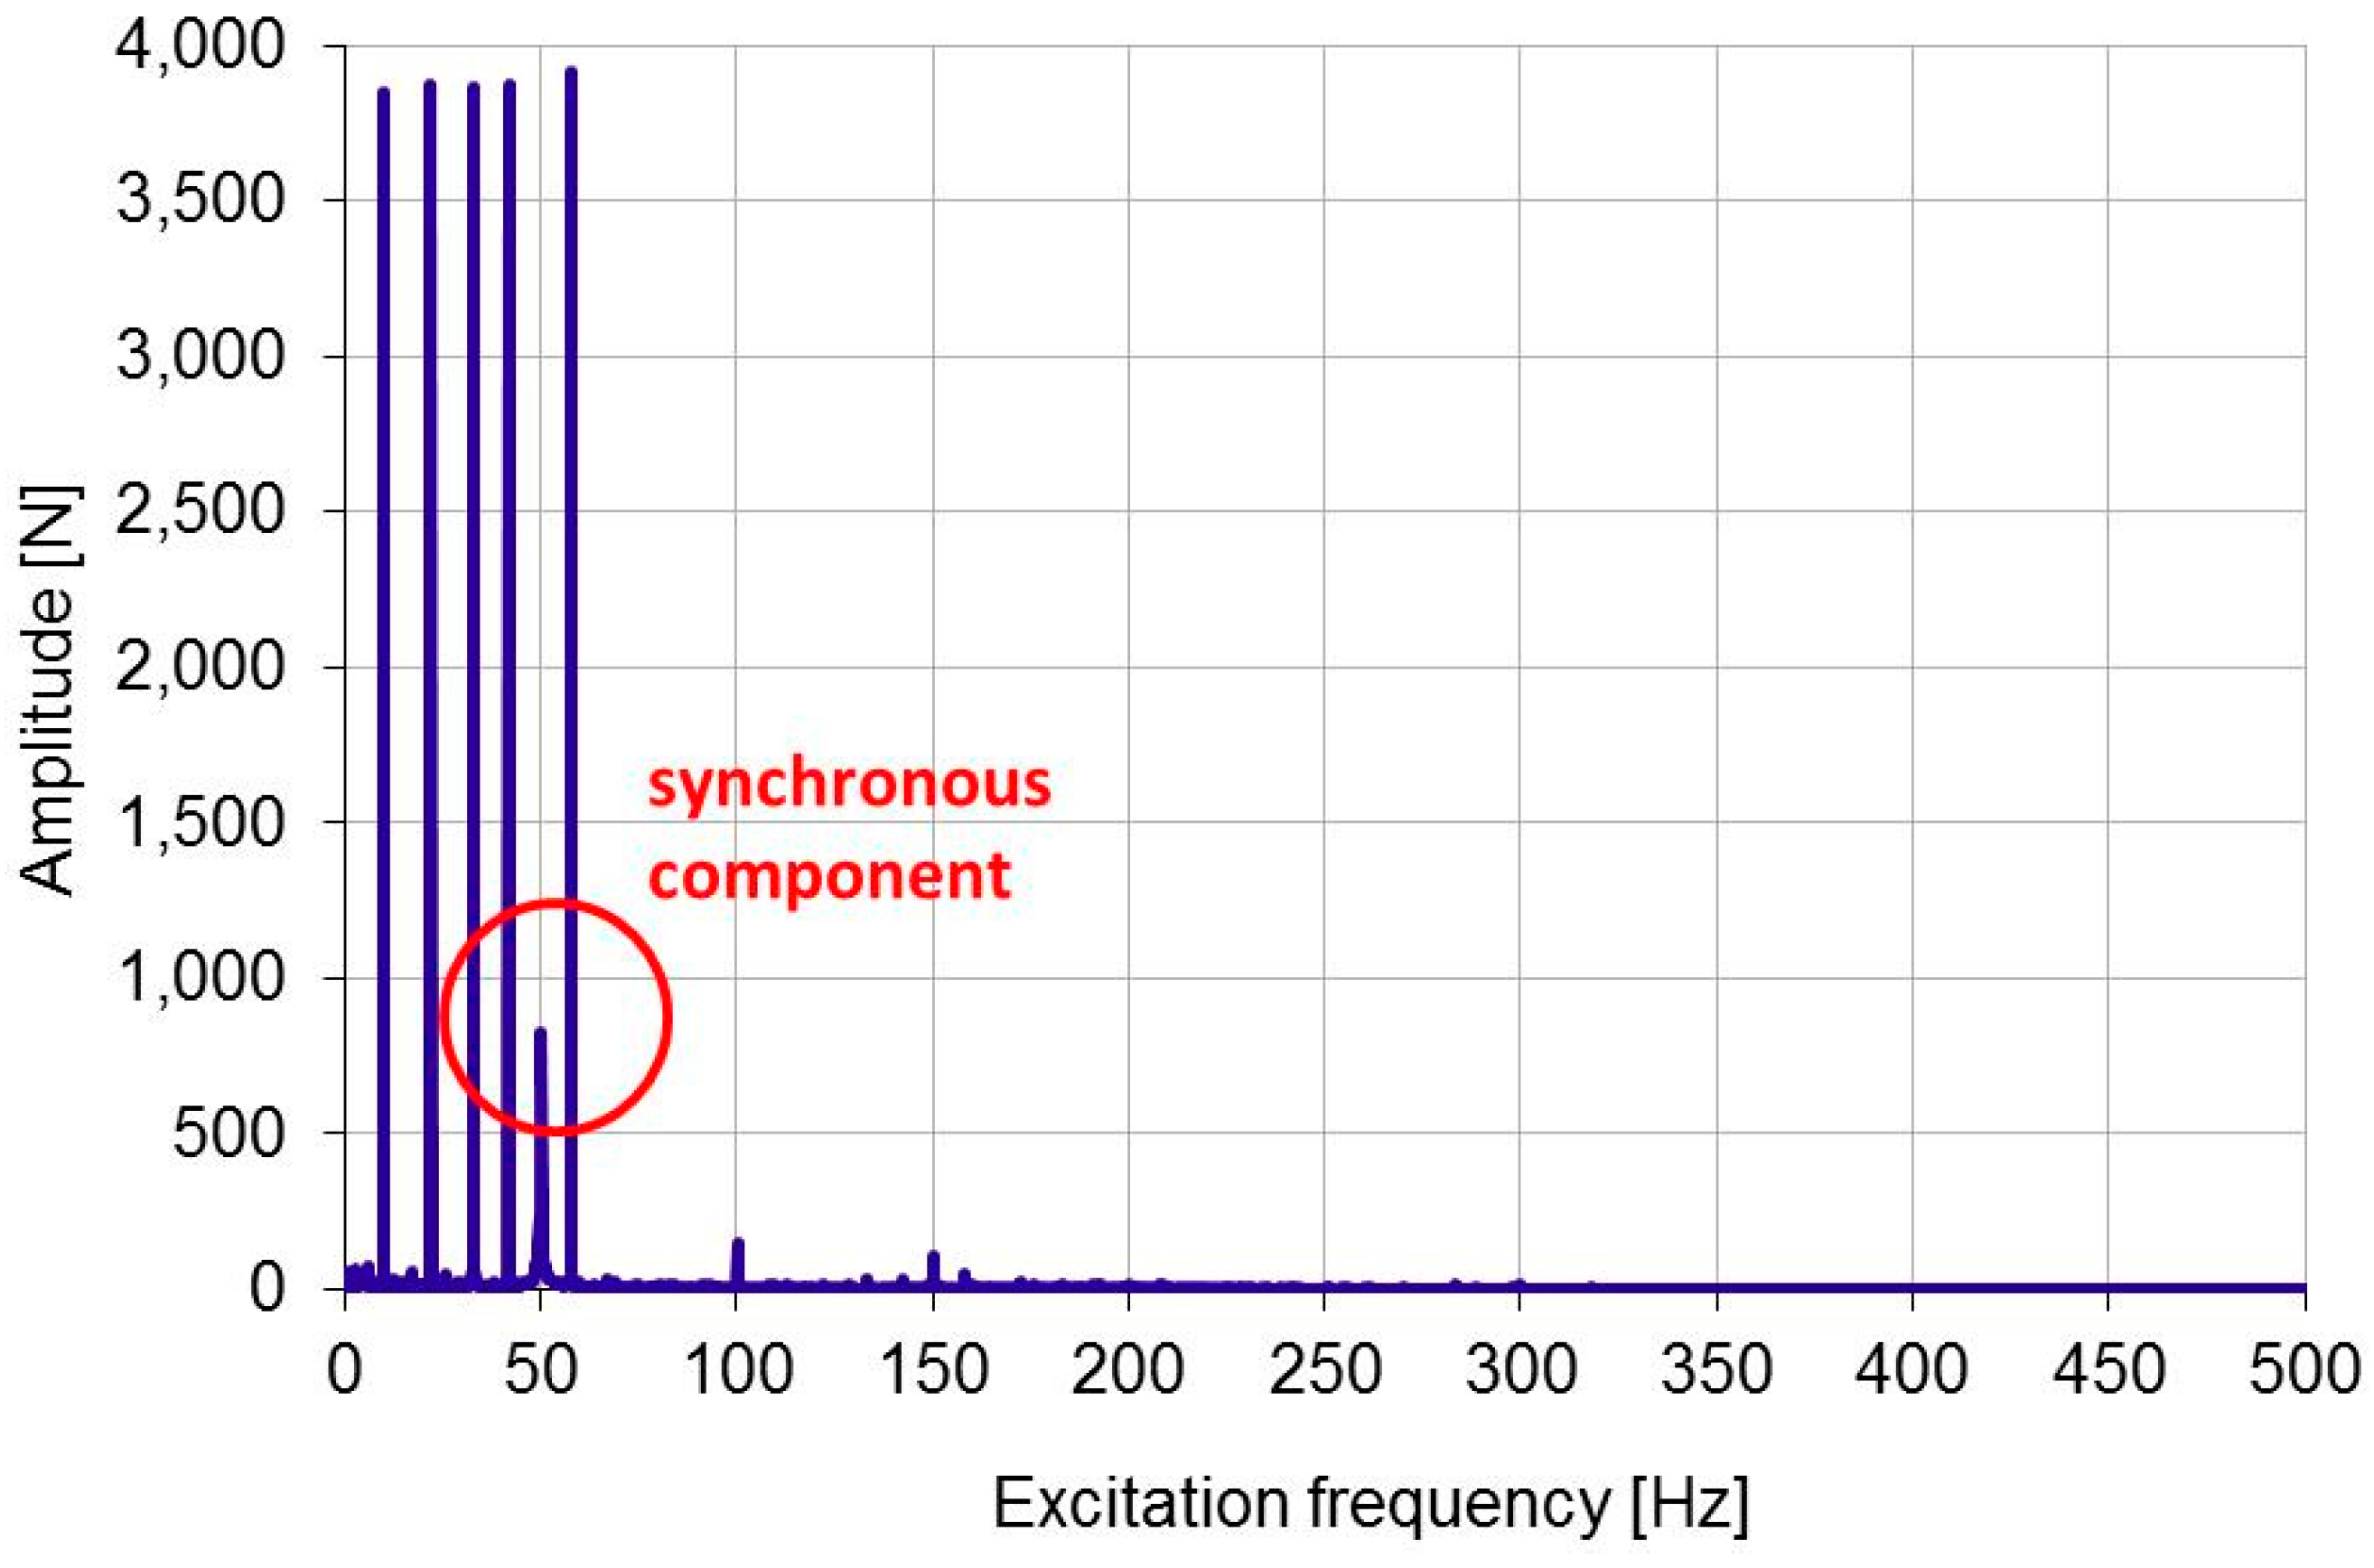
Figure 13 shows the Fast Fourier Transform (FFT) of the data of Figure 11 and Figure 14 of Figure 12. Besides the imposed excitation frequencies the FFT shows the synchronous component due to the shaft unbalance.
The dynamic coefficients can be finally evaluated by using the classical methodology described for instance in [11,
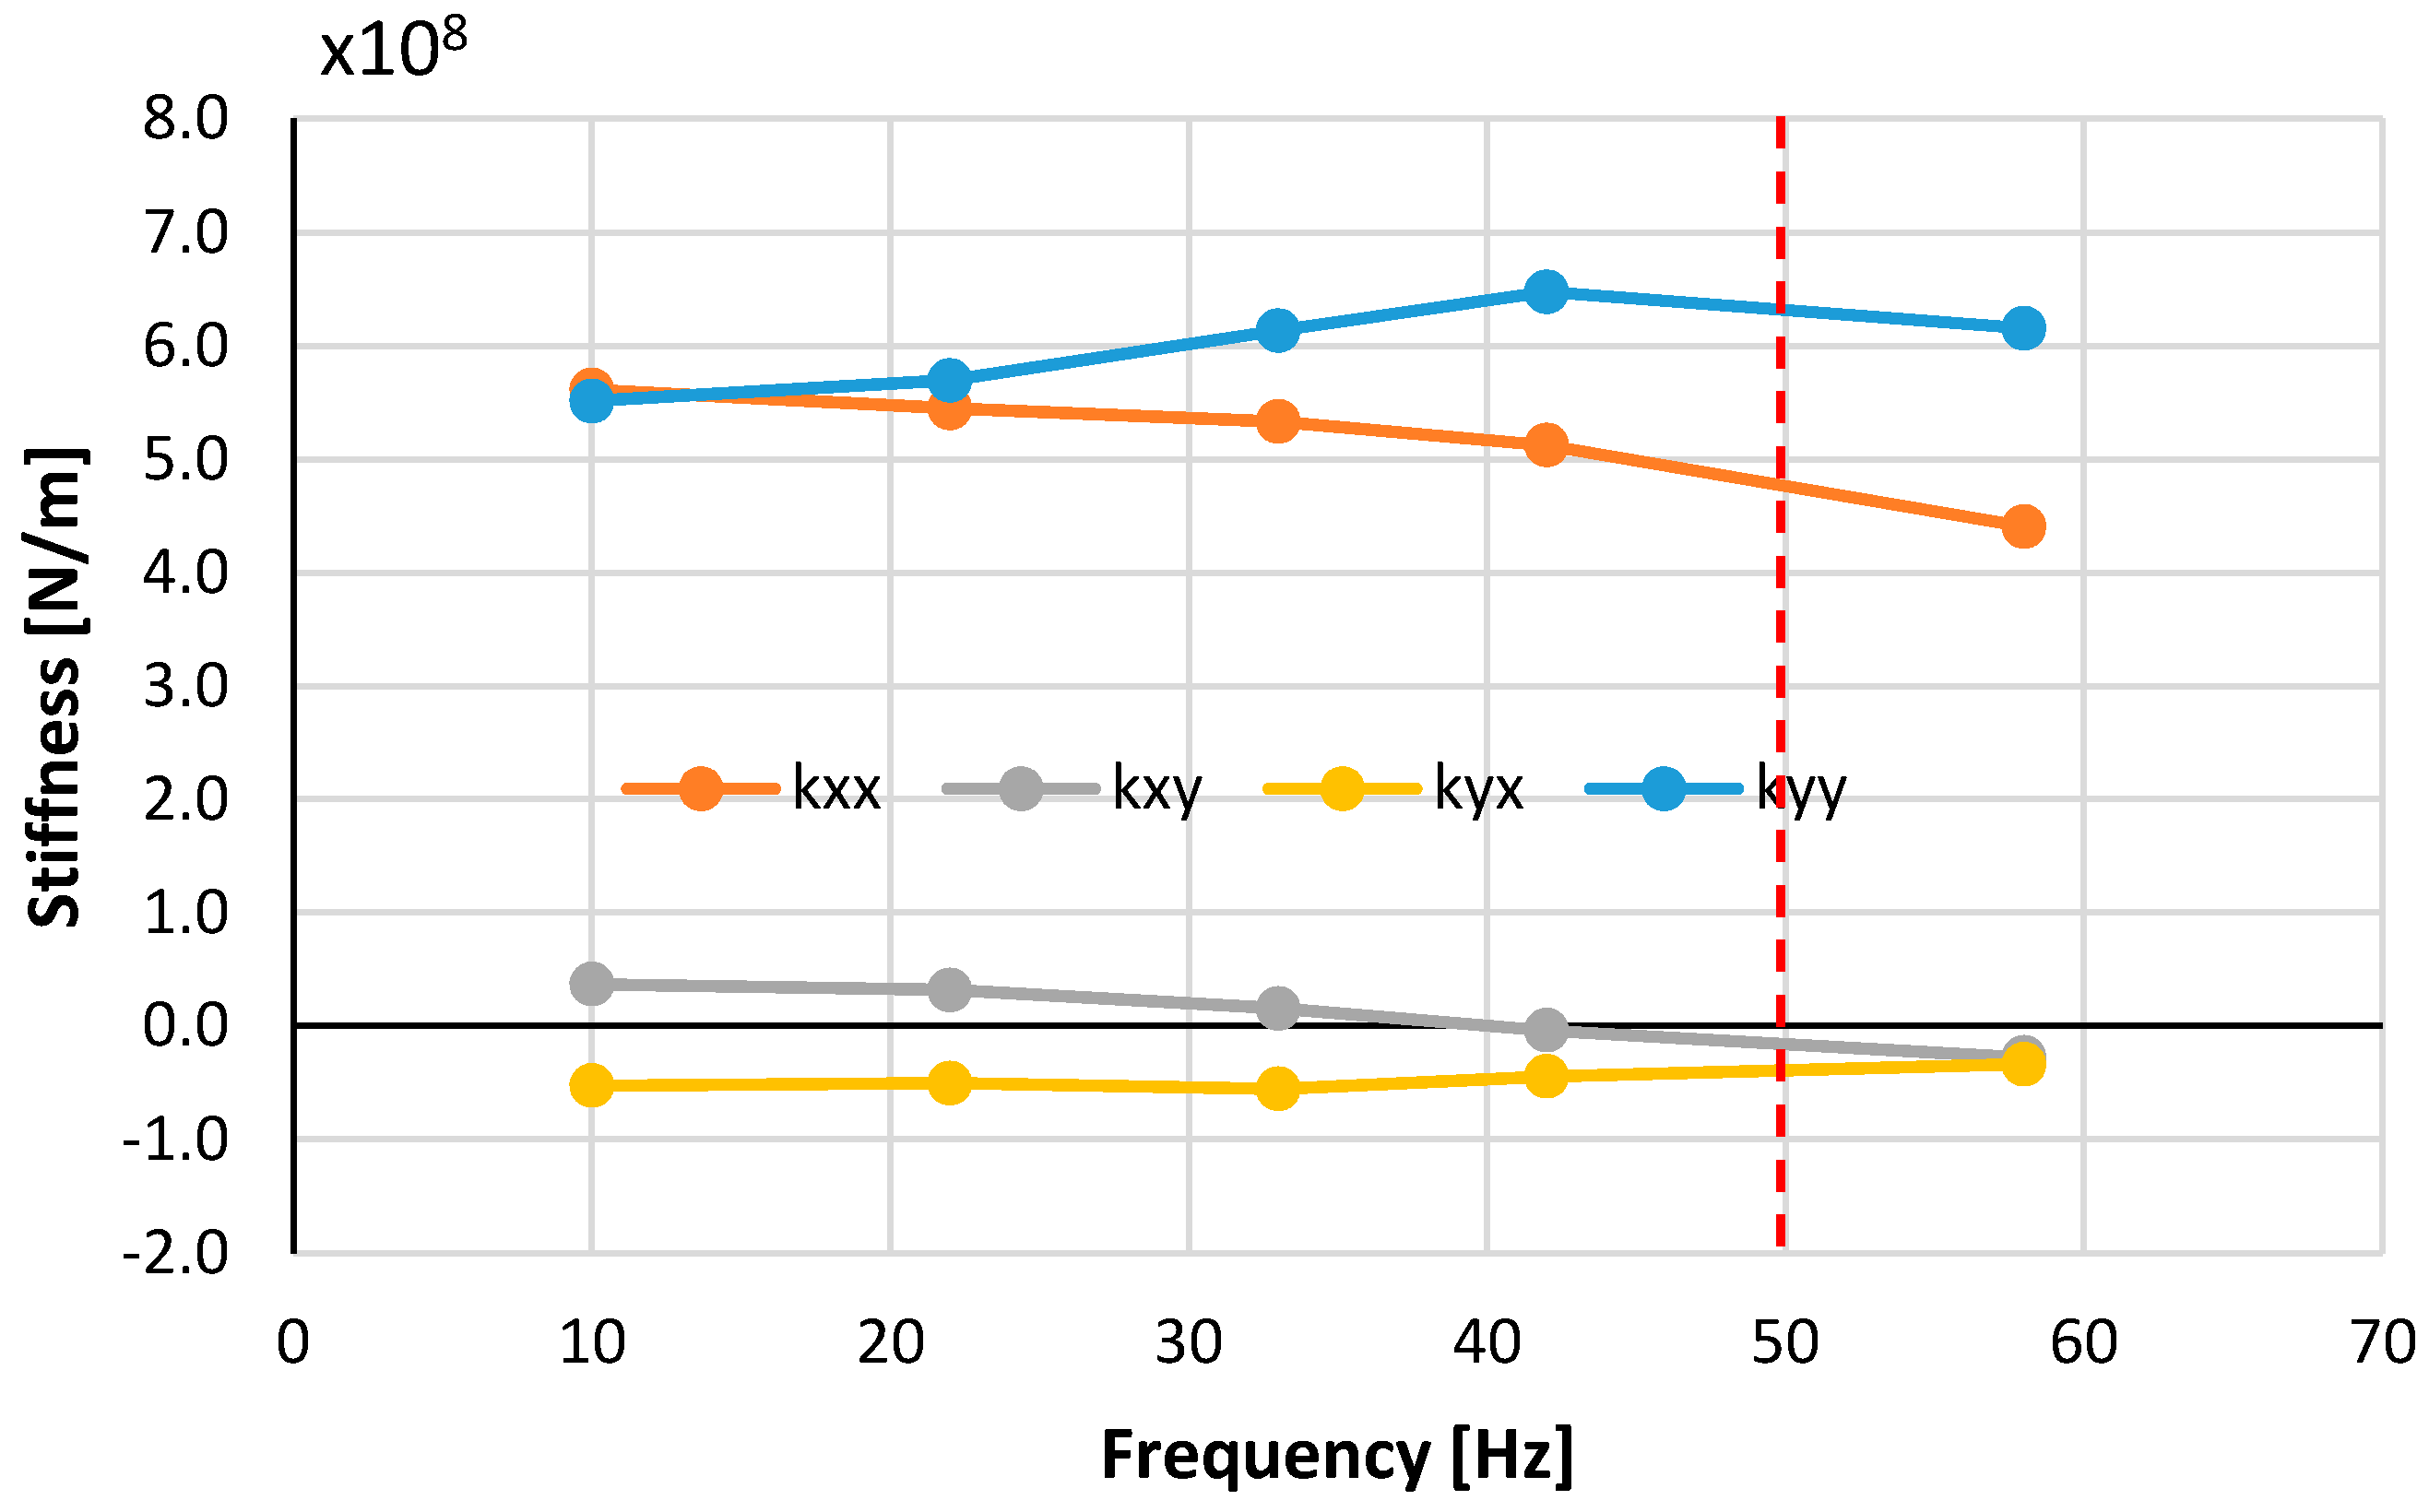
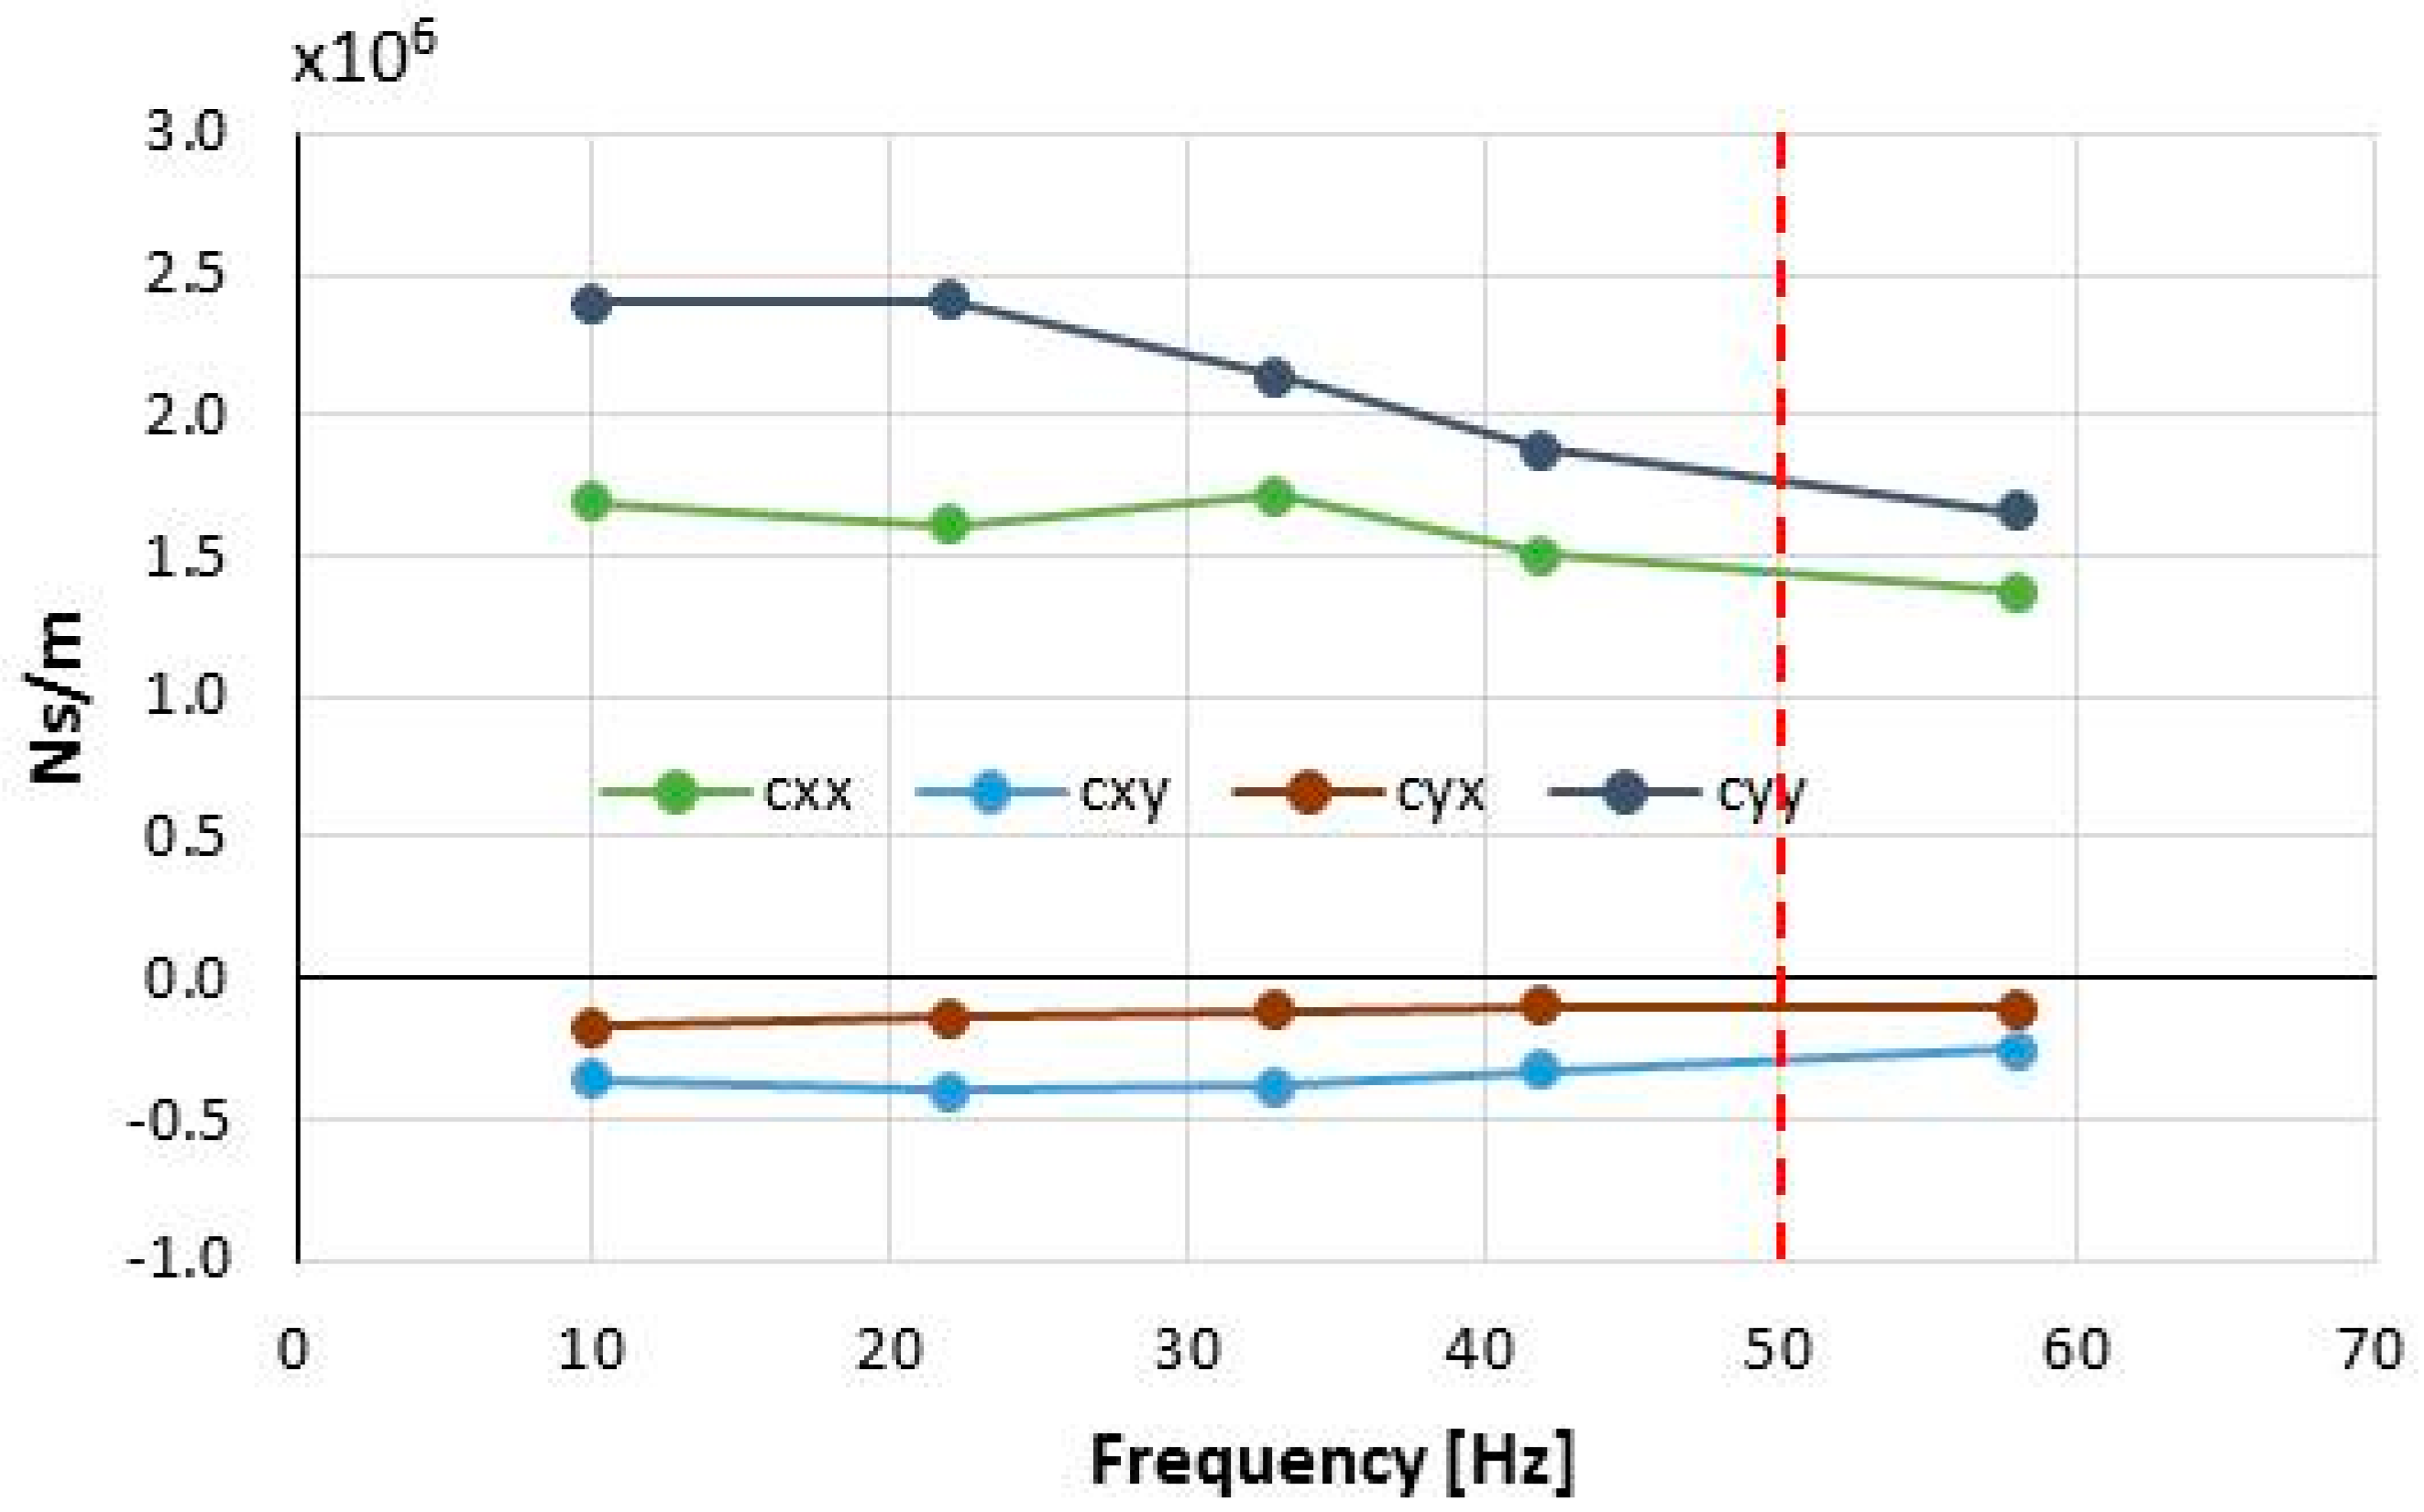
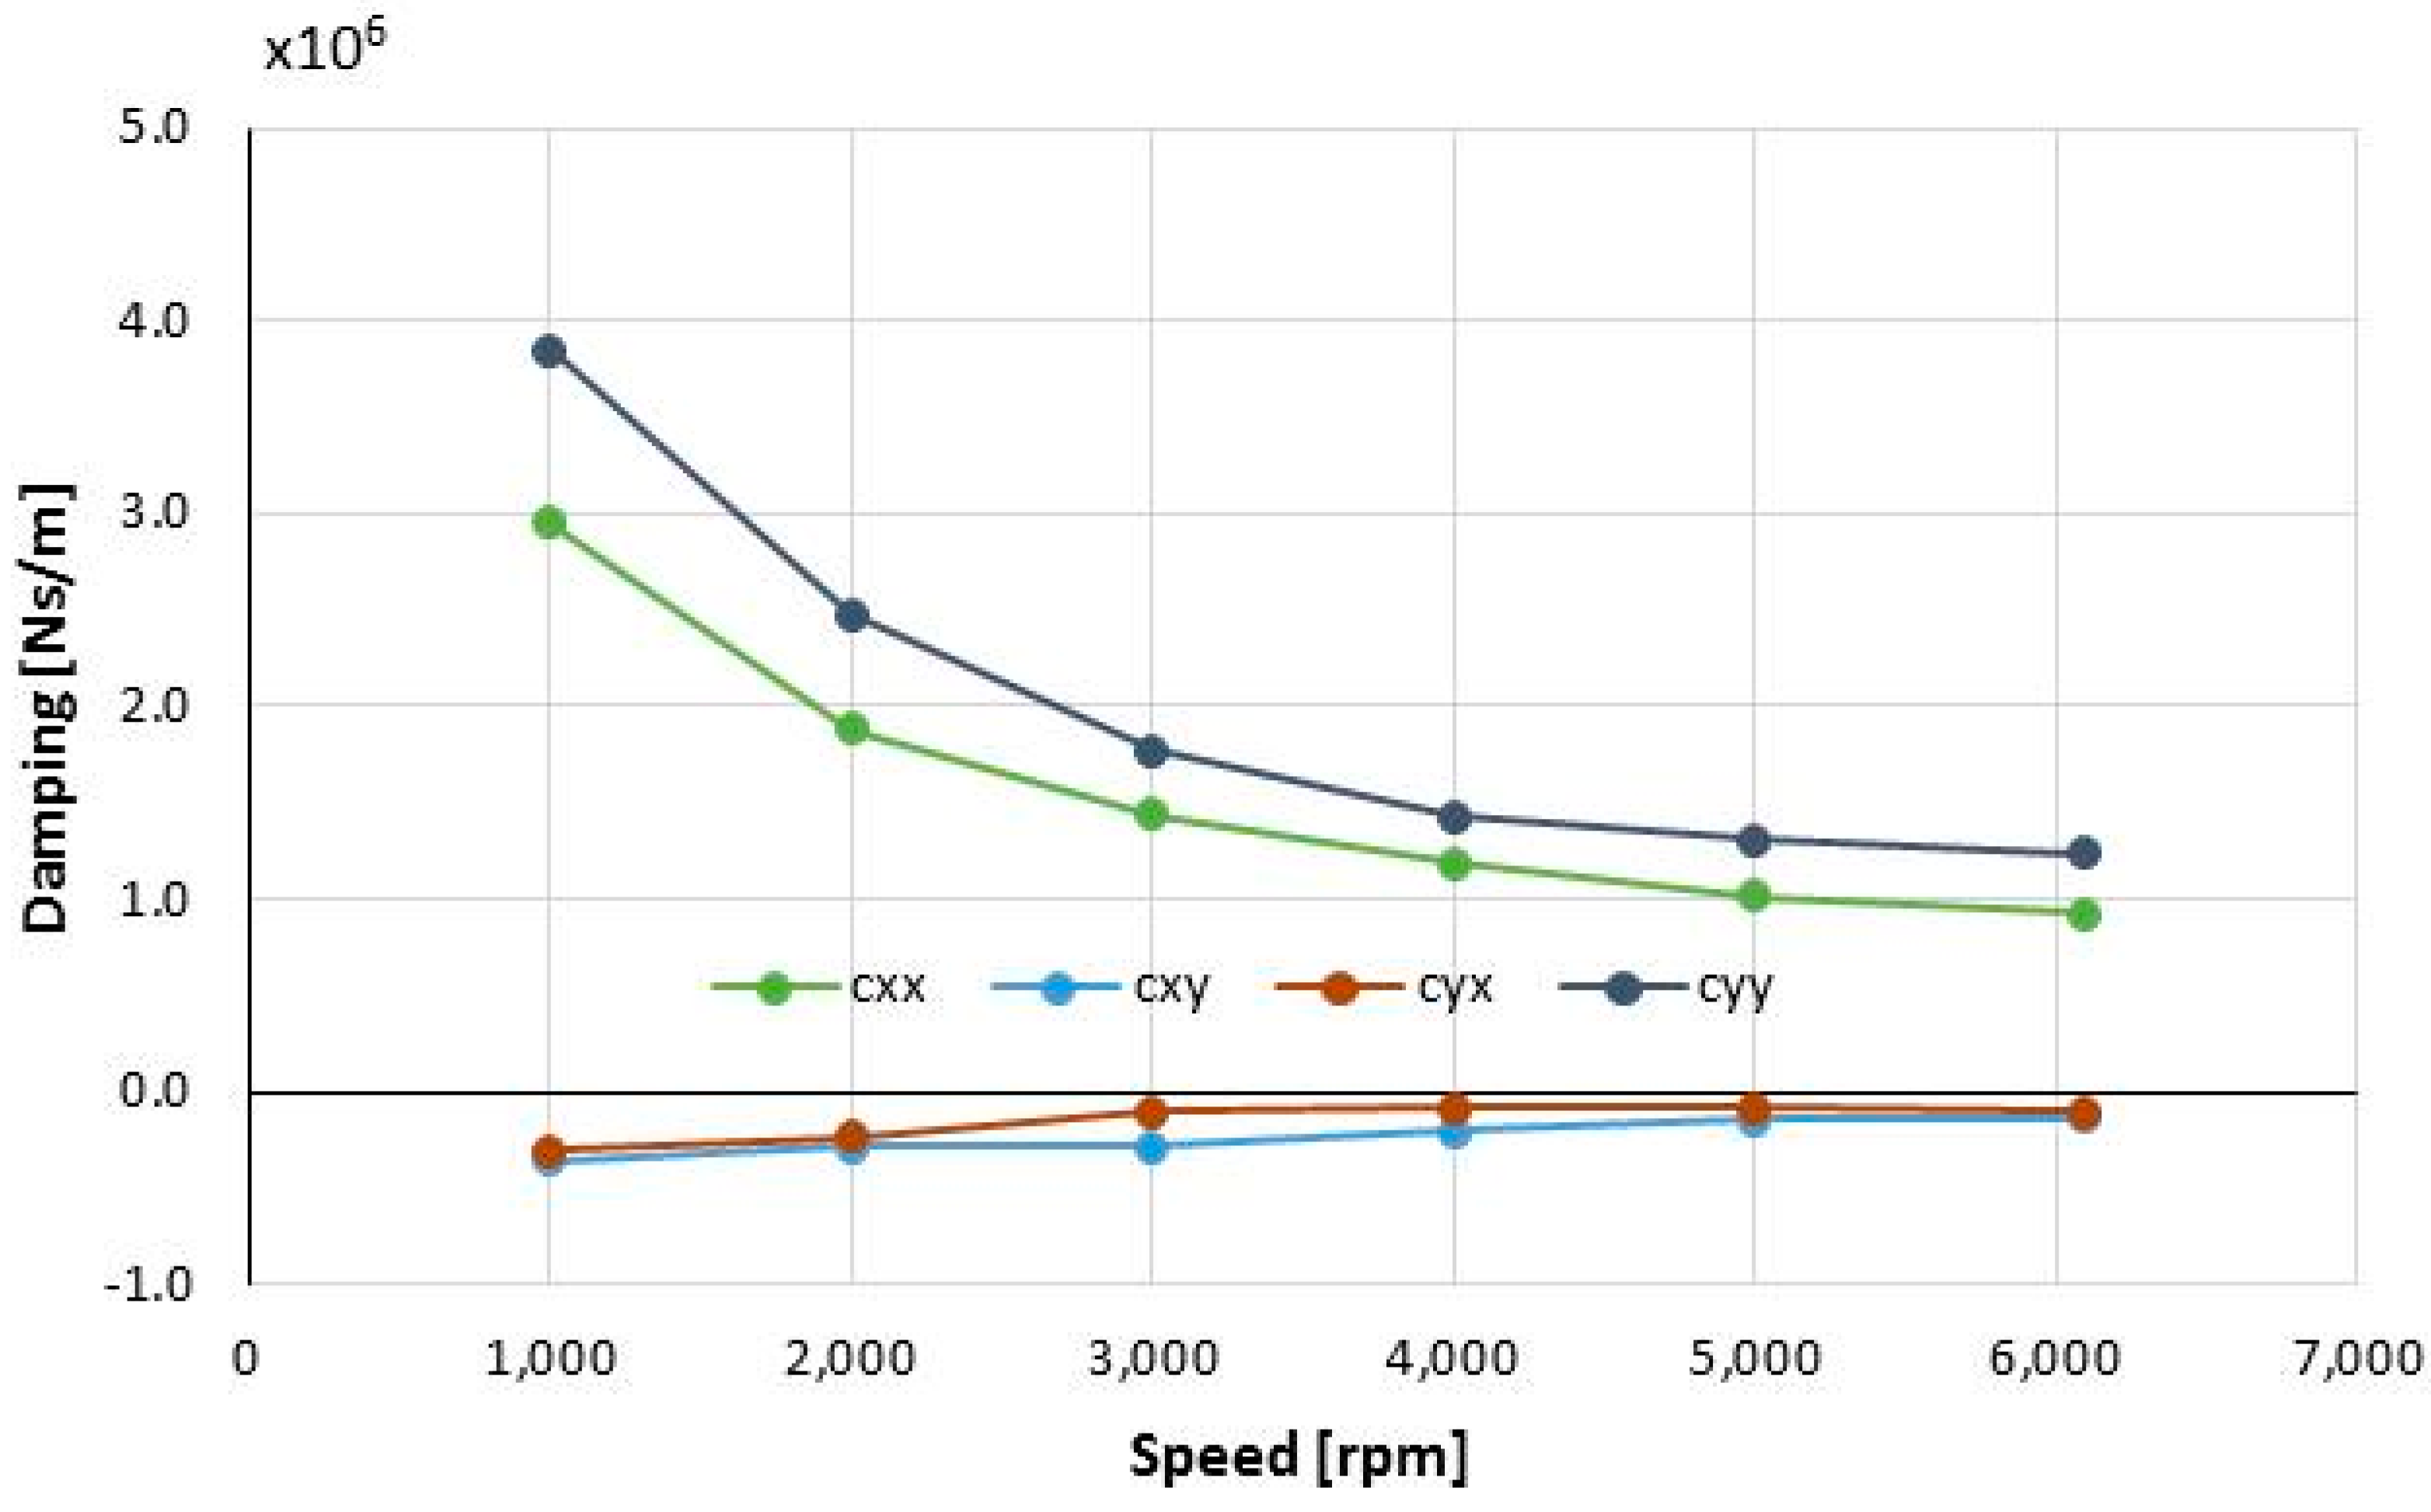
15]. It consists in determining the bearing impedance matrix, in the frequency domain, by multiplying the force 2 × 2 complex matrix made by two direct terms and two cross-coupled ones by the corresponding inverse displacement complex matrix. The stiffness and damping coefficients can be then obtained considering the real and the imaginary parts of the impedance coefficients. Sample trends of the direct and cross stiffness and damping coefficients evaluated at the different excitation frequencies are reported in 
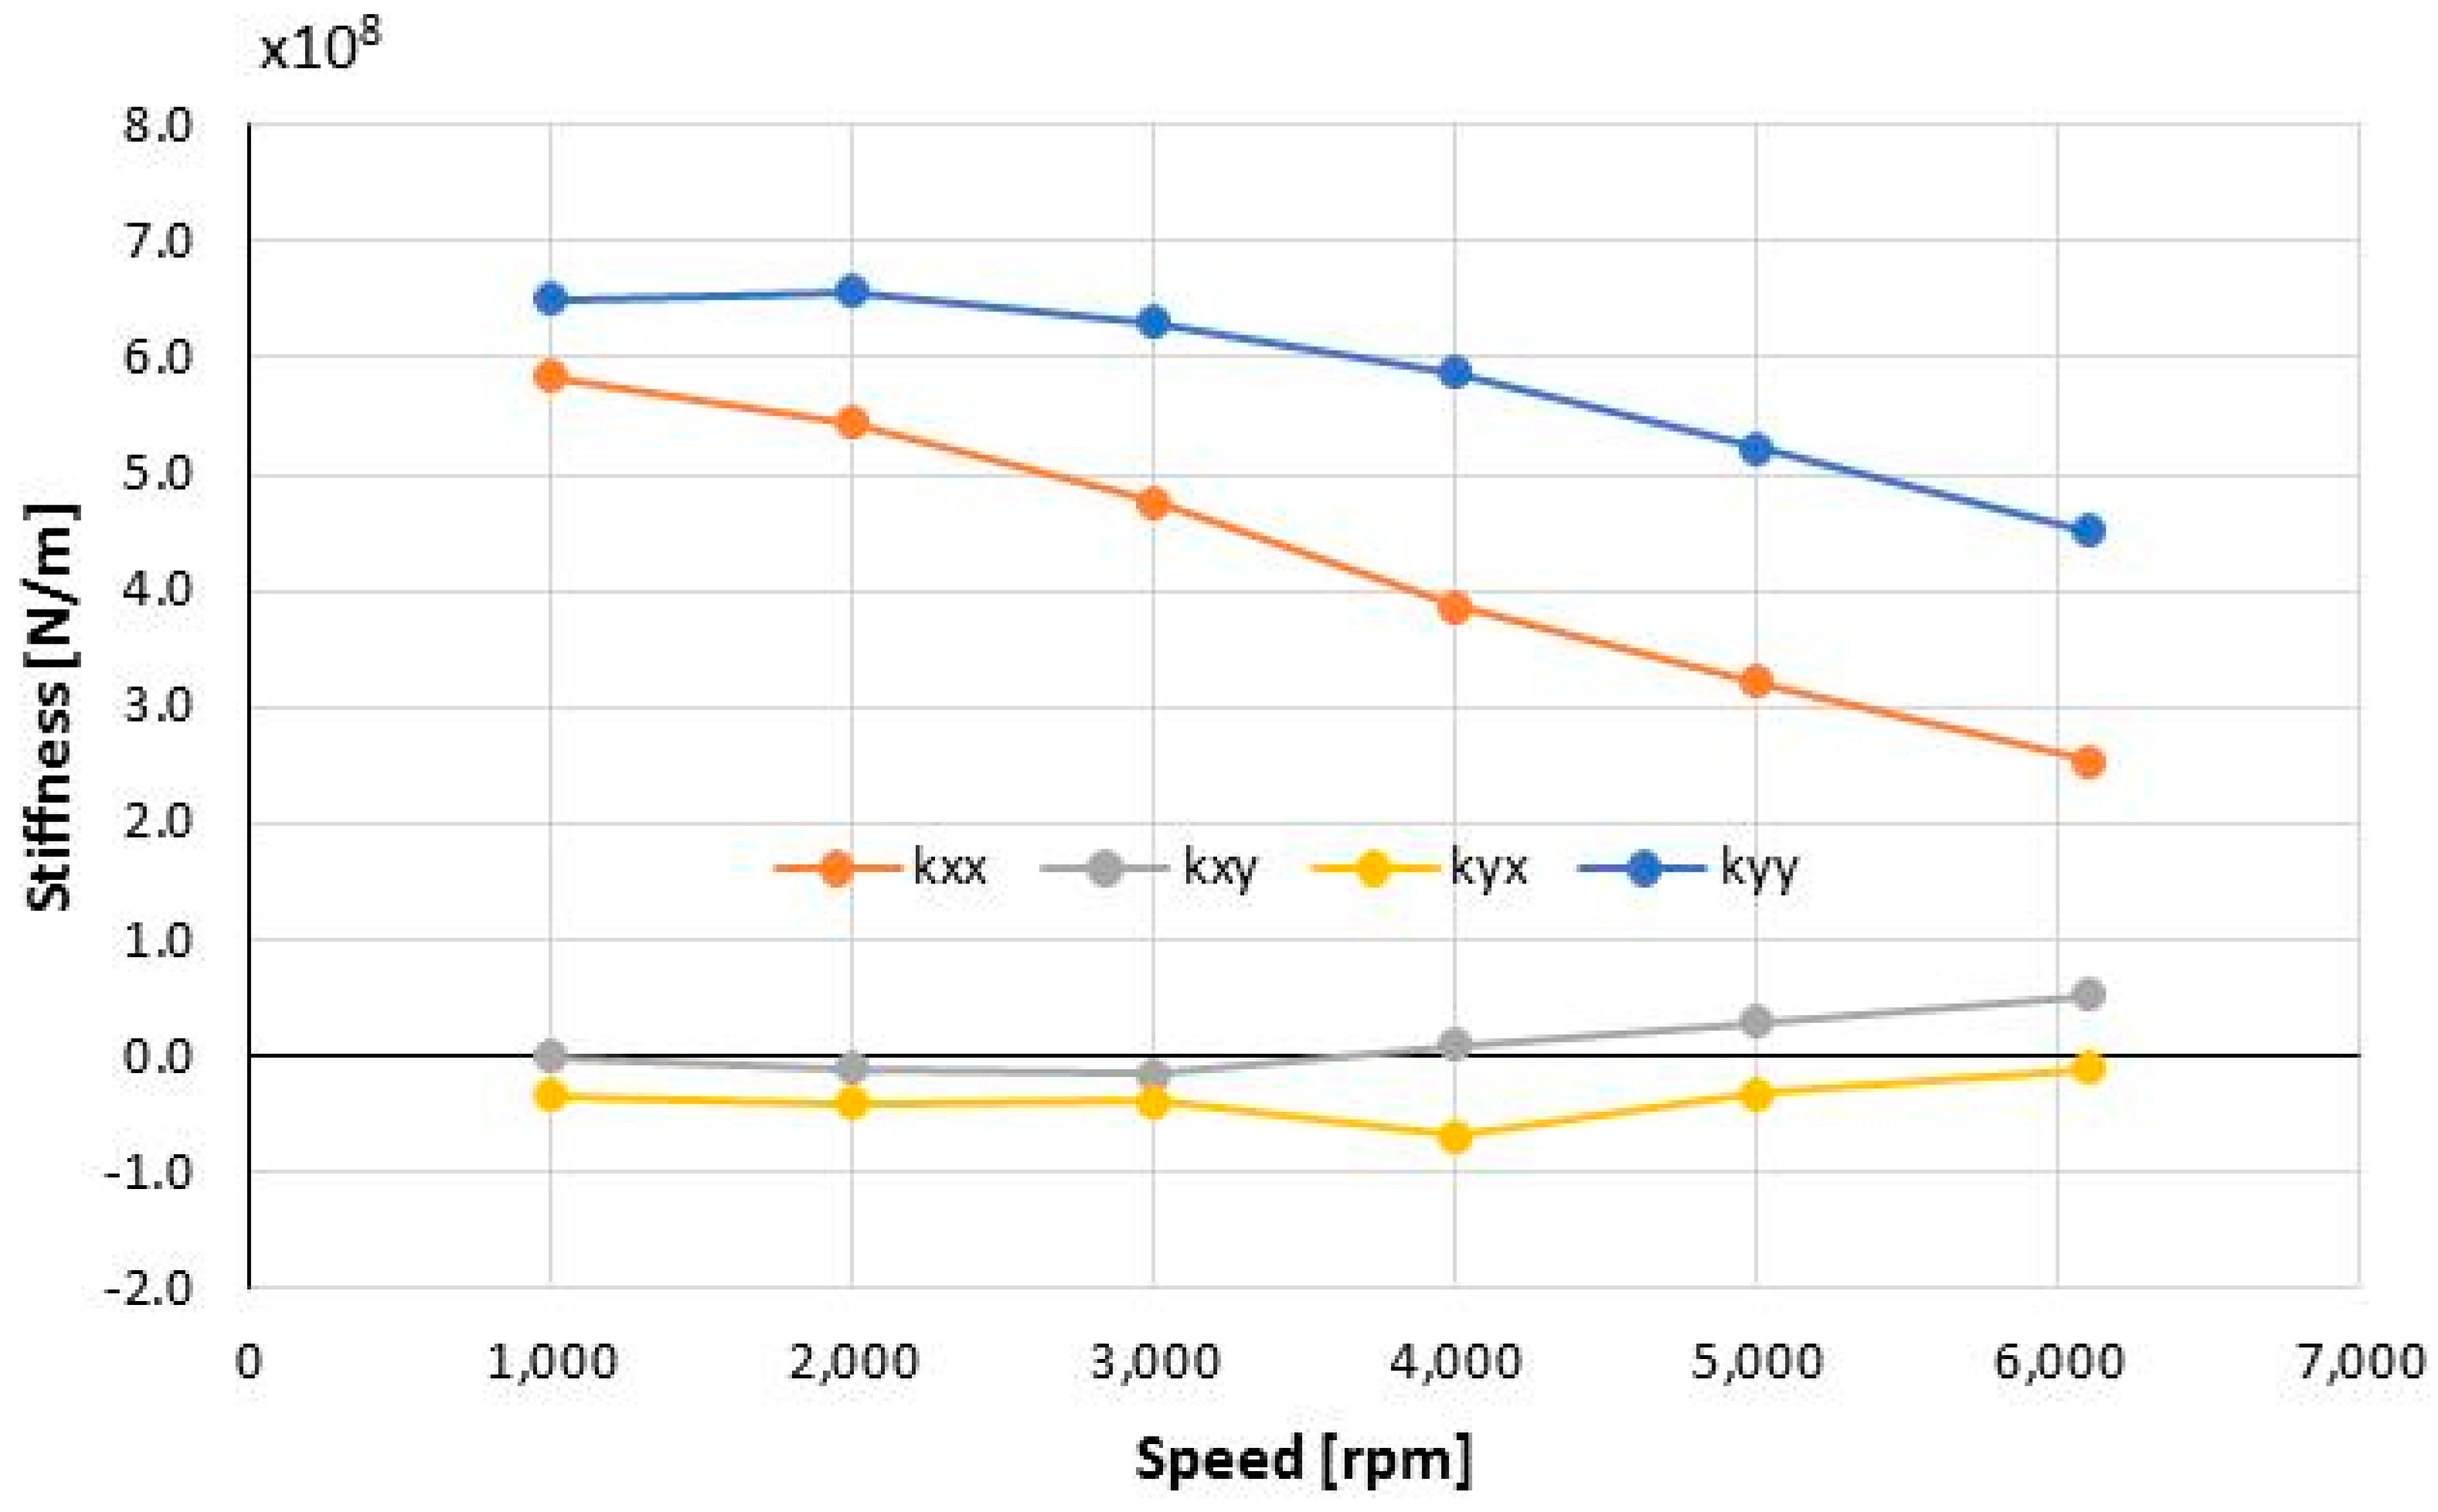
Figure 15. Standard deviation of the coefficients in tests repeated in the same conditions was less than 1% for stiffness direct coefficients, less than 2% for damping direct ones. No correction of the bearing forces for the bearing casing inertia was included in these preliminary results. The synchronous dynamic coefficients are obtained by interpolation at the rotational frequency. The trends obtained by varying the rotational speed for a load of 58 kN load are shown in Figure 16. An estimation of the total uncertainty of the dynamic coefficients taking into account possible measurement errors of dynamic load cells and displacement sensors gave a value of about 10%. However the error of these preliminary results could be higher than that due to the observed unexpected non-isotropic behavior. Such an outcome was ascribed to the static loader stiffness that was found to be not negligible as it should have been, and to the inaccuracy of the static load cell in dynamic load measurements. Such problems, highlighted in this work, will be overcome for the next test campaigns.

4. Conclusions

A novel experimental apparatus for testing high-performance tilting pad journal bearings has been set up and commissioned by the Department of Civil and Industrial Engineering of the University of Pisa in collaboration with GE Oil & Gas and AM Testing. The rig is versatile and can be used to test bearings of different size, configurations and even the effect of misalignment.
The commissioning tests have demonstrated the capabilities of the rig for investigating the static and dynamic characteristics of the bearings, accurately measuring slow and fast variables and effectively controlling operating parameters. Observed transient trends in the slow variables appeared as expected though some unexpected behaviors ascribed to the transition from laminar to turbulent lubrication regime were detected. Concerning the dynamic force coefficients an isotropic behavior for both stiffness and damping was expected due to the load between pad configuration and the even number of pads (4). The observed non-isotropic behavior was ascribed to the static loader stiffness and it is still under investigation.

Acknowledgments

The authors acknowledge the financial support of Tuscany Region and the collaboration of Eng. Francesco Maestrale of AM Testing in the test preparation and execution.

Author Contributions

Enrico Ciulli and Paola Forte analyzed the data and wrote the paper; Mirko Libraschi and Lorenzo Naldi contributed materials and conceived the experiments; Matteo Nuti performed the experiments; all authors collaborated in designing the experiments.

Conflicts of Interest

The authors declare no conflict of interest.

References

  1. Brockwell, K.R.; Kleinbub, D. Measurements of the Steady State Operating Characteristics of the Five Shoe Tilting Pad Journal Bearing. Tribol. Trans. 1989, 32, 267–275. [Google Scholar] [CrossRef]
  2. Dmochowski, W.; Brockwell, K. Calculation and measurement of steady state operating characteristics of the five shoe, tilting pad journal bearing. In Proceedings of the 5th International Congress on Tribology, EUROTRIB’89, Helsinki, Finland, 12–15 June 1989; pp. 168–173. [Google Scholar]
  3. Fillon, M.; Bligoud, J.C.; Frêne, J. Experimental Study of Tilting-Pad Journal Bearings—Comparison with Theoretical Thermoelastohydrodynamic Results. J. Tribol. 1992, 114, 579–587. [Google Scholar] [CrossRef]
  4. Wygant, K.; Flack, R.D.; Barrett, L.E. Measured Performance of Tilting Pad Journal Bearings over a Range of Preload—Part I: Static Operating Conditions. STLE Tribol. Trans. 2004, 47, 576–584. [Google Scholar] [CrossRef]
  5. Fillon, M. Thermal and Deformation Effects on Tilting-Pad Thrust and Journal Bearing Performance. In Proceedings of the Ibertrib 2005—III Congresso Ibérico de tribologia, Guimarães, Portugal, 16–17 June 2005; pp. 1–12. [Google Scholar]
  6. Bouyer, J.; Fillon, M. Experimental measurement of the friction torque on hydrodynamic plain journal bearings during start-up. Tribol. Int. 2011, 44, 772–781. [Google Scholar] [CrossRef]
  7. Monmousseau, P.; Fillon, M. Transient Thermoelastohydrodynamic Analysis for Safe Operating Conditions of a Tilting-Pad Journal Bearing during Start-up. Tribol. Int. 2000, 33, 225–231. [Google Scholar] [CrossRef]
  8. Childs, D.W.; Hale, K. A Test Apparatus and Facility to Identify the Rotordynamic Coefficients of High-Speed Hydrostatic Bearings. J. Tribol. 1994, 116, 337–344. [Google Scholar] [CrossRef]
  9. Wygant, K.; Flack, R.D.; Barrett, L.E. Measured Performance of Tilting Pad Journal Bearings over a Range of Preload—Part II: Dynamic Operating Conditions. STLE Tribol. Trans. 2004, 47, 585–593. [Google Scholar] [CrossRef]
  10. Ikeda, K.; Hirano, T.; Yamashita, T.; Mikami, M.; Sakakida, H. An Experimental Study of Static and Dynamic Characteristics of a 580 mm (22.8 in.) Diameter Direct Lubrication Tilting Pad Journal Bearing. J. Tribol. 2006, 128, 146–154. [Google Scholar] [CrossRef]
  11. Delgado, A.; Vannini, G.; Ertas, B.; Drexel, M.; Naldi, L. Identification and Prediction of Force Coefficients in a Five-Pad and Four-Pad Tilting Pad Bearing for Load-on-Pad and Load-Between-Pad Configurations. J. Eng. Gas Turbine Power 2011, 133. [Google Scholar] [CrossRef]
  12. Delgado, A.; Libraschi, M.; Vannini, G. Dynamic characterization of tilting pad journal bearings from component and system level testing. In Proceedings of the ASME Turbo Expo 2012, Copenhagen, Denmark, June 2012; pp. 1007–1016. [Google Scholar]
  13. Forte, P.; Ciulli, E.; Saba, D. A novel test rig for the dynamic characterization of large size tilting pad journal bearings. J. Phys. Conf. Ser. 2016, 744, 012159. [Google Scholar] [CrossRef]
  14. Ciulli, E.; Forte, P.; Libraschi, M.; Nuti, M. Set-up of a novel test plant for high power turbomachinery tilting pad journal bearings. Tribol. Int. 2018. under review. [Google Scholar]
  15. Forte, P.; Ciulli, E.; Maestrale, F.; Nuti, M.; Libraschi, M. Commissioning of a Novel Test Apparatus for the Identification of the Dynamic Coefficients of Large Tilting Pad Journal Bearings. Procedia Eng. 2018. accepted. [Google Scholar]
  16. Monmousseau, P.; Fillon, M. Analysis of static and dynamic misaligned tilting-pad journal bearings. Proc Inst. Mech. Eng. 1999, 213, 253–261. [Google Scholar] [CrossRef]
Figure 1. Schematic drawing and a picture of the test rig.
Lubricants 06 00004 g001
Figure 2. Load application systems.
Lubricants 06 00004 g002
Figure 3. Picture and schematic drawing of the tested tilting pad journal bearing.
Lubricants 06 00004 g003
Figure 4. Trends in time of forces, torque, rotational speed and power.
Lubricants 06 00004 g004
Figure 5. Trends in time of the displacements.
Lubricants 06 00004 g005
Figure 6. Trends in time of the pads temperatures.
Lubricants 06 00004 g006
Figure 7. Magnification of the diagrams of Figure 4, Figure 5 and Figure 6; increasing speed phase. Trends in time of: (a) vertical force, torque and rotational speed; (b) displacements; (c) pads temperatures.
Lubricants 06 00004 g007
Figure 8. Magnification of the diagrams of Figure 4, Figure 5 and Figure 6; start phase. Trends in time of: (a) forces, torque, rotational speed and power; (b) displacements; (c) pads temperatures.
Lubricants 06 00004 g008
Figure 9. Magnification of the diagrams of Figure 4, Figure 5 and Figure 6; stop phase. Trends in time of: (a) forces, torque, rotational speed and power; (b) displacements; (c) pads temperatures.
Lubricants 06 00004 g009aLubricants 06 00004 g009b
Figure 10. Results of test at different speeds, 58 kN. Trends in time of: (a) forces, torque, rotational speed and power; (b) displacements; (c) pads temperatures.
Lubricants 06 00004 g010aLubricants 06 00004 g010b
Figure 11. Horizontal and vertical forces in antiphase test.
Lubricants 06 00004 g011
Figure 12. Displacements measured along the horizontal direction.
Lubricants 06 00004 g012
Figure 13. FFT of the force measured along the horizontal direction.
Lubricants 06 00004 g013
Figure 14. FFT of the displacements measured along the horizontal direction.
Lubricants 06 00004 g014
Figure 15. Stiffness and damping coefficients as function of excitation frequency, at 3000 rpm (50 Hz) rotational speed, for a load of 58 kN (y: vertical direction, x: horizontal direction, the dashed red vertical line indicates the rotational frequency).
Lubricants 06 00004 g015aLubricants 06 00004 g015b
Figure 16. Synchronous stiffness and damping coefficients as function of rotational speed, for a load of 58 kN (y: vertical direction, x: horizontal direction).
Lubricants 06 00004 g016aLubricants 06 00004 g016b
Table 1. Main characteristics of the experimental apparatus.
CharacteristicValue Range
Bearing diameter [mm]150–300
Bearing length to diameter ratio0.4–1
Shaft rotational speed [rpm]0–24,000
Electric motor power [kW]630
Bearing peripheral speed [m/s]0–150
Static load [kN]0–270
Dynamic load [kN]0–40
Frequency of the dynamic load [Hz]0–350
Bearing oil flow rate [L/min]125–1100
Bearing oil inlet temperature [°C]30–120
Plant maximum total power [kW]1000

