1. Introduction
The contact interaction of dry surface layers of solid bodies is a complex multiscale phenomenon, simultaneously taking place at various spatial scales from atomic to macroscopic [
1,
2,
3,
4]. Understanding the processes in the surface layers under the contact spots is key to the prediction and control of the behavior of surface layers during friction, indentation, burnishing, and so on [
5,
6,
7,
8,
9,
10,
11,
12]. In spite of pronounced differences in the mechanical behavior of surface layers with different internal structures and rheological properties under contact interaction, some fundamental dynamic phenomena are common for various solids and take place at various spatial scales. Among them, we should emphasize a considerable increase of the contribution of the collective rotational (vortex-like) mode to material deformation [
13,
14,
15,
16,
17]. Collective vortex motions arise near the external and internal boundaries in the material under dynamic loading with a significant lateral (with respect to the plane of the boundary) component. Such conditions are realized, in particular, in the surface regions under conditions of the dynamic contact interaction of solids. In the case of ductile materials, dynamic contact interaction with a significant tangential component can lead to a shear instability of the surface layers and a transition from the laminar to the turbulent regime of deformation accompanied by structural transformations, up to the formation of amorphous regions and nanofragmentation [
7,
16,
18,
19,
20]. The results of theoretical studies and experimental data show that the contribution of the rotational modes of deformation to the response of the material becomes highly significant under conditions of dynamic loading or dynamic variation of the local stress state [
21,
22,
23,
24].
All the above-said indicates the topicality of studying the features of the dynamic mechanisms of the transfer and redistribution of elastic strain energy in the surface layers of materials from the contact surface. Conventionally discussed dynamic mechanisms of redistribution of elastic strain energy include P and S elastic wave pulses emitted from contact patches [
25,
26,
27,
28]. When radiating from a local source (contact spots), these waves acquire an elliptical shape and transfer elastic strain energy in the spectrum of directions oriented in the angular interval from −π/2 up to +π/2 with respect to the orientation of the normal to the source [
26,
27,
29].
At the same time, it is known that the elastic strain energy can be transferred in solids by localized elastic waves propagating in a certain direction. Elastic waves of this kind are characterized by a vortex-like pattern of the collective elastic motion localized in some volume of material. Vortex-like (circular or elliptical) patterns of elastic displacements are normally associated with surface waves and waves in the plates (Rayleigh, Love or Lamb waves), as well as with the waves propagating along a phase boundaries (Stoneley wave). Hereafter, we will refer to localized vortex-like elastic waves as elastic vortices. Recent analytical and numerical studies have shown that the elastic vortex is formed in a solid near the internal or external boundary at the initial stage of dynamic change in the local stress state [
30,
31,
32,
33]. The necessary conditions for elastic vortex formation are the presence of an interface (internal or external) and a gradient of velocity in the velocity-normal direction. The formation of elastic vortices ensures the compatibility of deformations in the material and serves a necessary accommodative mechanism under dynamic deformation with nonzero components of shear and bending [
34,
35]. Therefore, this phenomenon accompanies almost all situations of dynamic contact action and, as a rule, manifests itself in real multiscale materials on various spatial scales from atomic to macroscopic.
In recent years, the authors have studied the features of the formation and propagation of elastic vortices in thin plates and their role in the processes of accumulation of inelastic deformation or local fracture under dynamic loading. We showed that an elastic vortex is a fully dynamic scale-invariable object that propagates in the front of an elastic perturbation caused by a change in the stress state in the contact zone [
31]. This property distinguishes elastic vortices from static elastic rotary displacements near the deformed interfaces. The key feature of an elastic vortex is a concentration of shear stress with the maximum value in the central part of the region involved in collective circular motion [
31]. The concrete value of the shear stress magnitude is determined by the power of the influx of elastic strain energy into the region of the formation of the elastic vortex. In the case of adhesiveless contact of solids, the inflow of elastic strain energy in the surface layer and the magnitude of shear stress in the nucleating elastic vortex is determined by the value of the tangential velocity of the surface of the sample in the contact patch. Preliminary study has shown that the magnitude of equivalent stress in an elastic vortex can be assumed to be proportional to the velocity of the tangential displacement of the surface and the Young's modulus of the material [
32].
The results of the studies showed that elastic vortices in thin surface layers or plates can be characterized by the key general features. After the short period of nucleation, an elastic vortex becomes a self-dependent localized dynamic object that propagates at the shear wave speed independently of its source of origin. During the course of vortex propagation, the magnitude of shear stress gradually decreases (the vortex gradually attenuates). Simulation results showed that the total attenuation of the elastic vortex in the plate occurs at distances from the place of nucleation exceeding the characteristic “diameter” of the elastic vortex by 1–2 orders of magnitude (hereinafter, the total attenuation of elastic vortex is interpreted as an order of magnitude reduction of the value of the elastic strain energy density of distortion in the center of vortex; this corresponds to a decrease in the magnitude of equivalent stress by 3–5 times). Stress concentration in the central region of the elastic vortex determines its potential ability to initiate local inelastic strains (including local rotations of grains, which are smaller than the vortex “diameter”) or local cracks. In particular, the papers [
31,
36] showed that the elastic vortex serves a physical mechanism of localized and directed transfer of elastic energy and determines the possibility of supershear acceleration of dynamically growing interfacial mode II cracks (note that interfacial mode II crack is conventionally used as a model of adhesive tangential contact [
37,
38,
39]). It is also shown that elastic vortices generated in a surface layer are capable of initiating local inelastic shear strains at internal boundaries or in a volume of ductile inclusions whose stress state is close to the yield point [
32]. Although the characteristic magnitude of the generated inelastic strains at the boundaries is small, a multiple “vortex” effect due to surface roughness interactions during friction can lead to the accumulation of large inelastic strain.
The results of previous studies were obtained for thin surface layers or plates in which elastic vortices propagated along the plate or at a small angle to its plane. At the same time, these studies derived the new question of the ability of such a localized elastic wave to propagate deep into the material at a large angle to the external surface plane, as well as the related question of the “ultimate“ depth at which the elastic vortex attenuates. These issues are of fundamental importance for a better understanding of the physical mechanisms responsible for the accumulation of irreversible strain and discontinuities in the surface layers under dynamic contact interaction with the nonzero tangential component of displacement. The present paper is devoted to a numerical study of this problem by computer simulation using the numerical method of movable cellular automata.
2. Materials and Methods
The problem was studied in the 2D statement using numerical modeling by the method of movable cellular automata (MCA). The MCA method is a representative of the discrete element methods (DEM), namely the explicit method of simply deformable elements. In the framework of this method, the evolution of an ensemble of interacting discrete elements (cellular automata) is defined by a numerical solution of the system of classical Newton–Euler motion equations using an explicit numerical scheme (the velocity Verlet algorithm in our case) [
40]. We use the well-known approximation of equivalent discs (in the considered 2D problem statement) for interpreting the element shape while numerically solving the equations of motion. This popular approximation was first proposed by P. Cundall, and the corresponding implementation of DEM is known as a distinct element method [
40,
41]. Within this approximation, the interaction between two discrete elements is divided into two independent components: normal or central, which is oriented along the line connecting the centers of mass of the elements, and tangential interaction in the plane transverse to the mentioned line. The “simply deformable element” approximation in the MCA method implies a homogeneous distribution of stresses and strains in the volume of a discrete element (the full analogy with the linear shape function in the finite element method). The stress-strain state of a discrete element is determined by the average stress tensor σ
αβ and average strain tensor ε
αβ. Components of these tensors are calculated through interaction forces, pair overlaps and relative shear displacements in the interacting pairs of the element with its neighbors [
41,
42]. In the MCA method, the element-element interaction forces are formulated in the original many-body form [
42,
43]. Within the framework of this formulation, we implemented the linear elasticity model (Hooke’s law) for locally isotropic materials (the automaton is considered as isotropic) and conventional plastic flow model of metals with the von Mises yield criterion. The latter was implemented using the adapted radial return algorithm of Wilkins. These mechanical models are used in the present study. The detailed description of the features of the MCA method and model implementation (including implementation in the 2D statement) can be found in the paper [
43].
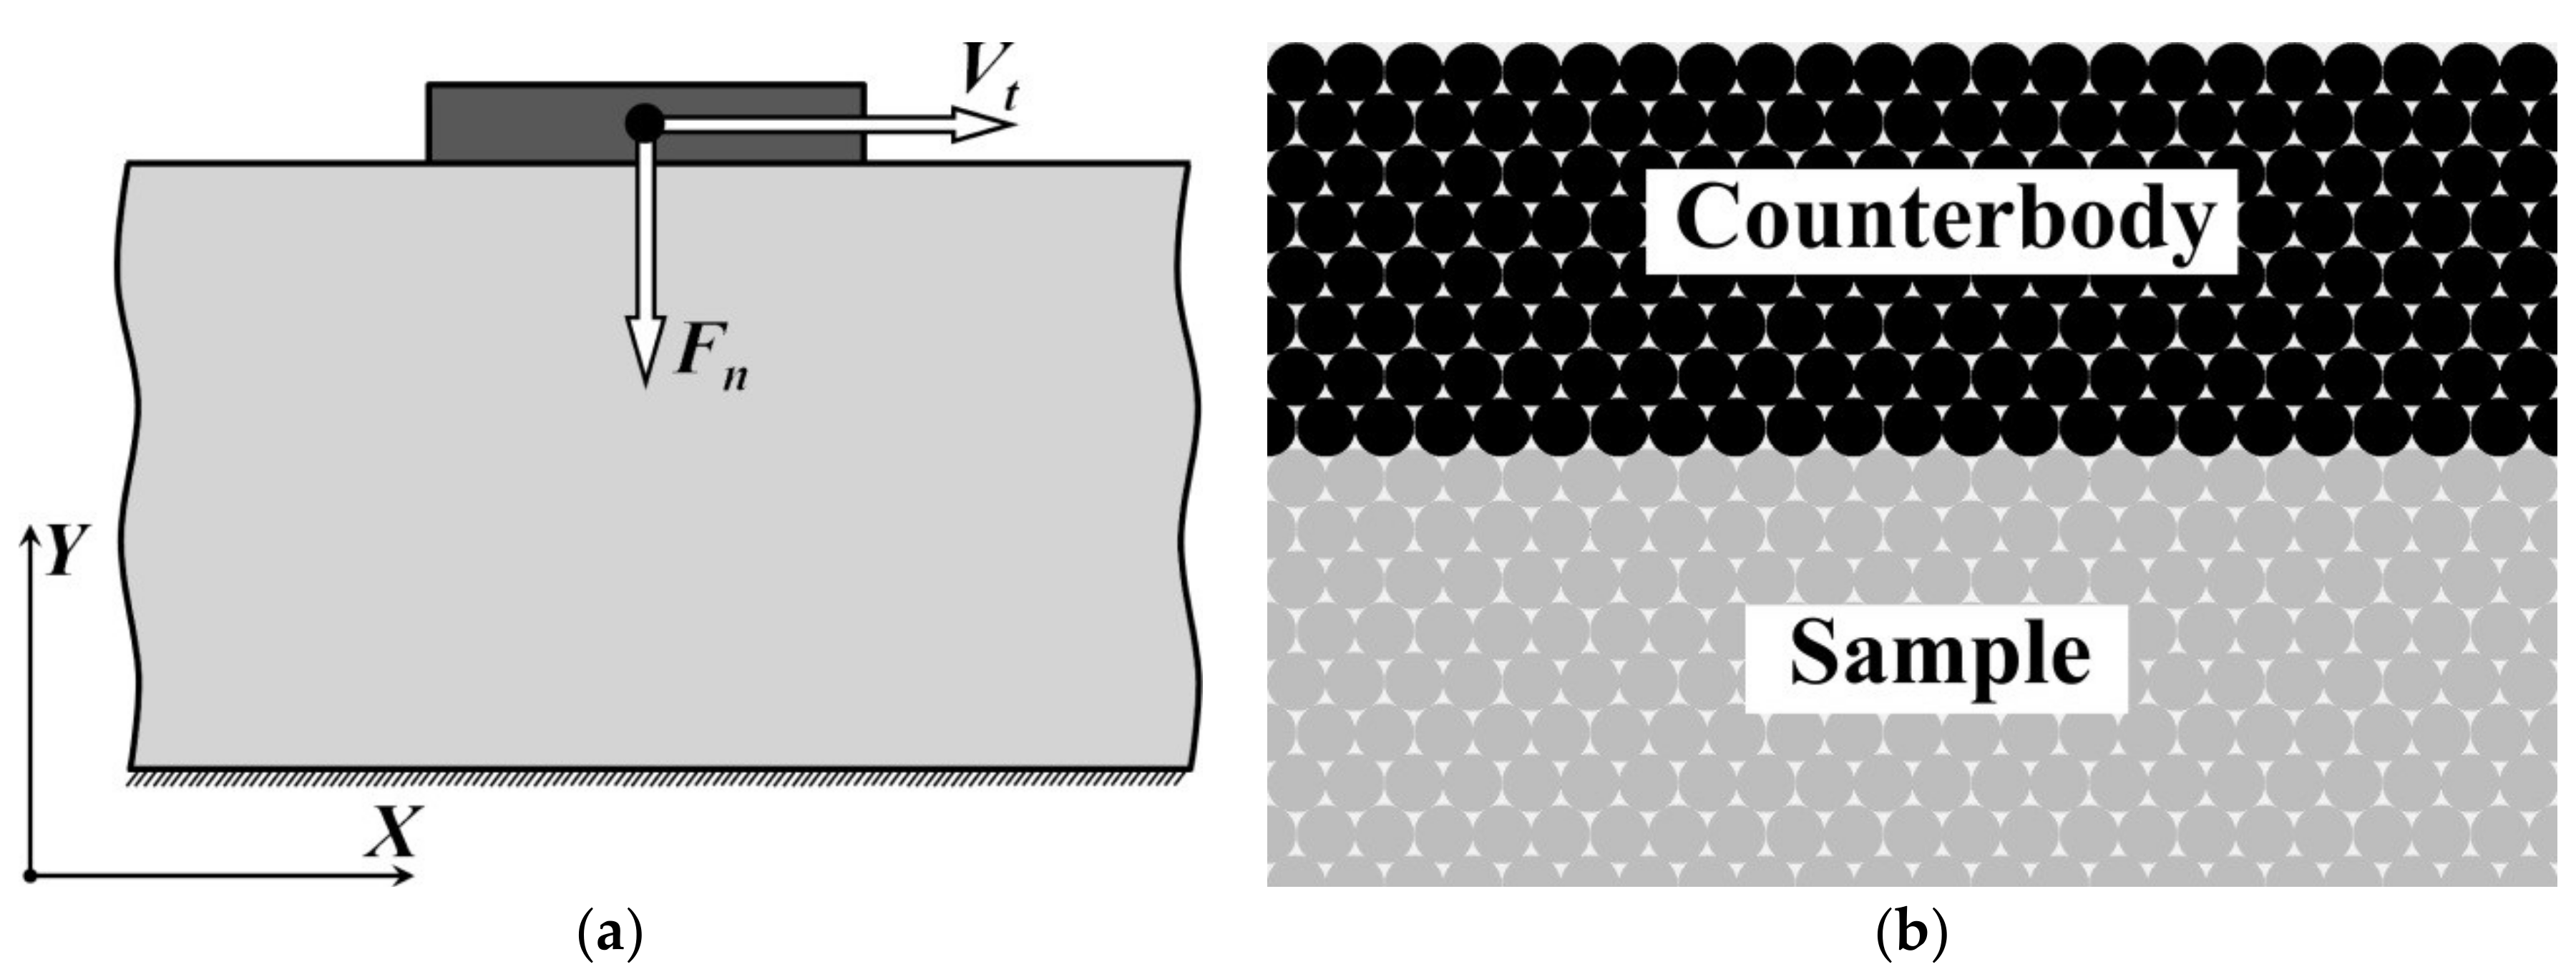
We consider a 2D model sample imitating the cross-section of the contact area of the surface layer of the model elastic-plastic material with the surface of a rigid counterbody (
Figure 1а). The considered region includes the cross-section of the contact surface and the adjacent areas of the surface layer of the body. The considered surface areas of both the body and the rigid counterbody were modeled by close-packed ensembles of equally-sized movable cellular automata. The surfaces of the body and the counterbody are in contact. The surfaces of the body and the rigid counterbody are assumed to be rough and characterized by the same roughness parameters. Surface roughness is considered as one-scale and regular with asperity parameters (height, radius and curvature) determined by automaton diameter (
Figure 1b). The model assumes that the contacting automata of the opposite surfaces interact only with central elastic-plastic repulsive forces, i.e., forces of tangential interaction between these automata are zero.
“Basic” dimensions of the model sample were 55 × 88 μm. The sample and the counterbody were considered as homogeneous (physical and mechanical characteristics of all the elements are the same) and isotropic. In this problem statement, the selection of the element size (or spatial density) is based on the following criterion: element size must influence only the contact interaction between the surfaces (through element size-related parameters of asperities) and not the mechanical response of internal volumes of the sample. Our previous studies showed that the mechanical behavior of internal volumes of homogeneous samples gradually converges when the element diameter is down to 30–40 times smaller than the smallest sample dimension. The element diameter in the considered basic sample was 0.1 μm, which is more than five hundred-times smaller than sample dimensions and ensures the independence of the dynamics of vortex propagation in the sample from the element size.
The 2D model was considered in the plane strain approximation. Periodic boundary conditions were specified on the lateral faces in the horizontal direction to simulate an infinitely long surface layer.
The following “basic” mechanical characteristics were assigned to movable cellular automata modelling the surface layer of the model material: density ρ = 4500 kg/m
3, Young’s modulus
E = 110 GPa, Poisson’s ratio
ν = 0.33, yield strength σ
yield = 270 MPa. The uniaxial loading diagram of the model material of the movable automaton is shown in
Figure 2 (this diagram is used as the unified stress-strain curve for the implemented model of the plastic flow). The mentioned mechanical characteristics are close to the corresponding mechanical parameters of coarse-grained VT1-0 titanium [
44].
The sample was loaded in two stages. In the first stage, a normal load was applied to the automata imitating the surface of the counterbody. During this stage, the value of normal load gradually increased until it reached the assigned value of contact pressure σn (contact pressure is determined as the ratio of applied normal load Fn to the area of the counterbody surface). At the end of the relaxation phase, the system established a stationary force balance. After that (at the second stage), the surface automata of the counterbody were subject to the tangential motion by applying constant tangential velocity Vt and zero normal velocity (along the Y axis).
Dynamic tangential displacements of the surface automata of the sample in the contact area are accompanied by a dynamic change in the stress state in the surrounding region of the surface layer. This leads to the formation of an elastic vortex. The nucleated elastic vortex propagates in the sample at some angle to the plane of the contact surface. Simulations continued until the elastic vortex approached the lower or lateral border.
In the study, we varied the tangential velocity Vt, the contact pressure σn, Young’s modulus E of the material, the size of the contact area L and surface roughness determined by automaton size d: Vt from 0.1–15 m/s, σn from 0.2–1.25σyield, E from 55–110 GPa, L and d varied within the order of magnitude around “basic” values d = 0.1 μm and L =10 μm.
We analyzed the influence of the above-listed mechanical and geometrical parameters on the process of the formation and propagation of elastic vortices in the surface layer of the material, as well as on the magnitude of the shear stresses in the central region of the vortex.
3. Results
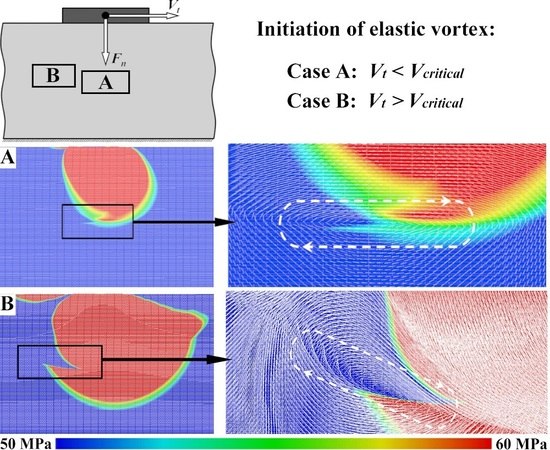
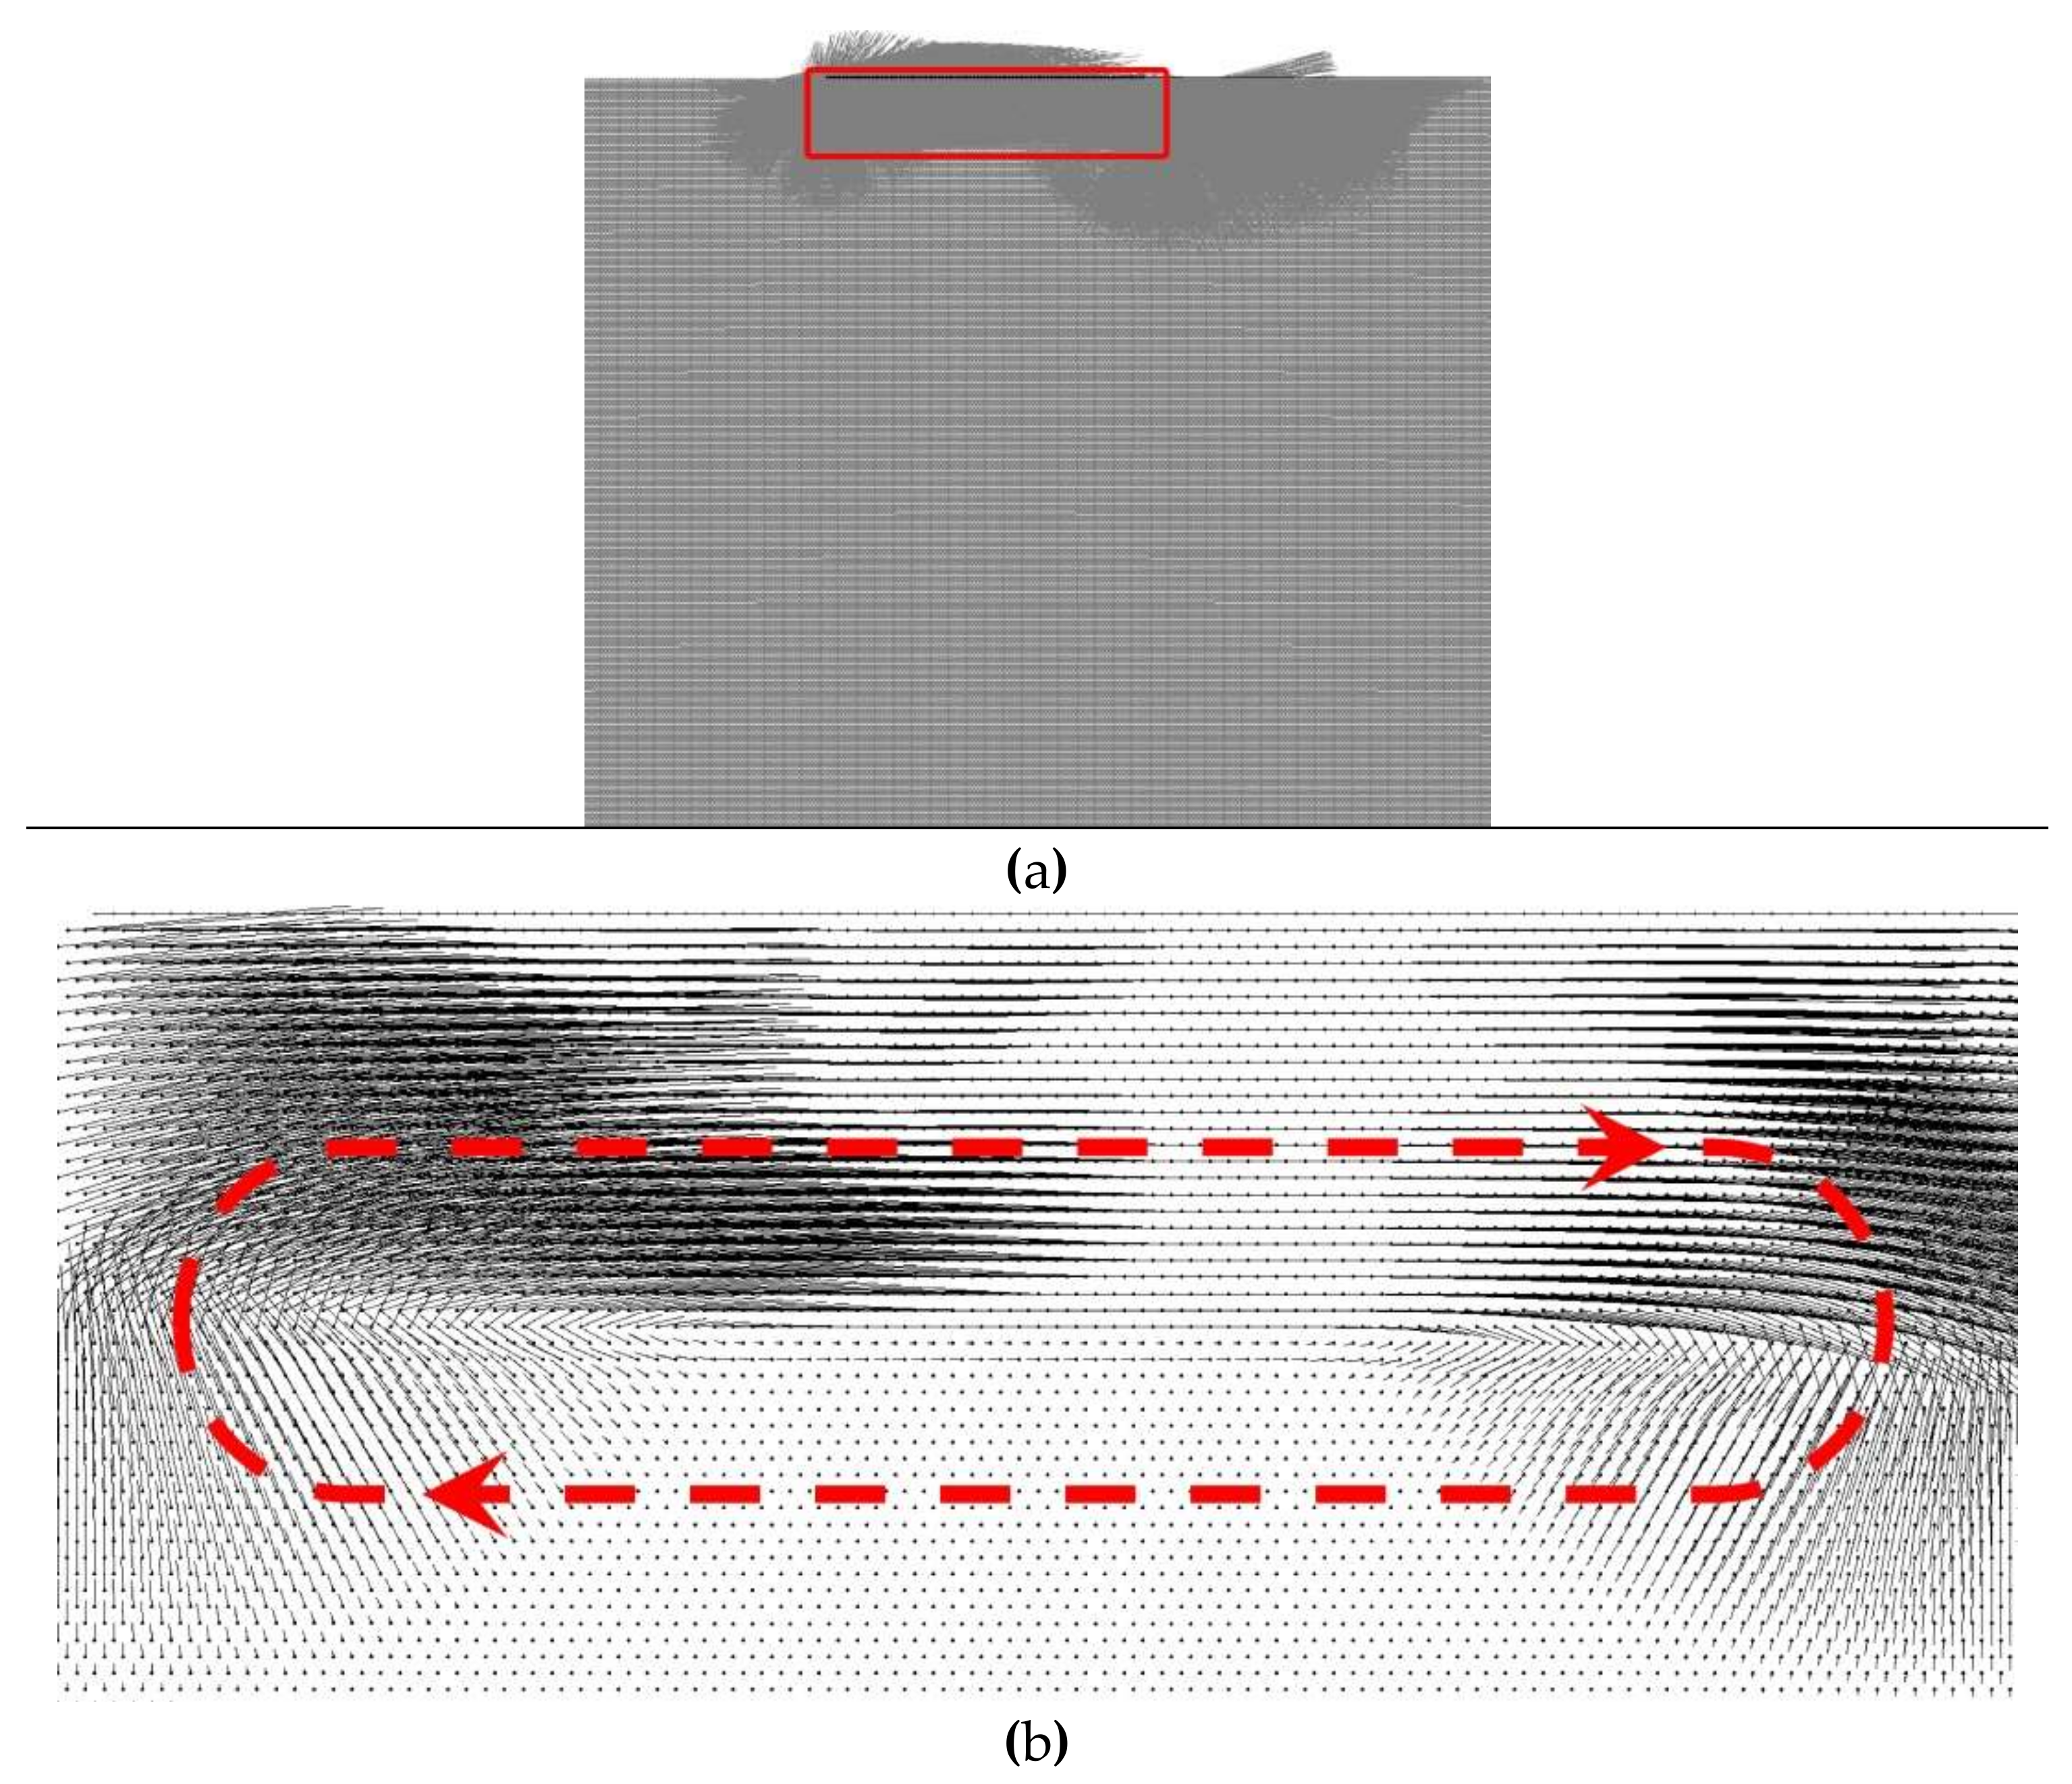
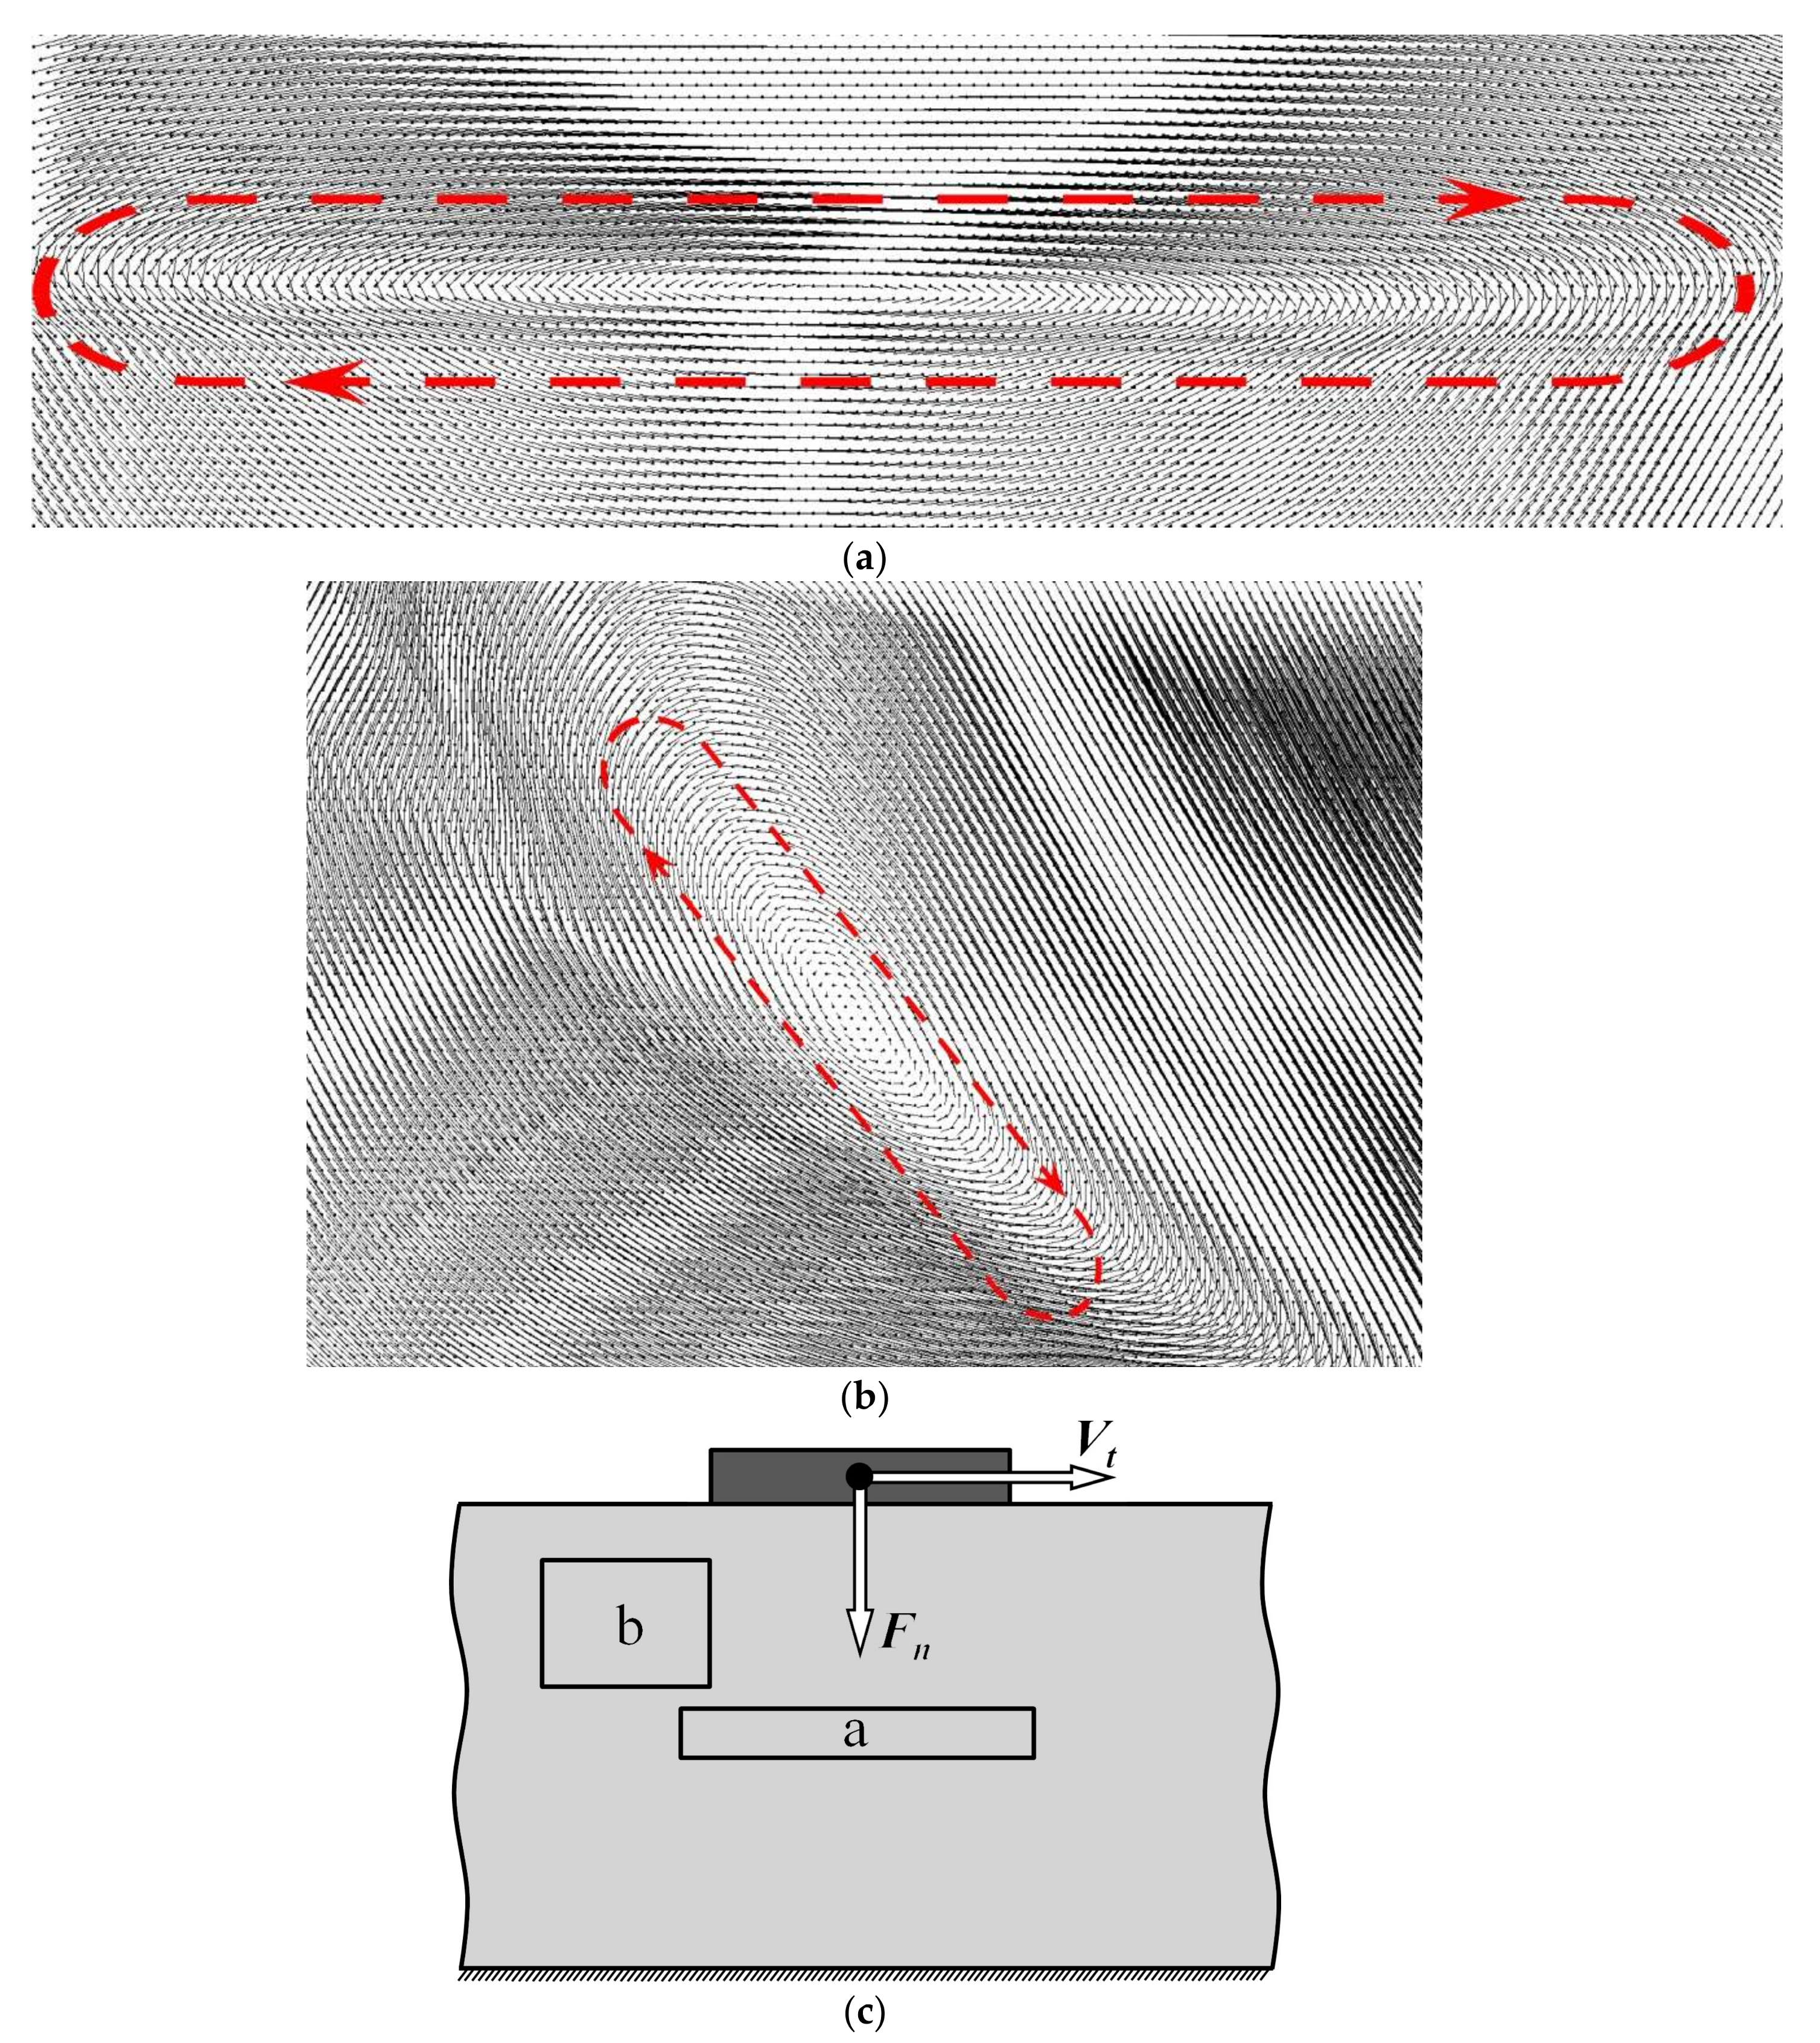
Analysis of the modeling results shows that at the very beginning of dynamic tangential displacement of the contact region, a localized vortex-like velocity field, hereafter referred to as an elastic vortex, forms in the sample surface layer under the contact patch (
Figure 3). The elastic vortex has an elliptical shape (note that in 3D, such a vortex has the shape of a “flattened” spindle, and the picture presented shows its cross-section [
32]). The direction of its rotation coincides with the counterbody motion direction (
Figure 3b).
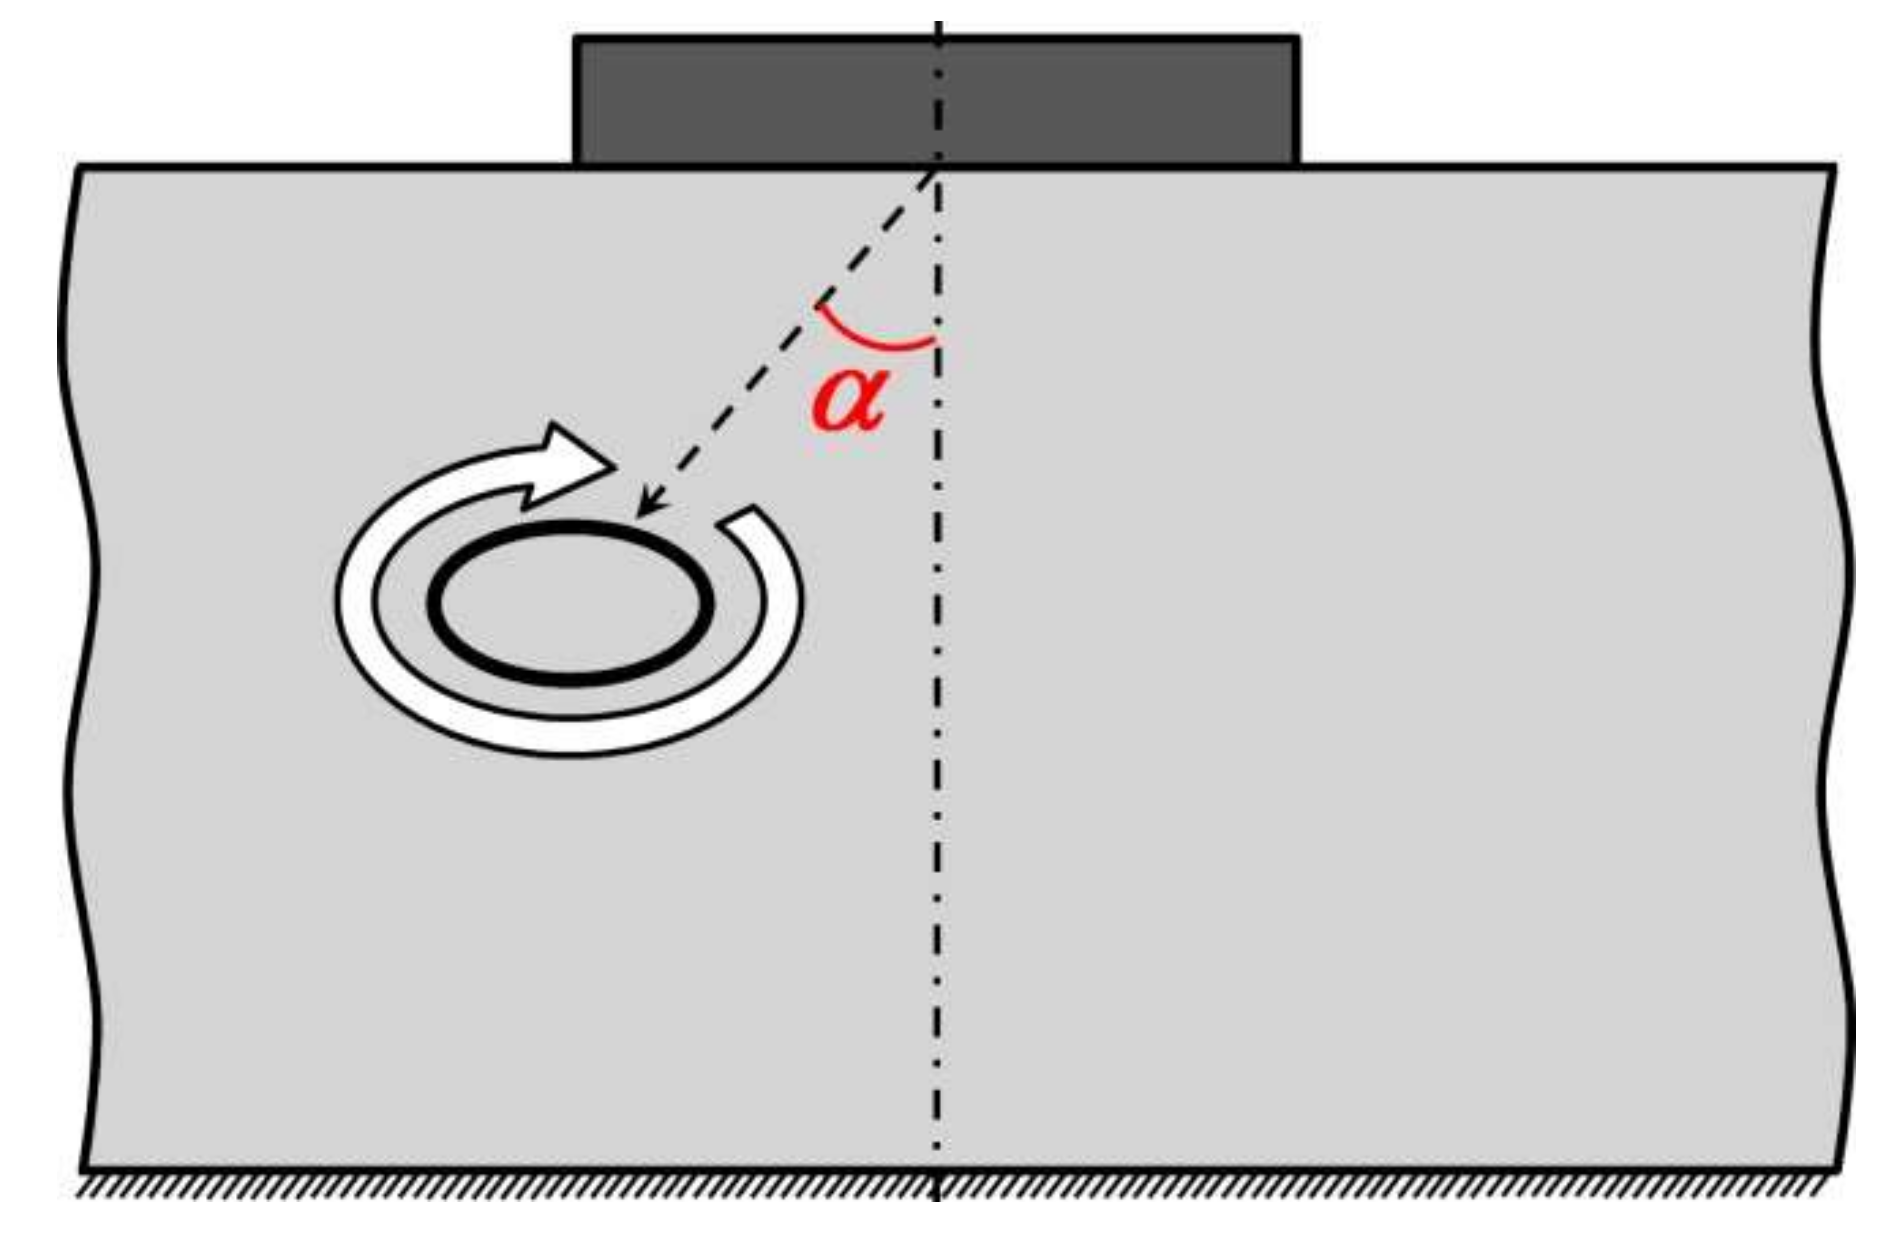
The elastic vortex propagates deep into the sample at some angle α to the surface normal (
Figure 4) with a velocity equal to the shear wave speed
VS (for the material under consideration,
VS ≈ 3000 m/s). The simulation results show that direction of the vortex motion (defined by the angle α) and the ratio of its principal axes depend on the counterbody velocity and contact pressure.
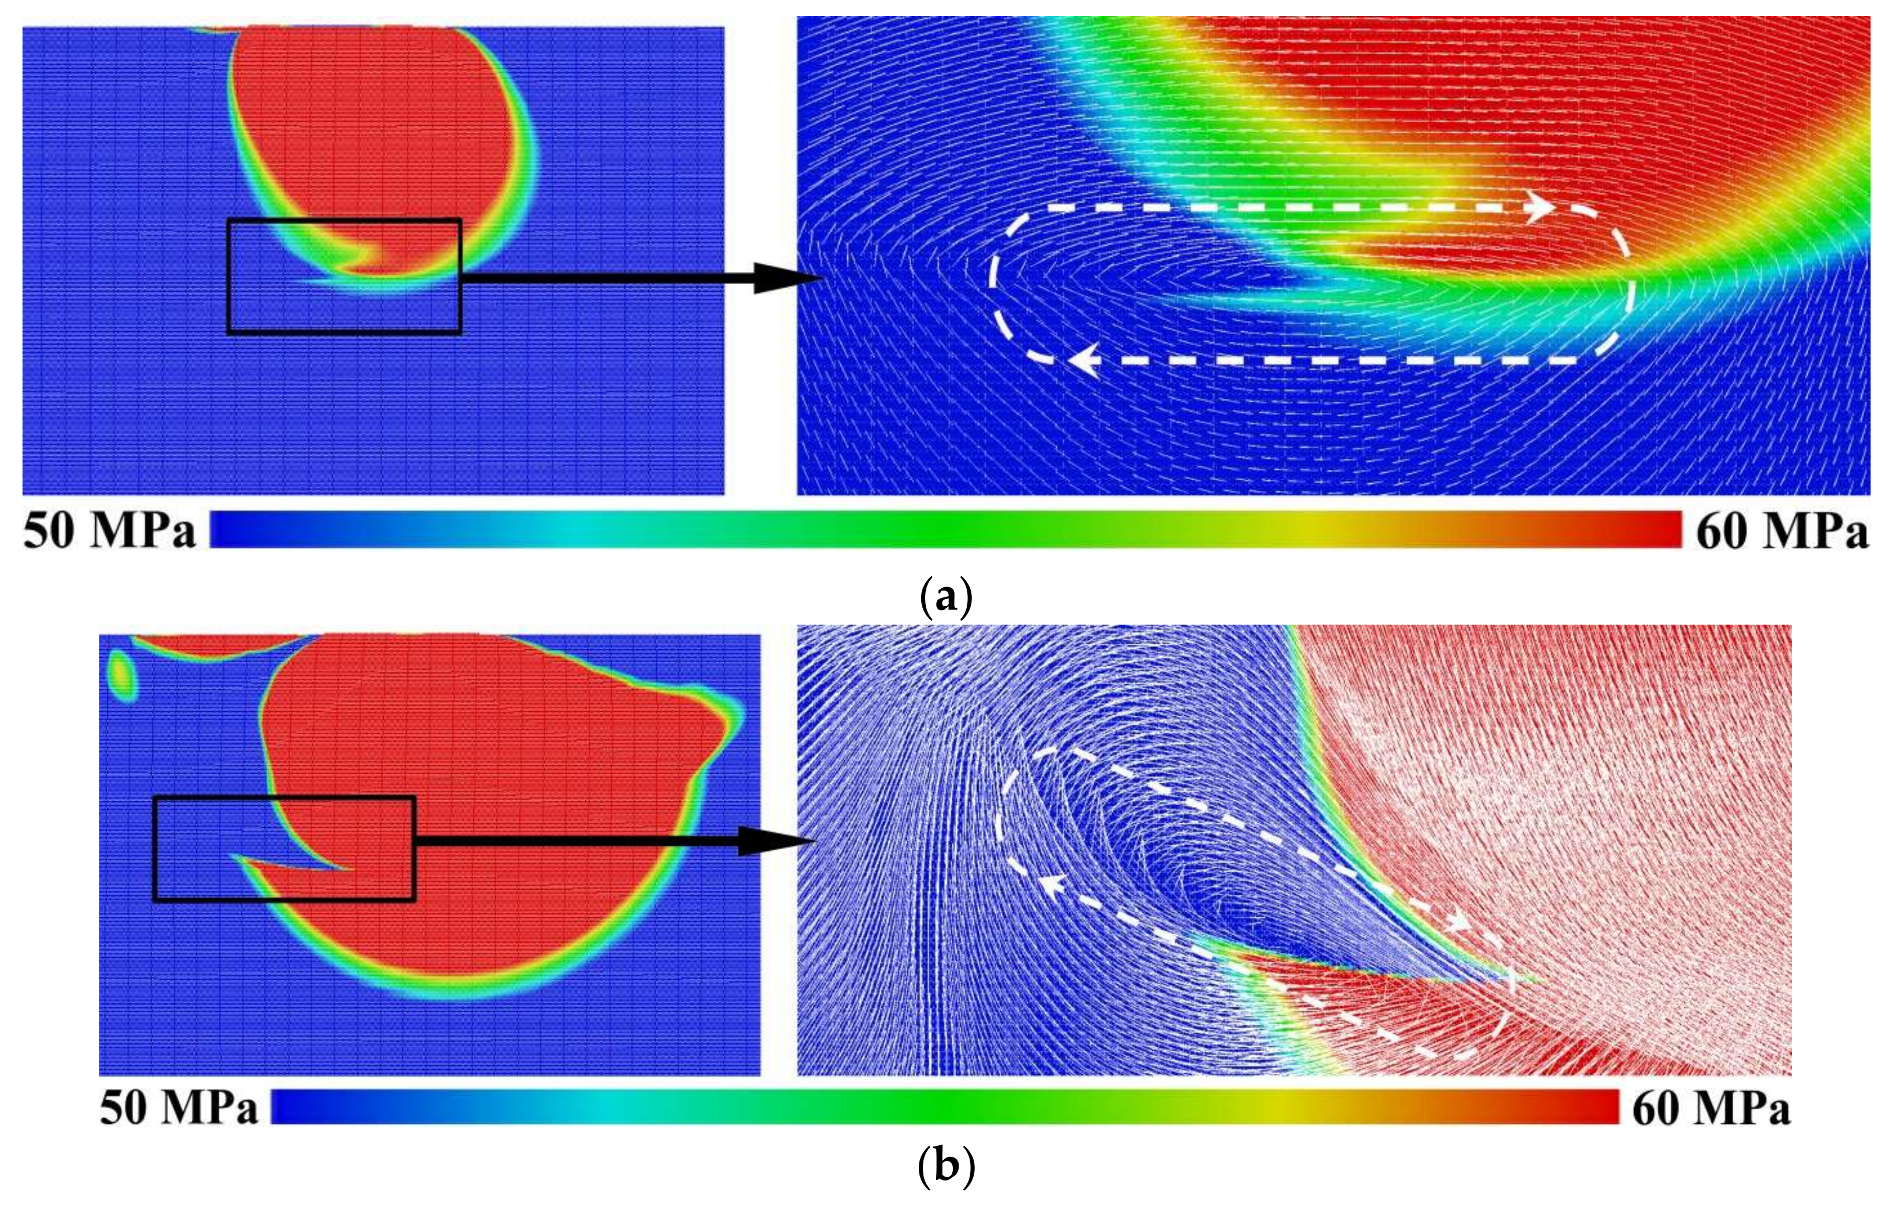
Figure 5 shows examples of the vortices initiated at contact pressure σ
n ≈ 0.36σ
yield and different velocities
Vt. At small loading velocities (
Vt = 1.5 m/s,
Figure 5a), the elastic vortex propagates deep into the material almost vertically (α ≈ 0°) and has an elongated (“flat”) shape. The dimension of such a vortex along the horizontal axis, which is parallel to the contact surface, approximately equals the contact patch size. At the same time, at higher velocities of the contact loading (
Vt = 15 m/s,
Figure 5b), the vortex propagation direction is deflected from the sample symmetry axis to the direction opposite the counterbody velocity. Such vortices form near the contact patch edge. Their size is several times smaller than the contact patch size, and the shape is close to the “classical” circular structure [
31,
35].
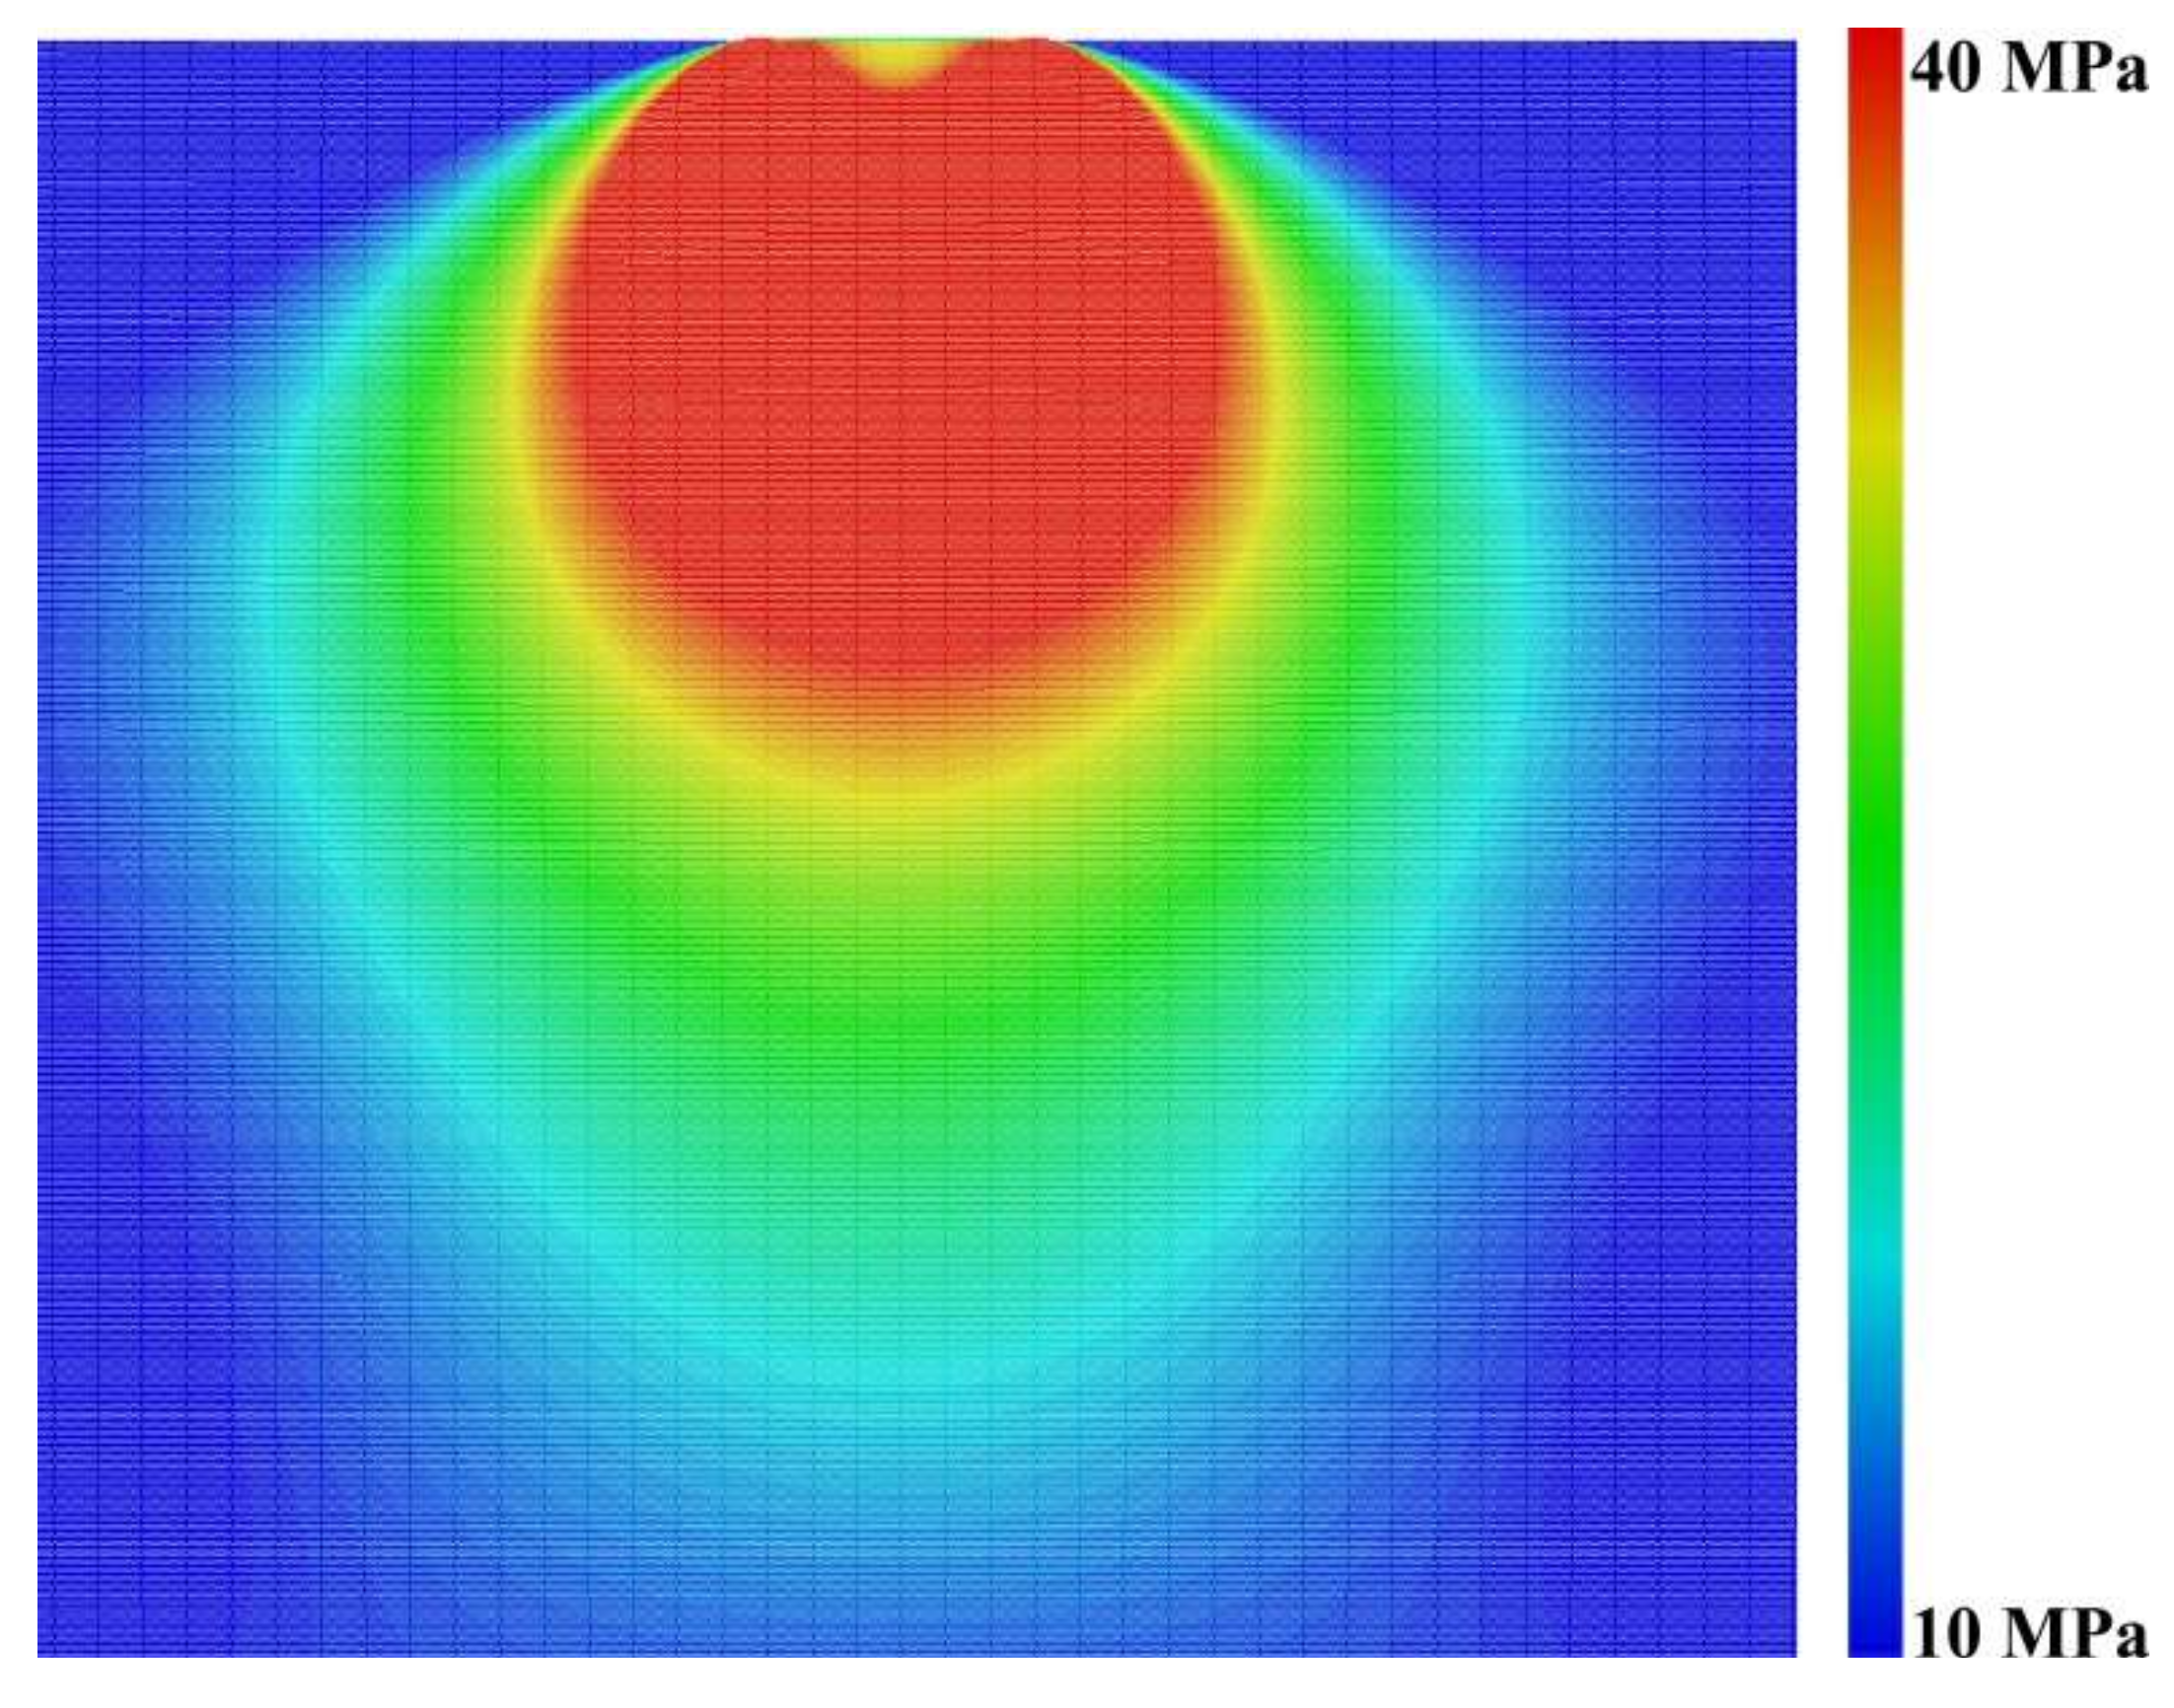
It is necessary to note that as a result of applying initial contact pressure, a static stress state is formed characterized by axis symmetry (
Figure 6). During tangential displacement of the counterbody, an elastic disturbance is propagating from the contact surface deep into the material. The dynamic elastic vortex propagates on the disturbance front and leads to considerable distortion of the stress field.
Figure 7 shows that after passing the vortex, the stress field becomes non-symmetric. In particular, the distribution of the shear stress is characterized by a significant distortion: in the front of the disturbance, the so-called “tongue“ is formed, which is connected to the elastic vortex propagating into the bulk of the material. Note that no such local dynamic structure is observed in dynamic normal contact loading [
29].
We mentioned above that the motion direction of an elastic vortex (the angle α,
Figure 4) depends on the value of tangential contact velocity
Vt and the contact pressure σ
n.
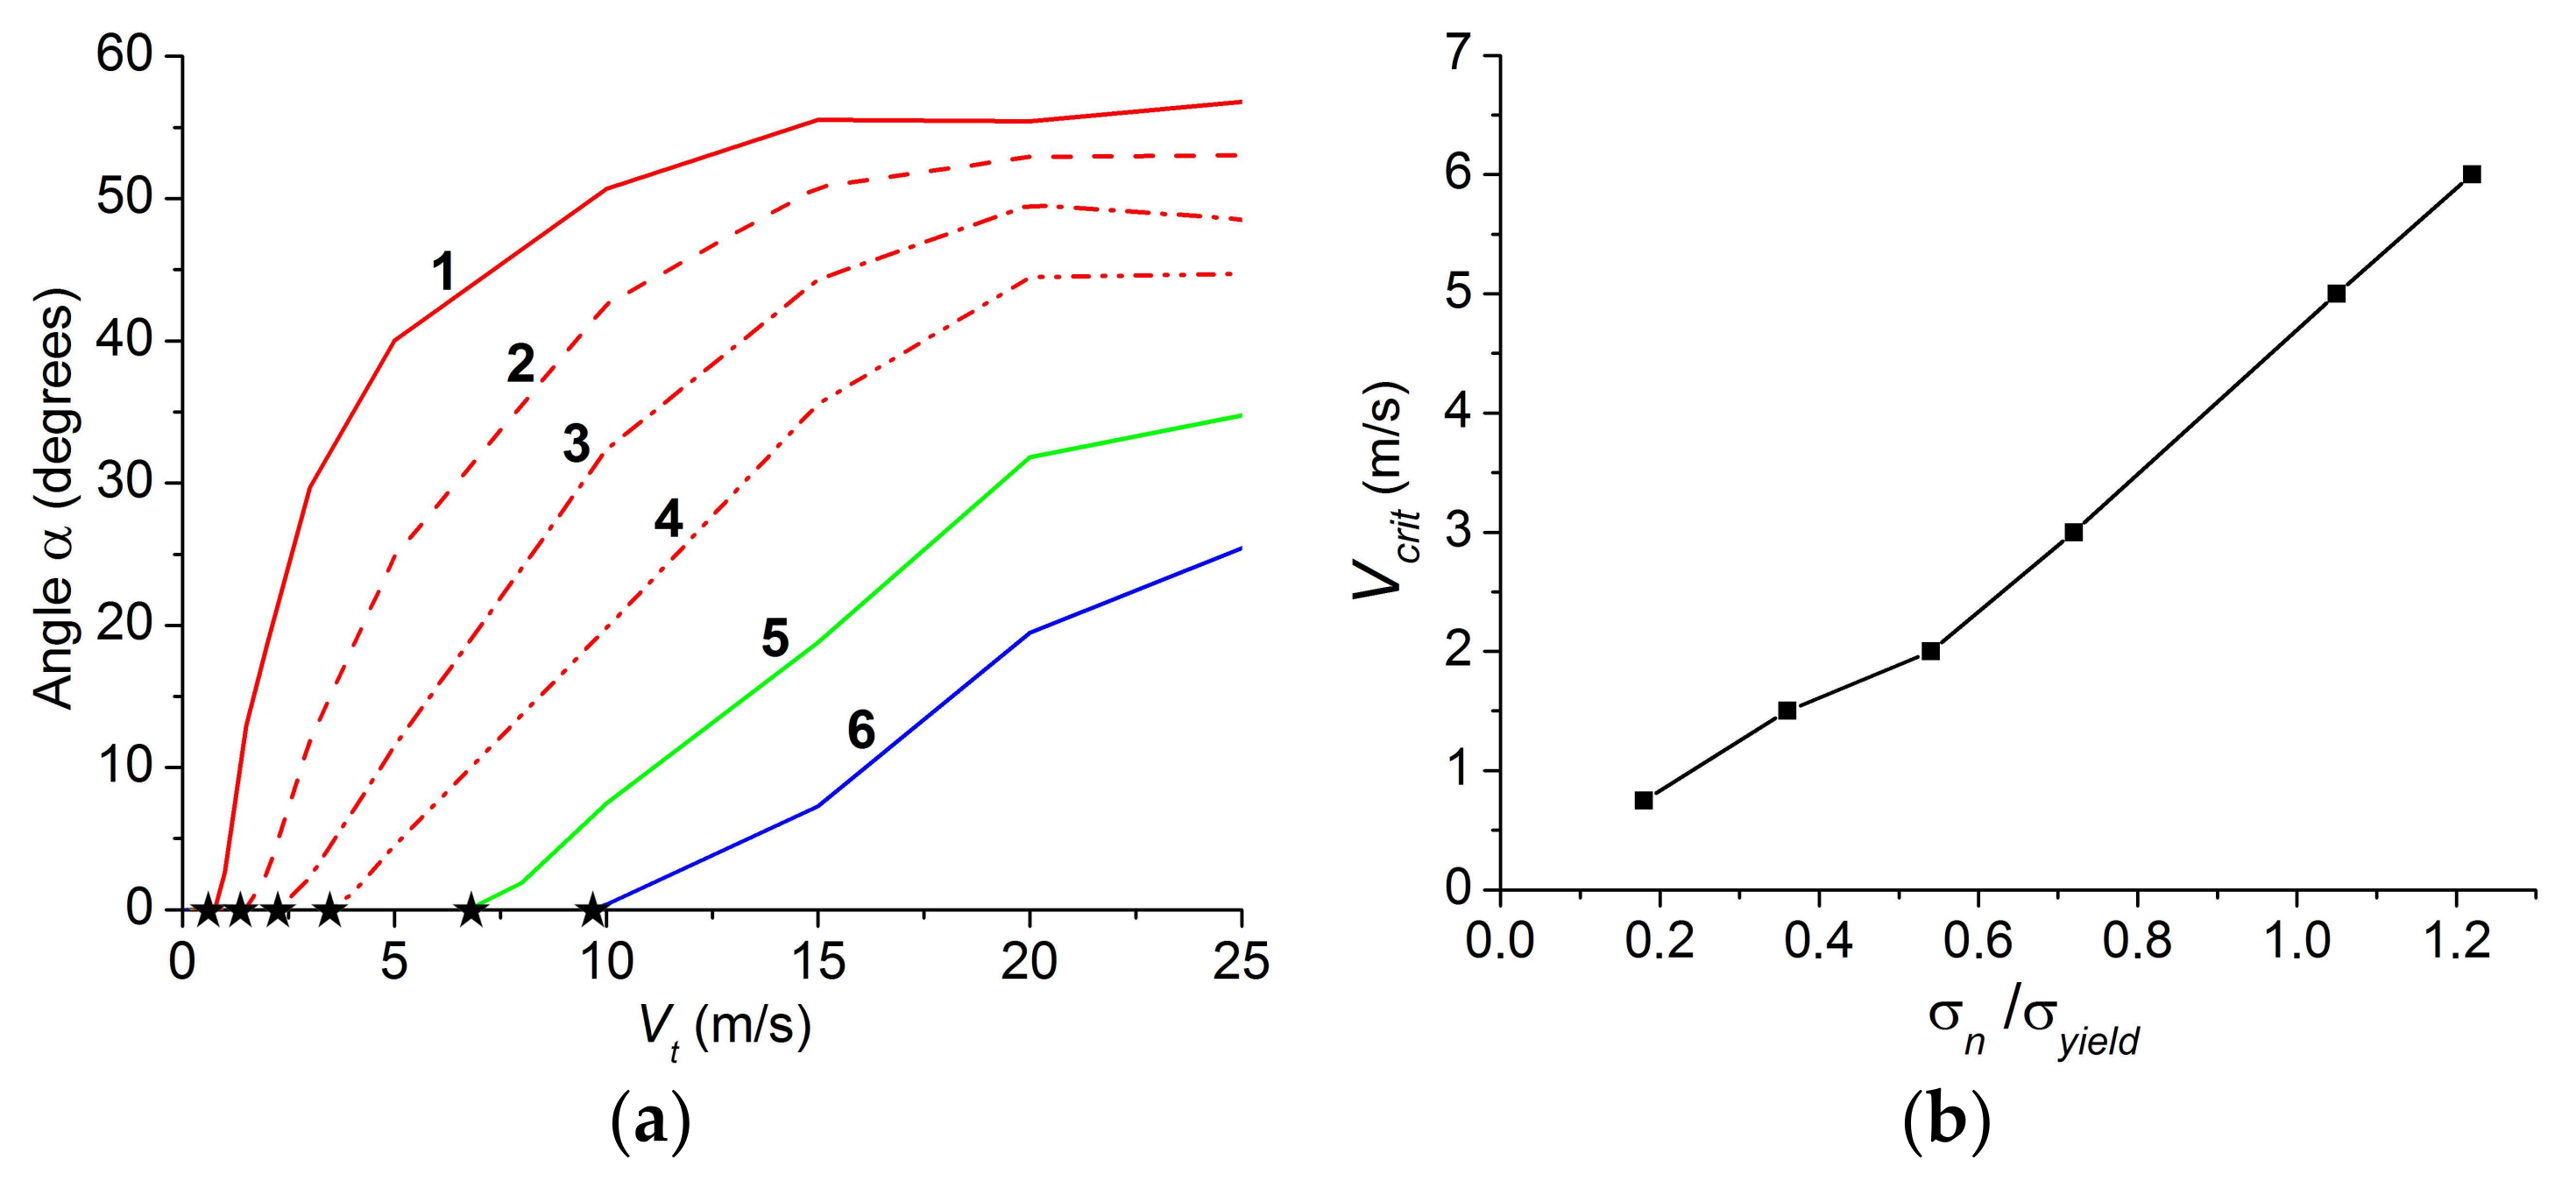
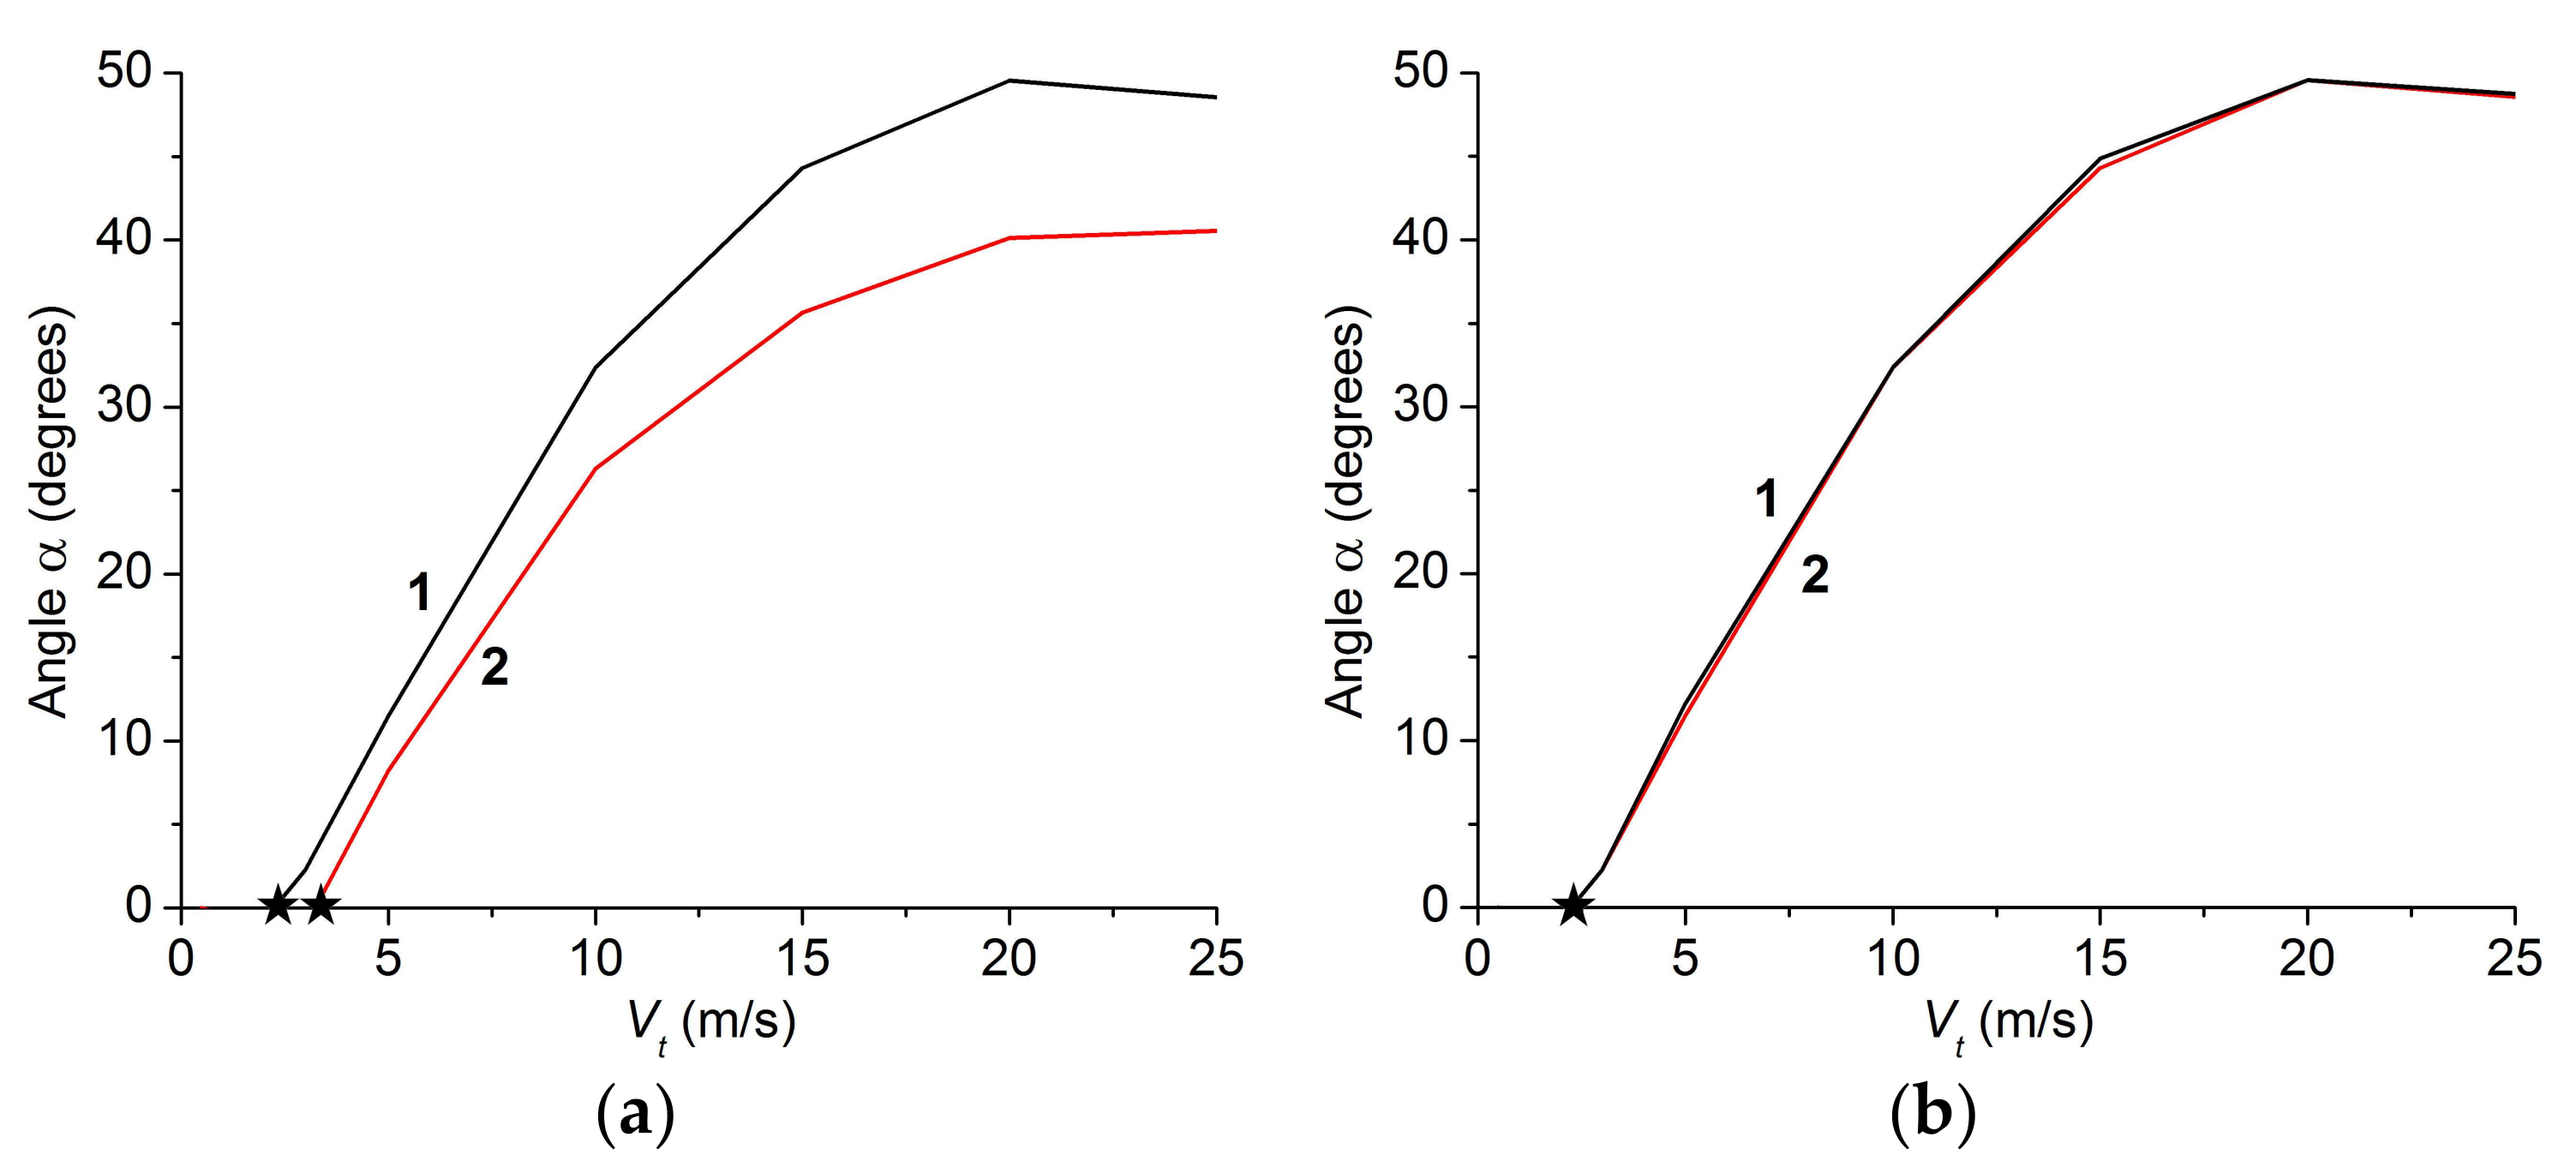
Figure 8a shows examples of how angle α depends on the contact loading velocity
Vt at different values of contact pressure. One can see that the dependence α(
Vt) is monotonic, non-linear and threshold-like. At low loading velocity (below the certain threshold value
Vcrit), the vortex has a flat shape similar to that shown in
Figure 5a, and moves deep into the material along the normal to the contact surface (α ≈ 0). At
Vt >
Vcrit, the elastic vortex propagates at a non-zero angle α to the vertical line in the direction opposite the direction of motion of the counterbody. The value of the angle α non-linearly increases as the difference (
Vt −
Vcrit) increases and tends to saturation at
Vt ≈ 15–25 m/s (depending on the contact pressure). The shape of the elastic vortices formed in this case is more circular with major semiaxis oriented at an angle to the contact surface (
Figure 5b). The simulation results indicate that with increasing contact pressure σ
n, the velocity range in which the elastic vortex is able to propagate along the normal to the contact surface increases proportionally to the pressure (
Figure 8b). We also note that the “saturation level” (maximum value of the angle α) decreases with increasing contact pressure.
As the elastic vortex moves into the volume of the material, its elastic strain energy (characterized, in particular, by the magnitude of shear stresses) decreases due to dissipation and scattering. This leads to attenuation of the vortex and it disappearing as a dynamic object. Therefore, the question of the character depth of the surface layers of the material, which is capable of penetrating by an elastic vortex initiated in the contact patch, is very topical. Since the energy dissipation of a vortex in a plastically deformable material is capable of ensuring its rapid attenuation [
32], in this paper, we considered the “limiting” case of a linearly-elastic material (which corresponds to the conditions of material loading, under which the maximum shear stresses in the central region of the elastic vortex are below the yield strength of the material). In this case, the attenuation of the elastic vortex as it propagates in the material is determined only by the scattering effect. The analysis of vortex propagation in a linearly-elastic material make it possible to estimate the characteristic values of the “limiting” (maximum) penetration depth.
The results of the study showed that the characteristic depth of penetration of the elastic vortex is determined by its characteristic dimensions (which in turn are determined by the size of the contact patch that has initiated this vortex). Hereinafter, the term “characteristic penetration depth” implies the distance traveled by an elastic vortex, at which the value of the elastic strain energy of distortion
(σ
eq is equivalent stress,
G is shear modulus of material) in the center of the vortex decreases by an order of magnitude (this condition is equivalent to the condition of decreasing σ
eq by three or more times).
Figure 9a shows typical curves for the decrease in the equivalent stress in the central region of elastic vortices σ
eq as they move into the bulk of the sample. The shown values of the equivalent stress were determined by averaging the local values in cellular automata located in a region bounded by an elliptical contour centered at the center of the elastic vortex. The descending curves of equivalent stress σ
eq are weakly nonlinear and are approximated with good accuracy by quadratic dependences of the form:
where σ
0, σ
1 and σ
2 are constants and
x =
r/
L is the reduced distance traveled by the elastic vortex, obtained by the ratio of the absolute value of the distance
r to the size of the contact patch
L.
Analysis of the simulation results showed that the values of the constants σ
0, σ
1 and σ
2 in the first approximation can be considered to be linearly dependent on the initiating tangential velocity
Vt and Young's modulus of the material
E (both linear dependences are increasing). The numerical value of the constant σ
2 is about an order of magnitude less than σ
1; therefore, the nonlinear term in (1) becomes significant for
x > 2. At the initial stage of the propagation of an elastic vortex, the law of decreasing the magnitude of shear stresses can be considered linear, which corresponds to a quadratic scattering law of the density of elastic strain energy of distortion
Wel. We also note that the linear character of the dependence σ
0(
Vt) corresponds to the quadratic dependence of the elastic strain energy density
Wel on
Vt. This result is confirmed by the analytical estimates of the authors [
30].
Our calculations have shown that the typical value of the characteristic penetration depth of elastic vortices is about 3–5 linear dimensions of the initiating contact area (the size of the contact area in the example given in
Figure 9a was 10 μm) and depends weakly on the initial energy of the vortex and on the value of the contact pressure σ
n. The most “extreme“ dynamics is demonstrated by elastic vortices generated at high contact-surface displacement velocities
Vt exceeding several times the threshold value
Vcrit and propagating at a sufficiently large angle α. After passing the distances of ≈2–3
L, such vortices rapidly “collapse”, namely, disappear as dynamic objects of the vortex-type (see Curves 7–8 in
Figure 9a). Here, special study has shown that the described regularities of attenuation of elastic vortices, including the “collapse” of high-energy vortices, is general for contact areas of different sizes
L.
We also note that the scattering of the energy of elastic vortices is much faster (by an order of magnitude) than the energy scattering of a plane transverse elastic wave, characterized by the same initial value of equivalent stress (
Figure 9b).
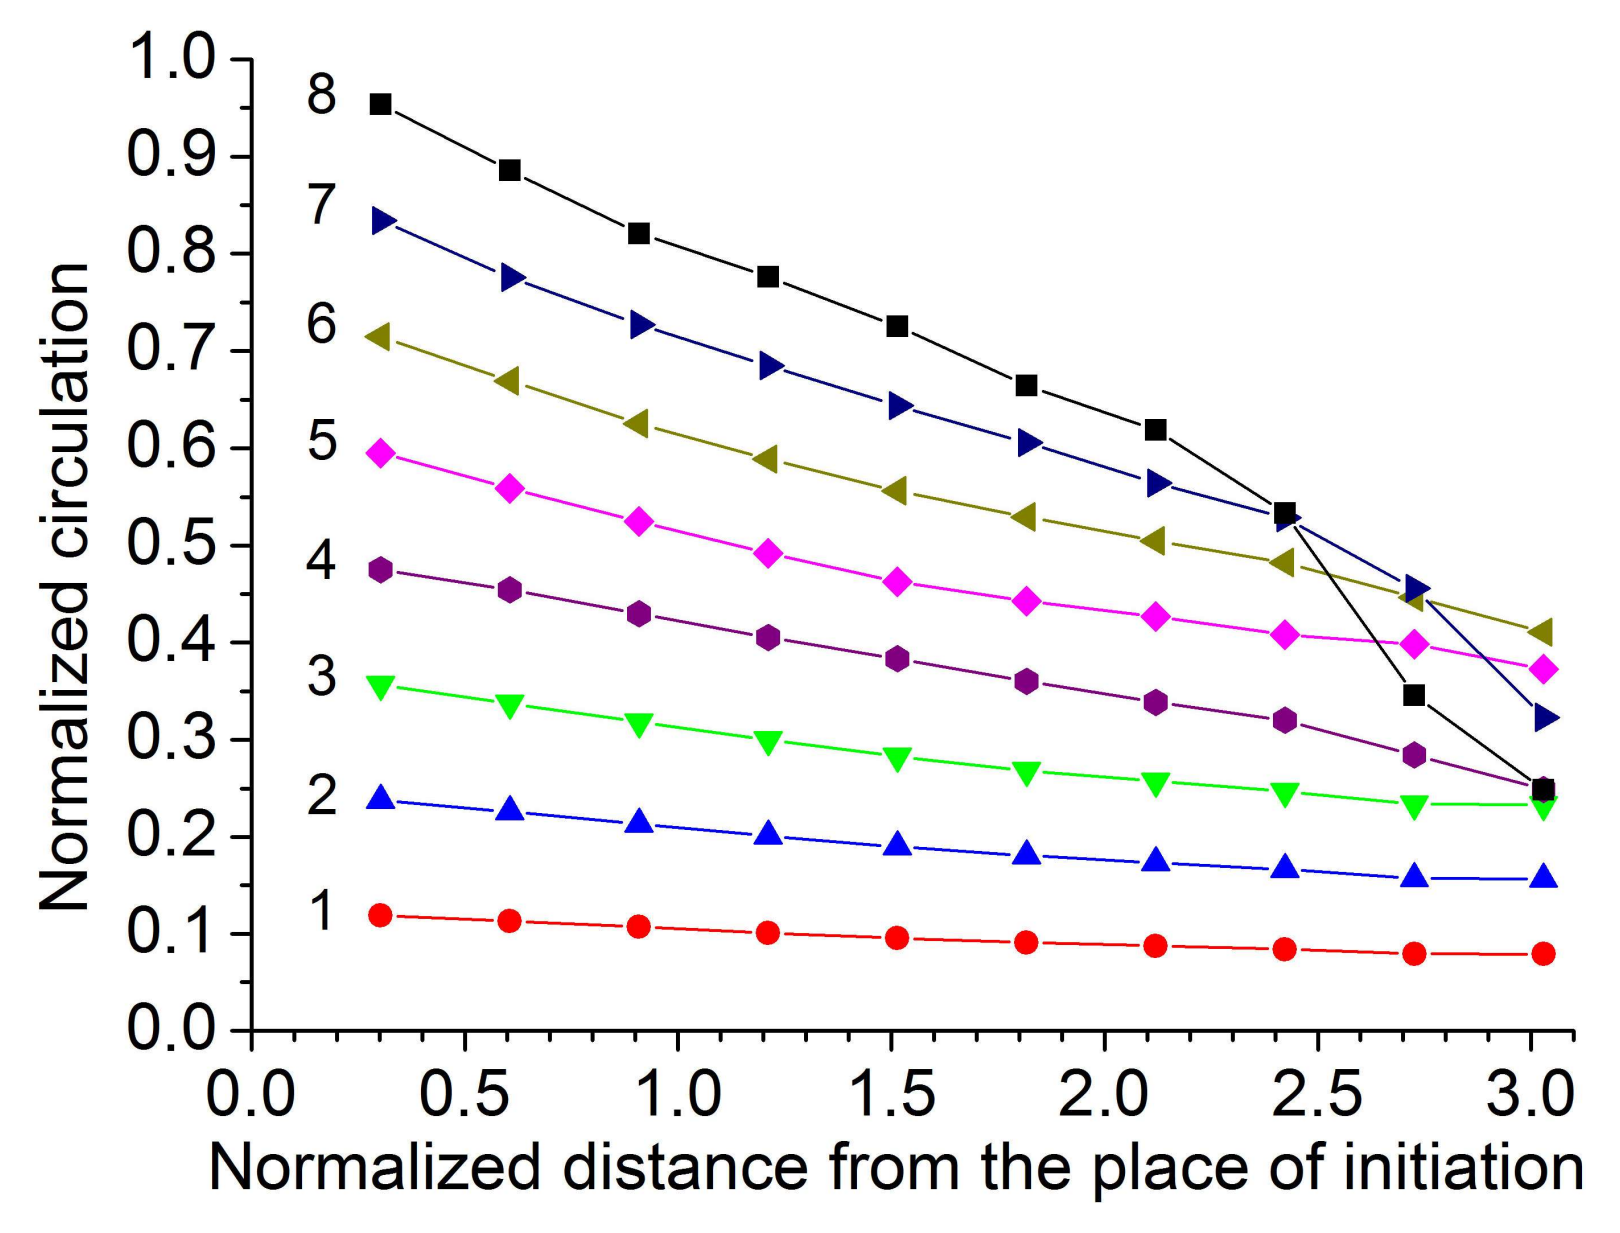
To demonstrate that the localized elastic waves under investigation are of a vortex nature,
Figure 10 depicts the curves of the decrease in the velocity field circulation in an elastic vortex as it moves into the bulk of the sample. Circulation values
were determined from the closed circuit
Γ, bounding the central region of the elastic vortex, in which the averaged values of σ
eq were calculated (here,
is the velocity vector of the automaton lying on the circuit
Γ and
is an increment of radius vector
along the circuit). It can be seen that the initial values of the circulation linearly depend on the initiating tangential velocity of the surface
Vt. The law of the decrease in the value of the circulation of elastic vortices as they move into the bulk of the sample can be assumed linear.
4. Discussion
Similar to the dynamic growth of the areas of dynamic slip in adhesive contacts [
31,
39], tangential displacement of the surface in adhesiveless contact leads to the formation of localized elastic waves of the vortex type (called elastic vortices) in the surface layers adjacent to the contact spot. The circular pattern of the collective elastic motion in the surface region of the sample is a consequence of (a) large displacement gradients and (b) bending strains at the edges of the contact area. The elastic vortex nucleates at the initial stage of the dynamic change in the stress state of the adjacent material region (at the stage of establishing a stationary regime of deforming).
The stress state of the elastic vortex is mainly contributed by the non-diagonal (shear) components of the stress tensor. Maximum shear stress is in the central part of the region involved in the collective elastic vortex-like motion. The magnitude of shear stress at the center of “newborn” elastic vortex is close to the magnitude of shear stress in the plane shear wave initiated at the same velocity. At the same time, due to the localized nature of the elastic vortex, the rate of scattering of its elastic strain energy during the propagation from the contact surface toward the bulk of the material is an order of magnitude higher than for a plane wave. The reason for this difference is the nonplanar (elliptical) shape of the vortex and the presence of lateral boundaries. This causes not only a concentrated transfer of elastic strain energy in the direction of vortex propagation, but its “loss” due to the emission of elastic waves in the spectrum of directions from −π/2 up to +π/2 radians with respect to the direction of vortex propagation. This loss determines the rapid attenuation of an elastic vortex. The results of the study showed that the value of elastic strain energy density in the central (core) region of an elastic vortex decreases by an order of magnitude at the depth of about 3–4 sizes of the initiating contact area. These regularities of propagation and scattering of the localized elastic strain energy determine the essential difference of the evolution of elastic vortices in the bulk of the material from elastic vortices in thin plates [
31,
32,
36]. In particular, an order of magnitude decrease in the density of elastic strain energy of the vortex in a thin plate is achieved after passing distances exceeding the characteristic height of a plate by 1–1.5 orders of magnitude. This is the result of the absence of energy scattering by means of the emission of elastic waves in a wide direction range.
We noted in the Introduction that elastic vortices are capable of initiating local inelastic deformations or local damages/cracks in thin plates. The ability of these localized stress concentrators to propagate toward the bulk of the material at different angles allows one to consider an elastic vortex as one of the possible mechanisms for the formation of thin “shear unstable“ surface layers (in ductile materials) [
16,
18] or gradual degradation of surface layers (in brittle materials including composites) in friction. Moreover, the size, shear stress concentration and the direction of propagation of the elastic vortex are unambiguously determined by the parameters of dynamic loading of the contact surface. This allows one to consider the possibility of developing an approach to the controlled mechanical treatment of thin surface layers or their specific regions. From the foregoing, it is obvious that such treatment would be effective at depths no more than five times greater than the dimensions of the “initiating“ area of the surface.
The above-said confirms the relevance of the revealing of “control parameters” that determine the direction of propagation of the elastic vortex (angle α) and the threshold value of the initiating tangential velocity
Vcrit of the surface. The dependences α(
Vt) and
Vcrit(σ
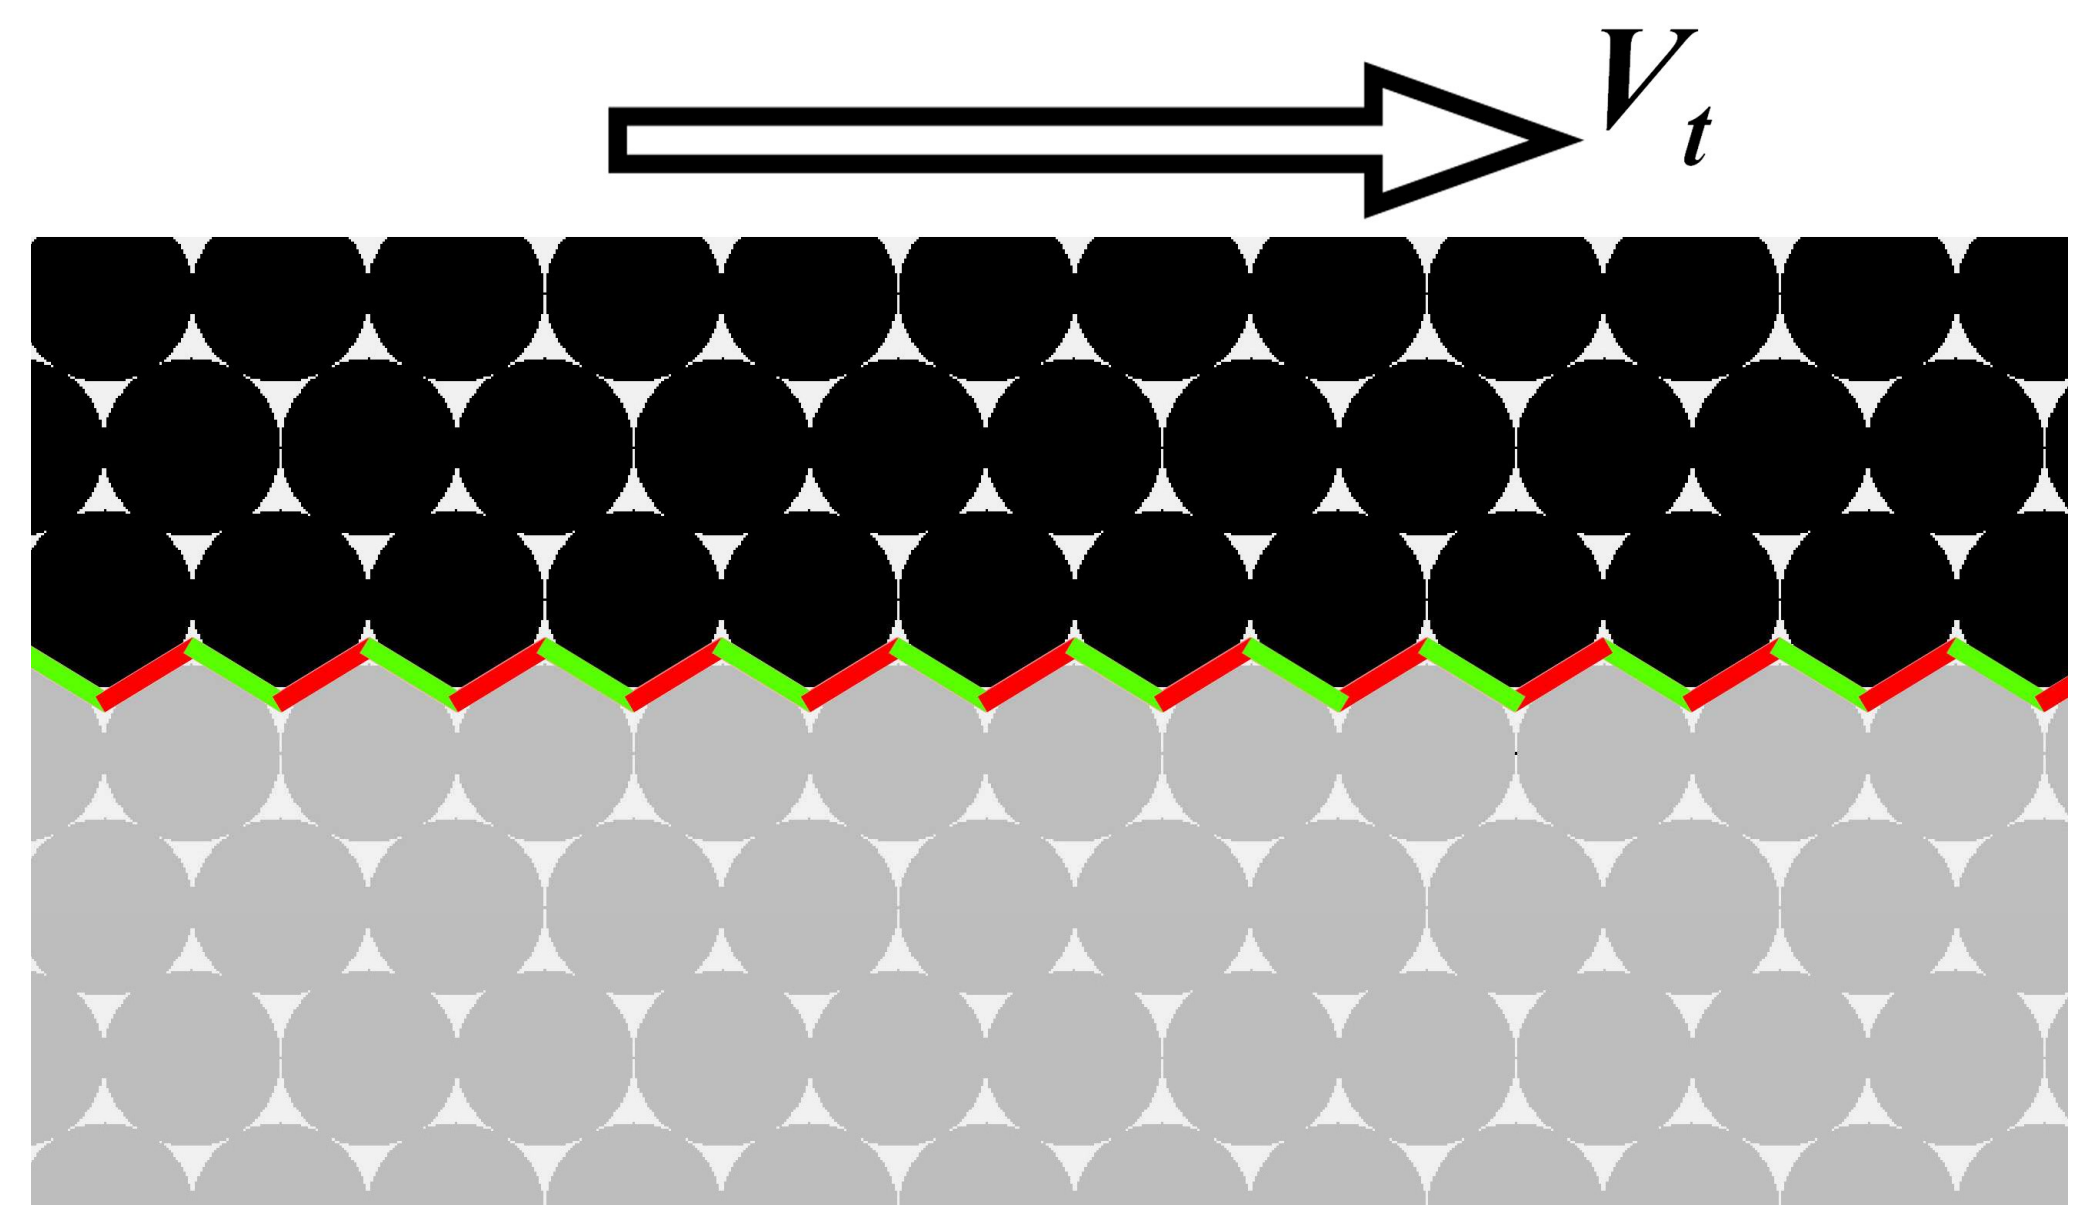
n) are related to the roughness of both the counterbody surface and the surface of the sample. In the study, both surfaces are one-scale, equal and regularly rough (
Figure 11). The surface roughness parameters, in this case, are determined by the size of the movable cellular automaton
d. The dynamic motion of the counterbody along the contact plane (at the velocity
Vt) is accompanied by a local increase in the contact pressure in the “frontal” parts of asperities (the corresponding contact areas of asperities are marked with red segments in
Figure 11). At the same time, the contact area and the contact pressure in the “back” areas of asperity contact (marked by green segments in
Figure 11) are reduced. This is accompanied by elastic perturbation in the area of contact interaction and the formation of a vortex-like dynamic structure in the adjacent surface region of the solid.
The dimensions of the resulting vortex, the spatial orientation of its large axes and the propagation direction are determined by the contact pressure loss rate of the “back” areas of counterbody asperities and the rate of adjustment (accommodation) of the surface layer to contact loading. Note that the term “accommodation” implies the formation of a smooth velocity distribution (gradient ) in the surface layer of the sample. The difference between the local pressures in the frontal and back contact spots of asperities increases with the increase in the counterbody velocity Vt, as well as with a decrease in the applied pressure σn.
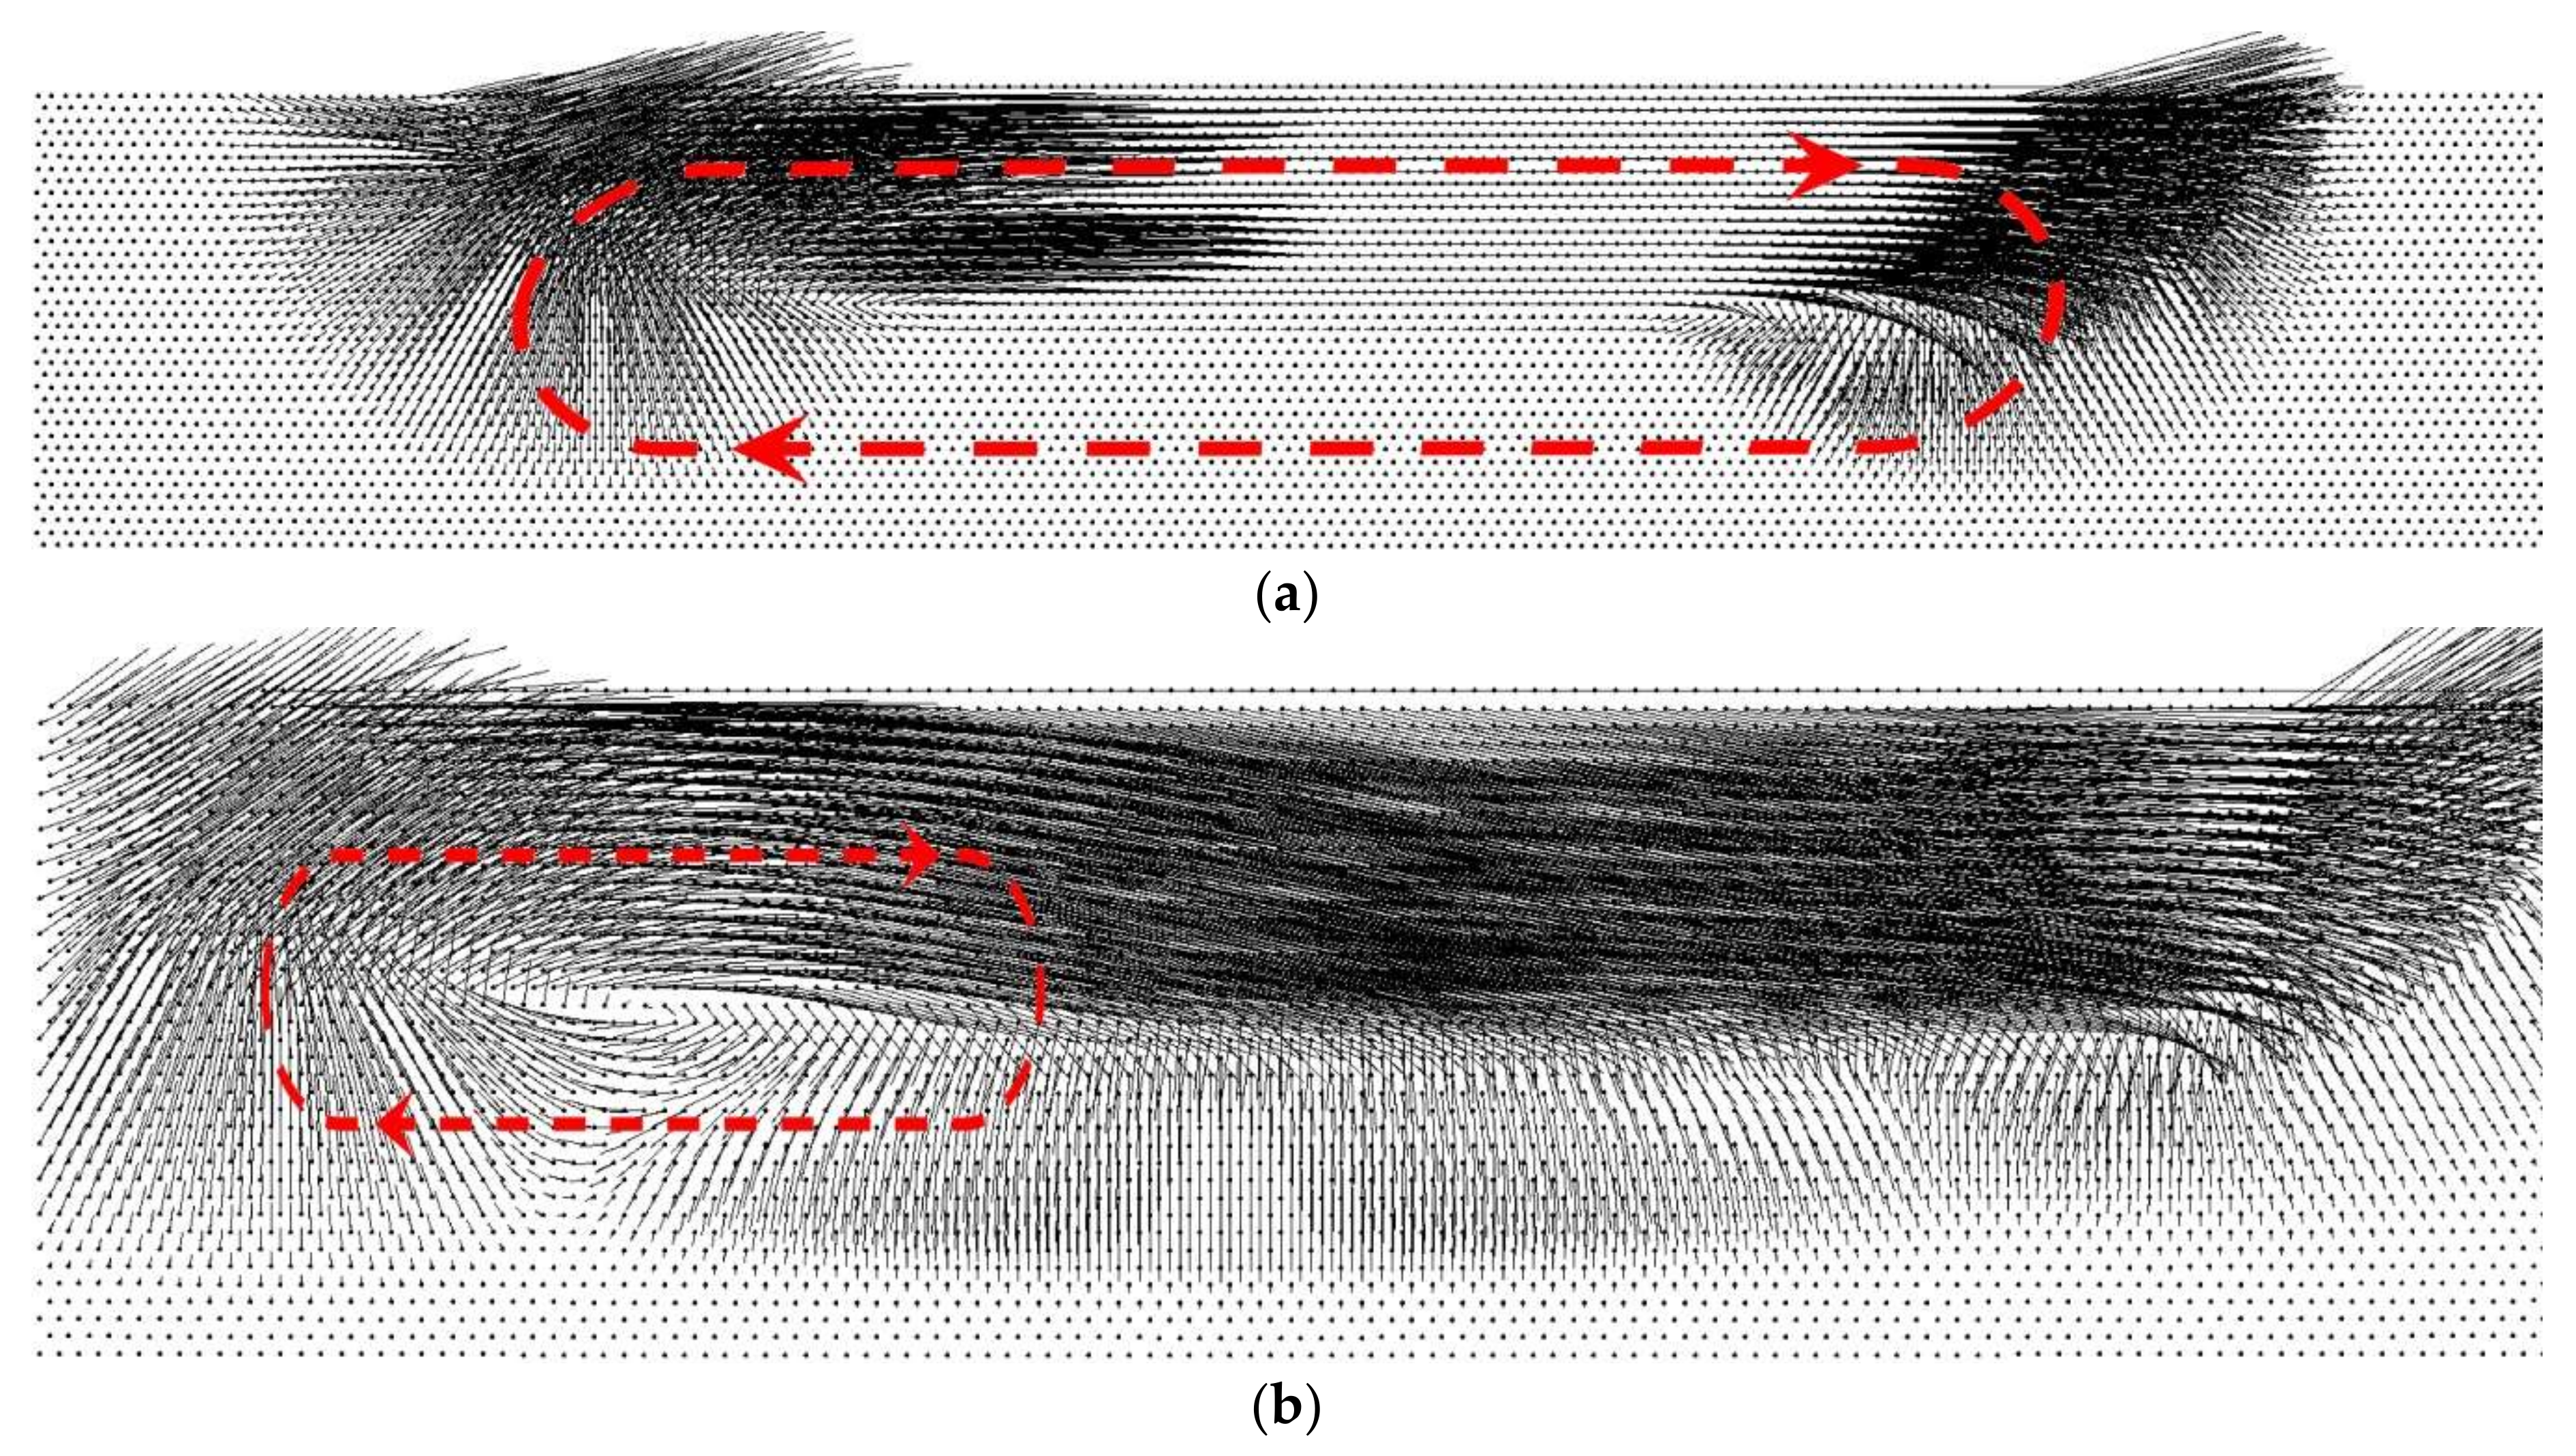
At low contact velocities (
Vt <
Vcrit), the sample surface has time to adjust to the loading. This is accompanied by the formation of an elongated vortex under the contact area. The length of a vortex is close to the length of the contact zone (
Figure 12a). Such a vortex propagates toward the interior of the sample along the normal to the surface (α ≈ 0). At the same time, at
Vt >
Vcrit, the “back” regions of the asperities of the counterbody quickly lose the contact with asperities of the sample surface, and the surface layer of the sample does not have time to “smoothly” adapt to the external loading. This results in a complex velocity field in the near-surface layer of the simulated sample and the formation of an elastic vortex in the rear part of the contact area of solids (
Figure 12b). Such a vortex is characterized by substantially smaller linear dimensions and propagates toward the interior of the sample at a nonzero angle to the normal to the contact surface.
An increase in the contact pressure σ
n provides an increase in the areas of asperity contact spots and the time of the exit of “back” areas of counterbody asperities from the contact with sample asperities. Moreover, an increase in σ
n leads to an increase in initial stresses (and density of elastic strain energy) in the surface layer of the deformed sample. This allows for a faster accommodation of the surface layer to a dynamic change in the stress state at the beginning phase of tangential displacement of the counterbody. Both factors cause an increase in the threshold velocity
Vcrit with increasing contact pressure (
Figure 8b).
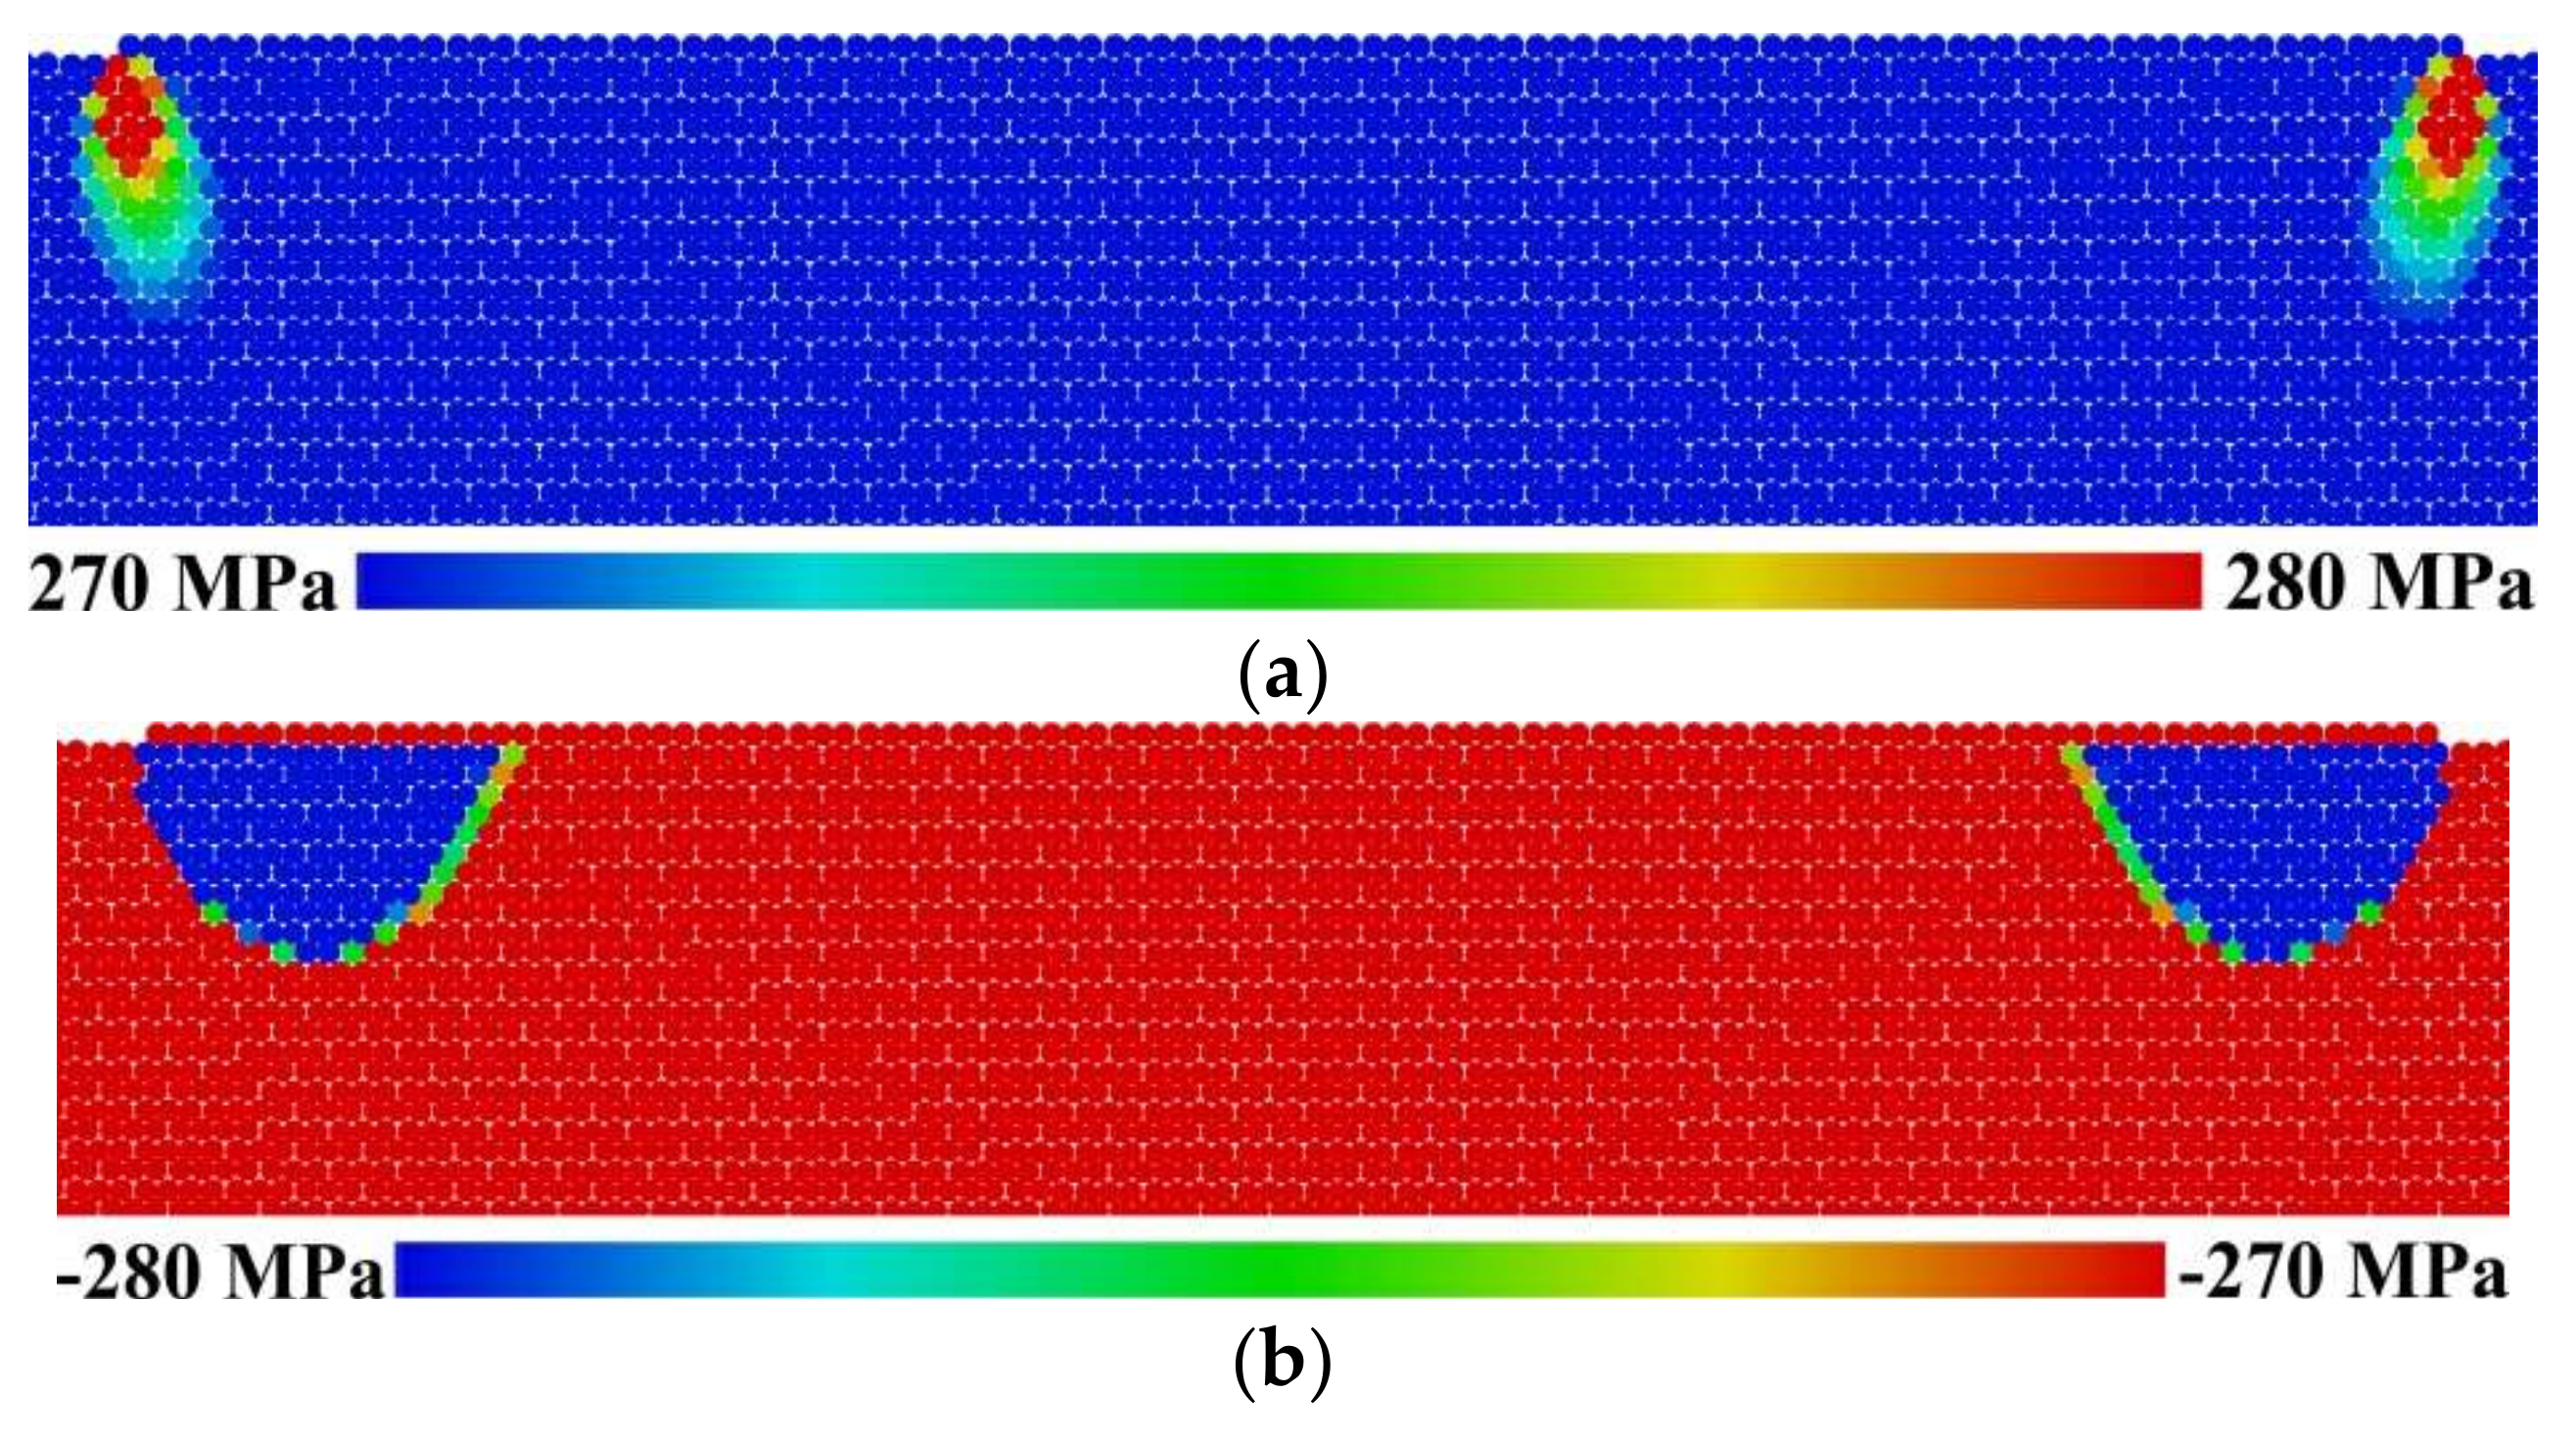
It is necessary to mention separately an influence of local plastic strains in contact surfaces on the features of nucleation of elastic vortices in the surface layer. Plastic strains provide a more complete contact of asperities of the bodies and thus can contribute to an increase in the contact velocity range
Vt within which the elongated and vertically-propagating elastic vortices are formed. Analysis of simulation results showed that at σ
n close to σ
yield or larger than σ
yield, the regions of the sample surface layer near the corners of the counterbody surface are plastically deformed (
Figure 13a). The magnitude of compressive volumetric stresses in these regions is significantly higher than in the central part of the contact area due to the more “tight” contact interaction of plastically-deformed surfaces (
Figure 13b). The special study has shown that a significant deviation in the dependence of
Vcrit(σ
n) from the linear profile in
Figure 8b begins at σ
n, which is considerably higher than the yield strength of the material (i.e., at contact pressures ensuring plastic deformation of most of the contact area). The analysis of the parametric region σ
n >> σ
yield is the subject of a separate study.
The geometric characteristics, stress concentration and direction of propagation of a dynamic vortex are determined not only by the magnitude of the contact pressure and the loading velocity, but also by a dimensionless parameter proportional to the number of asperities in the contact surface. Within the considered model, the number of asperities is determined by the ratio of the length of the counterbody (
L) to the size of the movable cellular automaton
d:
Ncont =
L/
d.
Figure 14a shows examples of the curves α(
Vt) for the contact areas characterized by different values of
Ncont (here, the increase in
Ncont was achieved by increasing the length of the counterbody while maintaining the unchanged value of automaton diameter
d). One can see that the increase in the number of asperities in the contact area provides an increase in the value of threshold velocity
Vcrit. To a first approximation, this dependence can be assumed to be linear (in the example given, a double increase in
Ncont is accompanied by a nearly double increase in
Vcrit). Similar results are obtained if the length
L of the contact area remains constant and the movable cellular automaton (asperity) size
d decreases two-fold (
Ncont increases two-fold).
At the same time, scaling the system while maintaining the constant value of
Ncont (changing the dimensions of the model setup by
A-times along with changing the size of automaton by
A-times) does not lead to a change in the threshold velocity and the character of the dependence α(
Vt) (
Figure 14b), nor in the energy characteristics of elastic vortices. The coincidence of the curves of α(
Vt) upon system scaling is a confirmation of the scale invariance of the revealed regularities in the formation and propagation of collective elastic vortex-like dynamic objects (elastic vortex) in the material under contact interaction.
The threshold value of tangential contact velocity Vcrit is determined not only by the concentration of asperities in the contact area, but also by the elastic moduli of the material. In particular, the simulation results have shown that the value of threshold velocity Vcrit is inversely proportional to the Young's modulus of the material: Vcrit = a/E, where a is a constant. The strong influence of the Young’s modulus on the condition of qualitative change in elastic vortex evolution (namely, on the value of Vcrit) is explained by the above-described features of the contact interaction of the counterbody and the sample and is similar to the influence of the magnitude of the contact pressure σn. A decrease in the value of the Young’s modulus (stiffness) of the material leads to an increase in the real areas of contact of asperities (at the same value of σn). This allows slowing down the exit of counterbody asperities from the contact with sample asperities under tangential contact load and hence the increase in the critical velocity Vcrit.
The results show that the interaction of surfaces in mesoscale and macroscale contact areas containing a large number of microscale and submicroscale asperities (Ncont ≈ 103–104 and more) should lead to the nucleation of elastic vortices characterized by high shear stresses and propagating along the normal to the contact surface. A range of tangential contact velocities Vt providing the possibility of nucleation of such large-scale vortices covers the operating modes of most tribological systems.
Within the framework of the study, we considered relatively large single-scale asperities. The height of these asperities was sufficient to prevent surface slipping in the whole range of contact pressures. This provides the formation of “high-energy” elastic vortices with high shear stresses in the central region. In real contact pairs, the asperity sizes and the squares of the local contact spots of asperities are typically distributed over several orders of scales [
3,
5,
6,
45]. The asperities of the smallest spatial scales can lose the contact and start to slip already at the initial phase of the surface tangential displacement. Therefore, the dimensions of the elastic vortex nucleating under the contact surface, as well as the magnitude of shear stresses in its central part and the direction of propagation toward the interior of the material are determined by the number of local contact spots constituted by large-scale asperities. It is clear that the “maximal attainable” energy characteristics of elastic vortices generated under sufficiently smooth surfaces would be substantially lower than under surfaces with sufficiently “high” asperities. Therefore, in real contacts, the upper limit of the energy characteristics of the elastic vortex depends, among other factors, on the height of the largest scale asperities or on a roughness-related integral characteristic such as the friction coefficient.
Note that since the real contact consists of a number of different-scale contact spots, they not only participate in the formation of a “global” elastic vortex, but they can also provide the formation of local elastic vortices. The dimensions and energy density of these vortices, as well as the characteristic depth of penetration into the material are determined by the scale and structure of the local contact spots and local loading conditions. Therefore, the initial phase of the dynamic contact interaction of bodies with a multiscale surface roughness can be accompanied by the formation of a hierarchy of elastic vortices of different scales under the contact area.
We finally have to note that lubrication helps to “facilitate” the slippage of asperities in local contact spots. Therefore, it is reasonable to suppose that under the conditions of lubricated contact interaction, the energy characteristics of elastic vortices will be substantially lower than for dry contact of the same surfaces.

 ,
, 


