
Genome-Wide Epigenetic Studies in Chicken: A Review
by
 and
and
Sarah-Anne David
1,†, 
Marjorie Mersch
2,†,
Sylvain Foissac
2,
Anne Collin
1,
Frédérique Pitel
2,* and
Vincent Coustham
1,* 1
URA, INRA, 37380 Nouzilly, France
2
GenPhySE, Université de Toulouse, INRA, INPT, ENVT, 31326 Castanet Tolosan, France
*
Authors to whom correspondence should be addressed.
†
These authors contributed equally to this work.
Epigenomes 2017, 1(3), 20; https://doi.org/10.3390/epigenomes1030020
Submission received: 26 September 2017
/
Revised: 17 November 2017
/
Accepted: 21 November 2017
/
Published: 23 November 2017
Abstract
:Over the years, farmed birds have been selected on various performance traits mainly through genetic selection. However, many studies have shown that genetics may not be the sole contributor to phenotypic plasticity. Gene expression programs can be influenced by environmentally induced epigenetic changes that may alter the phenotypes of the developing animals. Recently, high-throughput sequencing techniques became sufficiently affordable thanks to technological advances to study whole epigenetic landscapes in model plants and animals. In birds, a growing number of studies recently took advantage of these techniques to gain insights into the epigenetic mechanisms of gene regulation in processes such as immunity or environmental adaptation. Here, we review the current gain of knowledge on the chicken epigenome made possible by recent advances in high-throughput sequencing techniques by focusing on the two most studied epigenetic modifications, DNA methylation and histone post-translational modifications. We discuss and provide insights about designing and performing analyses to further explore avian epigenomes. A better understanding of the molecular mechanisms underlying the epigenetic regulation of gene expression in relation to bird phenotypes may provide new knowledge and markers that should undoubtedly contribute to a sustainable poultry production.
1. Introduction
Beyond its well-established role as a developmental model for embryogenesis studies, poultry is a major source of healthy proteins through meat and egg production. Over the past 50 years, studies have focused on the improvement of poultry production notably through genetic selection. However, quantitative trait analyses and genome-wide association studies have shown that genetic variation is not the only contributor to phenotypic variability [1]. An increasing number of evidence suggests that epigenetics may also contribute to the phenotypic diversity of animals, in interaction with their environment [2]. Recently, epigenetic reprogramming of gene expression was shown to impact, in the long term, the phenotypes of birds. Notably, several studies have investigated epigenetic marks that may be implicated in behavior [3,4], adaptation [5,6] and the impact of nutrition on chicken performance [7,8]. Moreover, the available information on chicken epigenetics is growing thanks to the recent advances in high-throughput sequencing techniques (HTS). To date, only one epigenome-wide analysis was performed in a non-chicken organism, the Great Tit [9]. Here, we review the recent gain of knowledge on the chicken epigenome by focusing on two epigenetic marks that have been extensively studied during the past decade, DNA methylation and histone post-translational modifications (HPTM), keeping in mind that other epigenetic mechanisms such as non-coding RNAs or mRNA post-translational modifications may also play a major role in phenotypic variability [10,11]. Moreover, DNA methylation and HPTM studies confirmed that these marks were similarly distributed in the chicken genome compared to mammals, and that they displayed similar patterns of association with gene expression status. We then describe examples of global changes in DNA methylation and histone marks that contribute to biological processes such as resistance to infection, or the dynamics of these marks during the lifespan of laying hens. We finally discuss the quality of genome annotation, bioinformatics tools and computational skills that are required for such genome-wide analyses.
2. From Epigenetics to Epigenomics
2.1. Epigenetic Marks
Waddington defined an epigenetic trait in the 1950s as “a trait with a stably heritable phenotype resulting from changes in a chromosome without alterations in the DNA sequence” [12]. Nowadays, epigenetics is commonly defined as the molecular mechanisms involved in the regulation of gene expression that are reversible and heritable (by mitosis and potentially meiosis) without alteration of the DNA sequence. It was shown that epigenetic modifications in eukaryotes can impact gene expression under the influence of the environment (for a review see [13]).
Originally, the most studied epigenetic mark associated with major changes in gene expression was DNA methylation [14,15]. In animals, DNA methylation mostly targets cytosine residues at the carbon 5 position (5mC, [16]), although methylation of adenosine residues has also been reported in mammalian embryonic stem cells [17]. DNA methylation occurs in three different sequence contexts: CpG, CHG or CHH (where H is A, T or C). In vertebrates, 5mC predominates in the CpG dinucleotides. The distribution of 5mC across the genome is non-random and CpG dinucleotides tend to be frequently concentrated in CpG islands [16]. The methylation of DNA in gene promoters is usually negatively associated with gene expression [18,19,20,21], whereas it may be positively correlated with transcription within the bodies of actively transcribed genes [22]. In human monozygous twins, differential methylation was shown across several tissues, suggesting that the life history of an individual is able to modify the way its genome is expressed through DNA methylation [23]. The characterization of DNA methylation associated with phenotypic variation is documented in several species [13]. Notably, a diet supplemented with methyl donors (such as folic acid, vitamin B12, betaine and choline) resulted in altered offspring phenotypes in the gestating viable yellow agouti (Avy) mouse model, explained by the differential methylation of a retrotransposon [24].
Another type of epigenetic mark of interest is histone post-translational modification. Histones are proteins found in eukaryotes that package DNA into structural units called nucleosomes. The histones H2A, H2B, H3 and H4 form a core wrapped by 147 base pairs of DNA [25]. Amino acid residues of histones (tails or core) can be targeted by covalent modifications influencing chromatin structure [26,27]. These HPTM, such as methylation, acetylation, ubiquitination, phosphorylation and sumoylation [28], can influence chromatin conformation, recruitment or eviction of interacting proteins and transcription [29]. They can either be associated with active or repressed gene expression. Acetylation of lysine 27 on histone H3 (H3K27ac) and tri-methylation of lysine 4 on histone H3 (H3K4me3) are commonly categorized as “active” marks. On the one hand, acetylation of positively charged lysine residues on histone tails was shown to neutralize their charge, resulting in a lower interaction between the histone tail and the nucleosome, therefore opening the chromatin (for review see [30]). On the other hand, H3K4me3 is frequently associated with the start of genes and favors an “open” chromatin state enabling gene expression (for review see [31]). In Arabidopsis plants, following heat stress, a long lasting accumulation of H3K4me3 was shown at the locus of highly expressed genes implicated in heat stress memory [32]. In contrast, trimethylation is commonly associated with gene repression when it targets lysine 9, 36 and 27 of histone H3 (H3K9me3, H3K36me3, H3K27me3). Unlike H3K4me3, H3K27me3 is often associated with a “closed” chromatin state linked to the memory of gene repression (for review see [31]). A well-described illustration of the role of H3K27me3 in epigenetic control of phenotype through gene regulation is vernalization in Arabidopsis [33]. Vernalization promotes flowering through the cold-induced repression of a floral repressor which is maintained by the spreading of H3K27me3 marks all over the flowering locus C (FLC) locus. So far, H3K4me3 and H3K27me3 are the two most studied HPTM. However, the genome-wide distributions of other marks such as H3K9me3, H3k36me3 and H3K27ac have also been investigated in several species [34]. At a finer resolution, combinatorial models of various HPTMs were shown to define specific chromatin states (for a review see [35]) and predict gene expression levels [36]. Thus, with the development of HTS and careful experimental design, the characterization of epigenomes should allow the investigation of interactions between particular chromatin states and the associated phenotypic impact.
2.2. Epigenomics Methods
For the past two decades, the advent of HTS allowed researchers to extend the knowledge of different epigenetic marks at the whole genome level and their interplay in several tissues. Several consortia emerged such as the ENCODE project (Encyclopedia of DNA Elements, [37]), the National Institutes of Health (NIH) Roadmap Epigenomics Project Mapping Consortium [38], the International Human Epigenome Consortium [39] and modENCODE (Model Organism Encyclopedia of DNA Elements [40]). The goal of these consortia was to streamline experimental design and analyses, to provide guidelines and to coordinate the sequencing efforts. They produced several databases containing a collection of epigenomes (mostly based on mammalian species). Since 2015, the willingness to better understand genetic, epigenetic and phenotypic diversity of domesticated species such as the chicken has driven to create a consortium called FAANG (Functional Annotation of Animal Genomes, [41]). Beyond its goal of providing high quality functional annotation of animal genomes including a comprehensive description of the epigenome landscape, FAANG also aims to contribute to the medical and agricultural research (production and welfare) by standardizing core assays and experimental protocols, coordinating and facilitating data sharing as well as establishing an infrastructure to analyze these data.
DNA methylation can be investigated by several approaches [42]. The gold standard method to date is the bisulfite treatment method followed by bisulfite sequencing (BS-seq; Figure 1). This approach is used to analyze methylation patterns at a single base pair resolution. Genomic DNA is treated with sodium bisulfite that deaminates cytosine to uracil. Deamination is blocked by the presence of methylation that can then be inferred by the identification of unconverted C residues [43]. This base modification can be identified by HTS technologies by comparing the sequences of generated reads (for a review see [44]) with a genomic reference allowing to identify the original methylation status. The entire genome of different organisms was initially sequenced using BS-seq (whole genome bisulfite sequencing (WGBS) or MethylC-seq, [45]). More recently, reduced representation bisulfite sequencing (RRBS), presented as a more cost-efficient method, was developed to only sequence the fraction of the genome that is enriched in CpG sequences, i.e., mostly CpG islands [46,47]. This technique combines digestion by restriction enzyme(s) and sequencing in order to provide high sensitivity for areas with high CpG content [48]. Although these two techniques are based on the same principle, WGBS is recommended for the detection of widespread CpG methylations on the genome, while RRBS is more specific to CpG islands, and therefore, promoter regions [49]. Other techniques can be used to analyze DNA methylation: methyl-sensitive restriction enzyme digestion followed by sequencing (MRE-seq), affinity enrichment of methylated DNA fragments (methylated DNA immunoprecipitation sequencing, MeDIP-seq) and methyl-binding domain sequencing, MBD-seq [50]. In particular, MeDIP-seq was a popular alternative to bisulfite sequencing before sequencing costs significantly dropped, as it combines immunoprecipitation of methylated genomic DNA with an antibody specific to 5mC followed by high throughput sequencing [51]. However, these methods present limitations compared to the single base pair resolution obtained by bisulfite techniques. For MRE-seq, the resolution depends on the frequency of the enzyme cut sites. For MeDIP-seq, the sequencing resolution is linked to the size of DNA fragments, CpG density as well as the specificity and affinity of the antibody. Another new technique combining genotyping by sequencing [52] with MeDIP was created to reveal methylation patterns on a reduced fraction of the genome [53]. This approach is based on genome digestion with enzymes unrelated to CpG islands that prevents bias toward CpG islands.
Recently, 5-hydroxymethylcytosine (5hmC) has gained attention because of its function in DNA demethylation and regulation of tissue-specific gene expression [54,55,56]. The bisulfite treatment does not allow to distinguish 5mC from 5hmC, but the impact of 5hmC on 5mC data interpretation should be minimal due to its low frequency in many mammalian tissues [57]. A strategy to study 5hmC is to obtain specific 5mC signal by performing an oxidation step prior to bisulfite sequencing and by subtracting this signal to the actual bisulfite signal obtained from a non-modified template (corresponding to 5mC + 5hmC) [58,59]. It is worth noting that the oxidation step is not routinely performed to accurately study 5mC profiles as oxidation may damage DNA during the process and because 5hmC is of very low abundance in most tissues.
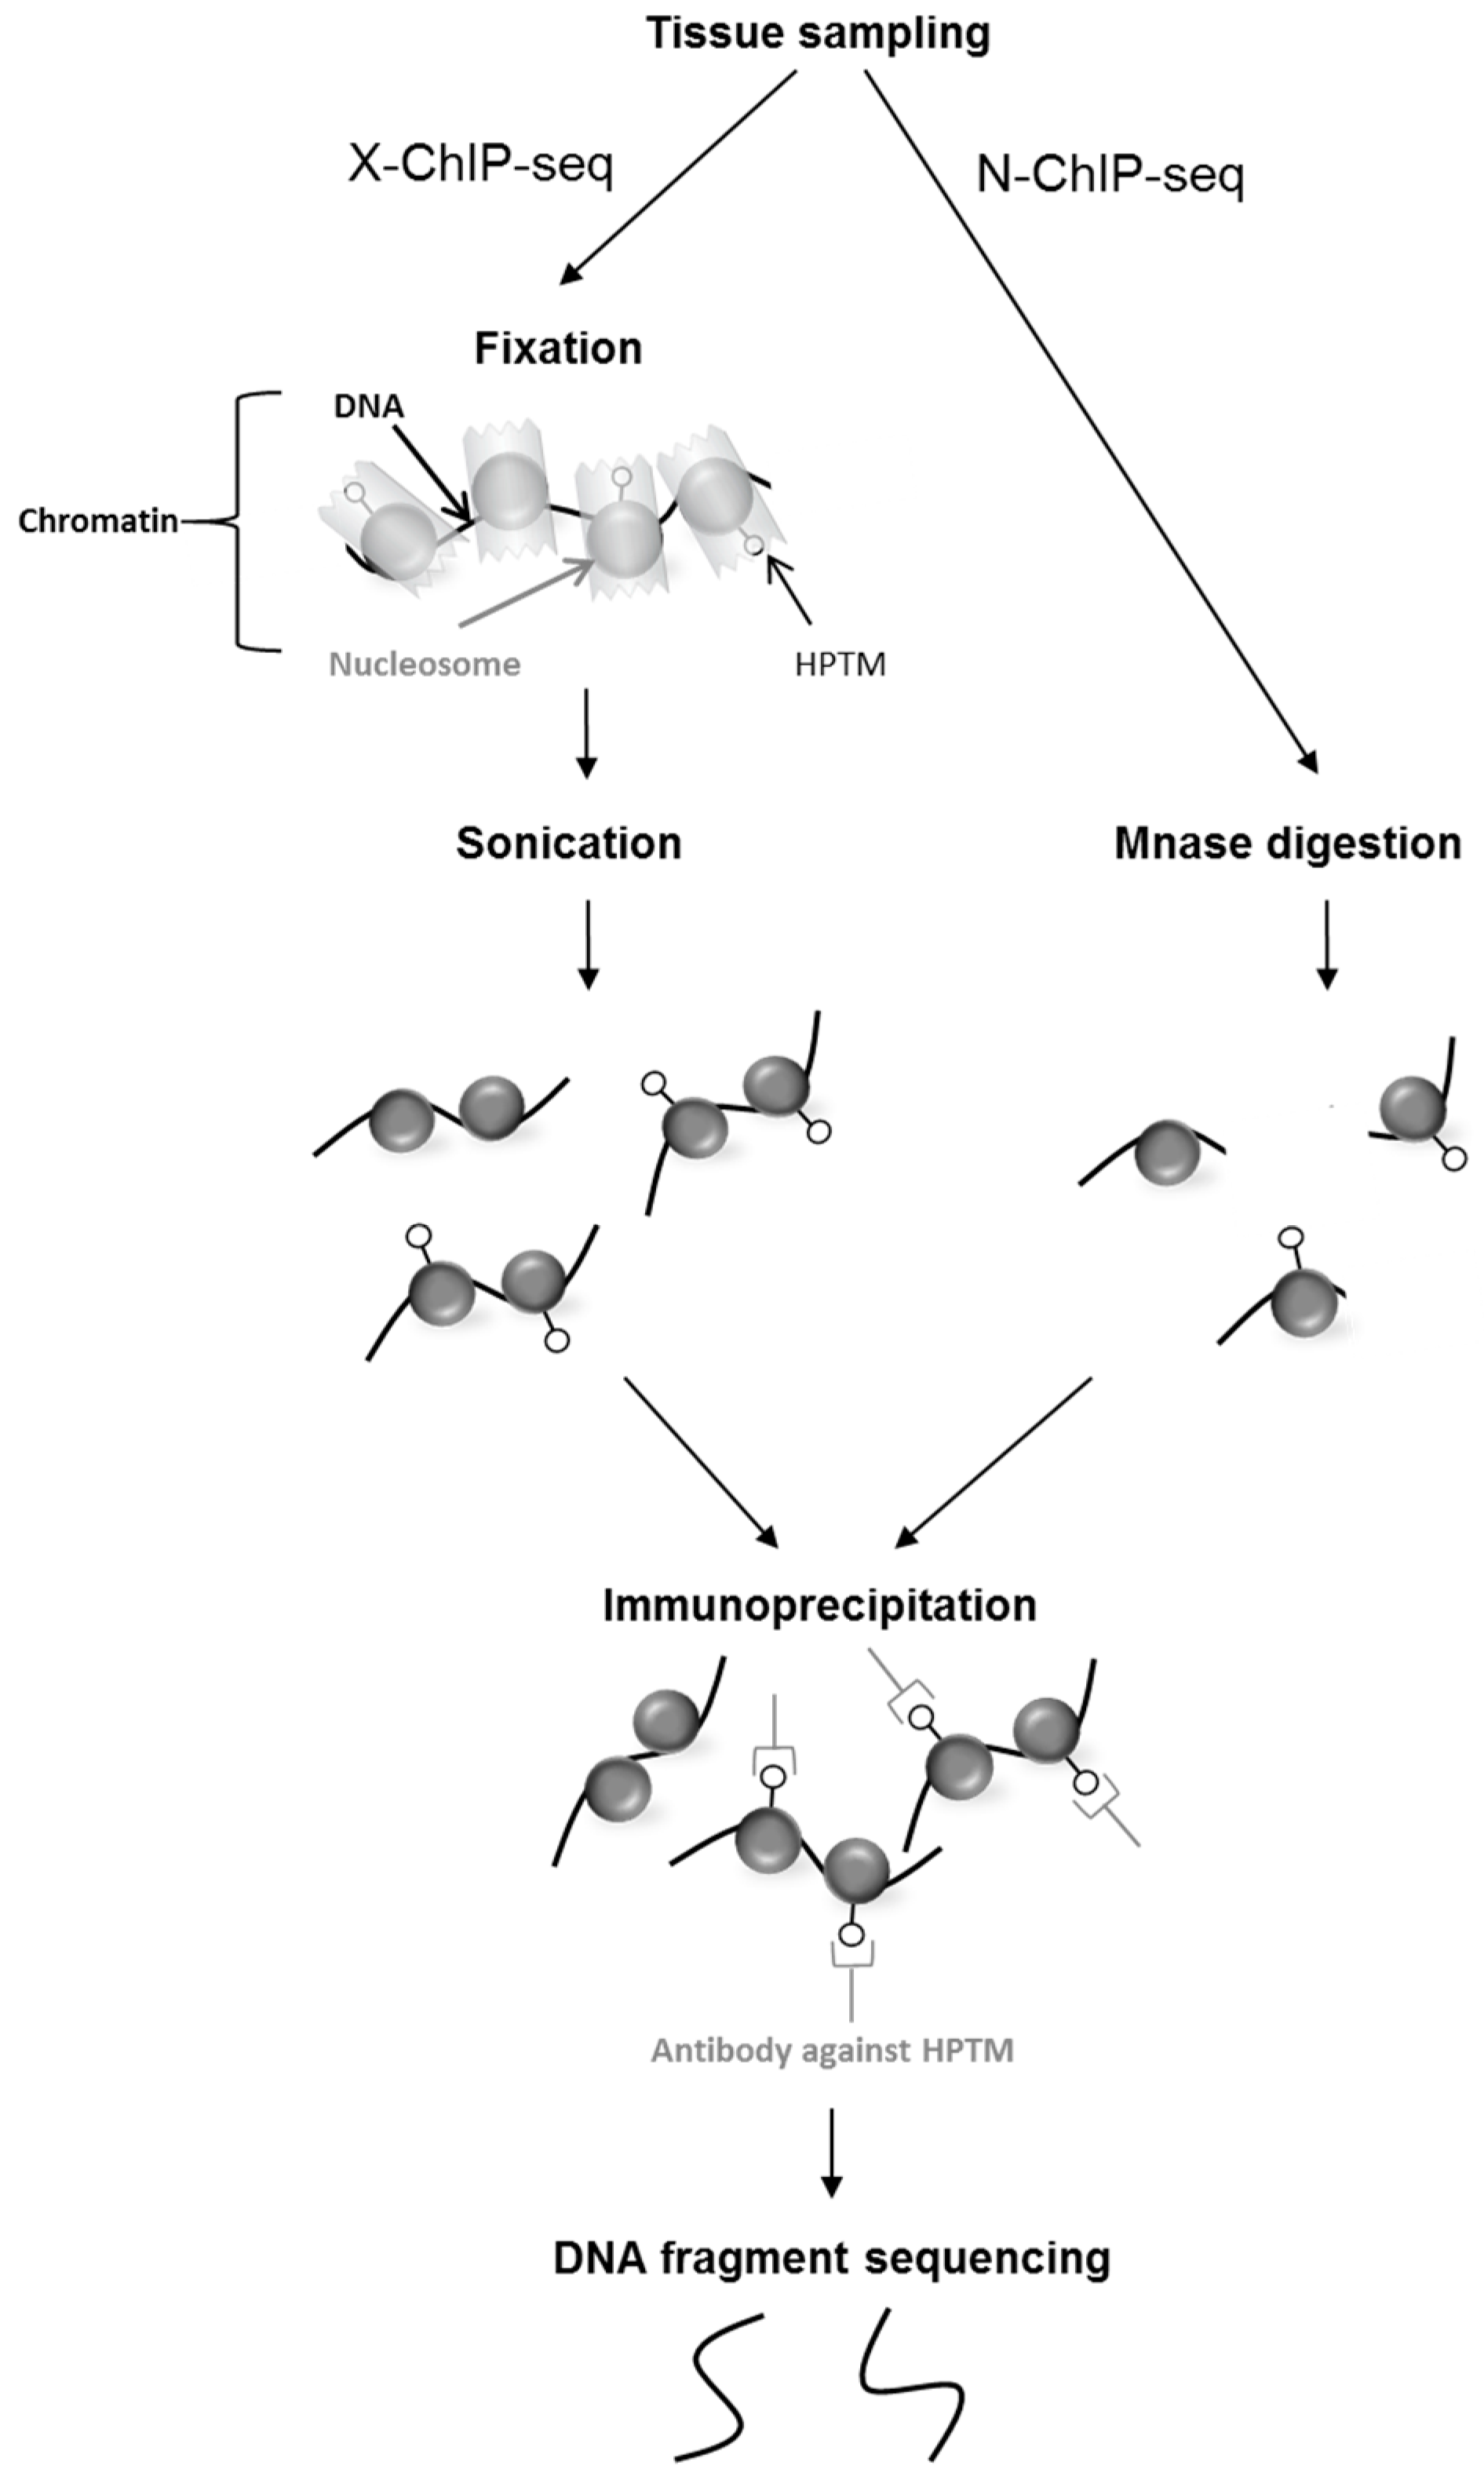
To study histone marks, the gold-standard technique is chromatin immunoprecipitation followed by HTS (ChIP-seq). This technique maps genome-wide DNA fragments associated with proteins using specific antibodies [61,62,63]. Therefore, by using an antibody that is specific to a particular HPTM residue, ChIP-seq allows to map the DNA sequences that are bound to the nucleosomes bearing the mark of interest. Many factors can be profiled with ChIP-seq, such as transcription factors, chromatin binding proteins and histone modifications, provided that a highly-specific antibody is available (for an assessment of HPTM-directed antibodies for ChIP, see [64]). To perform ChIP-seq, chromatin can either be cross-linked to covalently fix the interactions between the DNA and the protein or mark of interest (X-ChIP-seq), or used in the native state after digestion using frequent cutter enzymes such as MNase (N-ChIP-seq, [65]). Immunoprecipitated DNA fragments are then subjected to sequencing (Figure 2). Recently, ChIP-seq was improved by including an enzymatic digestion to retrieve smaller DNA fragments associated with the MPTH in order to increase the resolution and to limit non-specific DNA sequencing (ChIP-exo, [66]).
3. New Knowledge Gained on Chicken Models by High-Throughput Sequencing
In this review, we focus on the chicken genome that was the first genome sequenced for bird species. Chicken is a commonly used model to study developmental biology (in particular during embryogenesis), immunology and microbiology. Chicken is also an appropriate model to improve the mammalian genome annotation [67]. Indeed, long blocks of conserved synteny between chicken and human genomes could be explained by common intra-chromosomal rearrangements and few chromosomal translocations.
3.1. The Chicken Genome
The chicken genome is about 2.5 times smaller than the human genome (1200 Mb vs. 3200 Mb). It is composed of 38 pairs of autosomes and two sex chromosomes (Z and W). Many of the autosomes (29 pairs in total) are relatively small and uniform in size, and are termed ‘microchromosomes’. About 38% of CpG islands are conserved between human and chicken [67]. In the chicken genome, CpG islands are mostly localized on microchromosomes which have a high density of genes [68]. The Gallus gallus genome assembly was obtained from a single female red jungle fowl chick. The first two versions were assembled using a whole-genome Sanger sequencing [67,69]. The latest version of the chicken genome assembly (Gallus_gallus-5.0; GCA_000002315.3), of 1.2 Gb size, was released in 2015 and was obtained through the combination of short read (Illumina) and long read technologies (PacBio), which significantly improved the contig length and thus the quality of the assembly [70,71]. In the latest version of the chicken genome assembly, the number of assembled chromosomes was improved (from the autosomes GGA1-28 and GGA32 to autosomes GGA1-28 and GGA30-33, [70]). The increased coverage (from 12X to 70X) allowed a more complete chicken genome assembly, but the large amount of data produced also increased the number of scaffolds or unplaced contigs. About 183 Mb of new sequences were added, networks were improved, errors identified and a more complete set of genes was determined [70].
HTS technology has also been used to successfully sequence species such as Turkey which was the second avian genome sequenced in 2010 [67,72]. At the moment, the genomes of nearly 60 different bird species have been sequenced [73] and more are planned to complete the set of available avian genomes. The current limitation in the study of these genomes is the lack of assembly. Indeed, as of today, only seven genomes have been assembled and annotated: the chicken (fifth version), the turkey (second version), the great tit (second version), the zebra finch (second version), the quail (second version), the helmeted guinea fowl (first version) and the collared flycatcher (first version; source: NCBI). Other genomes are currently being assembled, such as the duck, the golden eagle, the medium ground finch, the budgerigar, the brown kiwi and the flycatcher.
3.2. The chicken DNA Methylation Landscape
The advent of HTS allowed not only to sequence a large number of bird genomes, but also to study their epigenomes at a whole genome scale. In 2011, Li and colleagues provided the first global DNA methylation analysis in the liver and muscle tissues of red jungle fowl and avian broiler by MeDIP-seq [74]. They observed a decrease of DNA methylation level in the promoter region, especially at the transcription start site (TSS), and an increase in the gene body regions [74]. This is consistent with the observation that average methylation patterns were the lowest in CpG islands that are localized in the promoters [75]. Slight methylation variations were observed along the gene body [74]. It was found that the methylation density in introns was higher than in untranslated transcribed regions (UTRs) and exons within the gene body [75]. The methylation profiles of proximal promoter regions of the avian broiler (liver and muscle) and of the red jungle fowl liver were negatively correlated with gene expression. These results followed the same trend as DNA methylation profile in human (for a review see [76]). Methylation level was shown to vary among tissues, the hepatic DNA of red jungle fowl being found to be less methylated than the one of the muscle [74]. This methylation variation between tissues could play a role in the regulation of gene expression during tissue differentiation [77]. Despite the density of interspersed repeats is lower in chicken (11%) than in mammals (40–50%) [67], the methylation profiles were similar with about 60% of the repeated sequences being totally methylated, which was confirmed by Hu et al. [75]. Thus, several similarities with mammals can be observed in chicken DNA methylation patterns.
The first single-base resolution chicken methylome study was published in 2015 in a study focusing on DNA methylation variation in disease resistance (Marek’s disease) of two chicken lines [78], six years after the first single-base resolution Human methylome [79]. This WGBS analysis had a higher resolution and coverage than the two previous studies described above. The DNA methylation profile of lungs was performed in two chicken lines, Fayoumi and Leghorn. Li and colleagues confirmed that DNA methylation variation is likely to confer disease resistance through gene regulation [78]. Within genes, they found the highest methylation level in internal exons, which is consistent with a previous study [80]. Toll-like receptor 4 (TLR4), an immunity-related gene, was found both differentially methylated and expressed between the Fayoumi and Leghorn lines [78]. A previous study has revealed that a susceptible chicken line had a greater methylation level of the TLR4 gene after infection [81] underlining the important role of this gene in the immune response. Thus, this study also highlighted the potential regulatory role of DNA methylation in the control of gene expression. Another recent WGBS study lead to new insights about DNA methylation variations during the lifespan of chicken. Indeed, Zhang et al. revealed variation in methylation profiles at different ages in hens breast muscle tissue [82]. The authors showed that late-laying hens showed a higher DNA methylation level along the genome compared to the juvenile hens. This increase in methylation was also found at the promoter of genes known to be involved in meat quality [82]. These findings are similar to what Laine et al. reported using a passerine bird species [9]. Indeed, the authors investigated the Great Tit methylation profiles in whole brain and blood tissue by WGBS. They found reduced methylation levels within CpG islands and at the TSS and a negative correlation between gene-body methylation and gene expression in the brain. Derks et al. [83] further investigated the Great Tit methylome and observed a higher CpG methylation level in brain compared to blood. The authors reported a link between brain TSS methylation, gene function and the activity of transposable element that were hypermethylated at CpG dinucleotides but hypomethylated at non-CpG sites. The non-CpG methylation rate was negatively correlated with transposable element activity in the brain and it was proposed that non-CpG methylation might be involved in the regulation of transposable element silencing in this tissue. The significant presence of non-CpG methylation in brain is in agreement with what was reported in mammals and chicken [78,82,83]. Altogether, these studies suggest that the methylation landscape is likely to be comparable between bird species and other species such as mammals.
3.3. The Chicken HPTM Landscape
The first bird ChIP-seq experiment was published in 2012 [84,85]. To date, only few studies reported histone modifications maps in birds [84,85,86,87]. Song’s group investigated HPTM enrichment in Marek’s disease infection in two lines of chicken that differ by their resistance to disease [84,85,86]. A genome-wide map of H3K4me3 and H3K27me3 was performed on spleen [84], thymus [85] and the Bursa of Fabricius [86], three tissues implicated in the immune response. The authors observed a sharp repartition of H3K4me3 surrounding the TSS, as previously described in mammals [61]. This was also confirmed recently in chicken erythrocytes [87]. H3K4me3 was associated with active genes, similarly to what was reported for mammalian species. The repressive mark H3K27me3 was broadly enriched at the TSS and in the body of genes [84,85,86]. H3K27me3 was shown to be associated with repressed genes as in other species [61,65]. Interestingly, these comparative analyses revealed differentially enriched regions between susceptible and resistant chicken lines [85,86], suggesting the existence of an “epigenetic signature” for disease susceptibility. Moreover, Song and collaborators demonstrated that the HPTM profile was modulated after infection at the loci of genes involved in the immune system response [84], corresponding to expression changes after infection [88]. For example, at the locus of CD8α in spleen (for which expression was slightly or highly increased after infection in susceptible and resistant chicken lines, respectively), H3K4me3 was increased concomitantly to gene expression depending on the line [84]. In thymus, a similar trend was observed at the CTLA-4 locus [85]. Recently, the chicken erythrocyte description of H3K27ac and H3K4me3 profile by ChIP-seq was released [87] (unlike mammals, avian erythrocytes are nucleated). As expected, these HPTM were associated with active genes and their genome-wide distribution was similar to what has been reported for other cell types [61,89].
In conclusion, these whole genome studies in several chicken lines [84,85,86,87] all underline similar epigenetic profiles between birds and mammals. This is in agreement with the fact that epigenetic mechanisms are highly conserved between species ranging from plants to mammals [76]. They confirm that epigenetic mechanisms are likely to be a contributor in the phenotypic plasticity in bird through at least DNA methylation and HPTM changes.
4. Design of Epigenomic Studies
HTS techniques are in continuous evolution and are nowadays well documented in extensively studied model species such as human, mouse, Drosophila and Arabidopsis. Here we summarize considerations for avian epigenome investigation from sequencing considerations to the data analysis involving huge datasets. The importance of a carefully designed and executed experimental design has been addressed in previous reports [90,91]. In particular, experimental design should take into account parental history (such as rearing conditions and nutrition) and hatchery practices. Confounding factors such as flock age, transport of eggs and storage or care of animals should be minimized as much as possible, while the tissue homogeneity has to be maximized. The use of inbred strains may also provide an interesting opportunity to study epigenetic variations in a situation in which genetic variation is greatly minimized and therefore facilitates the interpretation of epigenetic changes, especially for the detection of DNA methylation based on the bisulfite-induced polymorphism [92].
4.1. Sequencing Considerations
The first study concerning DNA methylation on whole bisulfite-converted genome was published in 2008 on Arabidopsis thaliana at a single-CpG resolution with approximately 20-fold sequencing coverage [93,94]. Rapidly, many others studies have adapted this bisulfite method (WGBS, RRBS) in different species, particularly in human [79] and mouse [95]. The chemical bisulfite treatment involved in both techniques requires a DNA of sufficient quality (base integrity) in order to obtain an efficient conversion [96]. Choosing between RRBS and WGBS depends on the aim of the study [97]. In contrast to WGBS, the RRBS method provides a high number of reads for each studied cytosine at a reasonable cost [46]. However, RRBS induces an enrichment in regions with high CpG content that may bias the analysis toward promoters. Therefore, WGBS may be more relevant for the study of discrete methylation changes such as in gene bodies. Sequencing is a key step in the detection of epigenetic information, the reliability of analyses being not only linked to the number of replicates, but also to the sequencing depth. The sequencing depth was defined by Stein et al. [98] as “the average number of times that a particular nucleotide is represented in a collection of random raw sequences”. For WGBS, the Epigenomics Roadmap recommends from 5X to 30X of coverage [99] and about 10X of coverage for RRBS as 1–2% of the genome is sequenced using this technique [99]. To our knowledge, no specific chicken RRBS study has been published yet, therefore the pattern of MspI restriction enzyme in chicken should be carefully examined to estimate the fraction of the genome that will be included in such studies.
Since the first whole genome study of HPTM on human cells in 2007 [61], ChIP-seq became an affordable technique due to improvements in the methodology and sequencing techniques. In 2012, the ENCODE consortium published a guideline for conducting ChIP-seq experiments. Standards were defined to characterize HTPM such as the antibody quality, the control used, the number of replicates and the number of unique reads obtained after sequencing [100]. Although these recommendations were initially defined for mammalian species, they should be followed for ChIP-seq studies in birds, given the similarities between the genomes. The ENCODE consortium recommended 20 million to 40 million reads for ChIP-seq analysis according to the type of mark studied [100]. For the broad-source H3K27me3 mark, a high coverage of 40–50 million unique reads is recommended to identify regions of interest in humans [101]. 40 millions of unique reads appeared to be sufficient for H3K27me3 in birds [65]. It is worth noting that native preparation of chromatin may be more suitable for ChIP-seq experiment in chicken muscle that the usual protocol of chromatin fixation [65].
4.2. Bioinformatic Data Analysis
The computational analysis of the data is one of the most critical, yet often underestimated element of a genome-wide studies. It has become standard for sequencing core facilities to provide basic bioinformatics services to process the generated data. However, achieving a complete, accurate and reliable analysis of epigenome data with the latest version of a genome and tools still remains challenging. The main reason is the fast pace of change in the field of bioinformatics that constantly affects the stability of any analytic pipeline. Minor format changes of the HTS data can invalidate a robust pipeline (as illustrated by the evolution of the Phred quality score across Sanger/Solexa/Illumina FASTQ formats). Biotechnological improvement results in a constantly increasing volume of data, that requires new storage formats and processing algorithms. For example, regarding sequence alignment, hitherto reference approaches like BLAST/BLAT have been shown to be inefficient to deal with billions of short reads, and dedicated mappers were designed based on new algorithmic applications [102,103]. Moreover, methodological advances added another gear to the frantic pace of bioinformatics evolution. For instance, implementing the Burrows-Wheeler Transformation in the context of read mapping induced a major shift considering the previous hash-based approaches [102,103], with direct consequences in epigenomics [60]. Indeed, popular alignment tools such as Bowtie [102], BWA [103] and SOAP2 [104] have specific alignment method and parameters (allowed mismatches) that impact the percentage of the successfully-mapped reads and ultimately the peak calling [105]. These specificities were integrated in several pipelines developed to study HTS data such as the ENCODE’s WGBS pipeline [106] or the BLUEPRINT’s ChIP-Seq pipeline [107]. Similar standards are expected for avian species in the context of the FAANG consortium [41].
Moreover, two factors have to be considered regarding the computational resources: computing capacity in terms of CPU and memory to run the analysis, and disk space to store data and results. Bioinformatics facilities usually provide cluster or grid computing systems to cope with the first aspect. The experimental design and the budget of a given project are often considered beforehand and the volume of raw sequencing reads is often defined by the objective (sequencing depth). Estimations are often less accurate for the total amount of data to be stored, at least during the time of the analysis. Intermediate files largely contribute to the inflation in terms of disk space. Indeed, a typical analysis pipeline or workflow is made of several steps (as shown in Figure 3 with an analytic pipeline defined for epigenetics marks). Each step generates intermediate results to be written on the disk in a precise file format before being processed by the next step. While the general trend is a drastic reduction of the data along the pipeline (from large HTS read files to relatively small end-results), initial operations like cleaning the reads or mapping on the genomic sequence produce large files. For instance, about 35 Go of data are currently obtained for the whole analysis for each WGBS sample in chicken (data not shown), necessitating adequate storage capacity. For chicken ChIP-seq about 10 Go of disk storage (data not shown) are required for the analysis of one mark (including the corresponding input) from the initial compressed fastq files (~1–2 Go) to the peak detection files (500 Ko). Intermediate results can of course be eliminated as soon as they are processed, but given that an analytic pipeline is rarely used only once in practice (e.g., when a change in the data occurs such as quality filtering or when a software is improved), it would be time- and resource-consuming to generate them again each time when required. Moreover, systematically comparing results from successive runs instead of overwriting previous ones is part of the quality control of data. Depending on the experimental assay, it is therefore advisable to secure the provision of at least 3–5 times the volume of raw data for downstream processing.
Besides, the computing capacity cluttering is further amplified when adapting or optimizing the pipeline (as often required for non-model organisms), since testing different parameters or software involves the comparison of many runs. To cope with these difficulties, needs in both human and computational resources should not be underestimated, especially when dealing with avian species. Because most of the analytic tools have been created, tested and optimized on model organisms (human, yeast, mouse), applying a standard pipeline designed for the 22 + XY human chromosomes on the 32 + ZW chromosomes +23,870 scaffolds of the Gallus gallus genome (Gallus_gallus-5.0; GCA_000002315.3) can involve some tweaking.
5. Conclusions and Perspectives
In this review, we aimed to summarize the knowledge gained on avian epigenomes by focusing on the most studied avian species, the chicken. The development of HTS techniques allowed the study of several epigenetic marks in chicken such as DNA methylation and histones post-translational modifications. Genome-wide characterization of these marks demonstrated similarities between mammalian and plant epigenomes. The chicken methylome and the HPTM landscape exhibited variations along the genome linked with genomic features such as the TSS of genes. Moreover, as previously reported in mammals, H3K4me3 and H3K27ac enrichments at promoters were correlated with gene expression and DNA methylation, while H3K27me3 enrichment was usually associated with repression. Epigenetic modifications and their impact on gene expression are complex phenomena that can be better understood with the sensitivity of HTS and its genome-wide DNA binding site detection. HTS-based methods were performed on different chicken breeds to investigate epigenome variations associated with disease resistance, such as Marek’s disease. DNA methylation and HPTM differences have been uncovered on genes involved in the immune response between disease-resistant and -susceptible chicken lines. In addition, it has recently been revealed that methylation profiles could vary during the lifespan of chicken in muscle and blood cells. Beyond DNA methylation and HPTM cartography, the avian community continues to improve our understanding of bird epigenomes by combining complementary epigenetic approaches, such as the mapping of open chromatin sites by ATAC-seq [114] or the analysis of genome conformation by Hi-C [115]. In the future, this should deliver a much clearer view of the mechanisms regulating genome activity related to organ function, disease or phenotypic variation.
International consortia provided guidelines to standardize the use of HTS techniques in order to detect epigenetic marks in several species that should be taken into consideration for avian studies. Bioinformatics analyses represent a key step with its own limitations and recommendations that are inherent to an epigenome study. Unexpected results or variations of the experimental protocol might also require specific skills or expertise to properly adapt the downstream analysis.
During the past decade, HTS has seen its cost and time consumption dramatically decreased, allowing the sequencing and the annotation of several bird species genomes. The necessity of a properly assembled and annotated genome could explain why only few avian epigenomes have been characterized to date. In addition to chicken studies, the investigation of other avian epigenomes, such as the Great Tit [9], should also deliver significant knowledge in the field of developmental biology.
Acknowledgments
This work was supported by the Region Centre Val de Loire, by the Department of Animal Genetics and the Department of Animal Physiology and Livestock Systems at the French National Institute of Agronomical Research (INRA). This work is funded by French ANR “ChickStress” grant (ANR-13-ADAP-0014) and by the INRA PHASE division project “STRESSEPIMARK”.
Author Contributions
All authors contributed equally to this work.
Conflicts of Interest
The authors declare no conflict of interest.
Abbreviations
| 5hmC | 5-hydroxymethylcytosine |
| 5mC | 5-methylcytosine |
| BS-seq | Bisulfite Sequencing |
| ChIP-seq | Chromatin ImmunoPrecipitation followed by sequencing |
| ENCODE | ENCyclopedia of DNA Elements |
| FAANG | Functional Annotation of ANimal Genomes |
| Go | Giga-octet |
| H3K27ac | histone H3 lysine 27 acetylation |
| H3K27me3 | histone H3 lysine 27 tri-methylation |
| H3k36me3 | histone H3 lysine 36 tri-methylation |
| H3K4me3 | histone H3 lysine 4 tri-methylation |
| H3K9me3 | histone H3 lysine 9 tri-methylation |
| HPTM | Histone Post Translational Modifications |
| HTS | High-Throughput Sequencing |
| IHEC | International Human Epigenome Consortium |
| Ko | Kilo-octet |
| MBD-seq | Methyl Binding Domain sequencing |
| MeDIP-seq | MEthylated DNA ImmunoPrecipitation sequencing |
| MethylC-seq | MethylC-sequencing |
| modENCODE | Model Organism ENCyclopedia Of DNA Elements |
| MRE-seq | Methyl-sensitive Restriction Enzyme digestion sequencing |
| N-ChIP-seq | Native Chromatin ImmunoPrecipitation followed by sequencing |
| RRBS | Reduced Representation Bisulfite Sequencing |
| TSS | Transcription Start Site |
| UTR | Untranslated Transcribed Region |
| WGBS | Whole Genome Bisulfite Sequencing |
| X-ChIP-seq | Cross-linked Chromatin ImmunoPrecipitation followed by sequencing |
References
- Manolio, T.A.; Collins, F.S.; Cox, N.J.; Goldstein, D.B.; Hindorff, L.A.; Hunter, D.J.; McCarthy, M.I.; Ramos, E.M.; Cardon, L.R.; Chakravarti, A.; et al. Finding the missing heritability of complex diseases. Nature 2009, 461, 747–753. [Google Scholar] [CrossRef] [PubMed]
- Triantaphyllopoulos, K.A.; Ikonomopoulos, I.; Bannister, A.J. Epigenetics and inheritance of phenotype variation in livestock. Epigenet. Chromatin 2016, 9, 31. [Google Scholar] [CrossRef] [PubMed]
- Nätt, D.; Lindqvist, N.; Stranneheim, H.; Lundeberg, J.; Torjesen, P.A.; Jensen, P. Inheritance of acquired behaviour adaptations and brain gene expression in chickens. PLoS ONE 2009, 4, e6405. [Google Scholar] [CrossRef]
- Verhulst, E.C.; Mateman, A.C.; Zwier, M.V.; Caro, S.P.; Verhoeven, K.J.F.; van Oers, K. Evidence from pyrosequencing indicates that natural variation in animal personality is associated with DRD4 DNA methylation. Mol. Ecol. 2016, 25, 1801–1811. [Google Scholar] [CrossRef] [PubMed]
- Kisliouk, T.; Meiri, N. A critical role for dynamic changes in histone H3 methylation at the Bdnf promoter during postnatal thermotolerance acquisition. Eur. J. Neurosci. 2009, 30, 1909–1922. [Google Scholar] [CrossRef] [PubMed]
- Yossifoff, M.; Kisliouk, T.; Meiri, N. Dynamic changes in DNA methylation during thermal control establishment affect CREB binding to the brain-derived neurotrophic factor promoter. Eur. J. Neurosci. 2008, 28, 2267–2277. [Google Scholar] [CrossRef] [PubMed]
- Li, S.; Zhi, L.; Liu, Y.; Shen, J.; Liu, L.; Yao, J.; Yang, X. Effect of in ovo feeding of folic acid on the folate metabolism, immune function and epigenetic modification of immune effector molecules of broiler. Br. J. Nutr. 2016, 115, 411–421. [Google Scholar] [CrossRef] [PubMed]
- Hu, Y.; Sun, Q.; Li, X.; Wang, M.; Cai, D.; Li, X.; Zhao, R. In Ovo injection of betaine affects hepatic cholesterol metabolism through epigenetic gene regulation in newly hatched chicks. PLoS ONE 2015, 10, e0122643. [Google Scholar] [CrossRef] [PubMed]
- Laine, V.N.; Gossmann, T.I.; Schachtschneider, K.M.; Garroway, C.J.; Madsen, O.; Verhoeven, K.J.F.; De Jager, V.; Megens, H.J.; Warren, W.C.; Minx, P.; et al. Evolutionary signals of selection on cognition from the great tit genome and methylome. Nat. Commun. 2016, 7, 10474. [Google Scholar] [CrossRef] [PubMed]
- Allis, C.D.; Jenuwein, T. The molecular hallmarks of epigenetic control. Nat. Rev. Genet. 2016, 17, 487–500. [Google Scholar] [CrossRef] [PubMed]
- Roundtree, I.A.; Evans, M.E.; Pan, T.; He, C. Dynamic RNA Modifications in Gene Expression Regulation. Cell 2017, 169, 1187–1200. [Google Scholar] [CrossRef] [PubMed]
- Berger, S.L.; Kouzarides, T.; Shiekhattar, R.; Shilatifard, A. An operational definition of epigenetics. Genes Dev. 2009, 23, 781–783. [Google Scholar] [CrossRef] [PubMed]
- Feil, R.; Fraga, M.F. Epigenetics and the environment: Emerging patterns and implications. Nat. Rev. Genet. 2012, 13, 97–109. [Google Scholar] [CrossRef] [PubMed]
- Egger, G.; Liang, G.; Aparicio, A.; Jones, P.A. Epigenetics in human disease and prospects for epigenetic therapy. Nature 2004, 429, 457–463. [Google Scholar] [CrossRef] [PubMed]
- Bock, C. Analysing and interpreting DNA methylation data. Nat. Rev. Genet. 2012, 13, 705–719. [Google Scholar] [CrossRef] [PubMed]
- Gardiner-Garden, M.; Frommer, M. CpG islands in vertebrate genomes. J. Mol. Biol. 1987, 196, 261–282. [Google Scholar] [CrossRef]
- Wu, T.P.; Wang, T.; Seetin, M.G.; Lai, Y.; Zhu, S.; Lin, K.; Liu, Y.; Byrum, S.D.; Mackintosh, S.G.; Zhong, M.; et al. DNA methylation on N(6)-adenine in mammalian embryonic stem cells. Nature 2016, 532, 329–333. [Google Scholar] [CrossRef] [PubMed]
- Bird, A.P. CpG-rich islands and the function of DNA methylation. Nature 1986, 321, 209–213. [Google Scholar] [CrossRef] [PubMed]
- Keshet, I.; Lieman-Hurwitz, J.; Cedar, H. DNA methylation affects the formation of active chromatin. Cell 1986, 44, 535–543. [Google Scholar] [CrossRef]
- Razin, A.; Cedar, H. DNA methylation and gene expression. Microbiol. Rev. 1991, 55, 451–458. [Google Scholar] [PubMed]
- Bird, A. The essentials of DNA methylation. Cell 1992, 70, 5–8. [Google Scholar] [CrossRef]
- Jones, P.A. Functions of DNA methylation: Islands, start sites, gene bodies and beyond. Nat. Rev. Genet. 2012, 13, 484–492. [Google Scholar] [CrossRef] [PubMed]
- Busche, S.; Shao, X.; Caron, M.; Kwan, T.; Allum, F.; Cheung, W.A.; Susan Westfall, B.G.; Simon, M.-M. Population whole-genome bisulfite sequencing across two tissues highlights the environment as the principal source of human methylome variation. Genome Biol. 2015, 16, 290. [Google Scholar] [CrossRef] [PubMed]
- Wolff, G.L.; Kodell, R.L.; Moore, S.R.; Cooney, C.A. Maternal epigenetics and methyl supplements affect agouti gene expression in Avy/a mice. FASEB J. 1998, 12, 949–957. [Google Scholar] [PubMed]
- Kornberg, R.D.; Lorch, Y. Twenty-five years of the nucleosome, fundamental particle of the eukaryote chromosome. Cell 1999, 98, 285–294. [Google Scholar] [CrossRef]
- Strahl, B.D.; Allis, C.D. The language of covalent histone modifications. Nature 2000, 403, 41–45. [Google Scholar] [CrossRef] [PubMed]
- Tessarz, P.; Kouzarides, T. Histone core modifications regulating nucleosome structure and dynamics. Nat. Rev. Mol. Cell Biol. 2014, 15, 703–708. [Google Scholar] [CrossRef] [PubMed]
- Bannister, A.J.; Kouzarides, T. Regulation of chromatin by histone modifications. Cell Res. 2011, 21, 381–395. [Google Scholar] [CrossRef] [PubMed]
- Kouzarides, T. Chromatin modifications and their function. Cell 2007, 128, 693–705. [Google Scholar] [CrossRef] [PubMed]
- Eberharter, A.; Becker, P.B. Histone acetylation: A switch between repressive and permissive chromatin. Second in review series on chromatin dynamics. EMBO Rep. 2002, 3, 224–229. [Google Scholar] [CrossRef] [PubMed]
- Zhang, T.; Cooper, S.; Brockdorff, N. The interplay of histone modifications—Writers that read. EMBO Rep. 2015, 16, 1467–1481. [Google Scholar] [CrossRef] [PubMed]
- Lämke, J.; Brzezinka, K.; Altmann, S.; Bäurle, I. A hit-and-run heat shock factor governs sustained histone methylation and transcriptional stress memory. EMBO J. 2016, 35, 162–175. [Google Scholar] [CrossRef] [PubMed]
- Coustham, V.; Li, P.; Strange, A.; Lister, C.; Song, J.; Dean, C. Quantitative modulation of polycomb silencing underlies natural variation in vernalization. Science 2012, 337, 584–587. [Google Scholar] [CrossRef] [PubMed]
- Kundaje, A.; Meuleman, W.; Ernst, J.; Bilenky, M.; Yen, A.; Heravi-Moussavi, A.; Kheradpour, P.; Zhang, Z.; Wang, J.; Ziller, M.J.; et al. Integrative analysis of 111 reference human epigenomes. Nature 2015, 518, 317–330. [Google Scholar] [CrossRef] [PubMed]
- Baker, M. Making sense of chromatin states. Nat. Methods 2011, 8, 717–722. [Google Scholar] [CrossRef] [PubMed]
- Ernst, J.; Kheradpour, P.; Mikkelsen, T.S.; Shoresh, N.; Ward, L.D.; Epstein, C.B.; Zhang, X.; Wang, L.; Issner, R.; Coyne, M.; et al. Mapping and analysis of chromatin state dynamics in nine human cell types. Nature 2011, 473, 43–49. [Google Scholar] [CrossRef] [PubMed]
- ENCODE Project Consortium. An integrated encyclopedia of DNA elements in the human genome. Nature 2012, 489, 57–74. [Google Scholar] [CrossRef]
- Bernstein, B.E.; Stamatoyannopoulos, J.A.; Costello, J.F.; Ren, B.; Milosavljevic, A.; Meissner, A.; Kellis, M.; Marra, M.A.; Beaudet, A.L.; Ecker, J.R.; et al. The NIH Roadmap Epigenomics Mapping Consortium. Nat. Biotechnol. 2010, 28, 1045–1048. [Google Scholar] [CrossRef] [PubMed]
- Bae, J.-B. Perspectives of International Human Epigenome Consortium. Genom. Inform. 2013, 11, 7. [Google Scholar] [CrossRef] [PubMed]
- Celniker, S.E.; Dillon, L.A.L.; Gerstein, M.B.; Gunsalus, K.C.; Henikoff, S.; Karpen, G.H.; Kellis, M.; Lai, E.C.; Lieb, J.D.; MacAlpine, D.M.; et al. Unlocking the secrets of the genome. Nature 2009, 459, 927–930. [Google Scholar] [CrossRef] [PubMed] [Green Version]
- Andersson, L.; Archibald, A.L.; Bottema, C.D.; Brauning, R.; Burgess, S.C.; Burt, D.W.; Casas, E.; Cheng, H.H.; Clarke, L.; Couldrey, C.; et al. Coordinated international action to accelerate genome-to-phenome with FAANG, the Functional Annotation of Animal Genomes project. Genome Biol. 2015, 16, 57. [Google Scholar] [CrossRef] [PubMed]
- Kurdyukov, S.; Bullock, M. DNA Methylation Analysis: Choosing the Right Method. Biology 2016, 5, 3. [Google Scholar] [CrossRef] [PubMed]
- Frommer, M.; McDonald, L.E.; Millar, D.S.; Collis, C.M.; Watt, F.; Grigg, G.W.; Molloy, P.L.; Paul, C.L. A genomic sequencing protocol that yields a positive display of 5-methylcytosine residues in individual DNA strands. Proc. Natl. Acad. Sci. USA 1992, 89, 1827–1831. [Google Scholar] [CrossRef] [PubMed]
- Mardis, E.R. The impact of next-generation sequencing technology on genetics. Trends Genet. 2008, 24, 133–141. [Google Scholar] [CrossRef] [PubMed]
- Urich, M.A.; Nery, J.R.; Lister, R.; Schmitz, R.J.; Ecker, J.R. MethylC-seq library preparation for base-resolution whole-genome bisulfite sequencing. Nat. Protoc. 2015, 10, 475–483. [Google Scholar] [CrossRef] [PubMed]
- Meissner, A.; Gnirke, A.; Bell, G.W.; Ramsahoye, B.; Lander, E.S.; Jaenisch, R. Reduced representation bisulfite sequencing for comparative high-resolution DNA methylation analysis. Nucleic Acids Res. 2005, 33, 5868–5877. [Google Scholar] [CrossRef] [PubMed]
- Gu, H.; Smith, Z.D.; Bock, C.; Boyle, P.; Gnirke, A.; Meissner, A. Preparation of reduced representation bisulfite sequencing libraries for genome-scale DNA methylation profiling. Nat. Protoc. 2011, 6, 468–481. [Google Scholar] [CrossRef] [PubMed]
- Soto, J.; Rodriguez-Antolin, C.; Vallespín, E.; de Castro Carpeño, J.; Ibanez de Caceres, I. The impact of next-generation sequencing on the DNA methylation-based translational cancer research. Transl. Res. 2016, 169, 1–18. [Google Scholar] [CrossRef] [PubMed]
- Harris, R.A.; Wang, T.; Coarfa, C.; Nagarajan, R.P.; Hong, C.; Downey, S.L.; Johnson, B.E.; Fouse, S.D.; Delaney, A.; Zhao, Y.; et al. Comparison of sequencing-based methods to profile DNA methylation and identification of monoallelic epigenetic modifications. Nat. Biotechnol. 2010, 28, 1097–1105. [Google Scholar] [CrossRef] [PubMed]
- Lan, X.; Adams, C.; Landers, M.; Dudas, M.; Krissinger, D.; Marnellos, G.; Bonneville, R.; Xu, M.; Wang, J.; Huang, T.H.M.; et al. High resolution detection and analysis of CpG dinucleotides methylation using MBD-Seq technology. PLoS ONE 2011, 6, e22226. [Google Scholar] [CrossRef] [PubMed]
- Dolinoy, D.C.; Huang, D.; Jirtle, R.L. Maternal nutrient supplementation counteracts bisphenol A-induced DNA hypomethylation in early development. Proc. Natl. Acad. Sci. USA 2007, 104, 13056–13061. [Google Scholar] [CrossRef] [PubMed]
- Pértille, F.; Guerrero-Bosagna, C.; Da Silva, V.H.; Boschiero, C.; da Silva Nunes, J.D.R.; Ledur, M.C.; Jensen, P.; Coutinho, L.L. High-throughput and Cost-effective Chicken Genotyping Using Next-Generation Sequencing. Sci. Rep. 2016, 6, 26929. [Google Scholar] [CrossRef] [PubMed]
- Pértille, F.; Brantsæter, M.; Nordgreen, J.; Coutinho, L.L.; Janczak, A.M.; Jensen, P.; Guerrero-Bosagna, C. DNA methylation profiles in red blood cells of adult hens correlate with their rearing conditions. J. Exp. Biol. 2017, 220, 3579–3587. [Google Scholar] [CrossRef] [PubMed]
- Kriaucionis, S.; Heintz, N. The nuclear DNA base 5-hydroxymethylcytosine is present in Purkinje neurons and the brain. Science 2009, 324, 929–930. [Google Scholar] [CrossRef] [PubMed]
- Tahiliani, M.; Koh, K.P.; Shen, Y.; Pastor, W.A.; Bandukwala, H.; Brudno, Y.; Agarwal, S.; Iyer, L.M.; Liu, D.R.; Aravind, L.; et al. Conversion of 5-methylcytosine to 5-hydroxymethylcytosine in mammalian DNA by MLL partner TET1. Science 2009, 324, 930–935. [Google Scholar] [CrossRef] [PubMed]
- Ponnaluri, V.K.C.; Ehrlich, K.C.; Zhang, G.; Lacey, M.; Johnston, D.; Pradhan, S.; Ehrlich, M. Association of 5-hydroxymethylation and 5-methylation of DNA cytosine with tissue-specific gene expression. Epigenetics 2017, 12, 123–138. [Google Scholar] [CrossRef] [PubMed]
- Globisch, D.; Münzel, M.; Müller, M.; Michalakis, S.; Wagner, M.; Koch, S.; Brückl, T.; Biel, M.; Carell, T. Tissue distribution of 5-hydroxymethylcytosine and search for active demethylation intermediates. PLoS ONE 2010, 5, e15367. [Google Scholar] [CrossRef] [PubMed] [Green Version]
- Booth, M.J.; Ost, T.W.; Beraldi, D.; Bell, N.M.; Branco, M.R.; Reik, W.; Balasubramanian, S. Oxidative bisulfite sequencing of 5-methylcytosine and 5-hydroxymethylcytosine. Nat. Protoc. 2013, 8, 1841–1851. [Google Scholar] [CrossRef] [PubMed]
- Hahn, M.A.; Li, A.X.; Wu, X.; Pfeifer, G.P. Single base resolution analysis of 5-methylcytosine and 5-hydroxymethylcytosine by RRBS and TAB-RRBS. Methods Mol. Biol. 2015, 1238, 273–287. [Google Scholar] [CrossRef] [PubMed]
- Krueger, F.; Andrews, S.R. Bismark: A flexible aligner and methylation caller for Bisulfite-Seq applications. Bioinformatics 2011, 27, 1571–1572. [Google Scholar] [CrossRef] [PubMed]
- Barski, A.; Cuddapah, S.; Cui, K.; Roh, T.Y.; Schones, D.E.; Wang, Z.; Wei, G.; Chepelev, I.; Zhao, K. High-resolution profiling of histone methylations in the human genome. Cell 2007, 129, 823–837. [Google Scholar] [CrossRef] [PubMed]
- Johnson, D.S.; Mortazavi, A.; Myers, R.M.; Wold, B. Genome-wide mapping of in vivo protein-DNA interactions. Science 2007, 316, 1497–1502. [Google Scholar] [CrossRef] [PubMed]
- Robertson, G.; Hirst, M.; Bainbridge, M.; Bilenky, M.; Zhao, Y.; Zeng, T.; Euskirchen, G.; Bernier, B.; Varhol, R.; Delaney, A.; et al. Genome-wide profiles of STAT1 DNA association using chromatin immunoprecipitation and massively parallel sequencing. Nat. Methods 2007, 4, 651–657. [Google Scholar] [CrossRef] [PubMed]
- Edwards, J.R.; O’Donnell, A.H.; Rollins, R.A.; Peckham, H.E.; Lee, C.; Milekic, M.H.; Chanrion, B.; Fu, Y.; Su, T.; Hibshoosh, H.; et al. Chromatin and sequence features that define the fine and gross structure of genomic methylation patterns. Genome Res. 2010, 20, 972–980. [Google Scholar] [CrossRef] [PubMed]
- David, S.A.; Piégu, B.; Hennequet-Antier, C.; Pannetier, M.; Aguirre-Lavin, T.; Crochet, S.; Bordeau, T.; Couroussé, N.; Brionne, A.; Bigot, Y.; et al. An Assessment of Fixed and Native Chromatin Preparation Methods to Study Histone Post-Translational Modifications at a Whole Genome Scale in Skeletal Muscle Tissue. Biol. Proced. Online 2017, 19, 10. [Google Scholar] [CrossRef] [PubMed]
- Rhee, H.S.; Pugh, B.F. Comprehensive genome-wide protein-DNA interactions detected at single-nucleotide resolution. Cell 2011, 147, 1408–1419. [Google Scholar] [CrossRef] [PubMed]
- International Chicken Genome Sequencing Consortium. Sequence and comparative analysis of the chicken genome provide unique perspectives on vertebrate evolution. Nature 2004, 432, 695–716. [Google Scholar] [CrossRef]
- McQueen, H.A.; Fantes, J.; Cross, S.H.; Clark, V.H.; Archibald, A.L.; Bird, A.P. CpG islands of chicken are concentrated on microchromosomes. Nat. Genet. 1996, 12, 321–324. [Google Scholar] [CrossRef] [PubMed]
- Sanger, F.; Nicklen, S.; Coulson, A.R. DNA sequencing with chain-terminating inhibitors. Proc. Natl. Acad. Sci. USA 1977, 74, 5463–5467. [Google Scholar] [CrossRef] [PubMed]
- Warren, W.C.; Hillier, L.W.; Tomlinson, C.; Minx, P.; Kremitzki, M.; Graves, T.; Markovic, C.; Bouk, N.; Pruitt, K.D.; Thibaud-Nissen, F.; et al. A New Chicken Genome Assembly Provides Insight into Avian Genome Structure. G3 Genes Genomes Genet. 2017, 7, 109–117. [Google Scholar] [CrossRef] [PubMed]
- Rhoads, A.; Au, K.F. PacBio Sequencing and Its Applications. Genom. Proteom. Bioinform. 2015, 13, 278–289. [Google Scholar] [CrossRef] [PubMed]
- Dalloul, R.A.; Long, J.A.; Zimin, A.V.; Aslam, L.; Beal, K.; Blomberg, L.A.; Bouffard, P.; Burt, D.W.; Crasta, O.; Crooijmans, R.P.; et al. Multi-platform next-generation sequencing of the domestic turkey (Meleagris gallopavo): Genome assembly and analysis. PLoS Biol. 2010, 8, e1000475. [Google Scholar] [CrossRef] [PubMed]
- NCBI. Eukaryotic Genomes Annotated at NCBI. Available online: https://www.ncbi.nlm.nih.gov/genome/annotation_euk/all/ (accessed on 6 July 2017).
- Li, Q.; Li, N.; Hu, X.; Li, J.; Du, Z.; Chen, L.; Yin, G.; Duan, J.; Zhang, H.; Zhao, Y.; et al. Genome-wide mapping of DNA methylation in chicken. PLoS ONE 2011, 6, e19428. [Google Scholar] [CrossRef] [PubMed]
- Hu, Y.; Xu, H.; Li, Z.; Zheng, X.; Jia, X.; Nie, Q.; Zhang, X. Comparison of the genome-wide DNA methylation profiles between fast-growing and slow-growing broilers. PLoS ONE 2013, 8, e56411. [Google Scholar] [CrossRef] [PubMed]
- Suzuki, M.M.; Bird, A. DNA methylation landscapes: Provocative insights from epigenomics. Nat. Rev. Genet. 2008, 9, 465–476. [Google Scholar] [CrossRef] [PubMed]
- Xu, Q.; Zhang, Y.; Sun, D.; Wang, Y.; Yu, Y. Analysis on DNA methylation of various tissues in chicken. Anim. Biotechnol. 2007, 18, 231–241. [Google Scholar] [CrossRef] [PubMed]
- Li, J.; Li, R.; Wang, Y.; Hu, X.; Zhao, Y.; Li, L.; Feng, C.; Gu, X.; Liang, F.; Lamont, S.J.; et al. Genome-wide DNA methylome variation in two genetically distinct chicken lines using MethylC-seq. BMC Genom. 2015, 16, 851. [Google Scholar] [CrossRef] [PubMed]
- Lister, R.; Pelizzola, M.; Dowen, R.H.; Hawkins, R.D.; Hon, G.; Tonti-Filippini, J.; Nery, J.R.; Lee, L.; Ye, Z.; Ngo, Q.M.; et al. Human DNA methylomes at base resolution show widespread epigenomic differences. Nature 2009, 462, 315–322. [Google Scholar] [CrossRef] [PubMed]
- Tian, F.; Zhan, F.; VanderKraats, N.D.; Hiken, J.F.; Edwards, J.R.; Zhang, H.; Zhao, K.; Song, J. DNMT gene expression and methylome in Marek’s disease resistant and susceptible chickens prior to and following infection by MDV. Epigenetics 2013, 8, 431–444. [Google Scholar] [CrossRef] [PubMed]
- Gou, Z.; Liu, R.; Zhao, G.; Zheng, M.; Li, P.; Wang, H.; Zhu, Y.; Chen, J.; Wen, J. Epigenetic modification of TLRs in leukocytes is associated with increased susceptibility to Salmonella enteritidis in chickens. PLoS ONE 2012, 7, e33627. [Google Scholar] [CrossRef] [PubMed]
- Zhang, M.; Yan, F.B.; Li, F.; Jiang, K.R.; Li, D.H.; Han, R.L.; Li, Z.J.; Jiang, R.R.; Liu, X.J.; Kang, X.T.; et al. Genome-wide DNA methylation profiles reveal novel candidate genes associated with meat quality at different age stages in hens. Sci. Rep. 2017, 7, 45564. [Google Scholar] [CrossRef] [PubMed]
- Derks, M.F.L.; Schachtschneider, K.M.; Madsen, O.; Schijlen, E.; Verhoeven, K.J.F.; van Oers, K. Gene and transposable element methylation in great tit (Parus major) brain and blood. BMC Genom. 2016, 17, 332. [Google Scholar] [CrossRef] [PubMed]
- Luo, J.; Mitra, A.; Tian, F.; Chang, S.; Zhang, H.; Cui, K.; Yu, Y.; Zhao, K.; Song, J. Histone methylation analysis and pathway predictions in chickens after MDV infection. PLoS ONE 2012, 7, e41849. [Google Scholar] [CrossRef] [PubMed]
- Mitra, A.; Luo, J.; Zhang, H.; Cui, K.; Zhao, K.; Song, J. Marek’s disease virus infection induces widespread differential chromatin marks in inbred chicken lines. BMC Genom. 2012, 13, 557. [Google Scholar] [CrossRef] [PubMed]
- Mitra, A.; Luo, J.; He, Y.; Gu, Y.; Zhang, H.; Zhao, K.; Cui, K.; Song, J. Histone modifications induced by MDV infection at early cytolytic and latency phases. BMC Genom. 2015, 16, 311. [Google Scholar] [CrossRef] [PubMed]
- Jahan, S.; Xu, W.; He, S.; Gonzalez, C.; Delcuve, G.P.; Davie, J.R. The chicken erythrocyte epigenome. Epigenet. Chromatin 2016, 9, 19. [Google Scholar] [CrossRef] [PubMed]
- Yu, Y.; Luo, J.; Mitra, A.; Chang, S.; Tian, F.; Zhang, H.; Yuan, P.; Zhou, H.; Song, J. Temporal transcriptome changes induced by MDV in Marek’s disease-resistant and -susceptible inbred chickens. BMC Genom. 2011, 12, 501. [Google Scholar] [CrossRef] [PubMed]
- Malik, A.N.; Vierbuchen, T.; Hemberg, M.; Rubin, A.A.; Ling, E.; Couch, C.H.; Stroud, H.; Spiegel, I.; Farh, K.K.H.; Harmin, D.A.; et al. Genome-wide identification and characterization of functional neuronal activity-dependent enhancers. Nat. Neurosci. 2014, 17, 1330–1339. [Google Scholar] [CrossRef] [PubMed]
- Boleli, I.; Morita, V.; Matos, J., Jr.; Thimotheo, M.; Almeida, V. Poultry Egg Incubation: Integrating and Optimizing Production Efficiency. Rev. Bras. Ciência Avícola 2016, 18. [Google Scholar] [CrossRef]
- Rigaill, G.; Balzergue, S.; Brunaud, V.; Blondet, E.; Rau, A.; Rogier, O.; Caius, J.; Maugis-Rabusseau, C.; Soubigou-Taconnat, L.; Aubourg, S.; et al. Synthetic data sets for the identification of key ingredients for RNA-seq differential analysis. Brief. Bioinform. 2016. [Google Scholar] [CrossRef] [PubMed]
- Daxinger, L.; Whitelaw, E. Transgenerational epigenetic inheritance: More questions than answers. Genome Res. 2010, 20, 1623–1628. [Google Scholar] [CrossRef] [PubMed]
- Cokus, S.J.; Feng, S.; Zhang, X.; Chen, Z.; Merriman, B.; Haudenschild, C.D.; Pradhan, S.; Nelson, S.F.; Pellegrini, M.; Jacobsen, S.E. Shotgun bisulphite sequencing of the Arabidopsis genome reveals DNA methylation patterning. Nature 2008, 452, 215–219. [Google Scholar] [CrossRef] [PubMed]
- Lister, R.; O’Malley, R.C.; Tonti-Filippini, J.; Gregory, B.D.; Berry, C.C.; Millar, A.H.; Ecker, J.R. Highly integrated single-base resolution maps of the epigenome in Arabidopsis. Cell 2008, 133, 523–536. [Google Scholar] [CrossRef] [PubMed]
- Smith, Z.D.; Gu, H.; Bock, C.; Gnirke, A.; Meissner, A. High-throughput bisulfite sequencing in mammalian genomes. Methods 2009, 48, 226–232. [Google Scholar] [CrossRef] [PubMed]
- Ziller, M.J.; Hansen, K.D.; Meissner, A.; Arye, M.J. Coverage recommendations for methylation analysis by whole-genome bisulfite sequencing. Nat. Methods 2015, 12, 230–232. [Google Scholar] [CrossRef] [PubMed]
- Yong, W.S.; Hsu, F.M.; Chen, P.Y. Profiling genome-wide DNA methylation. Epigenet. Chromatin 2016, 9, 26. [Google Scholar] [CrossRef] [PubMed]
- Stein, L. Genome annotation: From sequence to biology. Nat. Rev. Genet. 2001, 2, 493–503. [Google Scholar] [CrossRef] [PubMed]
- Doherty, R.; Couldrey, C. Exploring genome wide bisulfite sequencing for DNA methylation analysis in livestock: A technical assessment. Front. Genet. 2014, 5, 126. [Google Scholar] [CrossRef] [PubMed] [Green Version]
- Landt, S.G.; Marinov, G.K.; Kundaje, A.; Kheradpour, P.; Pauli, F.; Batzoglou, S.; Bernstein, B.E.; Bickel, P.; Brown, J.B.; Cayting, P.; et al. ChIP-seq guidelines and practices of the ENCODE and modENCODE consortia. Genome Res. 2012, 22, 1813–1831. [Google Scholar] [CrossRef] [PubMed] [Green Version]
- Jung, Y.L.; Luquette, L.J.; Ho, J.W.K.; Ferrari, F.; Tolstorukov, M.; Minoda, A.; Issner, R.; Epstein, C.B.; Karpen, G.H.; Kuroda, M.I.; et al. Impact of sequencing depth in ChIP-seq experiments. Nucleic Acids Res. 2014, 42, e74. [Google Scholar] [CrossRef] [PubMed]
- Langmead, B.; Trapnell, C.; Pop, M.; Salzberg, S.L. Ultrafast and memory-efficient alignment of short DNA sequences to the human genome. Genome Biol. 2009, 10, R25. [Google Scholar] [CrossRef] [PubMed]
- Li, H.; Durbin, R. Fast and accurate short read alignment with Burrows-Wheeler transform. Bioinformatics 2009, 25, 1754–1760. [Google Scholar] [CrossRef] [PubMed]
- Li, R.; Yu, C.; Li, Y.; Lam, T.W.; Yiu, S.M.; Kristiansen, K.; Wang, J. SOAP2: An improved ultrafast tool for short read alignment. Bioinformatics 2009, 25, 1966–1967. [Google Scholar] [CrossRef] [PubMed]
- Han, Y.; He, X. Integrating Epigenomics into the Understanding of Biomedical Insight. Bioinform. Biol. Insights 2016, 10, 267–289. [Google Scholar] [CrossRef] [PubMed]
- The ENCODE Project Consortium. Whole-Genome Bisulfite Sequencing Data Standards and Processing Pipeline. Available online: https://www.encodeproject.org/wgbs/ (accessed on 6 July 2017).
- Epigenome Blueprint. ChIP-Seq Analysis Pipeline. Available online: http://dcc.blueprint-epigenome.eu/#/md/chip_seq_grch37 (accessed on 6 July 2017).
- Sun, Z.; Cunningham, J.; Slager, S.; Kocher, J.P. Base resolution methylome profiling: Considerations in platform selection, data preprocessing and analysis. Epigenomics 2015, 7, 813–828. [Google Scholar] [CrossRef] [PubMed]
- Ewing, B.; Green, P. Base-calling of automated sequencer traces using phred. II. Error probabilities. Genome Res. 1998, 8, 186–194. [Google Scholar] [CrossRef] [PubMed]
- Del Fabbro, C.; Scalabrin, S.; Morgante, M.; Giorgi, F.M. An extensive evaluation of read trimming effects on Illumina NGS data analysis. PLoS ONE 2013, 8, e85024. [Google Scholar] [CrossRef] [PubMed]
- Schbath, S.; Martin, V.; Zytnicki, M.; Fayolle, J.; Loux, V.; Gibrat, J.F. Mapping reads on a genomic sequence: An algorithmic overview and a practical comparative analysis. J. Comput. Biol. 2012, 19, 796–813. [Google Scholar] [CrossRef] [PubMed]
- Yu, X.; Sun, S. Comparing five statistical methods of differential methylation identification using bisulfite sequencing data. Stat. Appl. Genet. Mol. Biol. 2016, 15, 173–191. [Google Scholar] [CrossRef] [PubMed]
- Steinhauser, S.; Kurzawa, N.; Eils, R.; Herrmann, C. A comprehensive comparison of tools for differential ChIP-seq analysis. Brief. Bioinform. 2016, 17, 953–966. [Google Scholar] [CrossRef] [PubMed]
- Buenrostro, J.D.; Wu, B.; Chang, H.Y.; Greenleaf, W.J. ATAC-seq: A Method for Assaying Chromatin Accessibility Genome-Wide. Curr. Protoc. Mol. Biol. 2015, 109, 21–29. [Google Scholar] [CrossRef] [PubMed]
- Belton, J.M.; McCord, R.P.; Gibcus, J.H.; Naumova, N.; Zhan, Y.; Dekker, J. Hi-C: A comprehensive technique to capture the conformation of genomes. Methods 2012, 58, 268–276. [Google Scholar] [CrossRef] [PubMed]
Figure 1.
Principle of DNA methylation analysis by bisulfite treatment (modified from [60]). On a DNA sequence, unmethylated cytosines are converted to uracil by the bisulfite treatment and to thymines after PCR amplification. After sequencing, the level of methylation is detected by counting cytosines and thymines for each position. m, methyl group on cytosine; OT, Original Top strand; CTOT, strand complementary to the original top strand; OB, original bottom strand; and CTOB, strand complementary to the original bottom strand.
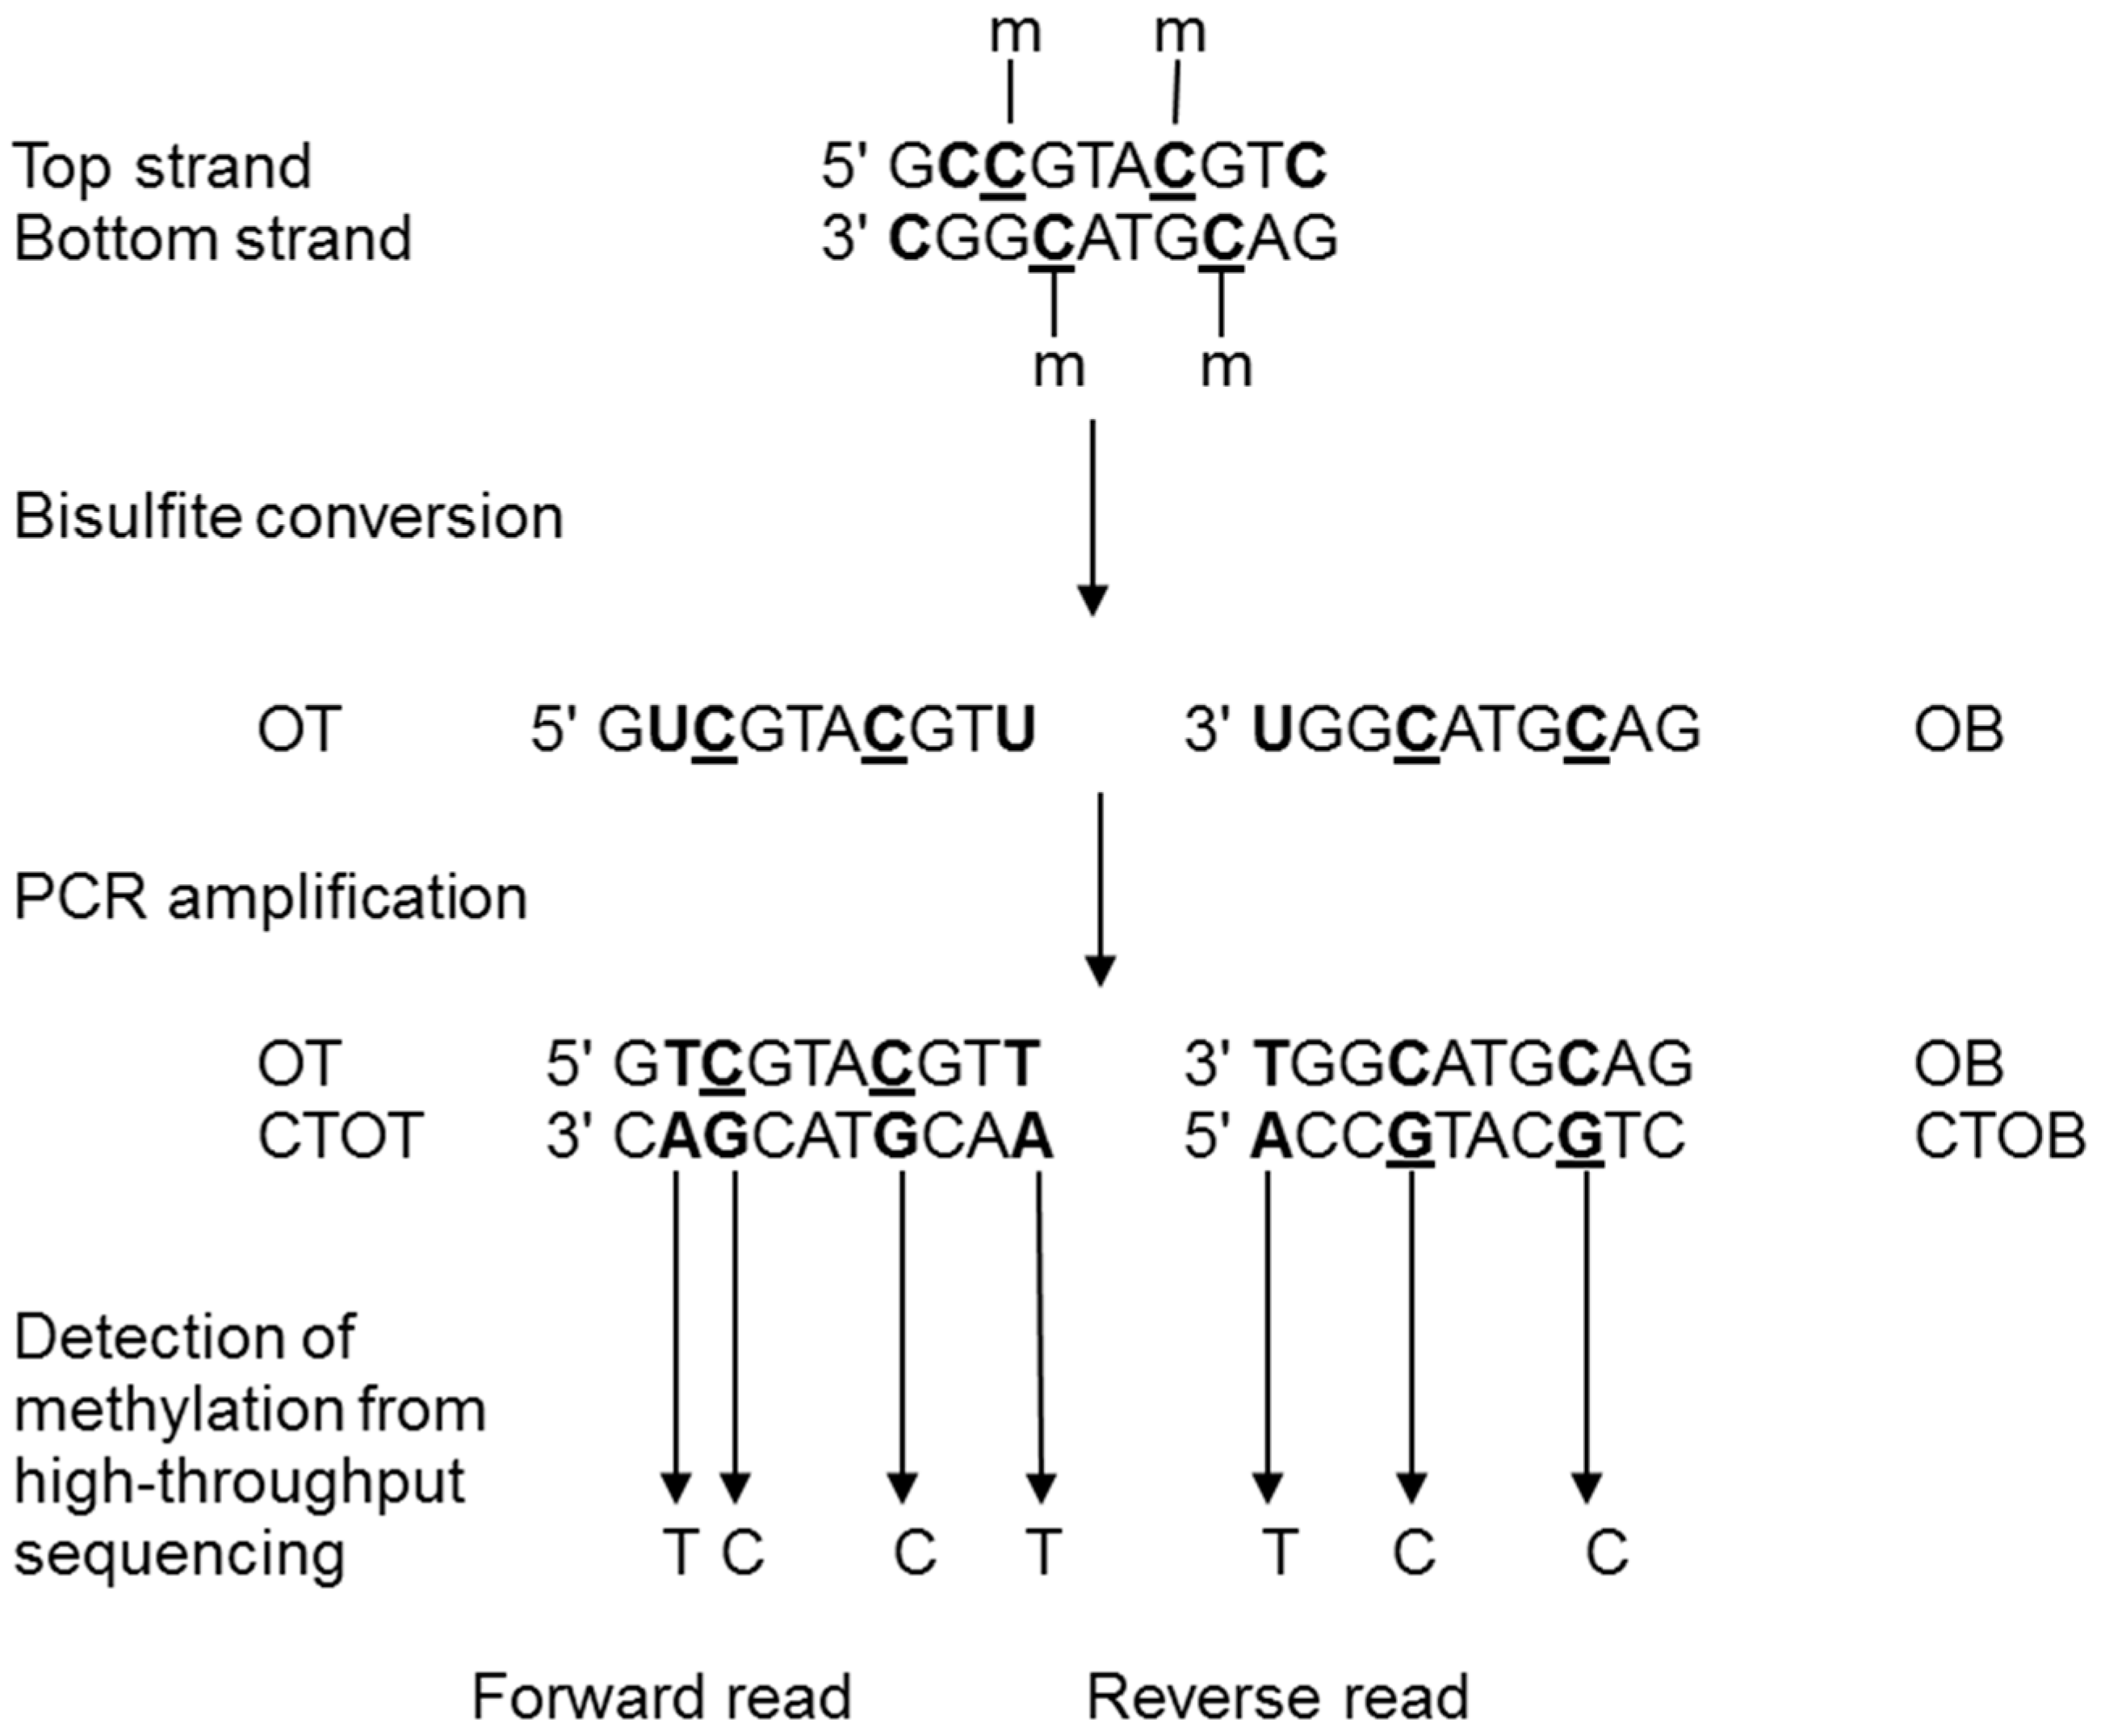
Figure 2.
Protocol of chromatin immunoprecipitation followed by high throughput sequencing. The chromatin is extracted from tissues and can be fixed (X-ChIP-seq) or left unfixed (N-ChIP-seq). For X-ChIP-seq the interaction between the DNA and histone bearing the mark is fixed and the chromatin is shredded by sonication to obtain fragments between 100 bp and 600 bp. For N-ChIP-seq, native chromatin is digested by an endonuclease (MNase) that specifically cuts unprotected DNA between nucleosomes to obtain mono-nucleosomes. The chromatin is fragmented by mechanical or enzymatic treatments and immunoprecipitated with an antibody directed specifically against the histone post-translational modifications (HPTM) of interest. After several washes, the DNA is eluted and sequenced following library creation.

Figure 3.
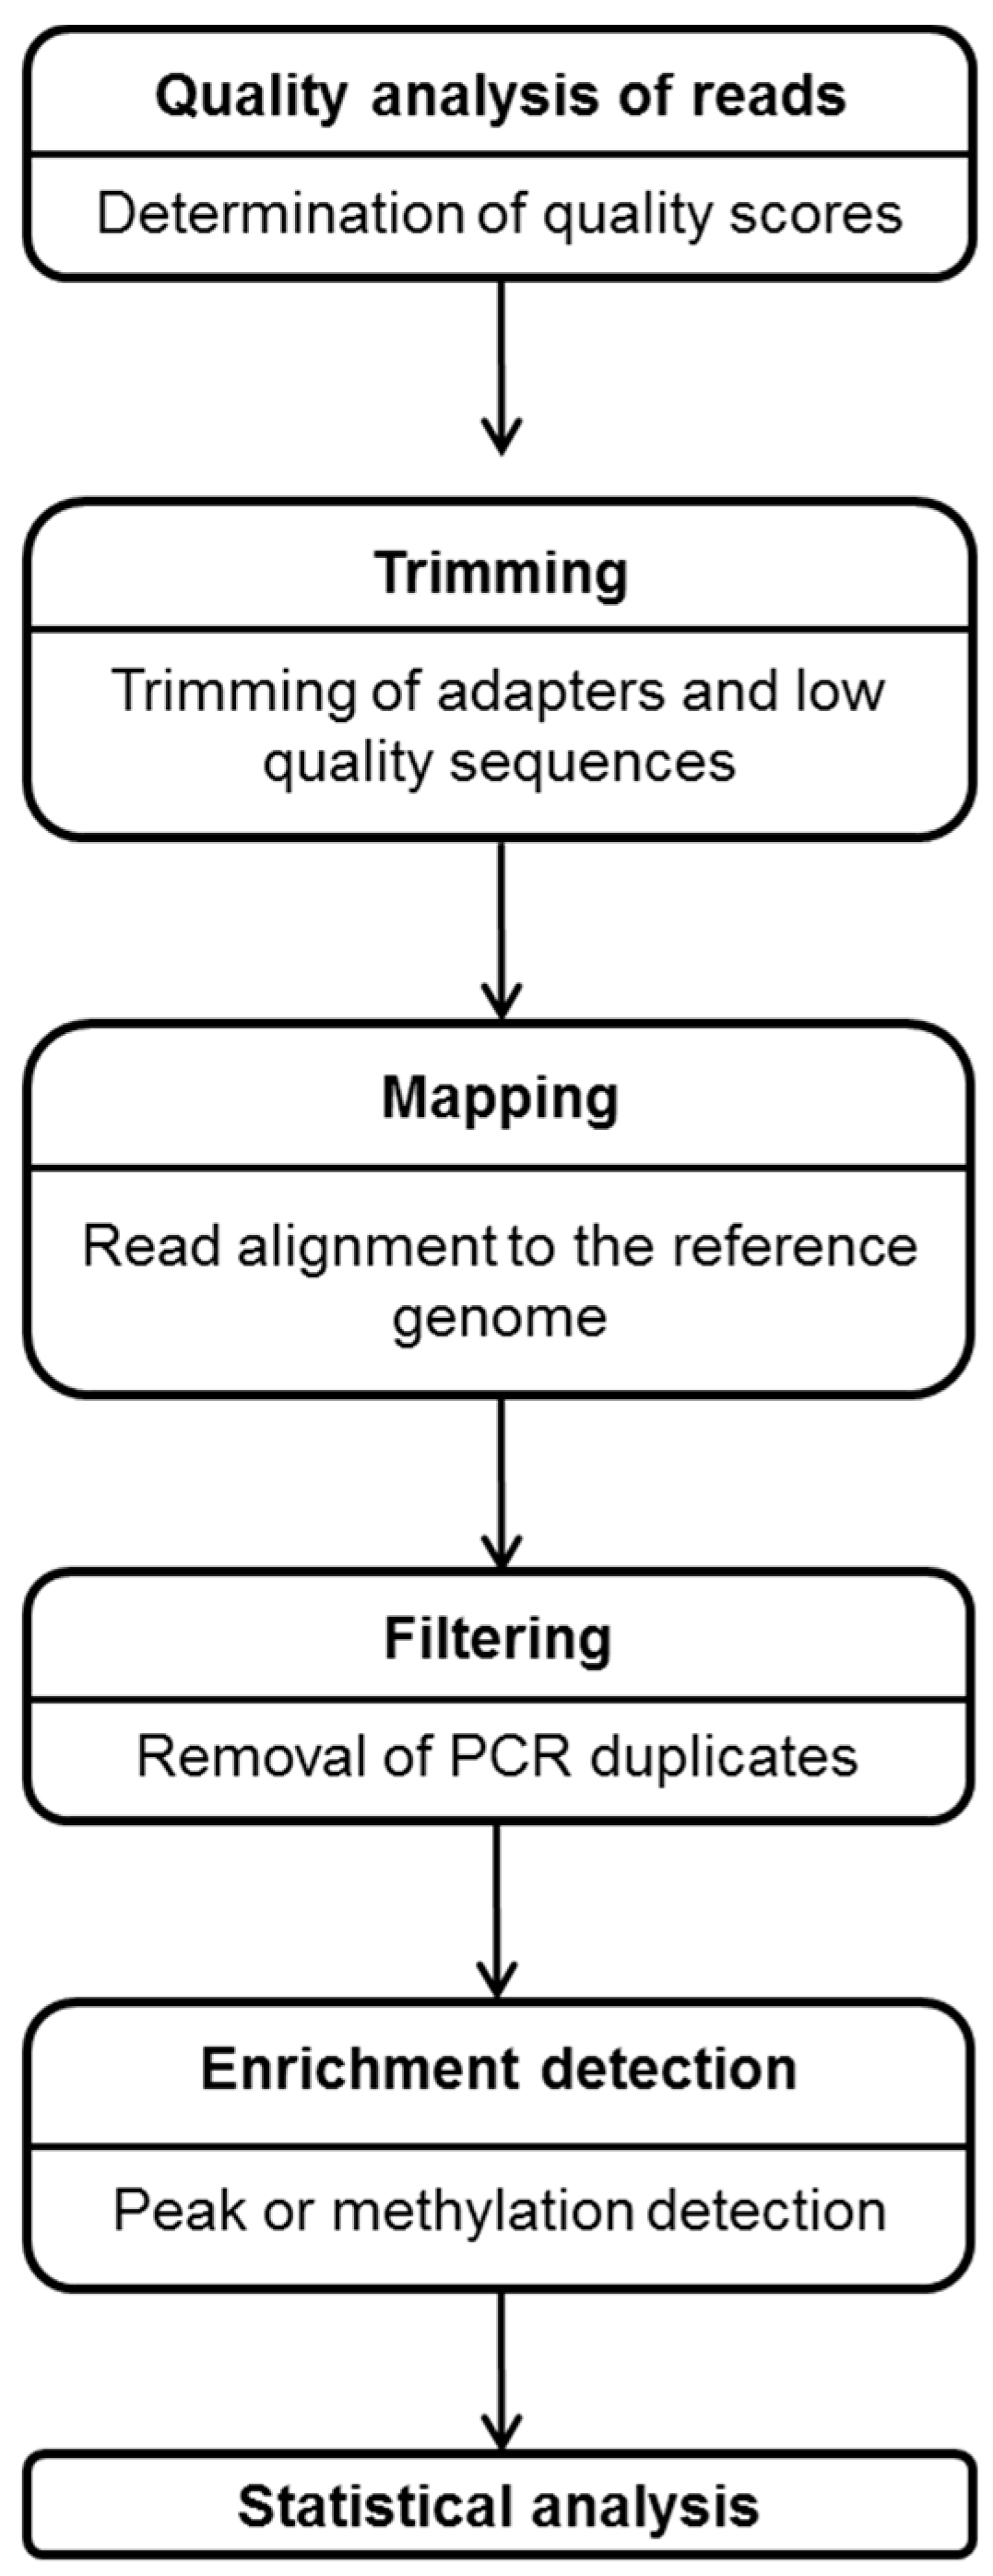
Example of a bioinformatics pipeline to analyze WGBS or ChIP-seq data. The quality of the sequencing reads is estimated by fastqc metrics such as the Q score [108]. Reads are usually considered of good quality when their score is above 30 (at q30 the base call accuracy is 99.9%, [109]). Optionally, reads can be trimmed to remove adapter sequences and low quality bases [110]. Reads are then mapped to the reference genome [111]. An optional filtering step can be performed by removing PCR duplicates to conserve only uniquely mapped reads before the enrichment detection. The enrichment detection step is specific to the targeted epigenetic mark. Several tools have been developed to characterize the DNA methylation across the genome (for a review see [112]) or to study HPTM depending on their repartition on the genome as HPTM were shown to exhibit sharp or broad peaks of enrichment (for a review see [113]). Finally, statistical differential analyses can be performed when two or more conditions have to be compared [112,113].
Figure 3.
Example of a bioinformatics pipeline to analyze WGBS or ChIP-seq data. The quality of the sequencing reads is estimated by fastqc metrics such as the Q score [108]. Reads are usually considered of good quality when their score is above 30 (at q30 the base call accuracy is 99.9%, [109]). Optionally, reads can be trimmed to remove adapter sequences and low quality bases [110]. Reads are then mapped to the reference genome [111]. An optional filtering step can be performed by removing PCR duplicates to conserve only uniquely mapped reads before the enrichment detection. The enrichment detection step is specific to the targeted epigenetic mark. Several tools have been developed to characterize the DNA methylation across the genome (for a review see [112]) or to study HPTM depending on their repartition on the genome as HPTM were shown to exhibit sharp or broad peaks of enrichment (for a review see [113]). Finally, statistical differential analyses can be performed when two or more conditions have to be compared [112,113].
© 2017 by the authors. Licensee MDPI, Basel, Switzerland. This article is an open access article distributed under the terms and conditions of the Creative Commons Attribution (CC BY) license (http://creativecommons.org/licenses/by/4.0/).
Share and Cite
MDPI and ACS Style
David, S.-A.; Mersch, M.; Foissac, S.; Collin, A.; Pitel, F.; Coustham, V. Genome-Wide Epigenetic Studies in Chicken: A Review. Epigenomes 2017, 1, 20. https://doi.org/10.3390/epigenomes1030020
AMA Style
David S-A, Mersch M, Foissac S, Collin A, Pitel F, Coustham V. Genome-Wide Epigenetic Studies in Chicken: A Review. Epigenomes. 2017; 1(3):20. https://doi.org/10.3390/epigenomes1030020
Chicago/Turabian StyleDavid, Sarah-Anne, Marjorie Mersch, Sylvain Foissac, Anne Collin, Frédérique Pitel, and Vincent Coustham. 2017. "Genome-Wide Epigenetic Studies in Chicken: A Review" Epigenomes 1, no. 3: 20. https://doi.org/10.3390/epigenomes1030020