Dynamics of the Methylome and Transcriptome during the Regeneration of Rice
by

Fei-Man Hsu
1,†, 
Moloya Gohain
2,†,
Archana Allishe
2,
Yan-Jiun Huang
2,
Jo-Ling Liao
2,
Lin-Yun Kuang
2,3 and
Pao-Yang Chen
2,* 1
Graduate School of Frontier Sciences, The University of Tokyo, Chiba 277-8562, Japan
2
Institute of Plant and Microbial Biology, Academia Sinica, Taipei 11529, Taiwan
3
Transgenic Plant Core Facility, Academia Sinica, Taipei 11529, Taiwan
*
Author to whom correspondence should be addressed.
†
These authors contributed equally to this work.
Epigenomes 2018, 2(3), 14; https://doi.org/10.3390/epigenomes2030014
Submission received: 9 June 2018
/
Revised: 29 June 2018
/
Accepted: 17 July 2018
/
Published: 21 July 2018
(This article belongs to the Special Issue Plant Epigenome Dynamics)
Abstract
:Oryza sativa indica (cv. IR64) and Oryza sativa japonica (cv. TNG67) vary in their regeneration efficiency. Such variation may occur in response to cultural environments that induce somaclonal variation. Somaclonal variations may arise from epigenetic factors, such as DNA methylation. We hypothesized that somaclonal variation may be associated with the differential regeneration efficiency between IR64 and TNG67 through changes in DNA methylation. We generated the stage-associated methylome and transcriptome profiles of the embryo, induced calli, sub-cultured calli, and regenerated calli (including both successful and failed regeneration) of IR64 and TNG67. We found that stage-associated changes are evident by the increase in the cytosine methylation of all contexts upon induction and decline upon regeneration. These changes in the methylome are largely random, but a few regions are consistently targeted at the later stages of culture. The expression profiles showed a dominant tissue-specific difference between the embryo and the calli. A prominent cultivar-associated divide in the global methylation pattern was observed, and a subset of cultivar-associated differentially methylated regions also showed stage-associated changes, implying a close association between differential methylation and the regeneration programs of these two rice cultivars. Based on these findings, we speculate that the differential epigenetic regulation of stress response and developmental pathways may be coupled with genetic differences, ultimately leading to differential regeneration efficiency. The present study elucidates the impact of tissue culture on callus formation and delineates the impact of stage and cultivar to determine the dynamics of the methylome and transcriptome in culture.
1. Introduction
Plant tissue culture techniques have been developed for more than one century [1]. The integration of in vitro culture with molecular biology techniques has become routine in plant research and crop improvement applications, such as plant transformation, and has recently been extended to genome editing [2,3,4]. These applications critically rely on efficient regeneration, a process of growing plants in vitro from a single cell or group of cells [5]. Although progenies from micropropagation are supposed to be identical at the genetic level, i.e., genetic clones, variations frequently occur. For example, rice regenerated from calli show variations in plant stature, leaf/panicle length, tiller number and fertile seed frequency (Fukui, 1983; King, 1995; Zong-Xiu, 1983). This phenomenon is called somaclonal variation [6]. Somaclonal variation provides genetic diversity and phenotypic changes as a resource for breeding programs [7] for enhanced phenotypes, such as high productivity, stress tolerance and disease resistance [8,9]. However, somaclonal variations can have undesirable effects on varietal stability and regeneration. In oil palm, tissue culture-induced somaclonal variations such as ‘mantling’, drastically reduce yield and hinder the regeneration of their elite hybrids [10]. Somaclonal variations are unpredictable, non-reproducible and, therefore, cumbersome for analysis and assessment.
Plant tissue culture-induced somaclonal variation has been documented in many species [11,12]. Assessments of in vitro-cultured plants or tissues have exhibited the genetic and epigenetic changes underlying somaclonal variation [13]. Neelakandan and Wang investigated molecular changes during in vitro culture and summarized the factors, including hormone crosstalk, stress and culture explant that may altogether lead to genetic and epigenetic changes [13]. In addition, plant genotype, explant source, tissue age, media components and culture period may also play a part in arising somaclonal variations [6].
Genotype-dependent in vitro culture is common in many crops. Abe and Futsuhara examined 60 rice varieties from japonica, indica and javanica subspecies and observed distinct callus formation and regeneration efficiencies, even within the same subspecies [14]. Among elite cultivars, Tainung67 (TNG67) has a higher growth and regeneration capacity than Indica rice 64 (IR64) [14,15,16]. In a more recent study, amplified fragment length polymorphism (AFLP) and methylation-sensitive amplified polymorphism (MSAP) analyses confirmed that genetic alteration is the major cause of somaclonal variation in rice [17]. High-throughput sequencing of DNA has also revealed sequence changes resulting from callus growth and transformation in TNG67, IR64 and other rice cultivars [18]. In addition to genotype, the culture medium also induces variations in gene regulation, chromatin structure and the epigenome [19,20,21]. Epigenetic changes are reported during the regeneration of rye [22], triticale [23], garlic and torenia [24,25]. Furthermore, the use of demethylating agents, such as 5-azacytidine (5-azaC), has led to differential transcriptional activities in regenerants, implying that changes in DNA methylation induced through in vitro culture may regulate gene expression, resulting in phenotypic variations [26,27,28,29,30]. Both genetic and epigenetic factors contribute to somaclonal variation, but the interplay between these factors has not been well investigated.
Among the epigenetic regulators, DNA methylation is a heritable mechanism involved in tissue culture-induced mutagenesis [21]. Changes in DNA methylation alter transcriptional activities in regenerated rice [26,27,28,31,32], flax [33], Melandrium [34], barley [35] and triticale [36,37,38,39], thereby contributing to somaclonal variation [13,20,21,40]. In Populus trichocarpa, the immunoprecipitation of methylated DNA sequencing (MeDIP-seq) profiles of internode stem segments from micropropagated explants, dedifferentiated calli, and internodes of regenerated plants shows that more than half (56%) of the methylated portion of the genome are differentially methylated among the three tissue types. In the same study, 45% of the differentially methylated genes, which occurred most frequently in the chromosomal regions, showed transient methylation, methylation in calli, and demethylation in regenerants. Additionally, this study showed that DNA methylation varies in a highly gene- and chromosome-differential manner during de-differentiation and regeneration [41]. Furthermore, the MSAP profiles of callus induced using different concentrations of 6-BA and 2,4-D in Brassica napus showed different callus induction and DNA methylation rates. The expression of methyltransferase under different induction conditions was consistent with methylation modifications, suggesting that methylation changes may partially indicate the effects of hormones on callus induction, as well as that DNA methylation depends on induction conditions [42]. In a recent study, Stroud and coworkers used whole-genome bisulfite sequencing (WGBS) to examine the methylomes of the leaves from transformed and untransformed rice lines and induced callus against wild-type plants [40]. Both transformed and untransformed leaves showed losses of DNA methylation during culture. Plants from untransformed callus showed a loss of DNA methylation at variable sites, suggesting that methylation losses are random in the genome and occur during tissue culture and not transformation. These studies suggest that DNA methylation changes during in vitro culture may contribute to somaclonal variation. Nevertheless, the dynamics of methylome and transcriptome profiles during dedifferentiation and re-differentiation stages remain undetermined.
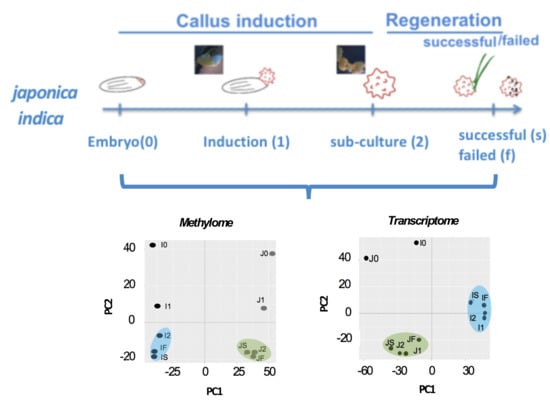
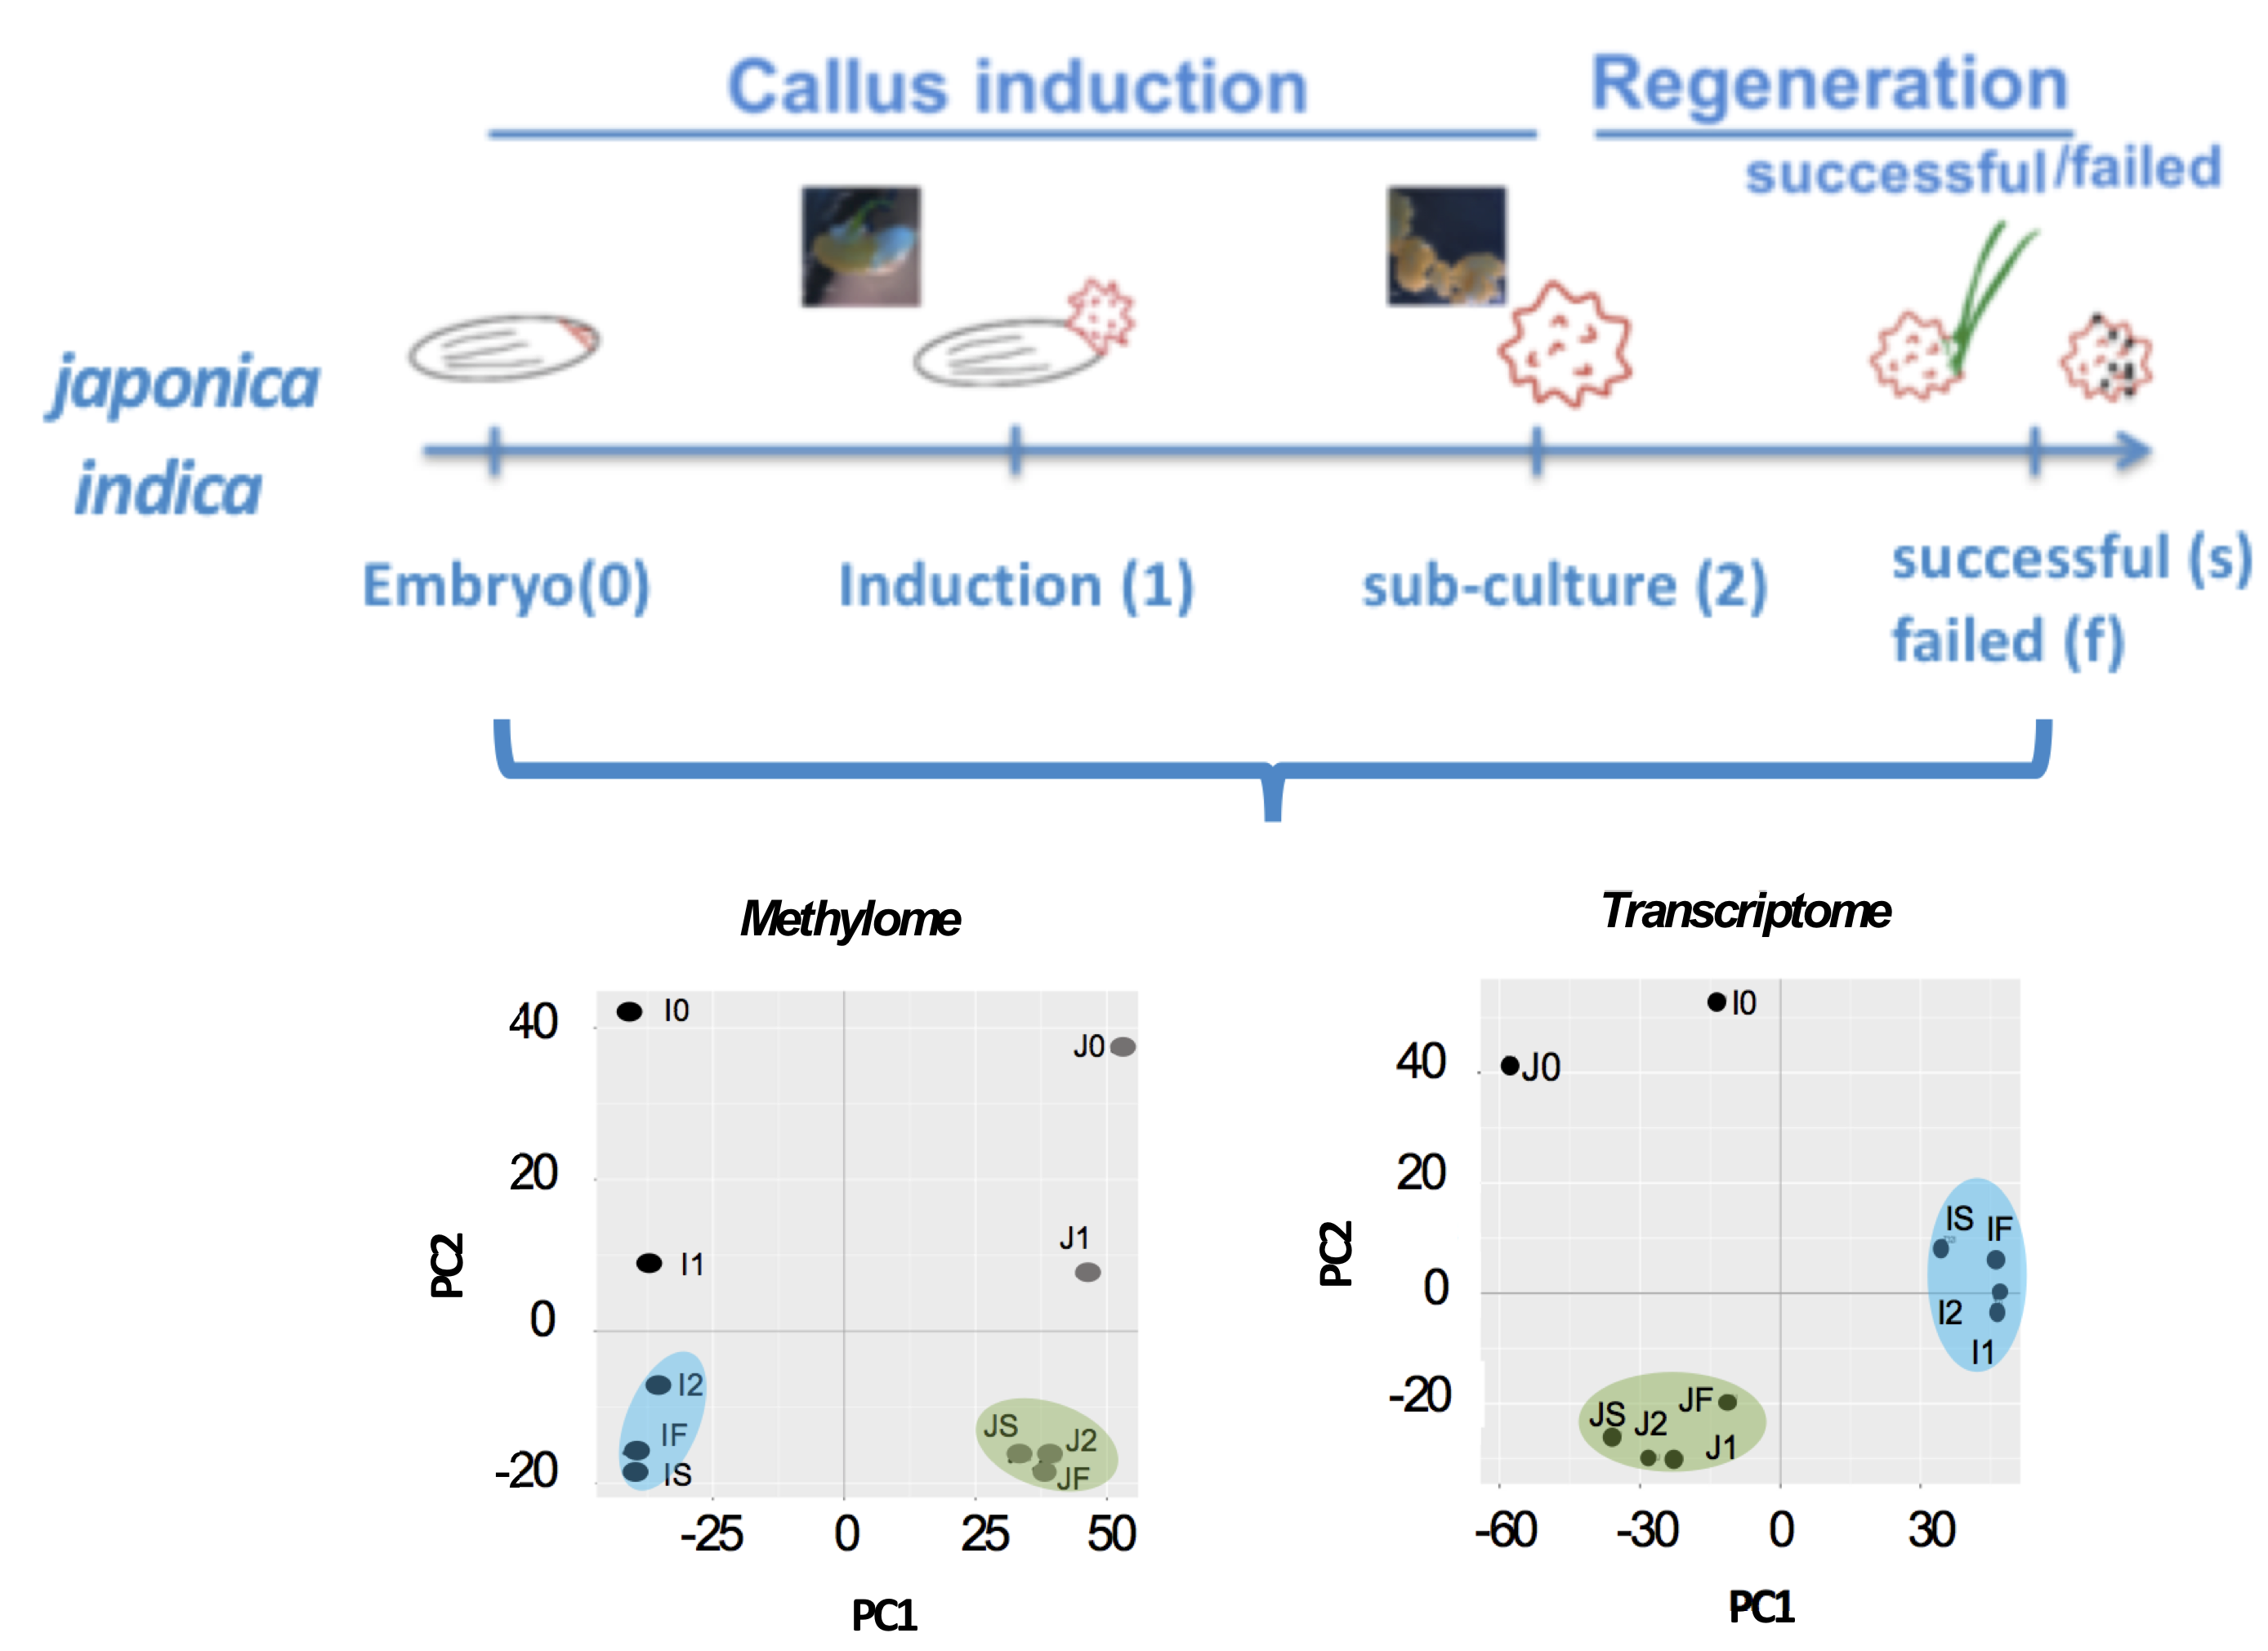
In the present study, we profiled the methylome and transcriptomes of IR64 and TNG67 in: the embryonic stage (T0), free from the impact of culture medium; the induced callus stage (T1), with exposure to the culture medium; the sub-cultured callus stage (T2), characterized by stabilization in the culture medium; and successful (TS) and failed (TF) calli stages to compare the outcome of regeneration. We observed that DNA methylation mildly increases with induction and declines upon regeneration both globally and at the gene level. Such changes in the methylome during culture are largely random but may favor certain hotspots. We also observed differential expression associated with genetic differences between the two cultivars. We hypothesize that the differential epigenetic regulation of genes in response to stress, biotic/abiotic stimulus, growth and developmental pathways is coupled to genetic differences between IR64 and TNG67, which are likely responsible for the differential regeneration efficiencies in the two cultivars.
2. Results
To determine whether DNA methylation is associated with rice regeneration, we monitored the morphological changes in the calli during six weeks of culture. We performed WGBS to examine changes in the methylome as the embryo was induced to form a callus, sub-cultured and regenerated, and RNA-seq was performed to examine gene expression. We integrated methylome and transcriptome analyses and identified specific genes to explain the different regeneration abilities of IR64 and TNG67.
2.1. Morphological Evidence of the Differential Impact of Tissue Culture
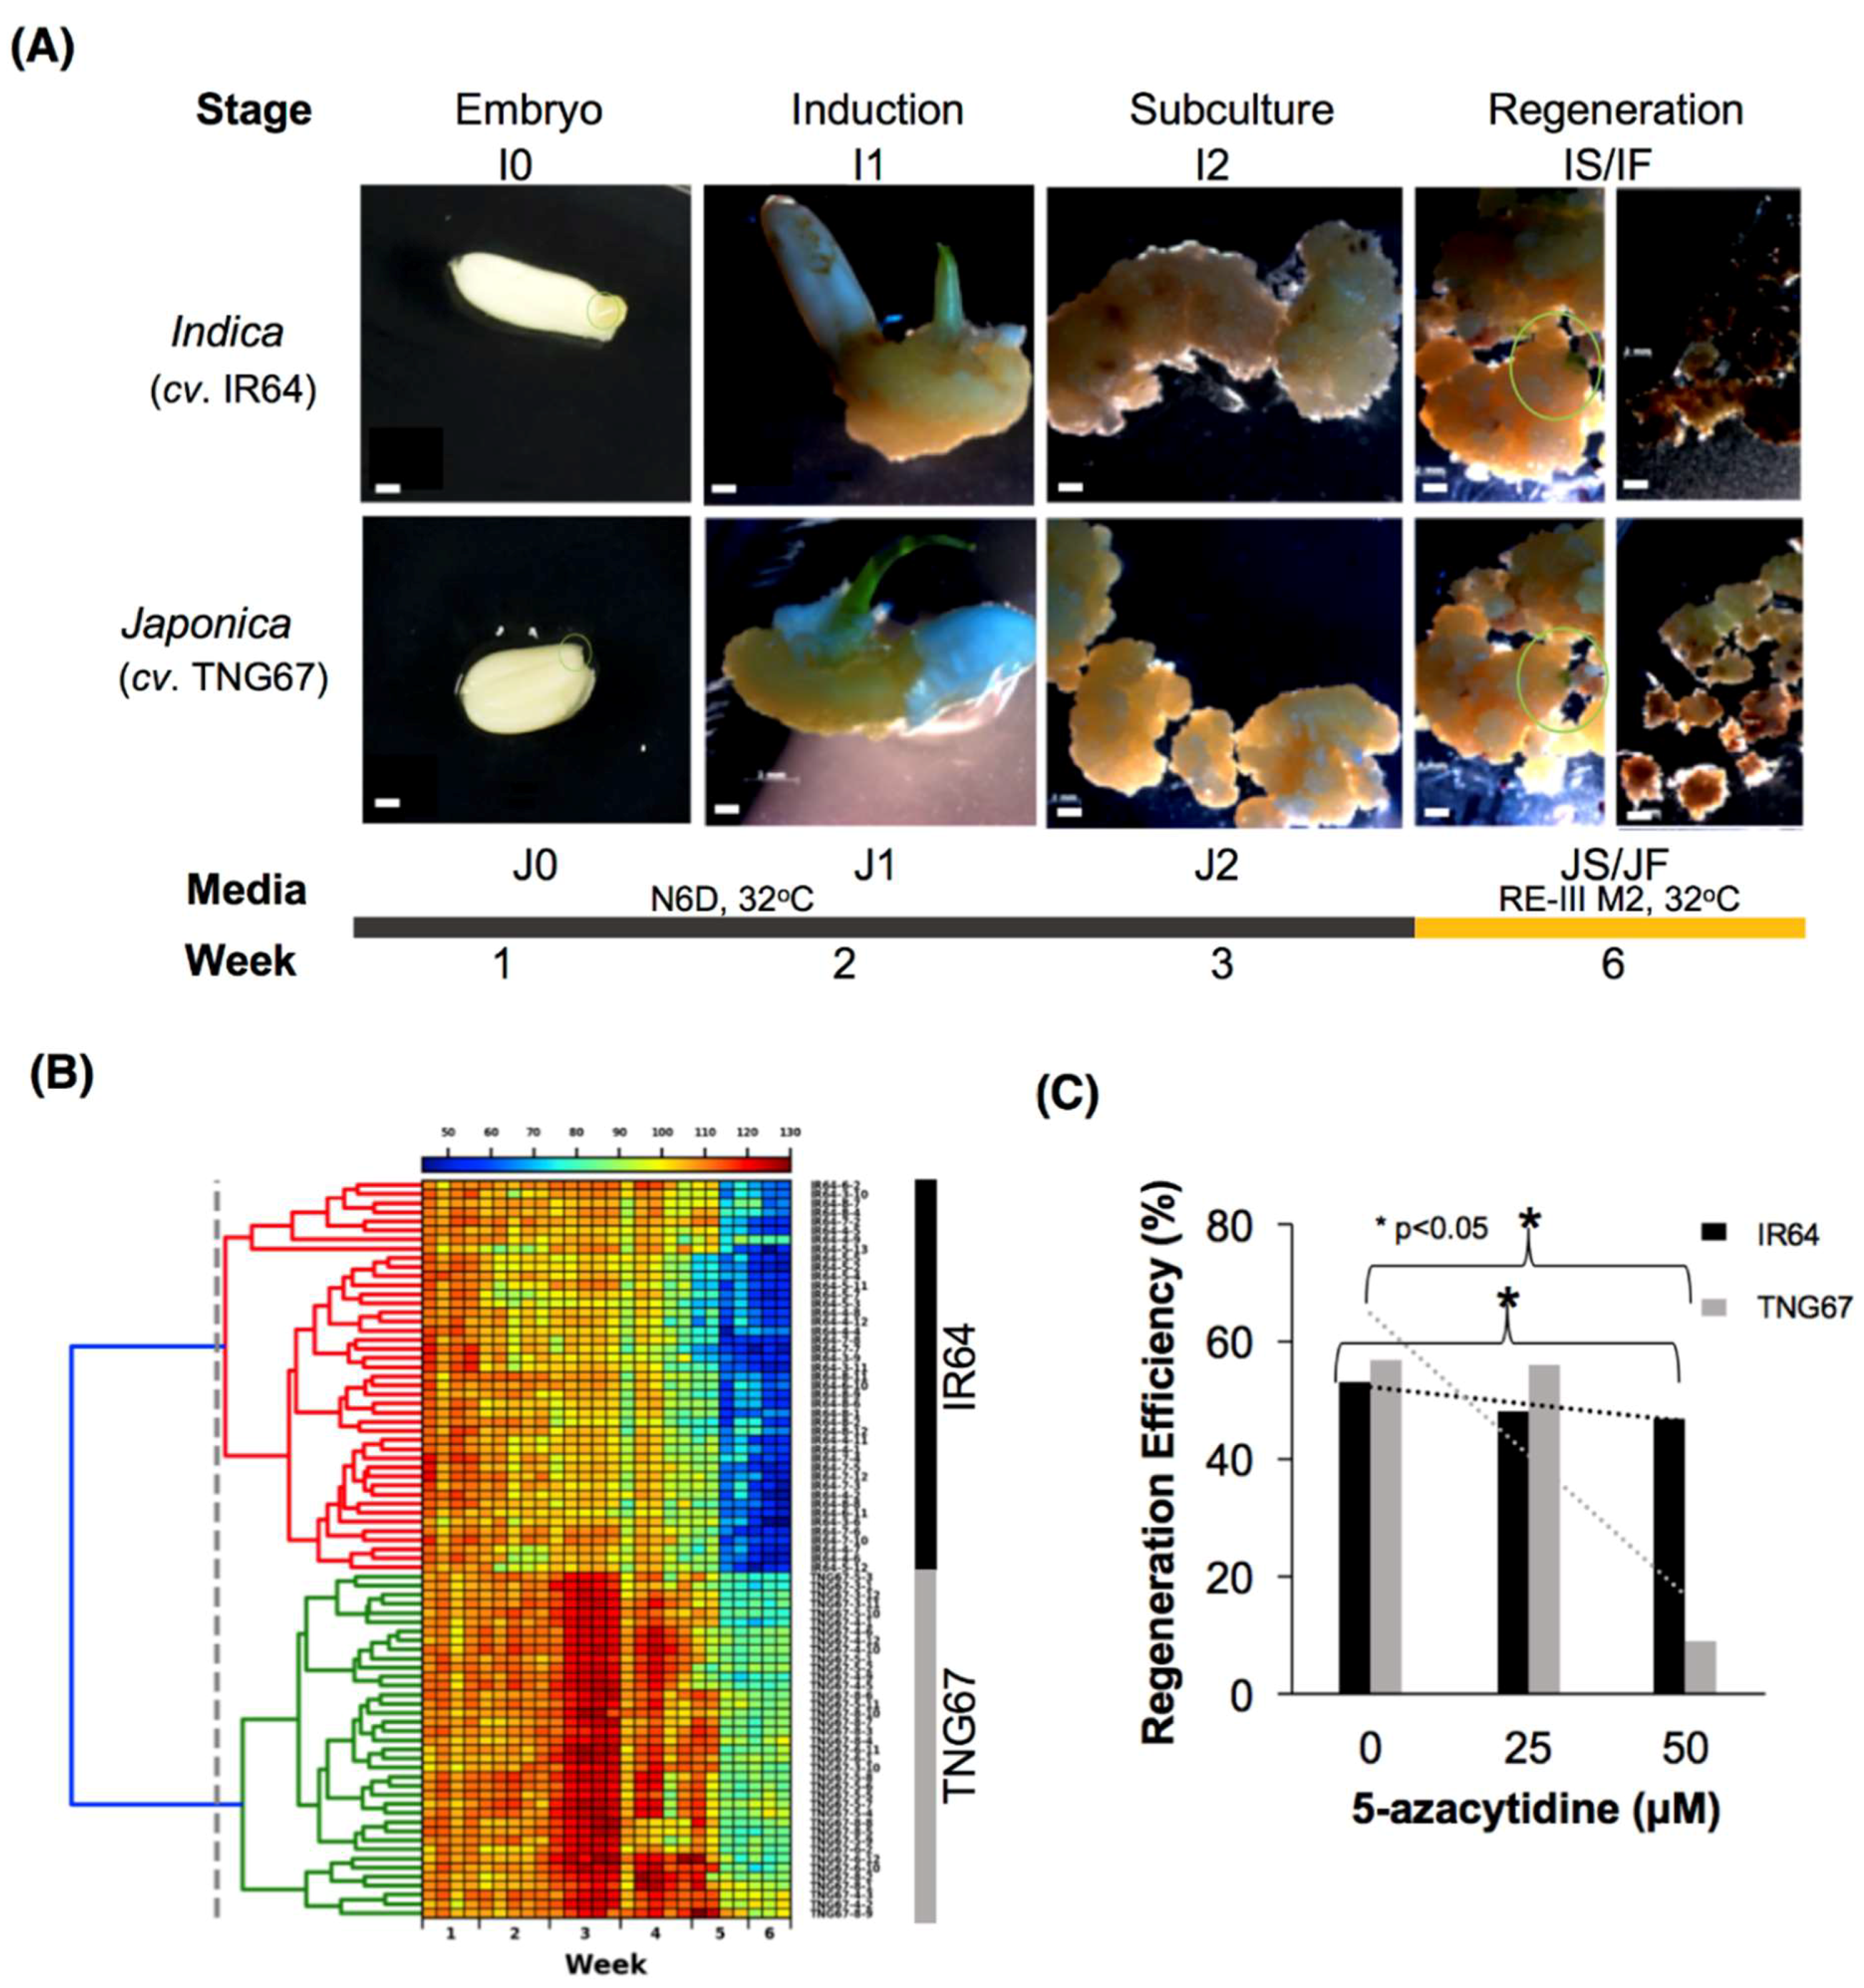
During the regeneration process, we recorded the morphological changes in explants by capturing macroscopic images (n = 82) daily for 6 weeks (Figure 1A). The color changes were interpreted as hue-saturation values (HSV, see Materials and Methods). We observed two distinct groups from this analysis, namely, one group that survived after three weeks of culture and another group that failed to survive (blue) (Figure 1B). The differential impact of tissue culture on rice calli was directly observed when all of the TNG67 and only 67.4% of the IR64 calli survived. We also monitored the area covered by the growing calli during the culture period. IR64 showed a high growth rate in the first three weeks, but when the culture medium was changed from N6D (callus-inducing) to Re-III M2 (regeneration), this plant showed a gradual decline in growth rate (Figure S1A). Despite the high initial growth rate, most IR64 calli turned brown after three weeks of culture in the regeneration medium. The area covered by the IR64 calli also decreased with time. However, upon transfer to regeneration medium, the growth rate of TNG67 showed a rapid increase after 25 days of culture, with a parallel increase in the area covered by the calli. TNG67 showed a higher number of successfully regenerated calli than IR64. Evidently, the culture medium has a differential impact on the two cultivars during callus development and regeneration. The culture medium is a known stressor to the epigenome [20]. Thus, we determined whether changes in DNA methylation affect callus regeneration. We treated IR64 and TNG67 calli with different concentrations (0, 25 and 50 µM) [26,31] of the demethylating agent 5-azaC (Figure S1B). We used doses previously reported in rice and lower than the lethal level of 100 µM. We observed that the dosage of 5-azaC is significantly inversely associated with regeneration efficiency (p < 0.05) in both rice cultivars, implying that changes in DNA methylation are critical to regeneration (Figure 1C).
2.2. Stage-Associated Impact of Tissue Culture on IR64 and TNG67
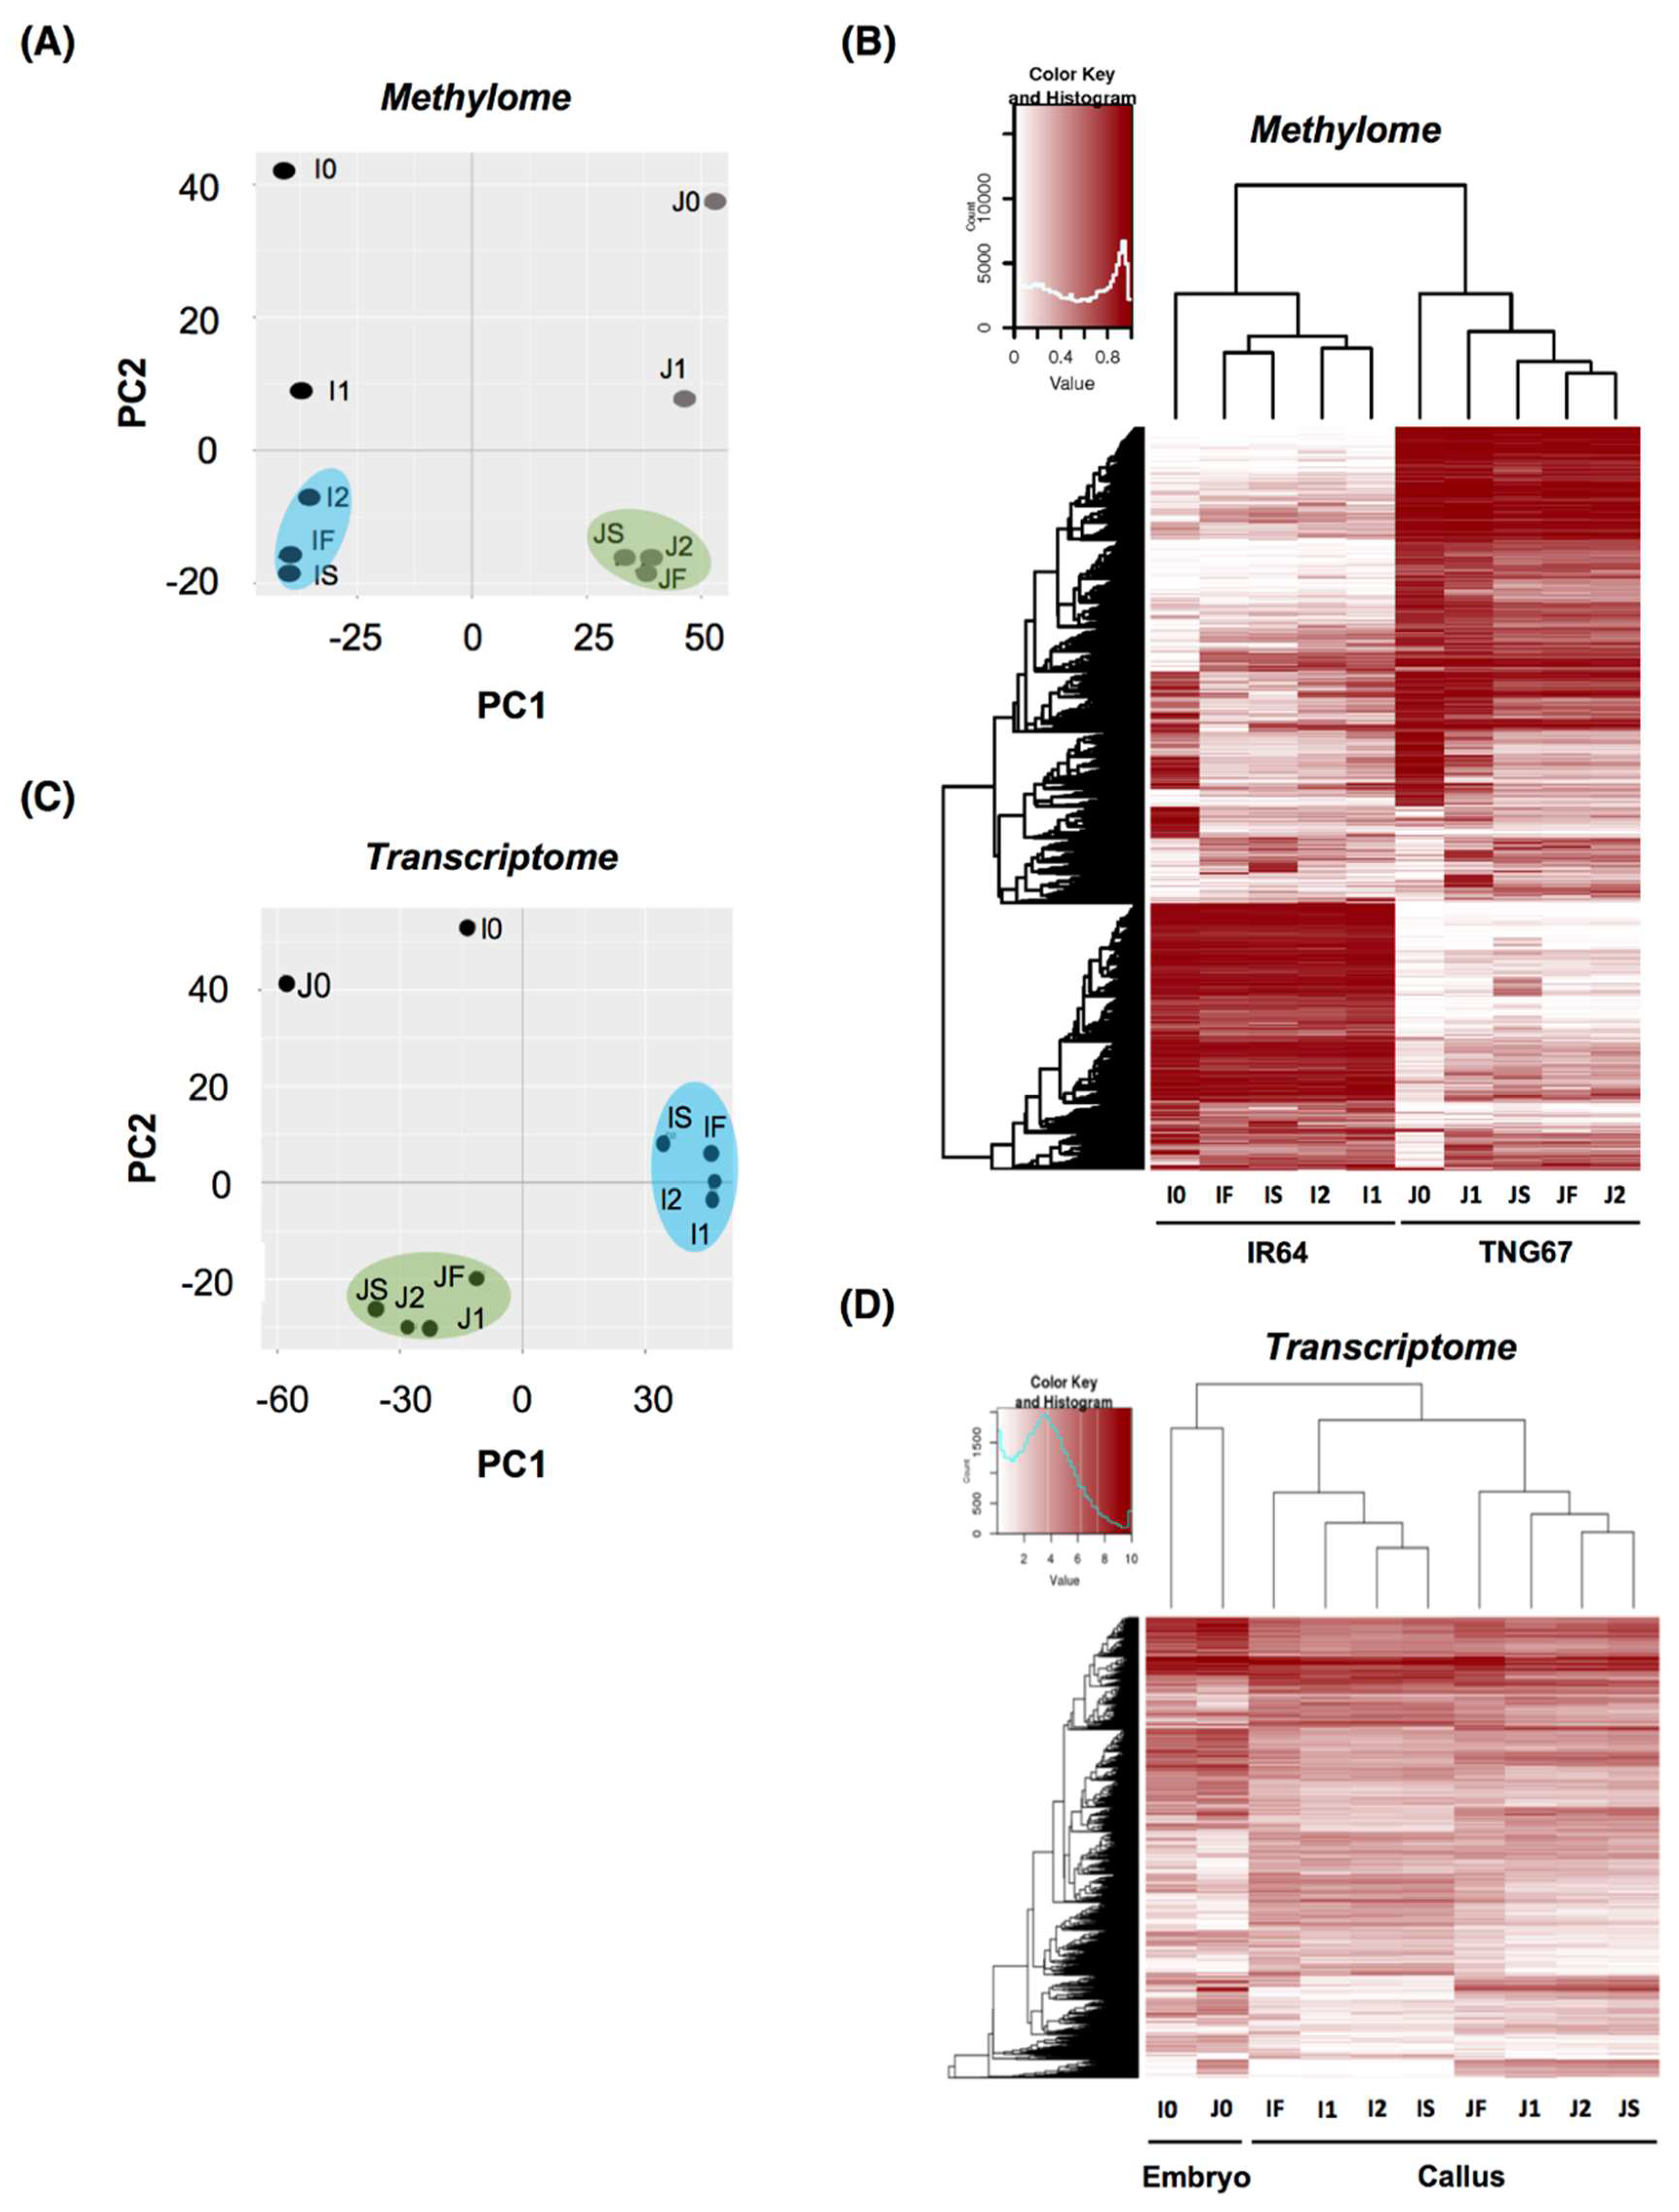
We first assessed the global effect on the methylomes from these samples (Figure 2A, Table S1) using principal component analysis (PCA) and hierarchical clustering. PCA of the methylomes showed a prominent cultivar-specific (PC1) divide (Figure 2A), suggesting that IR64 and TNG67 have more distinct DNA methylation profiles than stage-wise calli shown from the second component (PC2). Figure 2B shows the genomic regions of 1000 bp that have variable methylation pattern among all samples in japonica and indica. The regions are selected if the methylation difference is greater than 70% between any two samples. In total 13,631 regions are selected and presented in Figure 2B. The hierarchical clustering of all methylomes (Figure 2B) showed that the highly methylated genomic regions in IR64 are less methylated in TNG67. Similarly, the highly methylated regions in TNG67 showed low methylation in IR64, indicating differentially methylated regions. In each cultivar-specific cluster, we also observed a clear difference between the embryo and the callus. Thus, the global profile of the methylome projects a prominent genetic/cultivar-related impact.
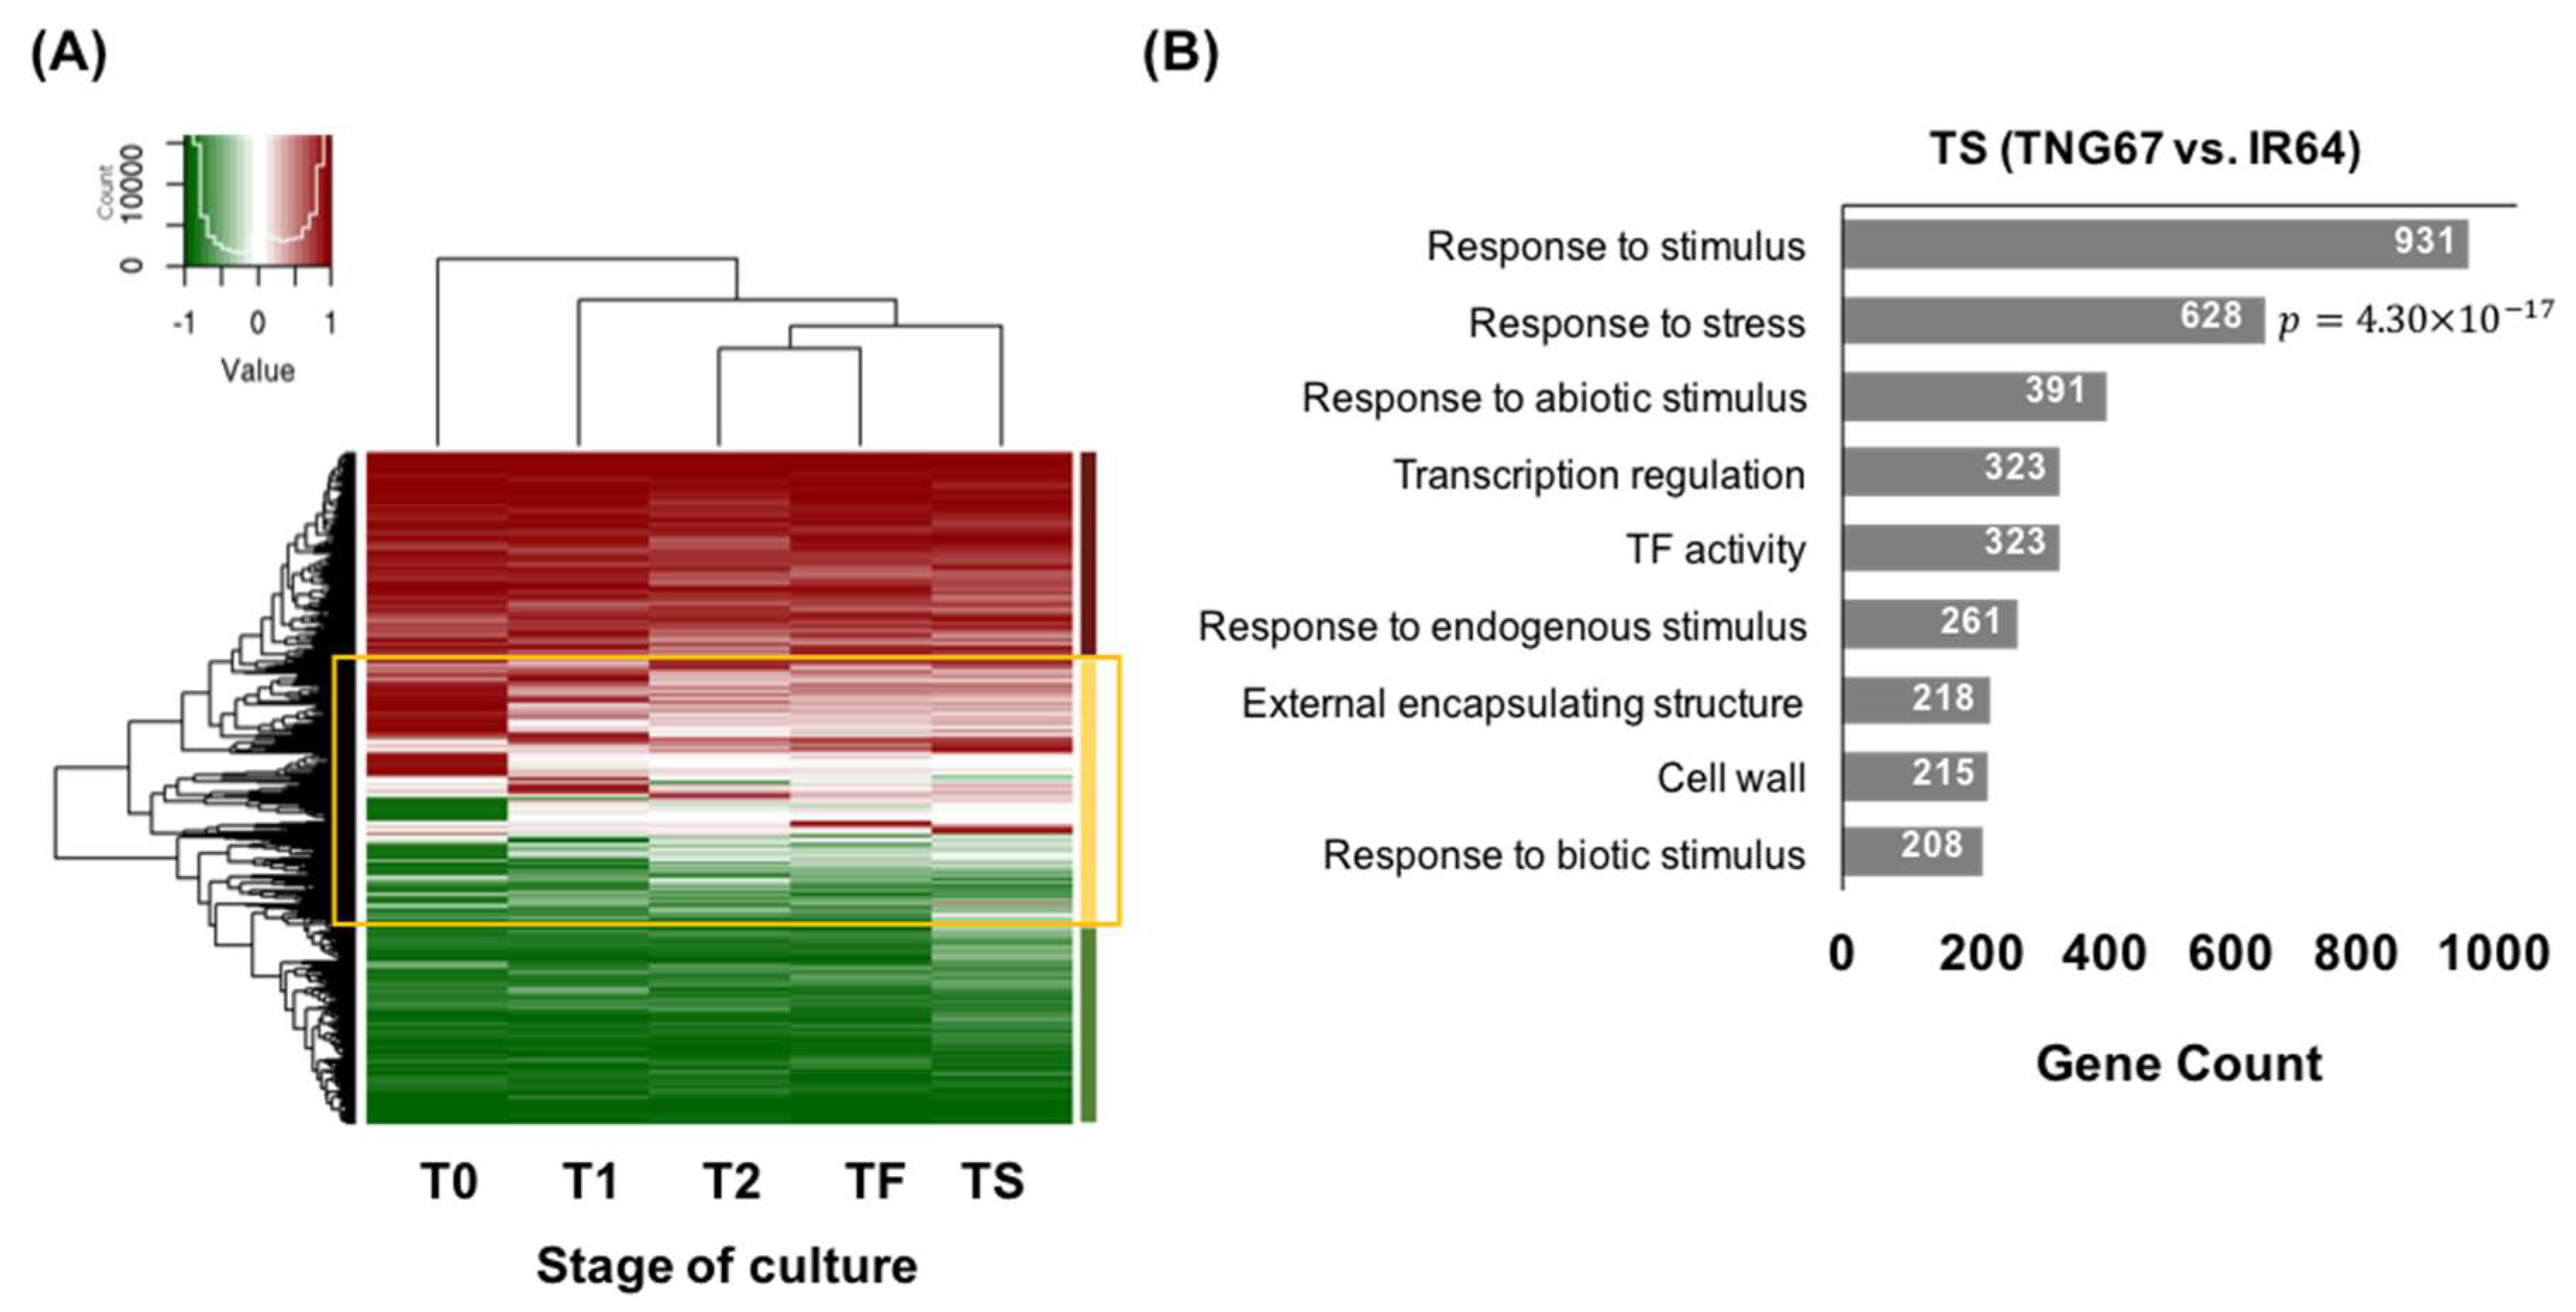
In the PCA of transcriptomes, the embryos of both IR64 and TNG67 had distinct expression profiles from those of the callus (Figure 2C). The hierarchically clustered heatmap of 4159 genes with variable expression among all transcriptomes (Figure 2D) revealed two major clusters of embryos and calli, suggesting that tissue type has a greater impact on gene expression than cultivar type. Within the cultivar-specific divide, the induced callus clustered away from the tight cluster of sub-cultured and successfully regenerated calli of IR64, indicating that there is a major change in gene expression upon induction. The successful regenerants remained a similar transcriptional pattern to the induced callus whereas the failed showed a distinct pattern from the successful (Figure 2D), implying that the change in gene expression after induction is associated with the outcome of regeneration.
2.3. Stage of Culture Modulates Level and Distribution of DNA Methylation
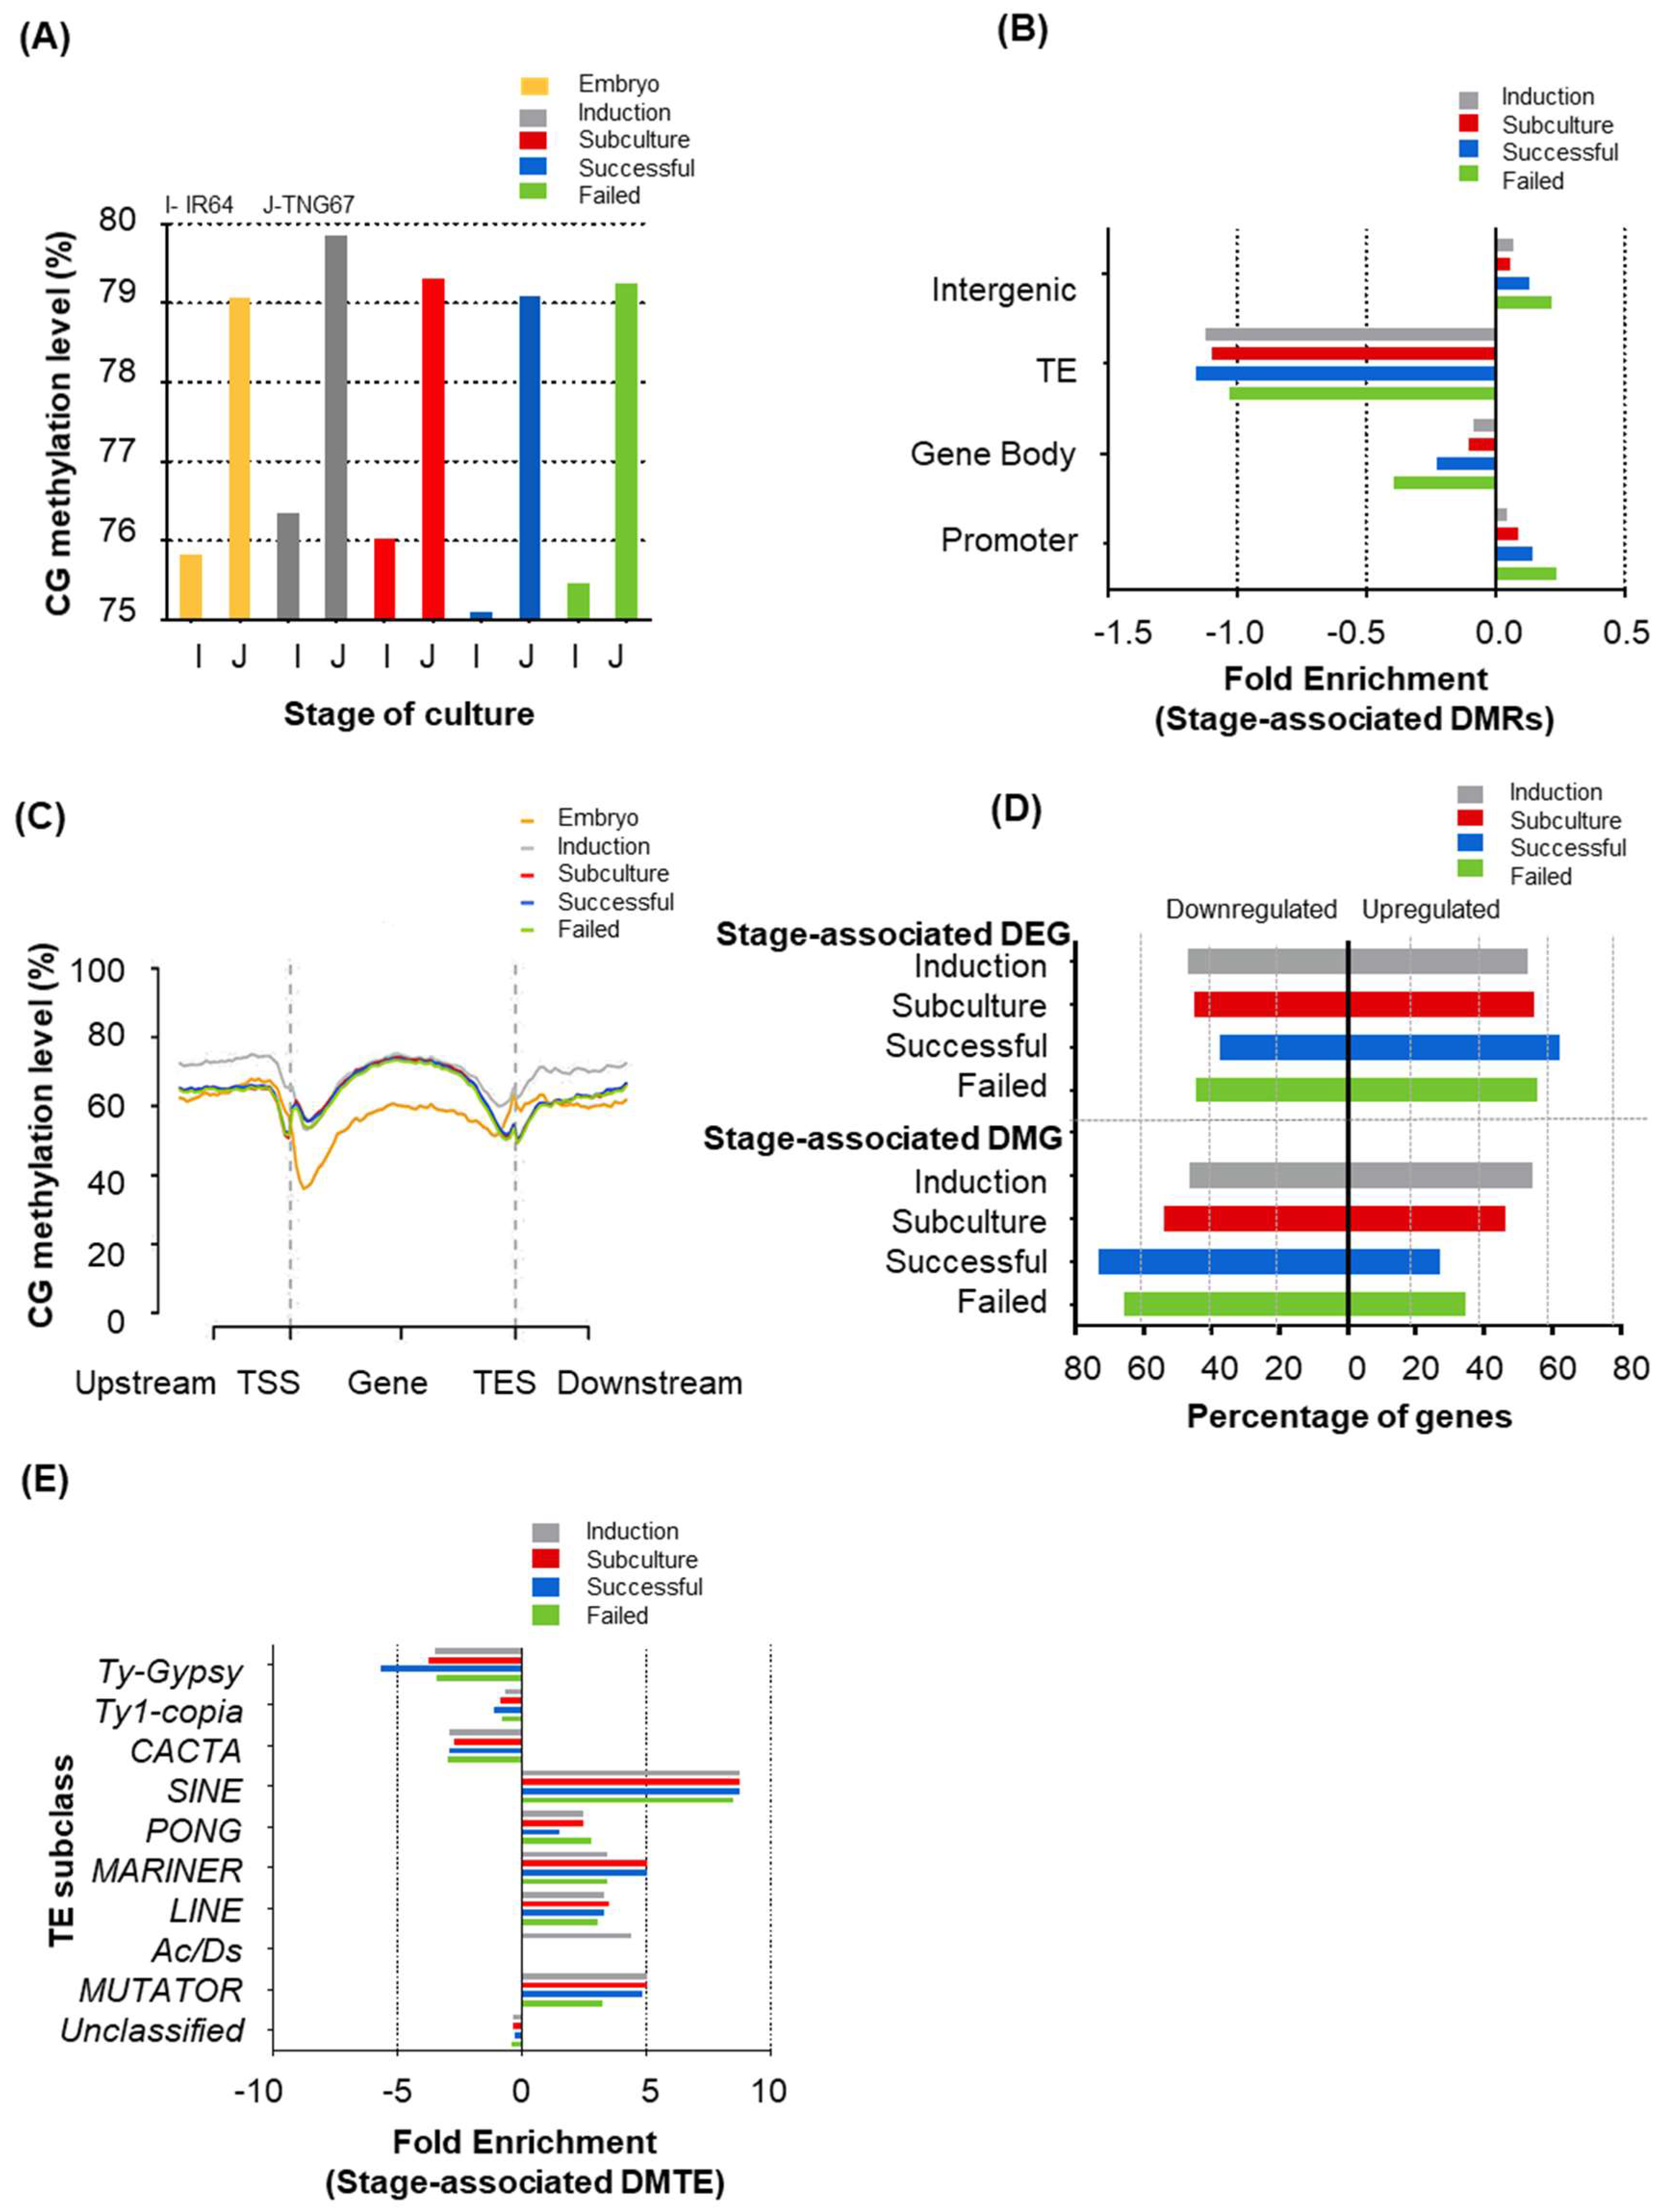
Global methylation levels, in all contexts, increased as the embryo developed to the callus and declined upon subculture and regeneration (Figure 3A and Figure S2A). This decline was more prominent in IR64 than TNG67 and relatively greater in the non-CG context (Table S2). We specifically examined the genomic regions with significant changes in DNA methylation between the embryonic stage (T0) and later stages, i.e., stage-associated differentially methylated regions (DMRs) (Table S3). The DMR count reiterates the global trend and declines from induction to subculture and regeneration. These DMRs were enriched at promoter and intergenic regions and depleted in transposable elements (TEs) and gene bodies (Figure 3B). As the embryo developed into the callus, CG methylation increased in gene bodies and flanking regions, decreased upon sub-culture and remained unchanged until regeneration (Figure 3C). Non-CG methylation was greater outside the gene bodies but decreased as the stages progressed (Figure S2B,C).
We identified the genes associated with the stage-associated DMRs, i.e., differentially methylated genes (DMGs). Following the global trend, the numbers of DMG revealed an increase upon induction (IR64: 2167, TNG67: 2589) and a decline upon sub-culture and regeneration (IR64: 1975, TNG67: 1717) (Table S4). Together with the global expression profiles, we identified stage-associated differentially expressed genes (DEGs) (Table S5). As the induced callus regenerated, there was an increase in upregulated genes (8% in IR64 and 6% in TNG67, see Figure 3D and Table S4), also highlighting the inverse relationship between DNA methylation and gene expression.
2.4. Stage-Associated Hotspots for Methylation Changes
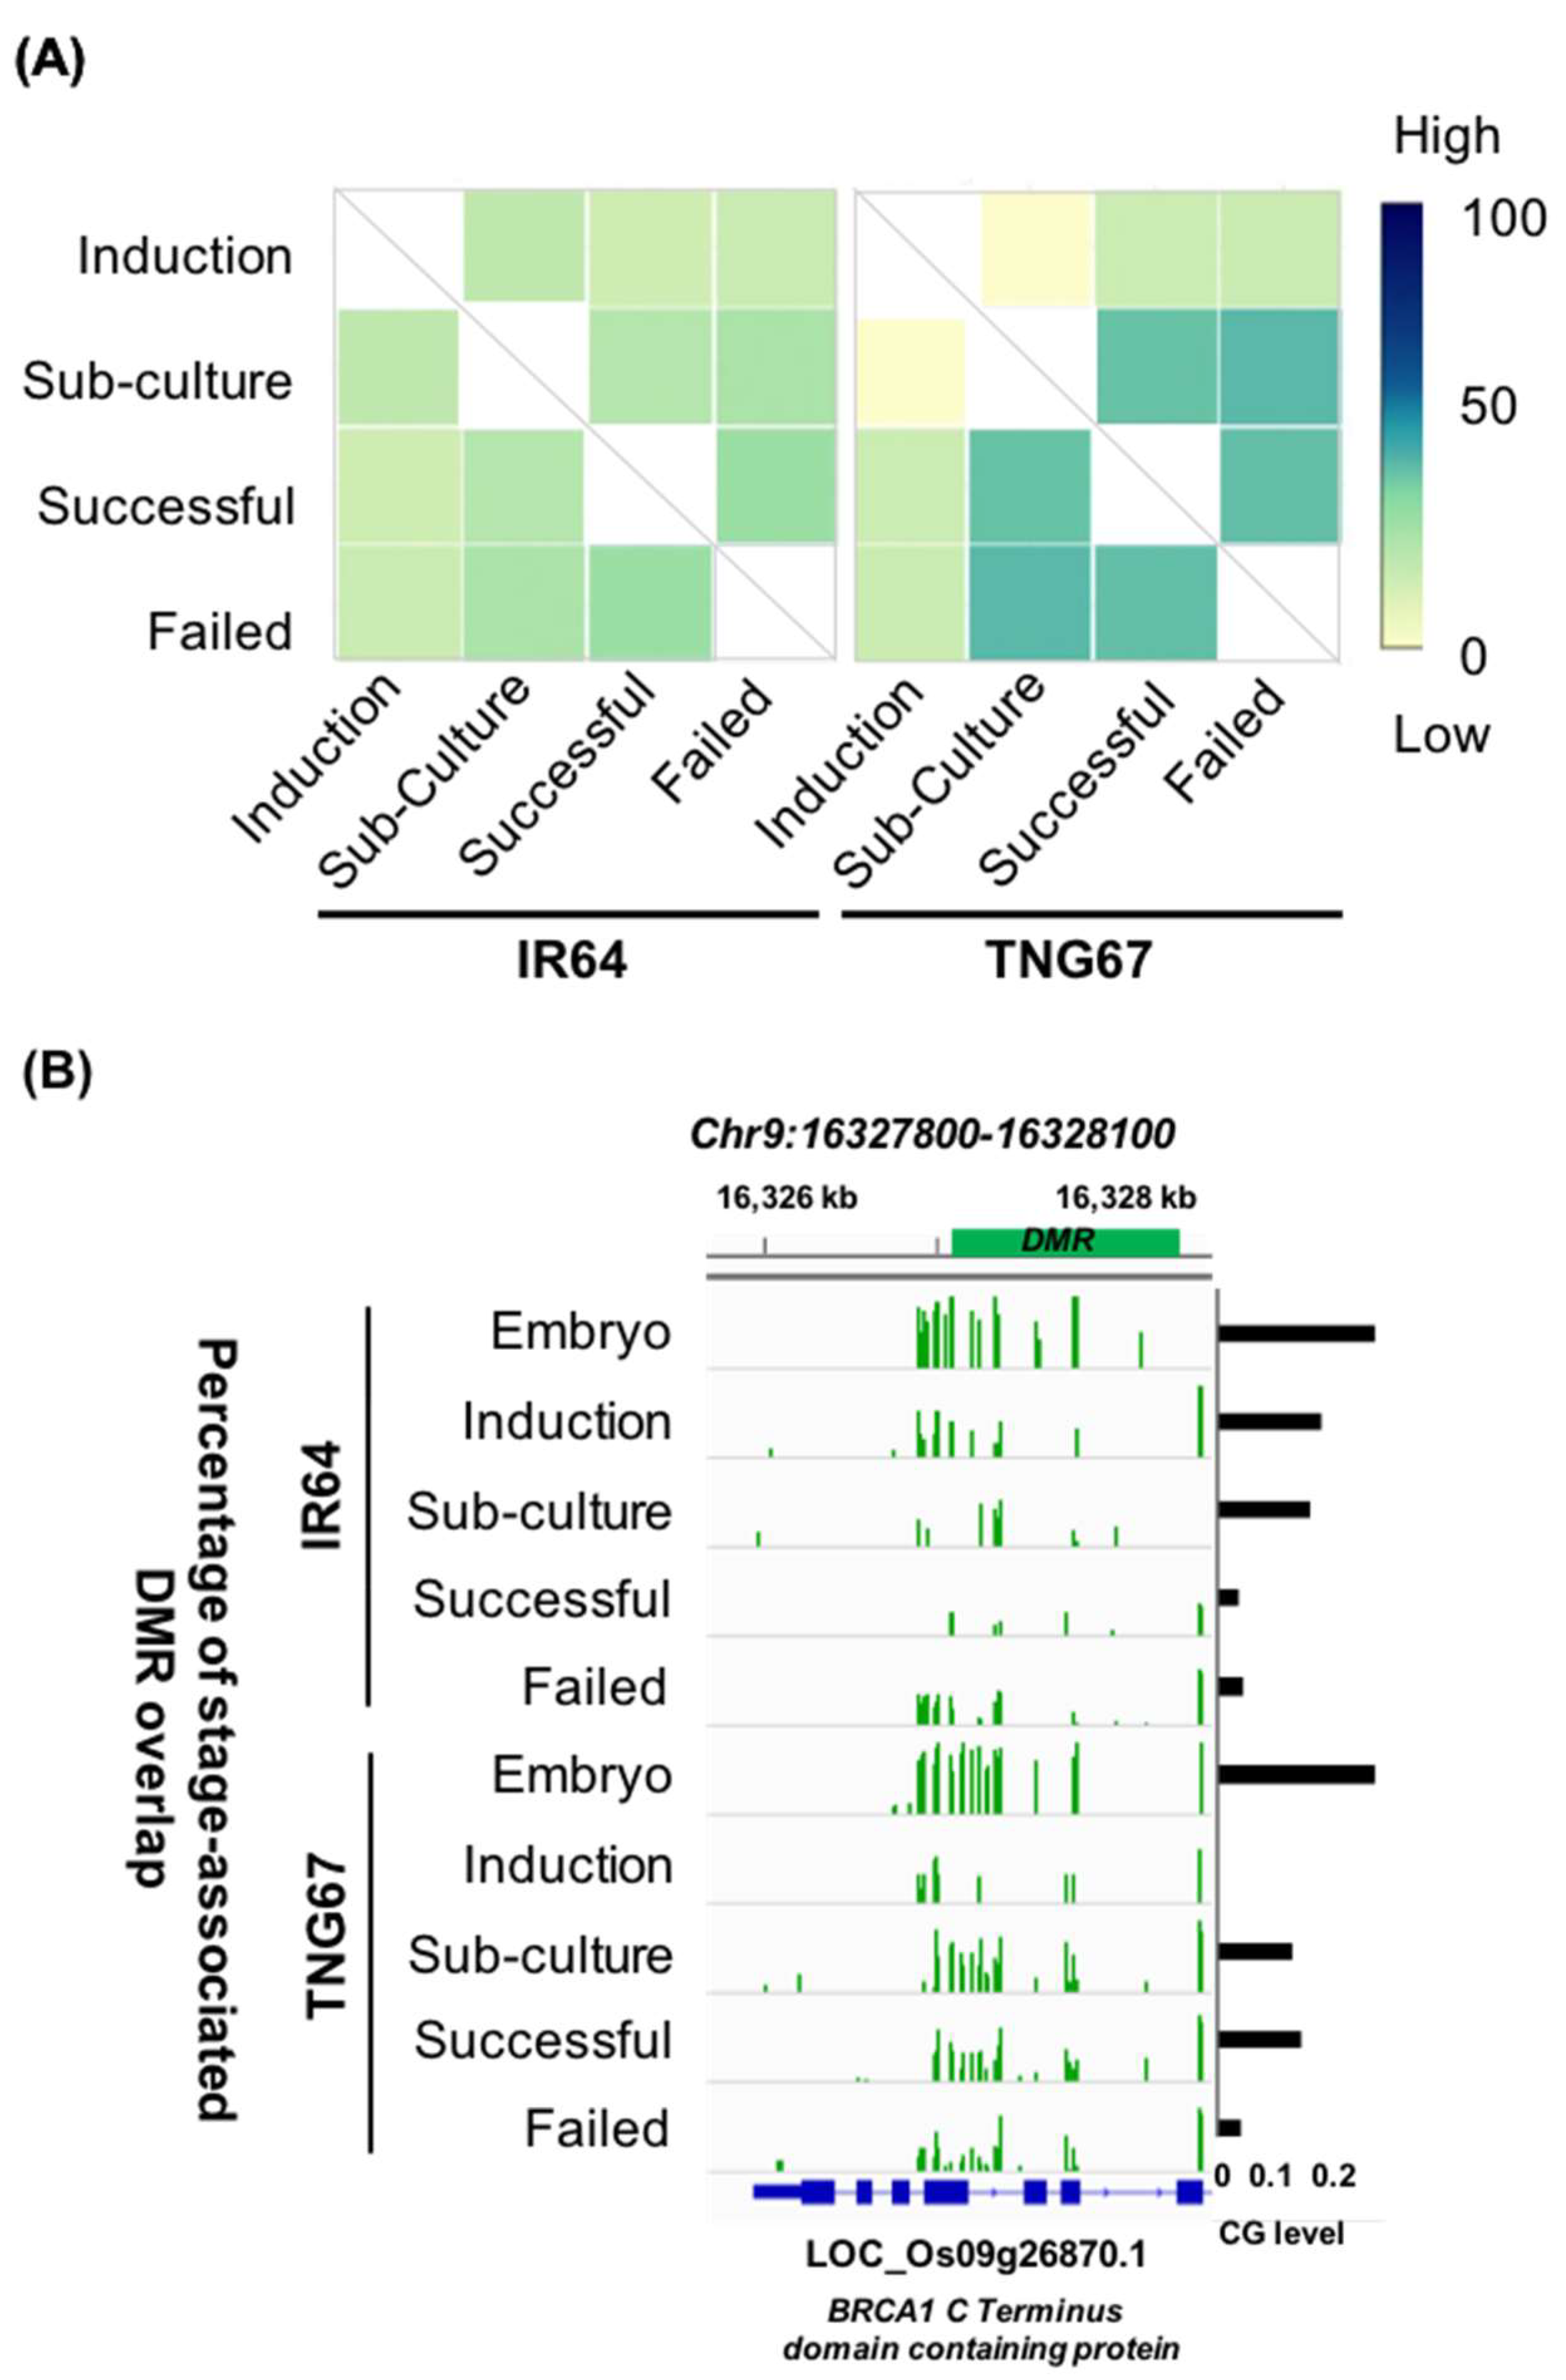
In a previous study, DNA hypomethylation in regenerants was shown to stochastically affect individual regenerants differently, and certain sites in the genome were more susceptible to DNA methylation losses [40]. Throughout tissue culture, we observed that the locations of stage-associated DMRs were primarily random; the percentage overlaps of DMRs during culture were higher between the later stages than in the earlier stages in both cultivars. We observed less overlap (indica: 15%, japonica: 16.5%) between induction and regeneration and greater overlap (indica: 22.1%; japonica: 39.2%) between subculture and regeneration. A greater overlap of DMRs between later stages suggests that certain regions are consistently targeted for methylation changes (Figure 4A). For example, a hotspot at chromosome 9 (Figure 4B) is found to overlap with a BRCA1 C terminal domain-containing protein gene involved in DNA repair, regulation of transcription, translation and cell division.
2.5. Stage Differently Impacts TE Methylation in IR64 and TNG67
We observed stage-related differences in the methylation distribution on TEs. The metaplots of TE methylation show higher CHG methylation on the TE bodies than on the flanks in IR64 and TNG67. In IR64, CHG methylation on and around the TE decreased as the embryo developed to the callus and regenerated (Figure S2D). In TNG67, TE methylation increased upon induction but decreased upon subculture and remained decreased upon regeneration (Figure S2E). We further identified stage-associated differentially methylated TEs from a total of 12,916 TEs. We observed a 45% increase in CHG-DMTEs in IR64 upon regeneration, unlike in TNG67, where a 4.3% decrease in CHG-DMTEs was observed (Table S6). The stage of culture had different effects on TE methylation in the two rice cultivars. We assessed the enrichment of TE families to determine whether methylation changes in TEs are random or targeted to specific transposons during culture. The enriched subclasses of TEs include SINE, PONG, MARINER, LINE and MUTATOR (Figure 3E). Among the subclasses, we observed a 10-fold enrichment of short interspersed nuclear elements (SINEs), which are widely reported in stress and disease conditions in both plants and animals [43].
2.6. Cultivar-Associated Impact during Culture
IR64 and TNG67 showed different regeneration abilities. IR64 had a higher growth rate in the first three weeks of culture than TNG67, but with the change to regeneration medium, the growth rate of IR64 declined (Figure S1A). The cultivar-specific divide was evident in the methylome and transcriptomes (Figure 2B,D). Overall TNG67 was approximately 4% more methylated than IR64 (Figure 3A, Table S2). At the promoter regions, the contrasting methylation patterns in IR64 and TNG67 suggest that the same promoters may indicate different methylation status (Figure S3A). We observed that cultivar-associated DMRs (Table S3) between corresponding stages of IR64 and TNG67 are enriched in promoter and intergenic regions (Figure S4A). Consistent with the global trend, the DMR count increased upon induction from 16,497 to 20,480 and subsequently decreased to 12,388 upon regeneration. To determine whether the same regions are targeted, we characterized the potential overlap between cultivar-associated DMRs across the stages. A significant (hypergeometric, p < 0.001) overlap of cultivar-associated DMRs between consecutive stages suggests that these hotspots are likely genetically associated.
We constructed a heatmap based on the differences in methylation between the two rice cultivars at the same stage (Figure 5A). Throughout culture, there were regions consistently hypermethylated in IR64 (green) or TNG67 (red). Alternatively, there were regions showing switching patterns at every stage (within the yellow box). The regions that associate cultivar-related differences with stage-related changes are likely responsible for the differential response of the two rice cultivars in culture.
We identified cultivar-associated DEGs after comparing the same stages of IR64 and TNG67 (Figure S4B, Table S4). In the last stage of successful regeneration, 4741 DEGs were identified between IR64 and TNG67, and these DEGs were enriched in the following functions: response to stimulus, stress response, DNA binding, and transcriptional regulation (Figure 5B).
From each stage, we identified approximately 10,000 cultivar-associated DMGs (Table S4). We specifically looked at only the cultivar-associated DEGs that are also differentially methylated at all stages (Table S4). For example, we examined the DEGs and DMGs between the successful regenerants of TNG67 and IR64 and identified 848 overlapping genes (Figure S4C). These genes are largely associated with the stress response and response to stimulus. Finally, we determined whether genetic differences affect the differential expression of genes between the two cultivars. We observed that the SNP density in cultivar-associated DEGs is significantly higher (Tables S7 and S8), suggesting that differential expression may be associated with genetic differences between IR64 and TNG67.
2.7. Regulation of Stress-Responsive Genes by DNA Methylation May Impart Resilience to TNG67
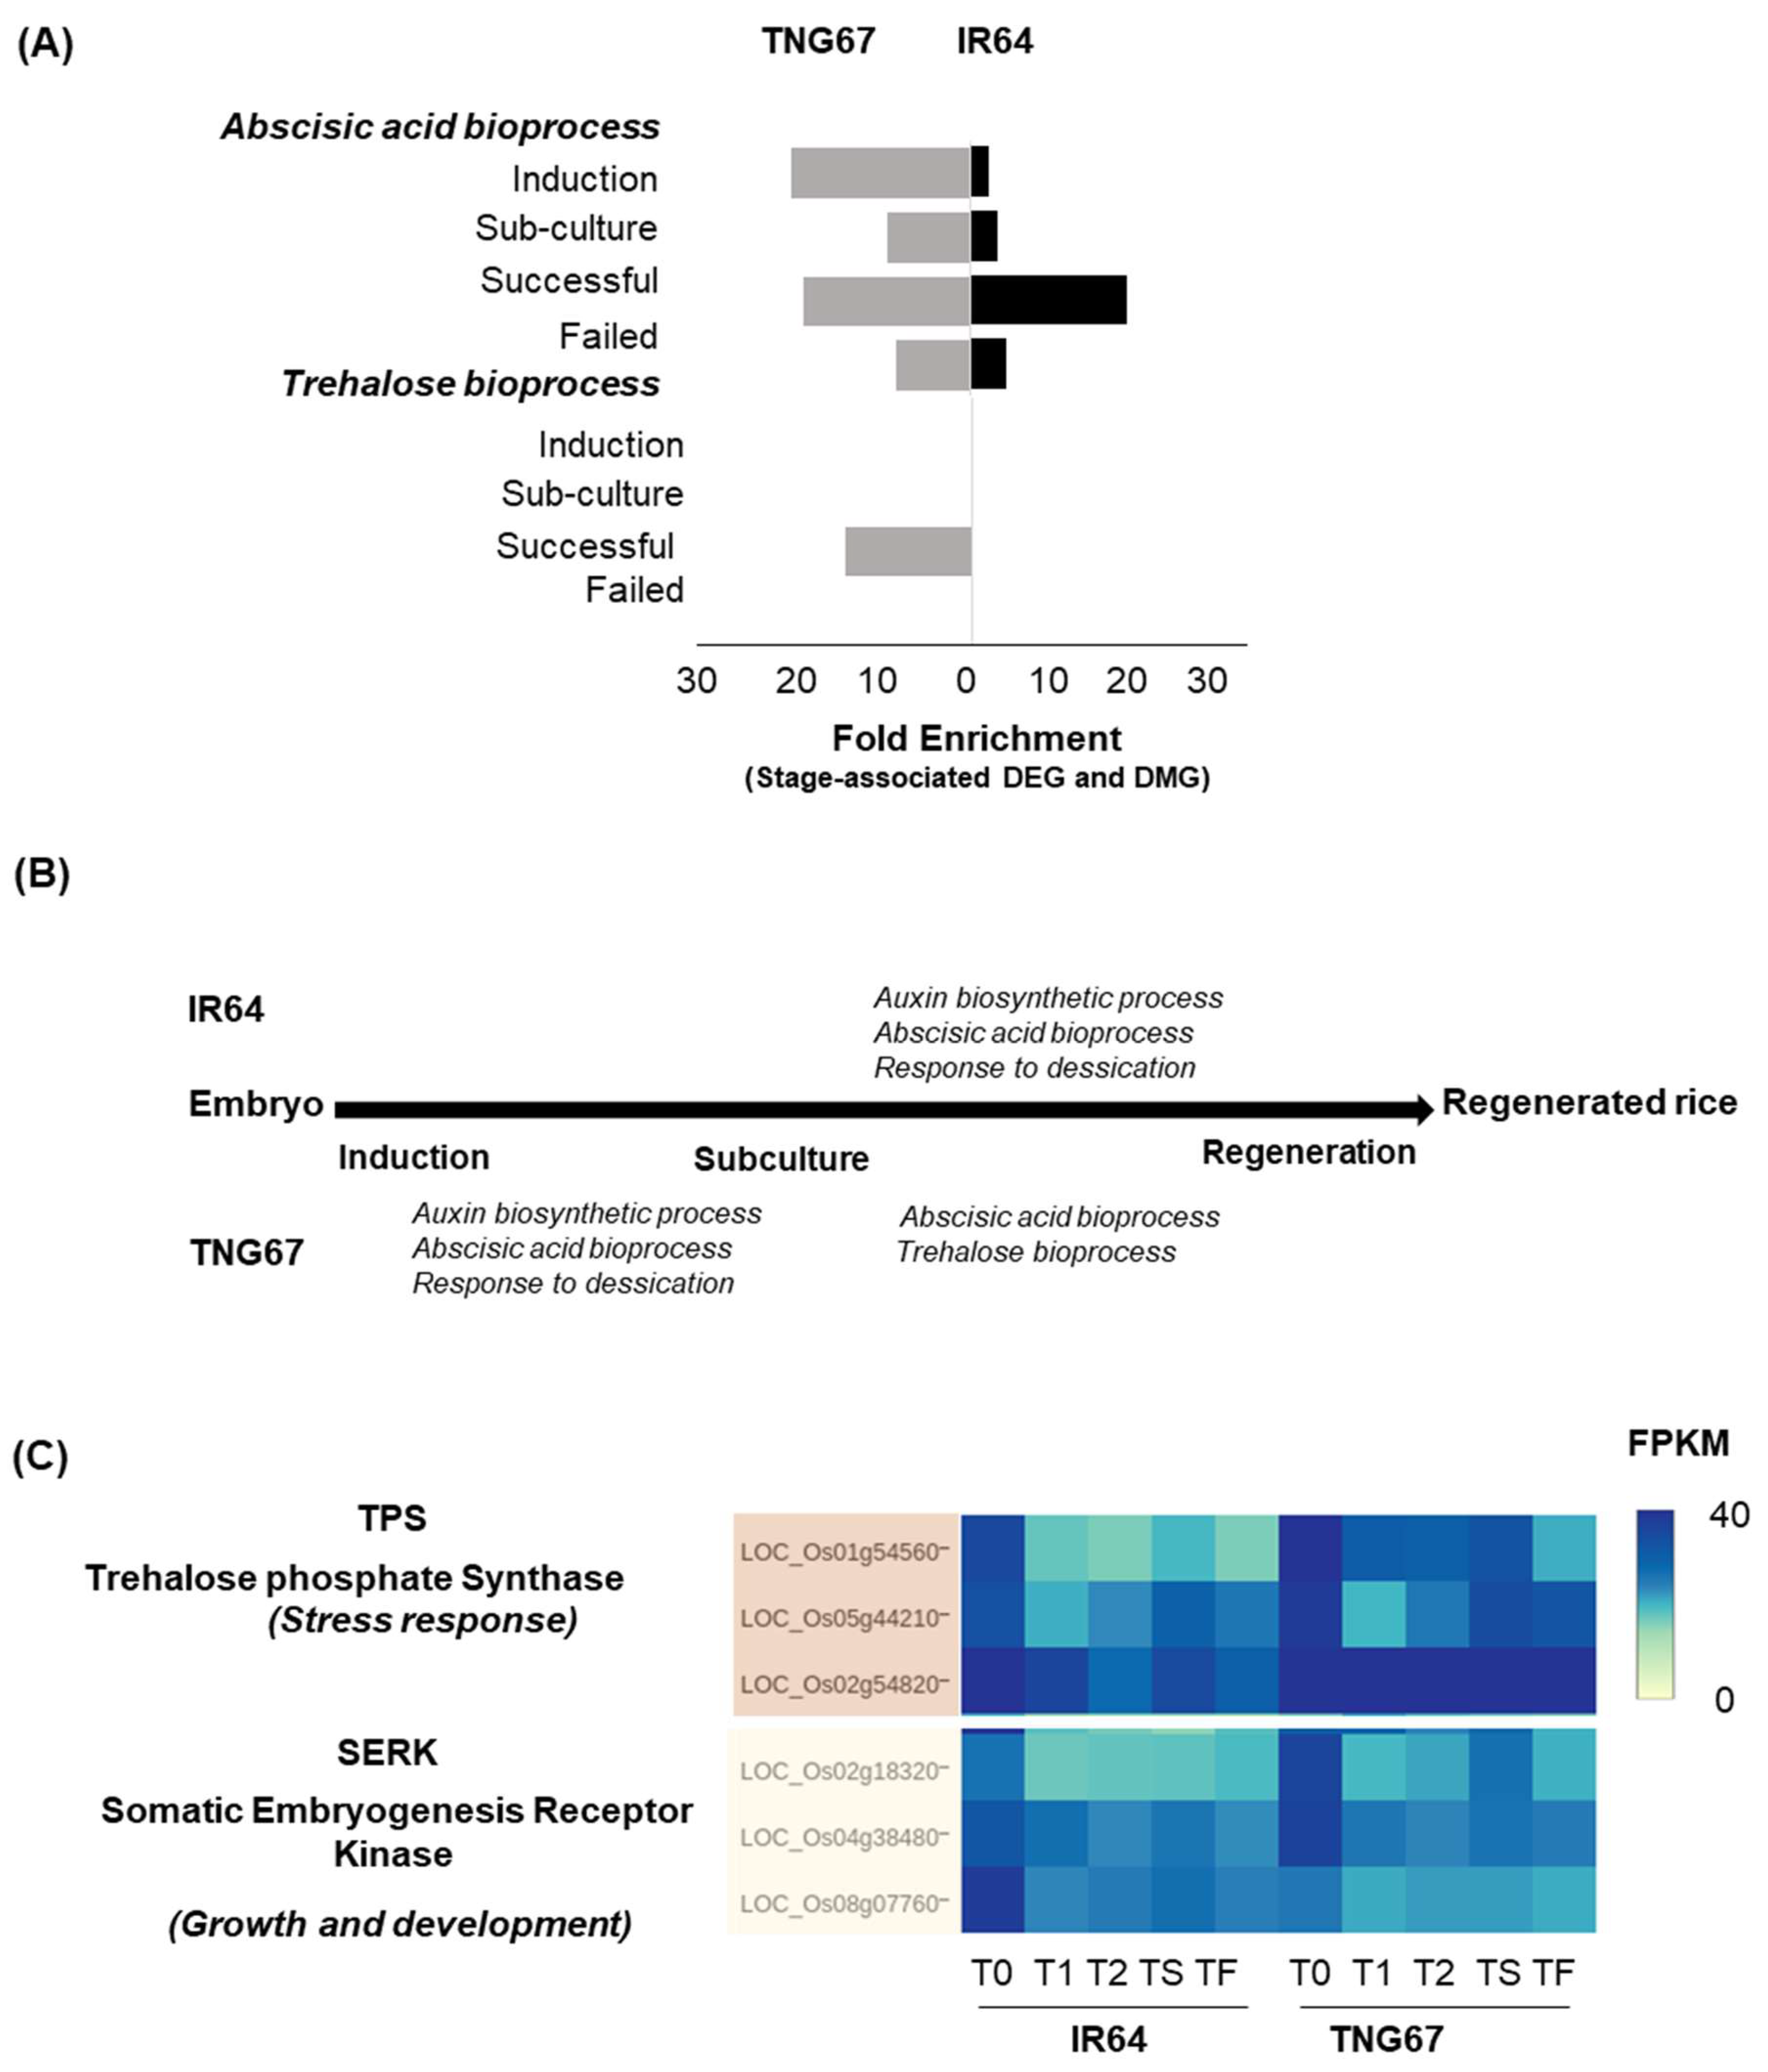
We identified stage-associated DEGs and DMGs and conducted gene ontology (GO) enrichment analysis. The stage-associated DEGs were associated with carbohydrate metabolism, stress response, transcription regulation or cellular activities essential for growth, development and differentiation of the callus. Among the enriched processes, the stress response pathways emerged differently in IR64 and TNG67. Specifically, auxin biosynthesis, abscisic acid biosynthesis, and response to dessication emerged upon induction in TNG67 (Figure 6A,B). Upon regeneration, the trehalose bioprocess and the abscisic acid pathway emerged in the successful TNG67 regenerants. In IR64, such stress response processes only emerged upon regeneration. We infer that during callus development, the early emergence of the stress-tolerant process in TNG67 (Figure 6B,C and Figure S5) likely makes these plants more resilient to the impact of media change than IR64. Among these stress response processes (Figure S5A–D), trehalose imparts stress tolerance in plants [44]. The DNA methylation level at the trehalose-5 phosphate synthase locus decreases post-subculture in TNG67, while the expression of this enzyme increases. The trehalose bioprocess further mediates survival, unlike in IR64, where such preparatory stress-tolerant processes are not evident at the induction stage. IR64, however, showed higher expression of growth- and development-related genes (Figure 6C), which explains the fast growth rate of this plant during culture.
In summary, we report the stage- and cultivar-associated impacts of tissue culture on the methylome and transcriptome. We observed that DNA methylation increases with induction and declines upon regeneration both globally and at the gene level. Such changes in the methylome during culture are largely random but may favor certain hotspots. We also observed that differential expression is associated with genetic differences between the two rice cultivars. Based on these findings, we hypothesized that the differential epigenetic regulation of genes associated with, for example, stress responses and responses to biotic/abiotic stimuli, growth and development coupled with the genetic differences between IR64 and TNG67 are likely responsible for the differential regeneration efficiencies in rice cultivars.
3. Discussion
3.1. Modulation of DNA Methylation in Culture Is Crucial to Regeneration Outcome
DNA methylation increases upon callus induction and decreases upon regeneration both globally and at the gene level in both IR64 and TNG67. This observation is consistent with a previous report on Populus trichocarpa [41]. High levels of DNA methylation increase induction in Coffea canephora [45] and embryogenic cell formation in Arabidopsis T87 [46]. The MeDIP-seq profiles of maize [19,47] and WGBS profiles of regenerated rice [40] show a similar decrease in methylation upon regeneration. The modulation in DNA methylation may signify its role in re-differentiation, where hormone ratios determine organ identity in regeneration [48]. The initial distribution of auxin and cytokinin differentiates regeneration in vitro from meristem initiation in planta [49,50]. The increase in methylation may reflect the reacquisition of cell proliferative competence during callus induction under the exogenous supply of the growth regulator auxin [51]. An intermediate level of auxin-cytokinin promotes callus induction in culture, while a high ratio promotes regeneration [52], and auxins reversibly decrease DNA methylation [53]. A similar trend has been reported in carrot tissues, where hypermethylation marks callus induction, and as the callus re-differentiates, methylation decreases [54]. The increase in genome methylation may be necessary to disorganize an ongoing cell program and facilitate the dedifferentiation process [54]. DNA methylation in failed regenerants remains almost the same as that of the sub-cultured calli both globally and at the gene level. The retained methylation potential impedes the transition from a dedifferentiated to re-differentiated state. The loss of methylation post-subculture is critical to the success of regeneration.
The transition from a dedifferentiated to re-differentiated state involves both epigenetic processes and chromatin dynamics [55,56]. Plant cells readily switch cell fate in response to extrinsic signals, such as hormones in culture [57]. In a dedifferentiated state, the cell is capable of the rapid exchange of chromatin-associated proteins, such as histones, triggering rapid changes in gene expression [58]. Birnbaum and Roudier implicate chromatin as the regulator of “cell-fate” during regeneration from callus. In this review, Methyltransferase 1 (MET1), which mediates DNA methylation at CG sites, was indicated as critical to this transition [59]. MET1 mutants (met1) show early activation of the WUSCHEL (WUS) gene, which is necessary to maintain a dedifferentiated state. WUS is activated early during callus formation in met1 compared with wild-type. Consistent with this observation, bisulfite-sequencing profiles show lower methylation at the WUS locus in the mutant (Li, Liu, Cheng, Su, Han, Zhang, & Zhang, 2011) [60]. The met1 plants also express mis-regulated Auxin Response Factor 3 (ARF3), validating the role of epigenetic mechanisms and chromatin dynamics in hormone regulation and cell fate determination.
The locations of stage-associated DMRs suggest that DNA methylation changes are largely random during culture. A few regions in the genome are consistent targets for methylation changes (Figure 4A,B). This observation is consistent with a previous report in regenerated rice, where the loss of methylation was stochastically induced during tissue culture, and certain loci were found to be particularly susceptible to epigenetic changes in response to culture [40]. Additionally, several cell lines of rye share methylation changes at the same locus, highlighting the non-random behavior of methylation changes in culture [61]. DNA methylation changes during culture are largely random, except in a few genomic regions.
3.2. Differential Adaptive Response of Cultivars in Culture
In the present study, the successful regenerants of TNG67 had lower CG methylation levels than the failed regenerants (Figure 3A). Further analysis showed both differential methylation and expression (compared with the embryonic stage). Stress response genes emerged earlier in TNG67 than in IR64, where these genes emerged only at the regeneration stage. The expression of these genes potentially helps the TNG67 calli to better cope with stress, manifesting in higher regeneration efficiency. DNA demethylation is responsible for abiotic stress tolerance [62,63,64]. Abiotic stress-induced demethylation may result in chromatin remodeling, thereby activating transcription [65]. Demethylation may lead to the up-regulation of stress-related genes in culture, providing an adaptive advantage to the callus [66]. Thus, the success of regeneration may be associated with a hypomethylated state at loci related to stress tolerance. A partial validation of this hypothesis can be observed in the 5-azaC dose response assay, in which demethylation has a positive impact on the regeneration of IR64 calli, likely reflecting the demethylation of stress-responsive genes, and IR64 calli could survive better, even when exposed to 50 µM treatment, unlike TNG67. In the other treatment groups, namely, those exposed to 25 and 50 µM, IR64 and TNG67 showed almost comparable regeneration efficiencies. However, the direct association of these genes with the improvement of regeneration efficiencies warrants further investigation.
3.3. Integration of Stage- and Cultivar-Associated Changes Determines Regeneration Outcome
Notably, higher global methylation levels (Table S4) and hyper-DMG counts (Table S2) were observed in failed regenerants (IR64: 40.6%; TNG67: 34.2%) than in their successful (IR64: 23.2%; TNG67: 26.9%) counterparts. Furthermore, failed regenerants had a greater overlap (9.1% in IR64, 11% in TNG67) of DMRs in the early stages than the successful regenerants (8.2% in IR64 and 10% in TNG67), suggesting that methylation post-subculture or induction is retained. However, the gene expression in the successful regenerants of both cultivars remained similar to that in the induced calli, unlike the failed calli (Figure 2D), implying that the change in gene expression after induction is associated with the regeneration outcome. The retained methylation post-subculture apparently impedes the transition to a regenerant through the potential delay or failure of gene expression, which is essential for regeneration.
Amongst the differential methylated status genes, there are structural, hormone responsive and stress induced genes as expected. Many genes remain functionally unannotated. In the list of stage associated DMG, several genes draw our attention such as HVA22. Base on the MSU rice genome annotation database, there are 16 HVA22 genes in rice genome. Three of them have shown dynamic methylation change at gene body, one at promoter region and another at both promoter region and gene body as show in Table S9. HVA22 was found inhibited the GA-induced cell programming death in aleurone cell while overexpressed in barley seed (ref). However, the role of HVA22 in rice callus induction and regeneration process remain large unexplored. In addition, we found a group of genes related to DNA methylation, which encode methyl-CpG binding domain containing protein. By comparison the methylome of individual stage and the embryo or between two rice varieties, these genes showed diverse level of methylation in either promoter region or gene body (LOC_Os04g19684 and LOC_Os04g11510 varied at different stage between two varieties at promoter region, LOC_Os04g19684 varied in indica regeneration process at promoter region, LOC_Os05g33550 higher methylated at gene body in indica after callus induction). While it may be ambiguous before further experimental verification of these genes in tissue culture system to address the specific role of each candidate gene, our findings might provide valuable information for future study to unravel the molecular mechanism underlying the genotype-dependent regeneration scenario.
4. Materials and Methods
4.1. Callus Induction from Rice Seeds
Dehusked seeds of TNG67 and IR64 were rinsed with 70% ethanol for 1 min and briefly washed with distilled water, followed by soaking in 2.5% sodium hypochlorite solution (NaClO; The Clorox Co., Oakland, CA, USA) containing 0.2% Tween 20 (Sigma-Aldrich, St. Louis, MO, USA) for 15 min. After surface sterilization, the seeds were washed several times with sterile water and subsequently sown on N6D medium (N6 inorganic salt, Gamborg B5 vitamins, 3% sucrose, 2.5 mg/L 2,4-D, pH 5.8, 0.4% gelrite) for callus induction. The callus samples were collected at different time points during the culture period, starting at the embryonic stage. N6D medium was used for the callus induction of both cultivars, and the induced calli were subcultured in fresh N6D medium every other week.
4.2. Regeneration of Embryogenic Callus
Embryogenic calli were transferred into REIII M2 medium (MS salt with vitamin, 1 g/L casein hydrolysate, 3% sucrose, 3% sorbitol, 0.02 mg/L NAA, 2 mg/L BAP, pH 5.8, 0.4% gelrite) and cultured for 11–32 days under constant light at 28 °C in a growth chamber. Once green spots appeared, indicating the differentiation of somatic embryos, the calli were collected as successfully regenerated (IS for IR64, JS for TNG67), and those that turned brown were collected as failed (IF for IR64 and JF for TNG67).
4.3. Morphological Evaluation of Callus Culture
Morphological examination was used as a measure of callus health. Macroscopic images were taken under consistent condition for both cultivars at stage 0, I, II and S/F after removed seed coat, I week, 3 weeks, 6 weeks and 12 weeks culture respectively. These images were then evaluated for red, green, blue, hue, saturation and brightness followed by processes to obtain values of Hue (H), Saturation (S) and Value (V). The value of the Dark Green Color Index (DGCI) of each image was calculated by averaging the transformed HSV values: Higher the value more is the color related to green, marking the health of the callus. The health of each genotype was indicated by the visual ratings of eighty-two strains under controlled culture conditions.
4.4. 5-Azacytidine Demethylation Assay
Sterilized mature seeds of IR64 and TNG67 were used in the present study. Callus induction, maintenance and plant regeneration were performed in medium containing 25 and 50 µM concentrations of 5-azaC a demethylation agent. Untreated control groups were also included. The percentage of callus formed was calculated for all control and treatment groups. Two weeks later, the treated calli were used for regeneration. The regeneration efficiency was calculated using the following formula [67]:
Percentage of callus formed = (No. of calli formed/No. of incubated seeds) × 100%;
Regeneration efficiency (%) = (No. of regenerated calli/No. of incubated seeds) × 100%.
We calculated the percentage of callus formed and regeneration efficiency (%) for the control and treatment groups of both TNG67 and IR64.
4.5. RNA-Seq Library Construction and Data Processing
Total RNA was extracted and purified using the RNeasy Plant mini kit, followed by on-column DNase1 digestion (Qiagen, Hilden, Germany) according to the manufacturer’s instructions. RNA integrity was verified using a bioanalyzer, which yields RNA integrity number (RIN) scores of >7. Quality-tested RNA samples were quantified using the Qubit RNA HS Assay kit (Life Technologies, Carlsbad, CA, USA), and 3 µg of RNA was utilized as input for library construction. Libraries were prepared using the Illumina TruSeq RNA Sample Preparation kit according to the manufacturer’s instructions and sequenced using a HiSeq 2000 System (Illumina, San Diego, CA, USA). Reads were aligned to a reference genome (Os-Nipponbare-Reference-IRGSP-1.0/MSU version 7) using Tophat [68], with up to two mismatches allowed and only the unique alignments retained. The quality of alignments was assessed using FastQC [69]. Only reads mapping entirely to a single gene or TE were kept. Expression levels were computed as fragments per kilobase of transcript per million mapped reads (FPKM). We identified differentially expressed genes (DEGs) using Tophat [68]. The genes showing at least a four-fold change with an adjusted p-value < 0.05 were identified as DEGs. We conducted gene ontology (GO) enrichment analysis of the DEGs using Blast2GO [70] and AgriGo [71].
4.6. Library Preparation for Whole-Genome Bisulfite Sequencing (WGBS)
Rice calli were ground using a mortar and pestle in liquid nitrogen for extraction and purification of genomic DNA (gDNA) using the DNeasy Plant Mini Kit (QIAGEN, Hilden, Germany). The DNA samples were sheared through sonication to generate fragments ranging from 150 to 300 bp in size. Bisulfite treatment was performed using the EpiTect Bisulfite conversion kit (QIAGEN) according to the manufacturer’s instructions. Premethylated adapters were ligated to bisulfite-converted DNA, followed by PCR amplification prior to sequencing on an Illumina HiSeq 2000 sequencer. Reads were aligned to a reference genome (Os-Nipponbare-Reference-IRGSP-1.0/MSU version 7) using BS Seeker2 [72]. Genome-wide DNA methylation profiles were generated after determining the methylation levels for each cytosine in the genome. Bisulfite treatment converted unmethylated cytosines (Cs) to thymines (Ts) after PCR amplification, and the methylation level for each cytosine was estimated as #C/(#C+#T), where #C is the number of methylated reads and #T is the number of unmethylated reads.
4.7. Identifying Differentially Methylated Regions and Associated Genes
Regions in the genome with significant differential methylation levels were defined as differentially methylated regions (DMRs). Genes adjacent to these DMRs were considered differentially methylated genes. To qualify as a DMR, the region had to (1) show a difference of 80% in the mean methylation level between the two groups being compared, (2) have at least three cytosines for which methylation levels were observed in all relevant samples, and (3) have a z-score below a threshold. The selection of the z-score threshold was based on the false discovery rate estimated by comparing the real data with simulated methylomes as the control for false discovery rate (FDR) computation.
4.8. Estimating False Discovery Rate (FDR)
Simulated methylomes with the same read coverage per site as real samples were constructed to assess the false discovery rate (FDR) of the DMRs. For each CG site in each simulated sample, reads were simulated based on the average methylation level (Pm) from all real samples at that CG site. This simulation of reads was repeated for all the samples throughout the genome. The number of methylated reads (Cs) at a site of coverage n is a random sample from the binomial distribution B (n, Pm). Since the reads are simulated from the binomial distribution with the same average methylation levels as in the real samples, the differences in methylation patterns across genes, repeats, promoters, etc. are preserved. The simulated data had the same coverage as the real samples so the statistical power is not affected. The simulated methylomes should have no difference in methylation levels between the two comparison groups (i.e., no DMRs), since they are all selected using the same methylation frequency. Any DMRs (and the DMR-associated genes) identified from these simulated samples are thus considered false positives.
4.9. Estimation of Bisulfite Conversion Efficiency
To estimate bisulfite conversion efficiency, we spiked unmethylated lambda phage DNA into the target sample DNA library and used this mixture of DNA library for bisulfite conversion and then sequencing. Finally, we mapped the reads to the lambda phage reference genome. As lambda phage DNA has no methylated cytosines, we were able to estimate bisulfite conversion efficiency by computing methylated C in the alignments. In our methylomes, the bisulfite conversion efficiencies are all greater than 98% (Table S10).
5. Conclusions
We examined whether changes in DNA methylation during culture are associated with the differential regeneration efficiency in rice cultivars. We used two elite rice cultivars, IR64 and TNG67, which are commonly used for rice functional genomic studies. We demonstrated phenotypic variability in callus morphology as direct evidence of the differential impact of tissue culture in rice. Rice possesses a strong capacity to translate genetic variations to phenotypic variations under abiotic stress conditions, such as tissue culture [12]. Stable DNA methylation changes induce somaclones in regenerated wheat [73]. In sugarcane, disease-resistant somaclones are induced by demethylating agents, such as 5-azaC [29]. Similarly, somaclonal variations in maize [19,47], Arabidopsis [74], rice [40] and several plant species may result from changes in DNA methylation. Altering DNA methylation can generate somaclones, which may offer some economic benefit; however, somaclonal variations are inconsistent and non-reproducible. Moreover, there is a lack of understanding of the genetic and molecular basis of such variability in culture.
Several genome-wide methylation studies confirm DNA methylation changes in culture [19,40,66,75]. Accordingly, the present study introduces a stage-dependent paradigm, wherein we have identified genome-wide changes in the methylome and transcriptome of IR64 and TNG67, reflecting the stage of culture, cultivar-type and their interaction. Taken together, stage- and cultivar-associated changes indicate that the differential emergence of stress response, defense response, and metabolic process during culture may contribute to the differential regeneration efficiencies in IR64 and TNG67 rice. Such genes could be helpful in the early selection of good-quality calli without having to wait for the final outcome. Moreover, the genes highlighted in the present study could potentially be used in future investigations to improve regeneration efficiencies in rice.
Supplementary Materials
The following are available online at https://www.mdpi.com/2075-4655/2/3/14/s1, Figure S1: Callus morphology of IR64 and TNG67 during six-weeks of culture. (A) Area covered by the IR64 and TNG67 calli. (B) Regeneration efficiencies of IR64 and TNG67 calli in the presence of demethylating agent 5-azacytidine. The percentage indicates the regeneration efficiencies calculated from five plates of 15 seeds each in each experimental group. Regeneration efficiency (%) = (No. of regenerated calli/No. of incubated seeds) × 100). Figure S2: Global methylation level and its distribution at different time points. (A) Genome-wide DNA methylation levels in three contexts across all stages in IR64 and TNG67. (B) Metaplot of methylation on gene body of IR64. (C) Metaplot of methylation on gene body of TNG67. (D) Metaplot of methylation on transposons in IR64. (E) Metaplot of methylation on transposons in TNG67. Figure S3: DNA methylation at promoters and their association with gene expression. (A) DNA methylation levels at promoter regions during different time points of culture of IR64 and TNG67. (B) Integrated heatmap of DNA methylation on promoters and transcription in IR64 and TNG67. Figure S4: Cultivar-associated changes in IR64 and TNG67 at different time points. (A) Enrichment of cultivar-associated enrichment differentially methylated regions. (B) Count of differentially expressed genes (DEG) between same stages of IR64 and TNG67. (C) Venn diagram showing the genes which are both differentially expressed and differentially methylated between successful regenerants of IR64 and TNG67. Figure S5: DNA methylation and gene expression of stress response genes at different timepoints in IR64 and TNG67. (A) Comparison of expression and DNA methylation of trehalose 5 phosphate synthase gene (B) Comparison of expression and DNA methylation of abscisic acid stimulus response gene, (C) Comparison of expression and DNA methylation of abscisic acid biosynthetic process gene (D) inositol phosphate pathway-related gene. Table S1: Mapping statistics of IR64 and TNG67 libraries. Table S2: Global methylation levels in CG, CHG and CHH contexts from embryonic to regeneration stage in IR64 and TNG67. Table S3: Stage and cultivar-associated DMRs in IR64 and TNG67 during tissue culture stages. Table S4: Count of stage-associated and cultivar-associated DEGs and DMGs in IR64 and TNG67 rice. Table S5: Stage-associated and cultivar-associated differentially expressed genes in IR64 and TNG67 during tissue culture stages. Table S6: Percentage of differentially methylated transposable elements. Table S7: p-values from SNP analysis of DEGs between IR64 and TNG67. Table S8: SNP analysis of DEGs between TNG76 and IR64. Table S9: Dynamic DNA methylation of HVA22 genes during rice regeneration. Table S10: BS-conversion rates from WGBS data of IR64 and TNG67.
Author Contributions
P.-Y.C. conceived and designed the experiments, supervised the data analysis and revised the manuscript. M.G. and F.-M.H. interpreted and organized the data and drafted the manuscript. F.-M.H. contributed to the experimental design, sample collection and library preparation. A.A. and Y.-J.H. contributed to the RNA-seq and WGBS data analysis respectively. J.-L.L. conducted the callus morphology analysis. L.-Y.K. executed the tissue-culture experiments. All authors read and approved the final manuscript.
Funding
We are grateful to Academia Sinica and the Taiwan Ministry of Science and Technology (MOST-103-2313-B-001-003-MY3, MOST-104-2923-B-001-003-MY2 and MOST-103-2633-B-001-002) for financial support.
Acknowledgments
We thank Wen-Wei Liao, Yi-Ru Ting and Shih-Han Hsu for the morphology analysis of calli, and Kshitij Tandon and Ching-Yu Kuo for preliminary analysis of the RNA-seq and BS-seq data. We also thank Yue-Ie Hsing for critical comments on the manuscript.
Conflicts of Interest
The authors declare that the research is conducted in the absence of any commercial or financial relationships that could be construed as a potential conflict of interest.
Availability of Data and Materials
All sequencing data are deposited at the GEO repository under the accession number GSE82138.
Abbreviations
IR64: Indica rice 64; TNG67: Tainung 67; 5-aaC: 5-Azacytidine; WGBS: Whole Genome Bisulfite Sequencing; DEG: Differentially expressed genes; DMR: Differentially methylated regions; DMG: Differentially methylated genes; FPKM: Fragments per kilobase of transcript per million mapped reads; PCA: Principal component analysis; GO: Gene Ontology.
References
- Krikorian, A.D.; Berquam, D.L. Plant cell and tissue cultures: The role of Haberlandt. In Plant Tissue Culture; Springer: Vienna, Austria, 2003. [Google Scholar]
- Bhat, S.R.; Srinivasan, S. Molecular and genetic analyses of transgenic plants: Considerations and approaches. Plant Sci. 2002, 163, 673–681. [Google Scholar] [CrossRef]
- Sun, Y.; Li, J.; Xia, L. Precise Genome Modification via Sequence-Specific Nucleases-Mediated Gene Targeting for Crop Improvement. Front. Plant Sci. 2016, 7, 1928. [Google Scholar] [CrossRef] [PubMed]
- Zhang, Y.; Liang, Z.; Zong, Y.; Wang, Y.; Liu, J.; Chen, K.; Qiu, J.L.; Gao, C. Efficient and transgene-free genome editing in wheat through transient expression of CRISPR/Cas9 DNA or RNA. Nat. Commun. 2016, 7, 12617. [Google Scholar] [CrossRef] [PubMed] [Green Version]
- Coulter, J. Regeneration in Plants. Biblic. World 1914, 43, 377–381. [Google Scholar] [CrossRef]
- Larkin, P.J.; Scowcroft, W.R. Somaclonal variation—A novel source of variability from cell cultures for plant improvement. Theor. Appl. Genet. 1981, 60, 197–214. [Google Scholar] [CrossRef] [PubMed]
- Litz, R.E.; Gray, D.J. Somatic embryogenesis for agricultural improvement. World J. Microbiol. Biotechnol. 1995, 11, 416–425. [Google Scholar] [CrossRef] [PubMed]
- Jain, S.M.; Brar, D.S.; Ahloowalia, B.S. Somaclonal Variations and Induced Mutations in Crop Improvement; Kluwer Academic Publishers: Dordrecht, The Netherlands, 1998. [Google Scholar]
- Nakajima, K. Biotechnology for crop improvement and production in Japan. In Proceedings of the Regional Expert Consultation on the Role of Biotechnology in Crop Production, Bangkok, Thailand, 18–21 June 1991. [Google Scholar]
- Ong-Abdullah, M.; Ordway, J.M.; Jiang, N.; Ooi, S.E.; Kok, S.Y.; Sarpan, N.; Azimi, N.; Hashim, A.T.; Ishak, Z.; Rosli, S.K.; et al. Loss of Karma transposon methylation underlies the mantled somaclonal variant of oil palm. Nature 2015, 525, 533–537. [Google Scholar] [CrossRef] [PubMed] [Green Version]
- Krishna, H.; Alizadeh, M.; Singh, D.; Singh, U.; Chauhan, N.; Eftekhari, M.; Sadh, R.K. Somaclonal variations and their applications in horticultural crops improvement. 3 Biotech 2016, 6, 54. [Google Scholar] [CrossRef] [PubMed]
- Zhang, D.; Wang, Z.; Wang, N.; Gao, Y.; Liu, Y.; Wu, Y.; Bai, Y.; Zhang, Z.; Lin, X.; Dong, Y.; et al. Tissue culture-induced heritable genomic variation in rice, and their phenotypic implications. PLoS ONE 2014, 9, e96879. [Google Scholar] [CrossRef] [PubMed]
- Neelakandan, A.K.; Wang, K. Recent progress in the understanding of tissue culture-induced genome level changes in plants and potential applications. Plant Cell Rep. 2012, 31, 597–620. [Google Scholar] [CrossRef] [PubMed]
- Abe, T.; Futsuhara, Y. Genotypic variability for callus formation and plant regeneration in rice (Oryza sativa L.). Theor. Appl. Genet. 1986, 72, 3–10. [Google Scholar] [CrossRef] [PubMed]
- Jaenisch, R.; Bird, A. Epigenetic regulation of gene expression: How the genome integrates intrinsic and environmental signals. Nat. Genet. 2003, 33, 245–254. [Google Scholar] [CrossRef] [PubMed]
- Abe, T.; Futsuhara, Y. Selection of higher regenerative callus and change in isozyme pattern in rice (Oryza sativa L.). Theor. Appl. Genet. 1989, 78, 648–652. [Google Scholar] [CrossRef] [PubMed]
- Wang, X.; Wu, R.; Lin, X.; Bai, Y.; Song, C.; Yu, X.; Xu, C.; Zhao, N.; Dong, Y.; Liu, B. Tissue culture-induced genetic and epigenetic alterations in rice pure-lines, F1 hybrids and polyploids. BMC Plant Biol. 2013, 13, 77. [Google Scholar] [CrossRef] [PubMed]
- Wei, F.J.; Kuang, L.Y.; Oung, H.M.; Cheng, S.Y.; Wu, H.P.; Huang, L.T.; Tseng, Y.T.; Chiou, W.Y.; Hsieh-Feng, V.; Chung, C.H.; et al. Somaclonal variation does not preclude the use of rice transformants for genetic screening. Plant J. 2016, 85, 648–659. [Google Scholar] [CrossRef] [PubMed]
- Stelpflug, S.C.; Eichten, S.R.; Hermanson, P.J.; Springer, N.M.; Kaeppler, S.M. Consistent and heritable alterations of DNA methylation are induced by tissue culture in maize. Genetics 2014, 198, 209–218. [Google Scholar] [CrossRef] [PubMed]
- Kaeppler, S.M.; Kaeppler, H.F.; Rhee, Y. Epigenetic aspects of somaclonal variation in plants. Plant Mol. Biol. 2000, 43, 179–188. [Google Scholar] [CrossRef] [PubMed]
- Kaeppler, S.M.; Phillips, R.L. Tissue culture-induced DNA methylation variation in maize. Proc. Natl. Acad. Sci. USA 1993, 90, 8773–8776. [Google Scholar] [CrossRef] [PubMed]
- Aydin, M.; Arslan, E.; Taspinar, M.S.; Karadayi, G.; Agar, G. Analyses of somaclonal variation in endosperm-supported mature embryo culture of rye (Secale cereale L.). Biotechnol. Biotechnol. Equip. 2016, 30, 1082–1089. [Google Scholar]
- Machczynska, J.; Zimny, J.; Bednarek, P.T. Tissue culture-induced genetic and epigenetic variation in triticale (x Triticosecale spp. Wittmack ex A. Camus 1927) regenerants. Plant Mol. Biol. 2015, 89, 279–292. [Google Scholar] [CrossRef] [PubMed]
- Gimenez, M.D.; Yanez-Santos, A.M.; Paz, R.C.; Quiroga, M.P.; Marfil, C.F.; Conci, V.C.; Garcia-Lampasona, S.C. Assessment of genetic and epigenetic changes in virus-free garlic (Allium sativum L.) plants obtained by meristem culture followed by in vitro propagation. Plant Cell Rep. 2016, 35, 129–141. [Google Scholar] [CrossRef] [PubMed]
- Sun, S.; Zhong, J.; Li, S.; Wang, X. Tissue culture-induced somaclonal variation of decreased pollen viability in torenia (Torenia fournieri Lind.). Bot. Stud. 2013, 54, 36. [Google Scholar] [CrossRef] [PubMed] [Green Version]
- Sano, H.; Youssefian, S. A novel ras-related rgp1 gene encoding a GTP-binding protein has reduced expression in 5-azacytidine-induced dwarf rice. Mol. Gen. Genet. 1991, 228, 227–232. [Google Scholar] [CrossRef] [PubMed]
- Kumpatla, S.P.; Hall, T.C.; Teng, W.; Buchholz, W.G.; Hall, T.C. Epigenetic transcriptional silencing and 5-azacytidine-mediated reactivation of a complex transgene in rice. Plant Physiol. 1997, 115, 361–373. [Google Scholar] [CrossRef] [PubMed] [Green Version]
- Kumpatla, S.P.; Hall, T.C. Longevity of 5-azacytidine-mediated gene expression and re-establishment of silencing in transgenic rice. Plant Mol. Biol. 1998, 38, 1113–1122. [Google Scholar] [CrossRef] [PubMed]
- Munsamy, A.; Rutherford, R.S.; Snyman, S.J.; Watt, M.P. 5-Azacytidine as a tool to induce somaclonal variants with useful traits in sugarcane (Saccharum spp.). Plant Biotechnol. Rep. 2013, 7, 489–502. [Google Scholar] [CrossRef]
- Lee, Y.H.; Lee, J.S.; Kim, S.Y.; Sohn, S.H.; Kim, D.Y.; Yoon, I.S. Effects of 5-azacytidine, a DNA methylation inhibitor, on embryogenic callus formation and shoot regeneration from rice mature seeds. J. Plant Biotechnol. 2008, 35, 133–140. [Google Scholar] [CrossRef] [Green Version]
- Sano, Y. The genic nature of gamete eliminator in rice. Genetics 1990, 125, 183–191. [Google Scholar] [PubMed]
- Muller, E.; Brown, P.T.; Hartke, S.; Lorz, H. DNA variation in tissue-culture-derived rice plants. Theor. Appl. Genet. 1990, 80, 673–679. [Google Scholar] [CrossRef] [PubMed]
- Fieldes, M.A. Heritable effects of 5-azacytidine treatments on the growth and development of flax (Linum usitatissimum) genotrophs and genotypes. Genome 1994, 37, 1–11. [Google Scholar] [CrossRef] [PubMed]
- Janousek, B.; Siroky, J.; Vyskot, B. Epigenetic control of sexual phenotype in a dioecious plant, Melandrium album. Mol. Gen. Genet. 1996, 250, 483–490. [Google Scholar] [CrossRef] [PubMed]
- Orlowska, R.; Machczynska, J.; Oleszczuk, S.; Zimny, J.; Bednarek, P.T. DNA methylation changes and TE activity induced in tissue cultures of barley (Hordeum vulgare L.). J. Biol. Res. (Thessalon) 2016, 23, 19. [Google Scholar] [CrossRef] [PubMed]
- Amado, L.; Abranches, R.; Neves, N.; Viegas, W. Development-dependent inheritance of 5-azacytidine-induced epimutations in triticale: Analysis of rDNA expression patterns. Chromosome Res. 1997, 5, 445–450. [Google Scholar] [CrossRef] [PubMed]
- Soppe, W.J.; Jacobsen, S.E.; Alonso-Blanco, C.; Jackson, J.P.; Kakutani, T.; Koornneef, M.; Peeters, A.J. The late flowering phenotype of fwa mutants is caused by gain-of-function epigenetic alleles of a homeodomain gene. Mol. Cell 2000, 6, 791–802. [Google Scholar] [CrossRef]
- Manning, K.; Tor, M.; Poole, M.; Hong, Y.; Thompson, A.J.; King, G.J.; Giovannoni, J.J.; Seymour, G.B. A naturally occurring epigenetic mutation in a gene encoding an SBP-box transcription factor inhibits tomato fruit ripening. Nat. Genet. 2006, 38, 948–952. [Google Scholar] [CrossRef] [PubMed]
- Miura, K.; Agetsuma, M.; Kitano, H.; Yoshimura, A.; Matsuoka, M.; Jacobsen, S.E.; Ashikari, M. A metastable DWARF1 epigenetic mutant affecting plant stature in rice. Proc. Natl. Acad. Sci. USA 2009, 106, 11218–11223. [Google Scholar] [CrossRef] [PubMed] [Green Version]
- Stroud, H.; Ding, B.; Simon, S.A.; Feng, S.; Bellizzi, M.; Pellegrini, M.; Wang, G.L.; Meyers, B.C.; Jacobsen, S.E. Plants regenerated from tissue culture contain stable epigenome changes in rice. Elife 2013, 2, e00354. [Google Scholar] [CrossRef] [PubMed]
- Vining, K.; Pomraning, K.R.; Wilhelm, L.J.; Ma, C.; Pellegrini, M.; Di, Y.; Mockler, T.C.; Freitag, M.; Strauss, S.H. Methylome reorganization during in vitro dedifferentiation and regeneration of Populus trichocarpa. BMC Plant Biol. 2013, 13, 92. [Google Scholar] [CrossRef] [PubMed]
- Ran, L.; Li, M.; Fan, H.X.; Jiang, J.J.; Wang, Y.P.; Sokolov, V. Epigenetic variation in the callus of Brassica napus under different inducement conditions. Russ. J. Genet. 2016, 52, 802–809. [Google Scholar] [CrossRef]
- Grandbastien, M.A. Activation of plant retrotransposons under stress conditions. Trends Plant Sci. 1998, 3, 181–187. [Google Scholar] [CrossRef]
- Garg, A.K.; Kim, J.K.; Owens, T.G.; Ranwala, A.P.; Choi, Y.D.; Kochian, L.V.; Wu, R.J. Trehalose accumulation in rice plants confers high tolerance levels to different abiotic stresses. Proc. Natl. Acad. Sci. USA 2002, 99, 15898–15903. [Google Scholar] [CrossRef] [PubMed] [Green Version]
- Nic-Can, G.I.; López-Torres, A.; Barredo-Pool, F.; Wrobel, K.; Loyola-Vargas, V.M.; Rojas-Herrera, R.; De-la-Peña, C. New insights into somatic embryogenesis: LEAFY COTYLEDON1, BABY BOOM1 and WUSCHEL-RELATED HOMEOBOX4 are epigenetically regulated in Coffea canephora. PLoS ONE 2013, 8, e72160. [Google Scholar] [CrossRef] [PubMed]
- Kwiatkowska, A.; Zebrowski, J.; Oklejewicz, B.; Czarnik, J.; Halibart-Puzio, J.; Wnuk, M. The age-dependent epigenetic and physiological changes in an Arabidopsis T87 cell suspension culture during long-term cultivation. Biochem. Biophys. Res. Commun. 2014, 447, 285–291. [Google Scholar] [CrossRef] [PubMed]
- Liu, H.; Ma, L.; Yang, X.; Zhang, L.; Zeng, X.; Xie, S.; Peng, H.; Gao, S.; Lin, H.; Pan, G.; et al. Integrative analysis of DNA methylation, mRNAs, and small RNAs during maize embryo dedifferentiation. BMC Plant Biol. 2017, 17, 105. [Google Scholar] [CrossRef] [PubMed]
- Sena, G.; Birnbaum, K.D. Built to rebuild: In search of organizing principles in plant regeneration. Curr. Opin. Genet. Dev. 2010, 20, 460–465. [Google Scholar] [CrossRef] [PubMed]
- Leibfried, A.; To, J.P.; Busch, W.; Stehling, S.; Kehle, A.; Demar, M.; Kieber, J.J.; Lohmann, J.U. WUSCHEL controls meristem function by direct regulation of cytokinin-inducible response regulators. Nature 2005, 438, 1172–1175. [Google Scholar] [CrossRef] [PubMed]
- Gordon, S.P.; Heisler, M.G.; Reddy, G.V.; Ohno, C.; Das, P.; Meyerowitz, E.M. Pattern formation during de novo assembly of the Arabidopsis shoot meristem. Development 2007, 134, 3539–3548. [Google Scholar] [CrossRef] [PubMed] [Green Version]
- Ikeuchi, M.; Sugimoto, K.; Iwase, A. Plant callus: Mechanisms of induction and repression. Plant Cell 2013, 25, 3159–3173. [Google Scholar] [CrossRef] [PubMed]
- Skoog, F.; Miller, C.O. Chemical regulation of growth and organ formation in plant tissues cultured in vitro. Symp. Soc. Exp. Biol. 1957, 11, 118–130. [Google Scholar] [PubMed]
- De Klerk, G.J.; Arnholdt-Schmitt, B.; Lieberei, R.; Neumann, K.H. Human genetics in the Crescent City. Nat. Genet. 2006, 38, 1221. [Google Scholar] [CrossRef]
- Arnholdt-Schmitt, B.; Herterich, S.; Neumann, K.H. Physiological aspects of genome variability in tissue culture. I. Growth phase-dependent differential DNA methylation of the carrot genome (Daucus carota L.) during primary culture. Theor. Appl. Genet. 1995, 91, 809–815. [Google Scholar] [CrossRef] [PubMed]
- Birnbaum, K.D.; Roudier, F. Epigenetic memory and cell fate reprogramming in plants. Regeneration 2017, 4, 15–20. [Google Scholar] [CrossRef] [PubMed] [Green Version]
- Zhao, J.; Morozova, N.; Williams, L.; Libs, L.; Avivi, Y.; Grafi, G. Two phases of chromatin decondensation during dedifferentiation of plant cells: Distinction between competence for cell fate switch and a commitment for S phase. J. Biol. Chem. 2001, 276, 22772–22778. [Google Scholar] [CrossRef] [PubMed]
- Zhao, X.Y.; Su, Y.H.; Cheng, Z.J.; Zhang, X.S. Cell fate switch during in vitro plant organogenesis. J. Integr. Plant Biol. 2008, 50, 816–824. [Google Scholar] [CrossRef] [PubMed]
- Meshorer, E.; Yellajoshula, D.; George, E.; Scambler, P.J.; Brown, D.T.; Misteli, T. Hyperdynamic plasticity of chromatin proteins in pluripotent embryonic stem cells. Dev. Cell 2006, 10, 105–116. [Google Scholar] [CrossRef] [PubMed]
- Kankel, M.W.; Ramsey, D.E.; Stokes, T.L.; Flowers, S.K.; Haag, J.R.; Jeddeloh, J.A.; Riddle, N.C.; Verbsky, M.L.; Richards, E.J. Arabidopsis MET1 cytosine methyltransferase mutants. Genetics 2003, 163, 1109–1122. [Google Scholar] [PubMed]
- Li, W.; Liu, H.; Cheng, Z.J.; Su, Y.H.; Han, H.N.; Zhang, Y.; Zhang, X.S. DNA methylation and histone modifications regulate de novo shoot regeneration in arabidopsis by modulating wuschel expression and auxin signaling. PLoS Genet. 2011, 7, e1002243. [Google Scholar] [CrossRef] [PubMed]
- González, A.I.; Saiz, A.; Acedo, A.; Ruiz, M.L.; Polanco, C. Analysis of genomic DNA methylation patterns in regenerated and control plants of rye (Secale cereale L.). Plant Growth Regul. 2013, 70, 227–236. [Google Scholar] [CrossRef]
- Uthup, T.K.; Ravindran, M.; Bini, K.; Thakurdas, S. Divergent DNA methylation patterns associated with abiotic stress in Hevea brasiliensis. Mol. Plant 2011, 4, 996–1013. [Google Scholar] [CrossRef] [PubMed]
- Garg, R.; Narayana Chevala, V.; Shankar, R.; Jain, M. Divergent DNA methylation patterns associated with gene expression in rice cultivars with contrasting drought and salinity stress response. Sci. Rep. 2015, 5, 14922. [Google Scholar] [CrossRef] [PubMed]
- Wang, N.; Zhang, D.; Wang, Z.; Xun, H.; Ma, J.; Wang, H.; Huang, W.; Liu, Y.; Lin, X.; Li, N.; et al. Mutation of the RDR1 gene caused genome-wide changes in gene expression, regional variation in small RNA clusters and localized alteration in DNA methylation in rice. BMC Plant Biol. 2014, 14, 177. [Google Scholar] [CrossRef] [PubMed]
- Choi, C.S.; Sano, H. Abiotic-stress induces demethylation and transcriptional activation of a gene encoding a glycerophosphodiesterase-like protein in tobacco plants. Mol. Genet. Genom. 2007, 277, 589–600. [Google Scholar] [CrossRef] [PubMed]
- Guerra, M.P.; Steiner, N.; Farias-Soares, F.L.; Vieira Ldo, N.; Fraga, H.P.; Rogge-Renner, G.D.; Maldonado, S.B. Somatic Embryogenesis in Araucaria angustifolia (Bertol.) Kuntze (Araucariaceae). Methods Mol. Biol. 2016, 1359, 439–450. [Google Scholar] [CrossRef] [PubMed]
- Editorial. Between genotype and phenotype. Nat. Genet. 2006, 38, 1355. [Google Scholar]
- Langmead, B.; Trapnell, C.; Pop, M.; Salzberg, S.L. Ultrafast and memory-efficient alignment of short DNA sequences to the human genome. Genome Biol. 2009, 10, R25. [Google Scholar] [CrossRef] [PubMed]
- Andrews, S. FastQC: A quality control tool for high throughput sequence data. Available online: https://www.bioinformatics.babraham.ac.uk/projects/fastqc/ (accessed on 17 July 2018).
- Conesa, A.; Gotz, S.; Garcia-Gomez, J.M.; Terol, J.; Talon, M.; Robles, M. Blast2go: A universal tool for annotation, visualization and analysis in functional genomics research. Bioinformatics 2005, 21, 3674–3676. [Google Scholar] [CrossRef] [PubMed]
- Cao, P.; Jung, K.H.; Choi, D.; Hwang, D.; Zhu, J.; Ronald, P.C. The Rice Oligonucleotide Array Database: An atlas of rice gene expression. Rice 2012, 5, 17. [Google Scholar] [CrossRef] [PubMed]
- Guo, W.; Fiziev, P.; Yan, W.; Cokus, S.; Sun, X.; Zhang, M.Q.; Chen, P.Y.; Pellegrini, M. BS-Seeker2: A versatile aligning pipeline for bisulfite sequencing data. BMC Genom. 2013, 14, 774. [Google Scholar] [CrossRef] [PubMed]
- Baranek, M.; Cechova, J.; Kovacs, T.; Eichmeier, A.; Wang, S.; Raddova, J.; Necas, T.; Ye, X. Use of Combined MSAP and NGS Techniques to Identify Differentially Methylated Regions in Somaclones: A Case Study of Two Stable Somatic Wheat Mutants. PLoS ONE 2016, 11, e0165749. [Google Scholar] [CrossRef] [PubMed]
- Zhang, X.; Yazaki, J.; Sundaresan, A.; Cokus, S.; Chan, S.W.; Chen, H.; Henderson, I.R.; Shinn, P.; Pellegrini, M.; Jacobsen, S.E.; et al. Genome-wide high-resolution mapping and functional analysis of DNA methylation in arabidopsis. Cell 2006, 126, 1189–1201. [Google Scholar] [CrossRef] [PubMed]
- Kitimu, S.R.; Taylor, J.; March, T.J.; Tairo, F.; Wilkinson, M.J.; Rodriguez Lopez, C.M. Meristem micropropagation of cassava (Manihot esculenta) evokes genome-wide changes in DNA methylation. Front. Plant Sci. 2015, 6, 590. [Google Scholar] [CrossRef] [PubMed]
Figure 1.
Analysis of callus morphology during rice culture. (A) Stages of IR64 and TNG67 in culture for methylome and transcriptome profiling. Bar scale, 2 mm. A green circle indicates an immature embryo at T0 and regenerated tissue at TS; (B) Hierarchically clustered heatmap of hue saturation values (HSV) of IR64 and TNG67 calli during six weeks of culture; and (C) Regeneration efficiencies of IR64 and TNG67 calli upon treatment with 5-azacytidine.

Figure 2.
Methylome and transcriptome analyses during rice culture. (A) Principal component analysis of the methylome at different stages of culture; (B) Hierarchically clustered heatmap of the variable methylation regions of IR64 and TNG67 in culture. In total 13,631 genomic regions whose methylation difference is greater than 70% between any two samples are selected and presented the heatmap; (C) Principal component analysis of the transcriptome at different stages of culture; and (D) Hierarchically clustered heatmap of the global gene expression level of IR64 and TNG67 in culture. In total 4159 Genes with variable expression level among the samples (fold change ≥ 8 between any two samples) are selected in the heatmap.

Figure 3.
Stage-associated changes in the methylome and transcriptome of rice. (A) Genome-wide average CG-methylation levels from the embryo to the regenerants of IR64 and TNG67; (B) Enrichment of stage-associated differentially methylated regions (DMRs) at different genomic locations in IR64 rice; (C) Distribution of CG-methylation at the upstream, transcription start site (TSS) gene body and transcription end site (TES) during IR64 culture; (D) Stage-associated differentially methylated genes and differentially expressed genes at different stages of culture; and (E) Enriched subclasses of stage-associated differentially methylated transposable elements (DMTEs).

Figure 4.
Regions of DNA methylation change during culture. (A) Overlap of stage-associated differentially methylated regions (DMRs) in IR64 and TNG67; and (B) DNA methylation hotspot on a gene encoding a BRCA1 C terminal domain-containing protein.
Figure 4.
Regions of DNA methylation change during culture. (A) Overlap of stage-associated differentially methylated regions (DMRs) in IR64 and TNG67; and (B) DNA methylation hotspot on a gene encoding a BRCA1 C terminal domain-containing protein.

Figure 5.
Interaction of stage- and cultivar-associated changes in culture. (A) Heatmap of DNA methylation differences between IR64 and TNG67 at the same time points; and (B) Enriched biological processes of differentially expressed genes between successful regenerants (TS) of TNG67 and IR64.
Figure 5.
Interaction of stage- and cultivar-associated changes in culture. (A) Heatmap of DNA methylation differences between IR64 and TNG67 at the same time points; and (B) Enriched biological processes of differentially expressed genes between successful regenerants (TS) of TNG67 and IR64.

Figure 6.
Differential stress response pathways in IR64 and TNG67. (A) Comparison of differential stress response processes in IR64 and TNG67; (B) Stress response processes emerge at different stages of culture in IR64 and TNG67; and (C) Transcript levels of trehalose phosphate and SERK genes in IR64 and TNG67.

© 2018 by the authors. Licensee MDPI, Basel, Switzerland. This article is an open access article distributed under the terms and conditions of the Creative Commons Attribution (CC BY) license (http://creativecommons.org/licenses/by/4.0/).
Share and Cite
MDPI and ACS Style
Hsu, F.-M.; Gohain, M.; Allishe, A.; Huang, Y.-J.; Liao, J.-L.; Kuang, L.-Y.; Chen, P.-Y. Dynamics of the Methylome and Transcriptome during the Regeneration of Rice. Epigenomes 2018, 2, 14. https://doi.org/10.3390/epigenomes2030014
AMA Style
Hsu F-M, Gohain M, Allishe A, Huang Y-J, Liao J-L, Kuang L-Y, Chen P-Y. Dynamics of the Methylome and Transcriptome during the Regeneration of Rice. Epigenomes. 2018; 2(3):14. https://doi.org/10.3390/epigenomes2030014
Chicago/Turabian StyleHsu, Fei-Man, Moloya Gohain, Archana Allishe, Yan-Jiun Huang, Jo-Ling Liao, Lin-Yun Kuang, and Pao-Yang Chen. 2018. "Dynamics of the Methylome and Transcriptome during the Regeneration of Rice" Epigenomes 2, no. 3: 14. https://doi.org/10.3390/epigenomes2030014