Assessing Cycling Participation in Australia

1
School of Public Health, University of Sydney, Prevention Research Collaboration, 92-94 Parramatta Road, Camperdown NSW 2050, Australia
2
Principal at CDM Research, 7 Jordan St, Malvern VIC 3144, Australia
*
Author to whom correspondence should be addressed.
Sports 2013, 1(1), 1-9; https://doi.org/10.3390/sports1010001
Submission received: 4 December 2012
/
Revised: 21 December 2012
/
Accepted: 22 December 2012
/
Published: 2 January 2013
Abstract
:Planning and evaluating cycling programs at a national or state level requires accurate measures of cycling participation. However, recent reports of cycling participation have produced very different estimates. This paper examines the reported rates of cycling in five recent population surveys of cycling. Three surveys (one national and two from Sydney) asking respondents when they last rode a bicycle generated cycling participation (cycled in the past year) estimates of 29.7%, 34.1% and 28.9%. Two other national surveys which asked participants to recall (unprompted) any physical activity done for exercise, recreation or sport in the previous 12 months, estimated cycling in the past year as 11.1% and 6.5%. While unprompted recall of cycling as a type of physical activity generates lower estimates of cycling participation than specific recall questions, both assessment approaches produced similar patterns of cycling by age and sex with both approaches indicating fewer women and older adults cycling. The different question styles most likely explain the substantial discrepancies between the estimates of cycling participation. Some differences are to be expected due to sampling variability, question differences, and regional variation in cycling.
1. Introduction
Planning and evaluating cycling programs requires accurate measures of cycling participation. There are many dimensions of cycling that can be examined, with varying levels of complexity. In 2000 the Australian Bicycle Council proposed five areas for cycling related data -ownership (incorporating theft), infrastructure, usage, and cyclist safety (incorporating crashes), and 30 separate indicators [1]. While all the cycling indicators are important, a critical summary figure is ‘usage’—one of which is the proportion of the population who cycle over a given period (i.e. participation).
One stable source of information about one aspect of cycling participation is the Australian Census. Conducted every five years by the Australian Bureau of Statistics, the ABS Census asks about the journey to work on Census day, and includes an option for bicycles (both as a sole mode and combined with up to two other modes). These data reveal that over the last 30 years cycling mode share has remained steady at about 1% of commuting journeys for employed adults [2]. However, these ‘journey to work’ data significantly under-report total cycling. They do not include recreational, utility or children’s cycling, and are collected on just one day of the year in the middle of winter when for the majority of the Australian population cycling is at its lowest.
The only other national data set to measure cycling participation in Australia is the Exercise, Recreation and Sport Survey (ERASS) [3]. Limitations of this data set include the restricted period (2002-2010) it covers, and that it is not specifically designed to monitor cycling, but rather all sport and recreation activities. This may under-estimate cycling participation because of problems of recall, and may exclude transport journeys.
Some Australian states (New South Wales, Queensland and Victoria) have household travel data from metropolitan regions within these states, which give some idea of cycling patterns. However, the proportion of people cycling in these samples is too small to be able to analyse the cycling data, focuses on trips and does not provide population prevalence estimates [4].
Recently, a national cycling participation survey was conducted [5] as part of baseline data for the National Cycling Strategy [6]. This survey reported dramatically higher levels of cycling in the community than seen in the ERASS surveys, which raises questions about the accuracy of both of these data sets. This paper examines the reported rates of cycling in five recent Australian population surveys of cycling.
2. Method
Data used in this analysis come from five sources, summarised in Table 1. The first is published national data from the 2010 Exercise, Recreation and Sport Survey (ERASS) [3]. ERASS are continuous telephone surveys, collected from around 3500 adult Australians (15 years and older), each quarter (Australian Sports Commission, 2011). Individuals are randomly sampled using list-assisted telephone numbers. Data are collected using a computer assisted telephone interview (CATI) system. The ERASS questionnaire asks about any physical activity done for exercise, recreation or sport in the previous 12 months, excluding activities that were part of work or household and gardening chores. Those that indicated participation were asked to recall the types of activities (unprompted), and the number of times they participated in each activity (maximum of 10), during the previous 12 months. Any participation in cycling for exercise, recreation or sport classified an individual as a ‘cyclist’. Appendix 1 lists the questions from which cycling participation was derived.
The second survey is the Multipurpose Household Survey (MPHS) conducted by the Australian Bureau of Statistics in 2009-2010. This telephone survey obtained data from 14,205 dwellings, with one person aged 15 years and over sampled (87% response rate) and asked about their participation in sport and physical recreation activities.
The third data source is the national cycling participation survey [5]. The survey was a telephone interview conducted during March and April 2011 with a random selection of households across Australia. A total of 9,661 households consisting of 24,858 individuals were interviewed, consisting of around 0.11% of the Australian resident population. Respondents were asked when they and other members of their household had last ridden a bicycle.
The fourth source is a telephone survey of 600 Sydney residents aged 16 years and older [7]. A question on the last time a bicycle was ridden was included in an omnibus market research survey conducted in October 2010, as part of a brief set of questions related to mandatory bicycle helmets.
The fifth source is a telephone survey of 1450 residents aged 18 years and older in three local government areas in south-western Sydney conducted in May-June 2007 [8]. This was collected as the baseline survey for a community intervention to encourage the use of local cycling infrastructure [9] and measured a range of cycling behaviours, including the last time a bicycle was ridden.
3. Analysis
Frequency of cycling in the past year, month and week was asked in three of the five surveys, and are presented by age and sex. Any cycling in the past 12 months was noted in the ERASS and ABS surveys. Unfortunately data about age of participants collected in the Cycling Participation Survey was collected in specific bands, and results needed to be re-aggregated into coarse bands to allow some comparison with the other surveys. Overall cycling participation rates from the Cycling Participation Survey are presented for respondents aged 18 years or older. Data from the two Sydney-based surveys were re-grouped to match the age categories and allow direct comparison with ERASS, the ABS survey and the Cycling Participation Survey.

Table 1.
Characteristics of five population based telephone surveys measuring cycling participation.
| Surveys and region | Sample size (persons) | Response rate (%) | Age range | When and where data collected |
|---|---|---|---|---|
| ERASS 2010 [national] | 21,031 | 25.2 | 15 years and older | 2009, nationally |
| ABS 2010 [national] | 14,205 | 87 | 15 years and older | July 2009-June 2010, nationally |
| National Cycling Participation Survey | 24,858 | 40.6 | 15 years and older* | March/April 2011, nationally |
| Sydney Omnibus Survey | 600 | Quota sampling | 16 years and older | October 2010, Sydney metropolitan area |
| ‘Cycling Connecting Communities’ South-west Sydney | 1450 | 65 | 18 years and older | May-June 2007, South-west Sydney |
* Respondents in the NCP must be 15 years or older, but coverage is all ages 2+ (i.e. respondent were asked about their cycling, and those of all other household members older than two years).
4. Results
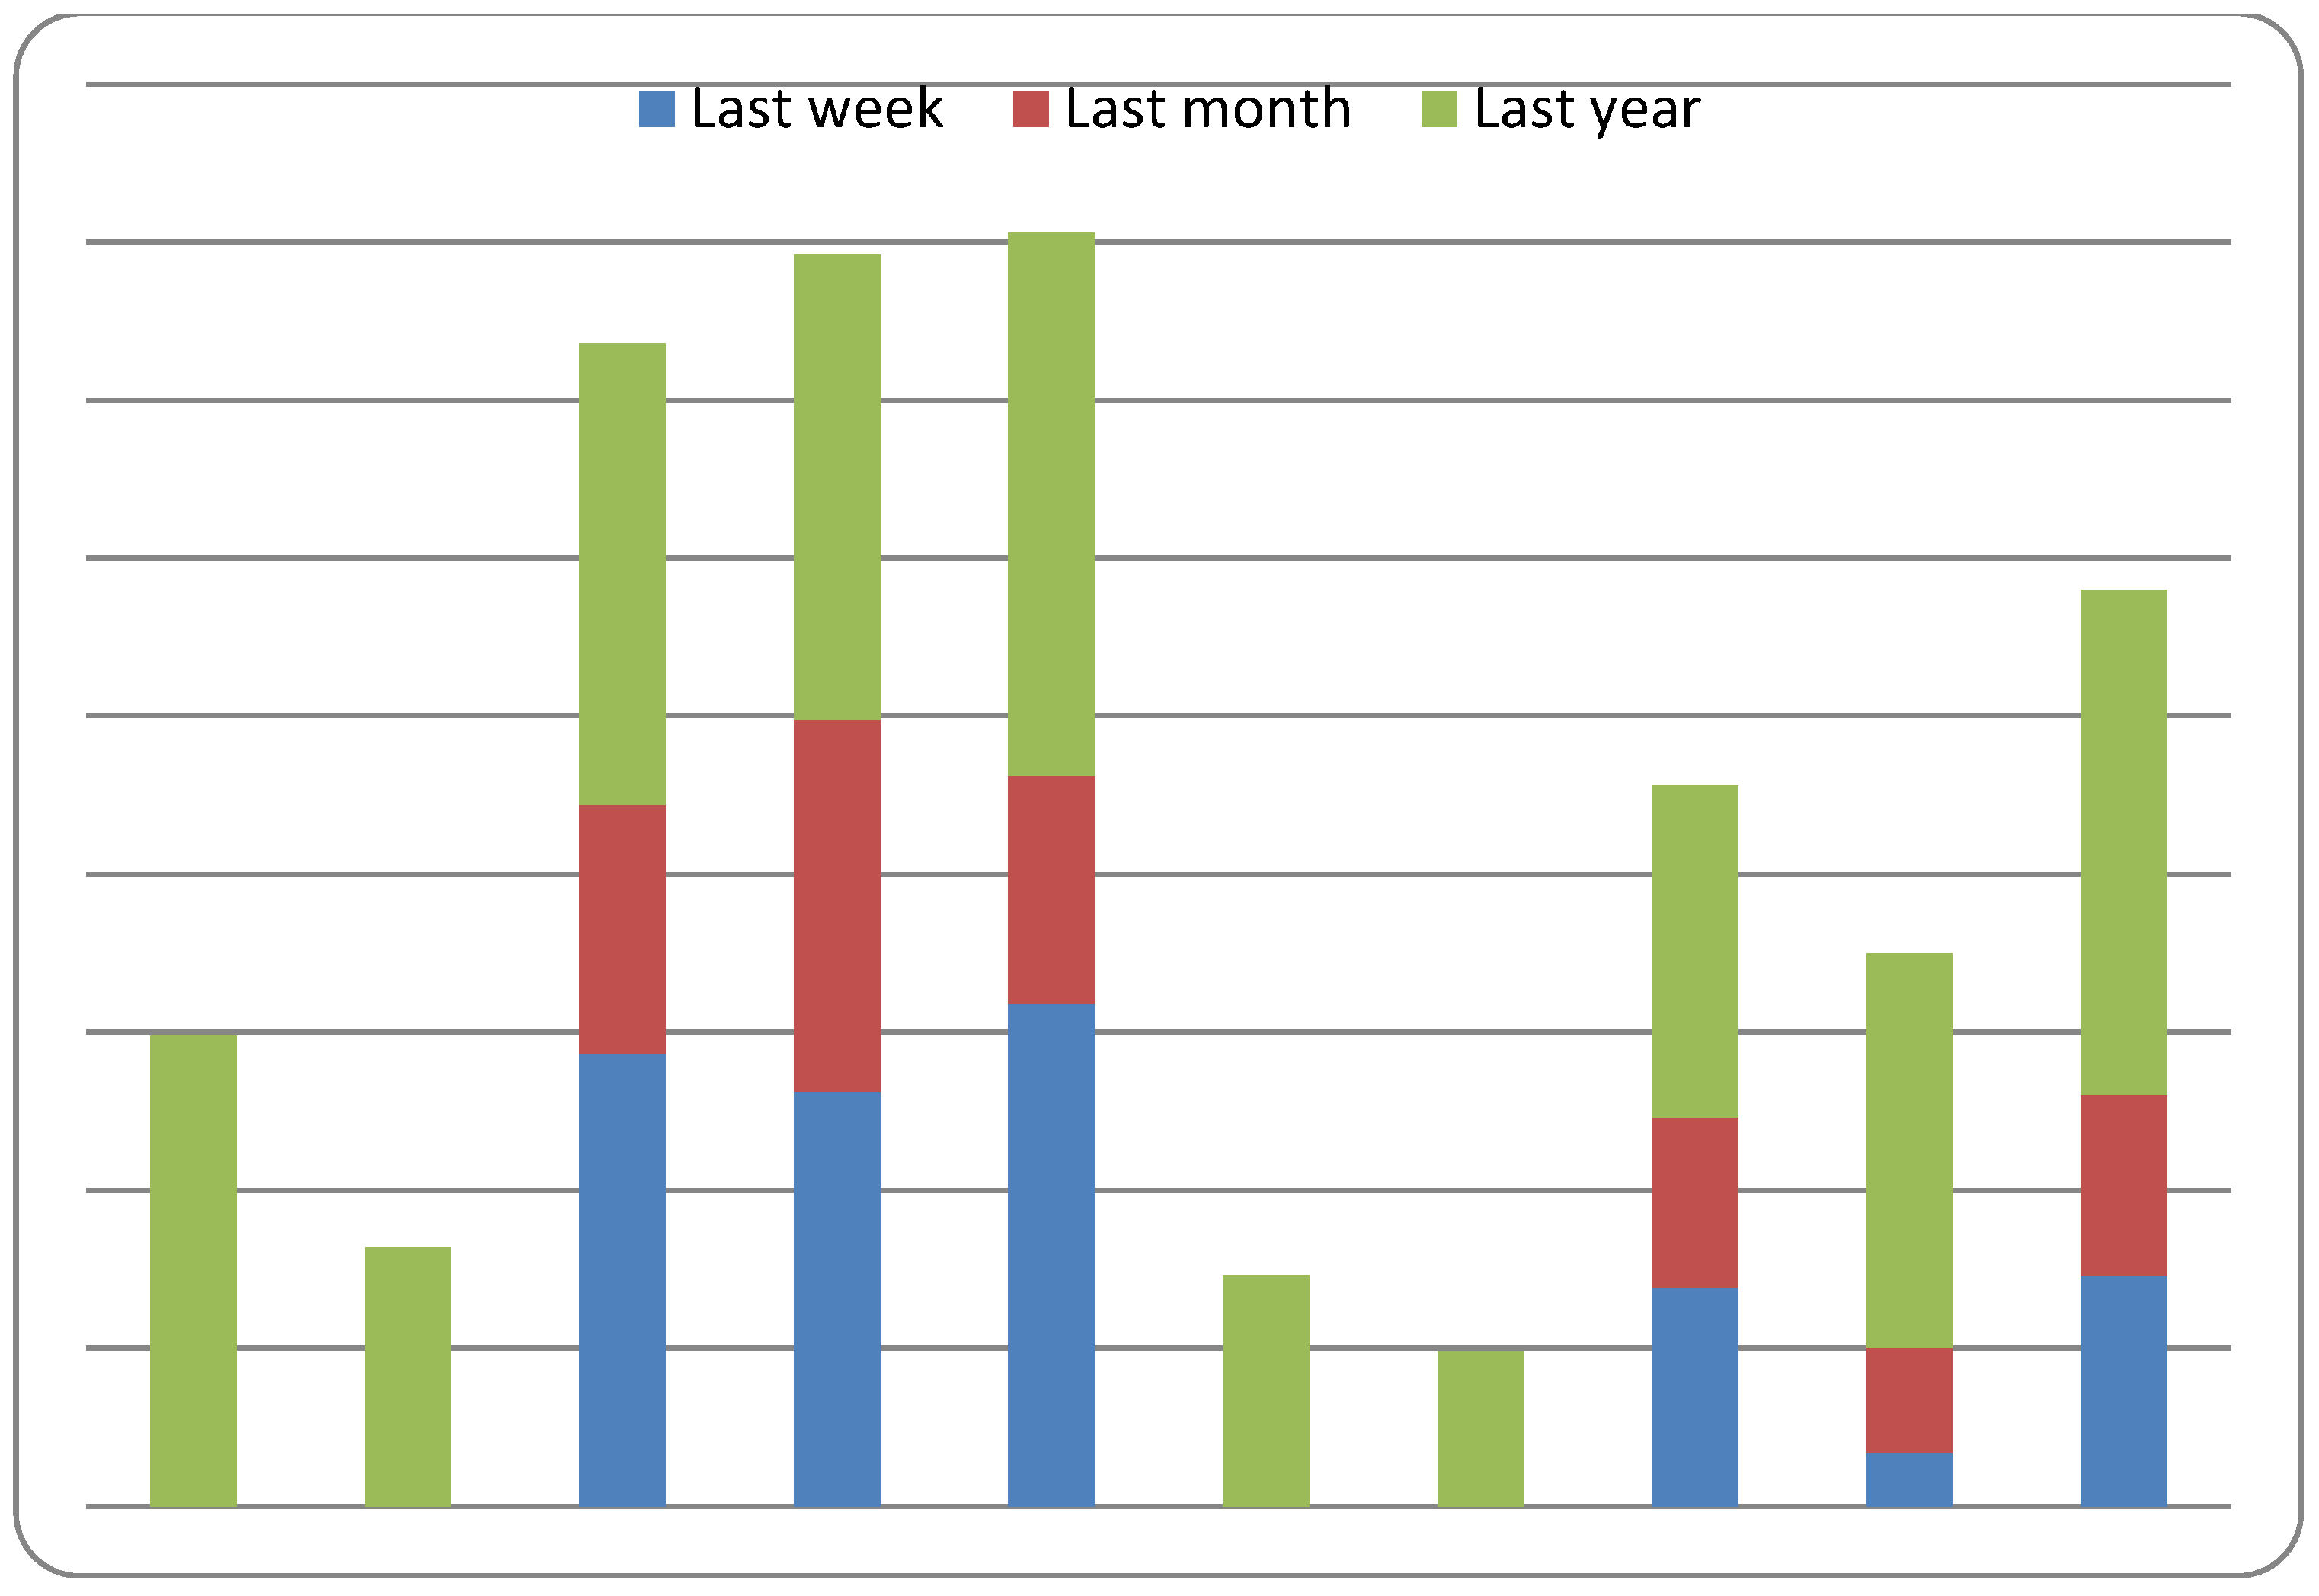
Overall, the proportion of survey participants who had cycled in the past year was 29.7%, 34.1% and 28.9%, in the Cycling Participation Survey (18 years and older), Sydney (16 years and older), south-west Sydney (18 years and older) studies, respectively. ERASS reports any cycling in the past year (15 years and older) as 11.1% and the ABS as 6.5%. Cycling in the past year (and where available week and month) in each by sex is shown in Figure 1, with ERASS and ABS estimates consistently lower than the other three surveys. The frequently observed pattern of fewer women than men cycling is evident across all the surveys.
Figure 1.
Cycling participation in five surveys by sex.

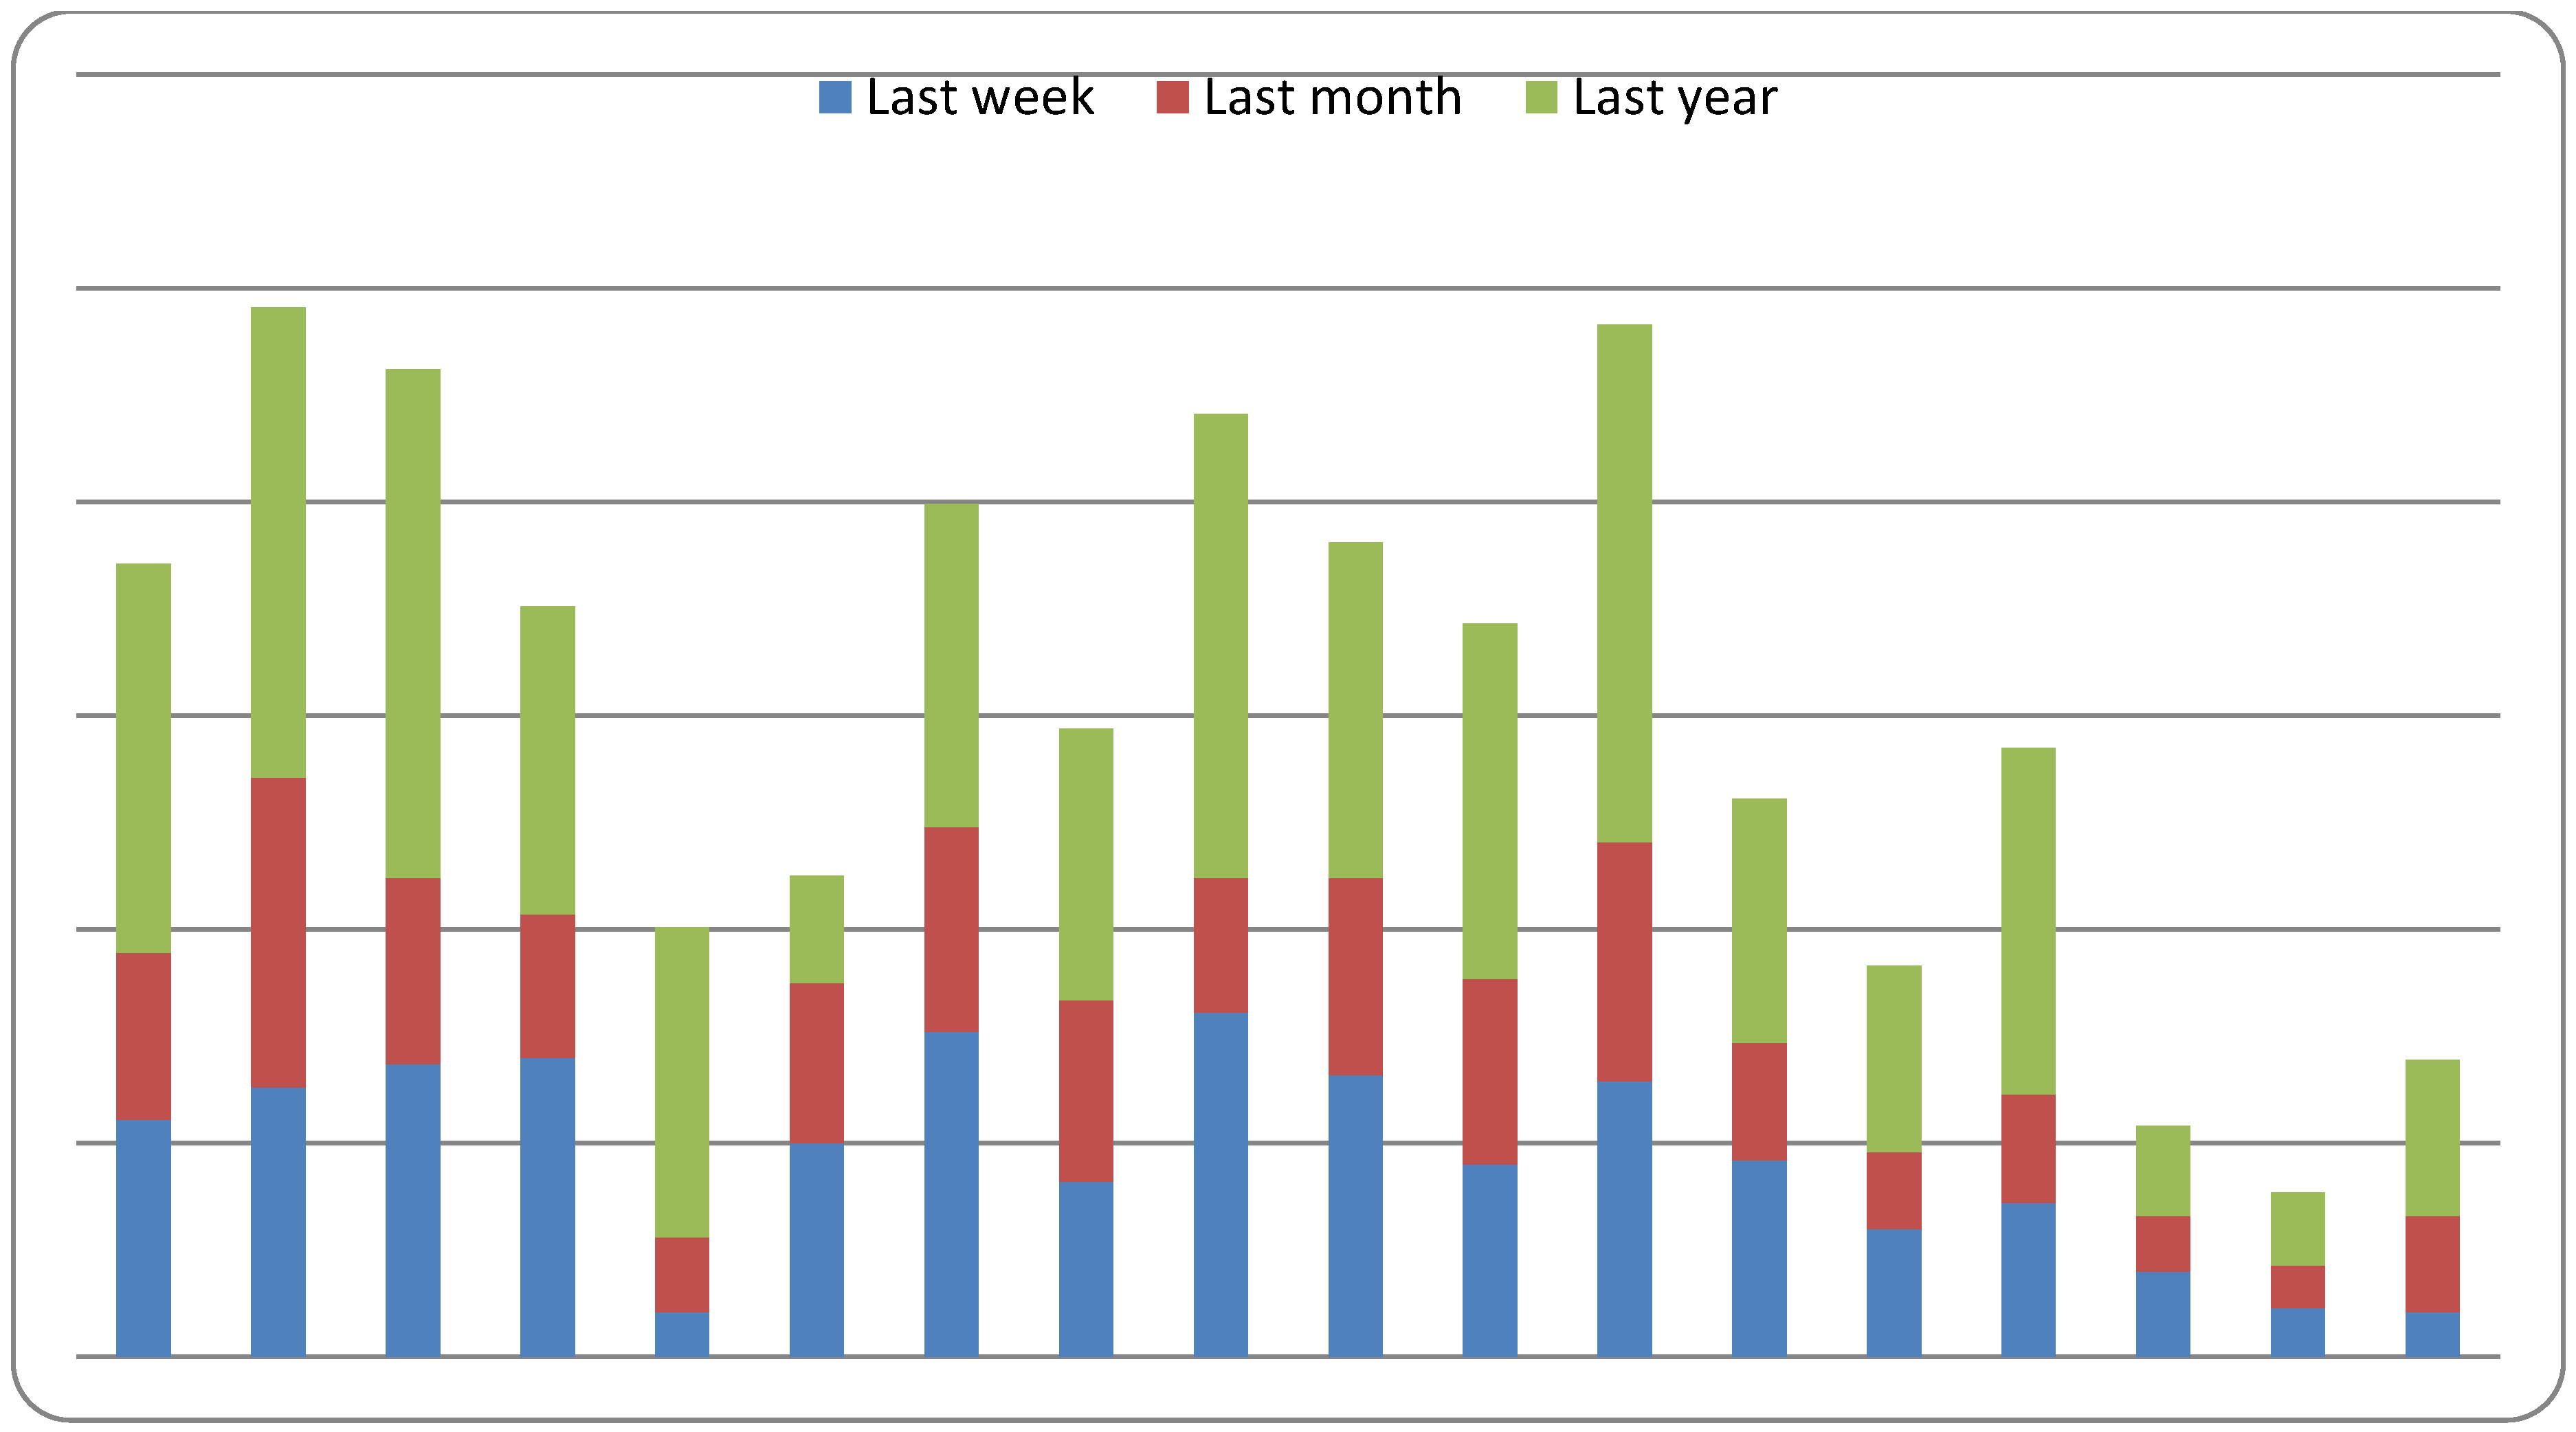
When examined by age groups (Figure 2 and Figure 3) it is apparent that for most age groups the ABS survey has the lowest estimates of cycling participation, the exception being the oldest age group. ERASS and ABS estimates were approximately two to three times lower than all other estimates within each age group, and even more in the younger age groups.
Figure 2.
Cycling by age using Cycling Participation Survey age bands, and in Sydney and south-west Sydney.
Figure 2.
Cycling by age using Cycling Participation Survey age bands, and in Sydney and south-west Sydney.
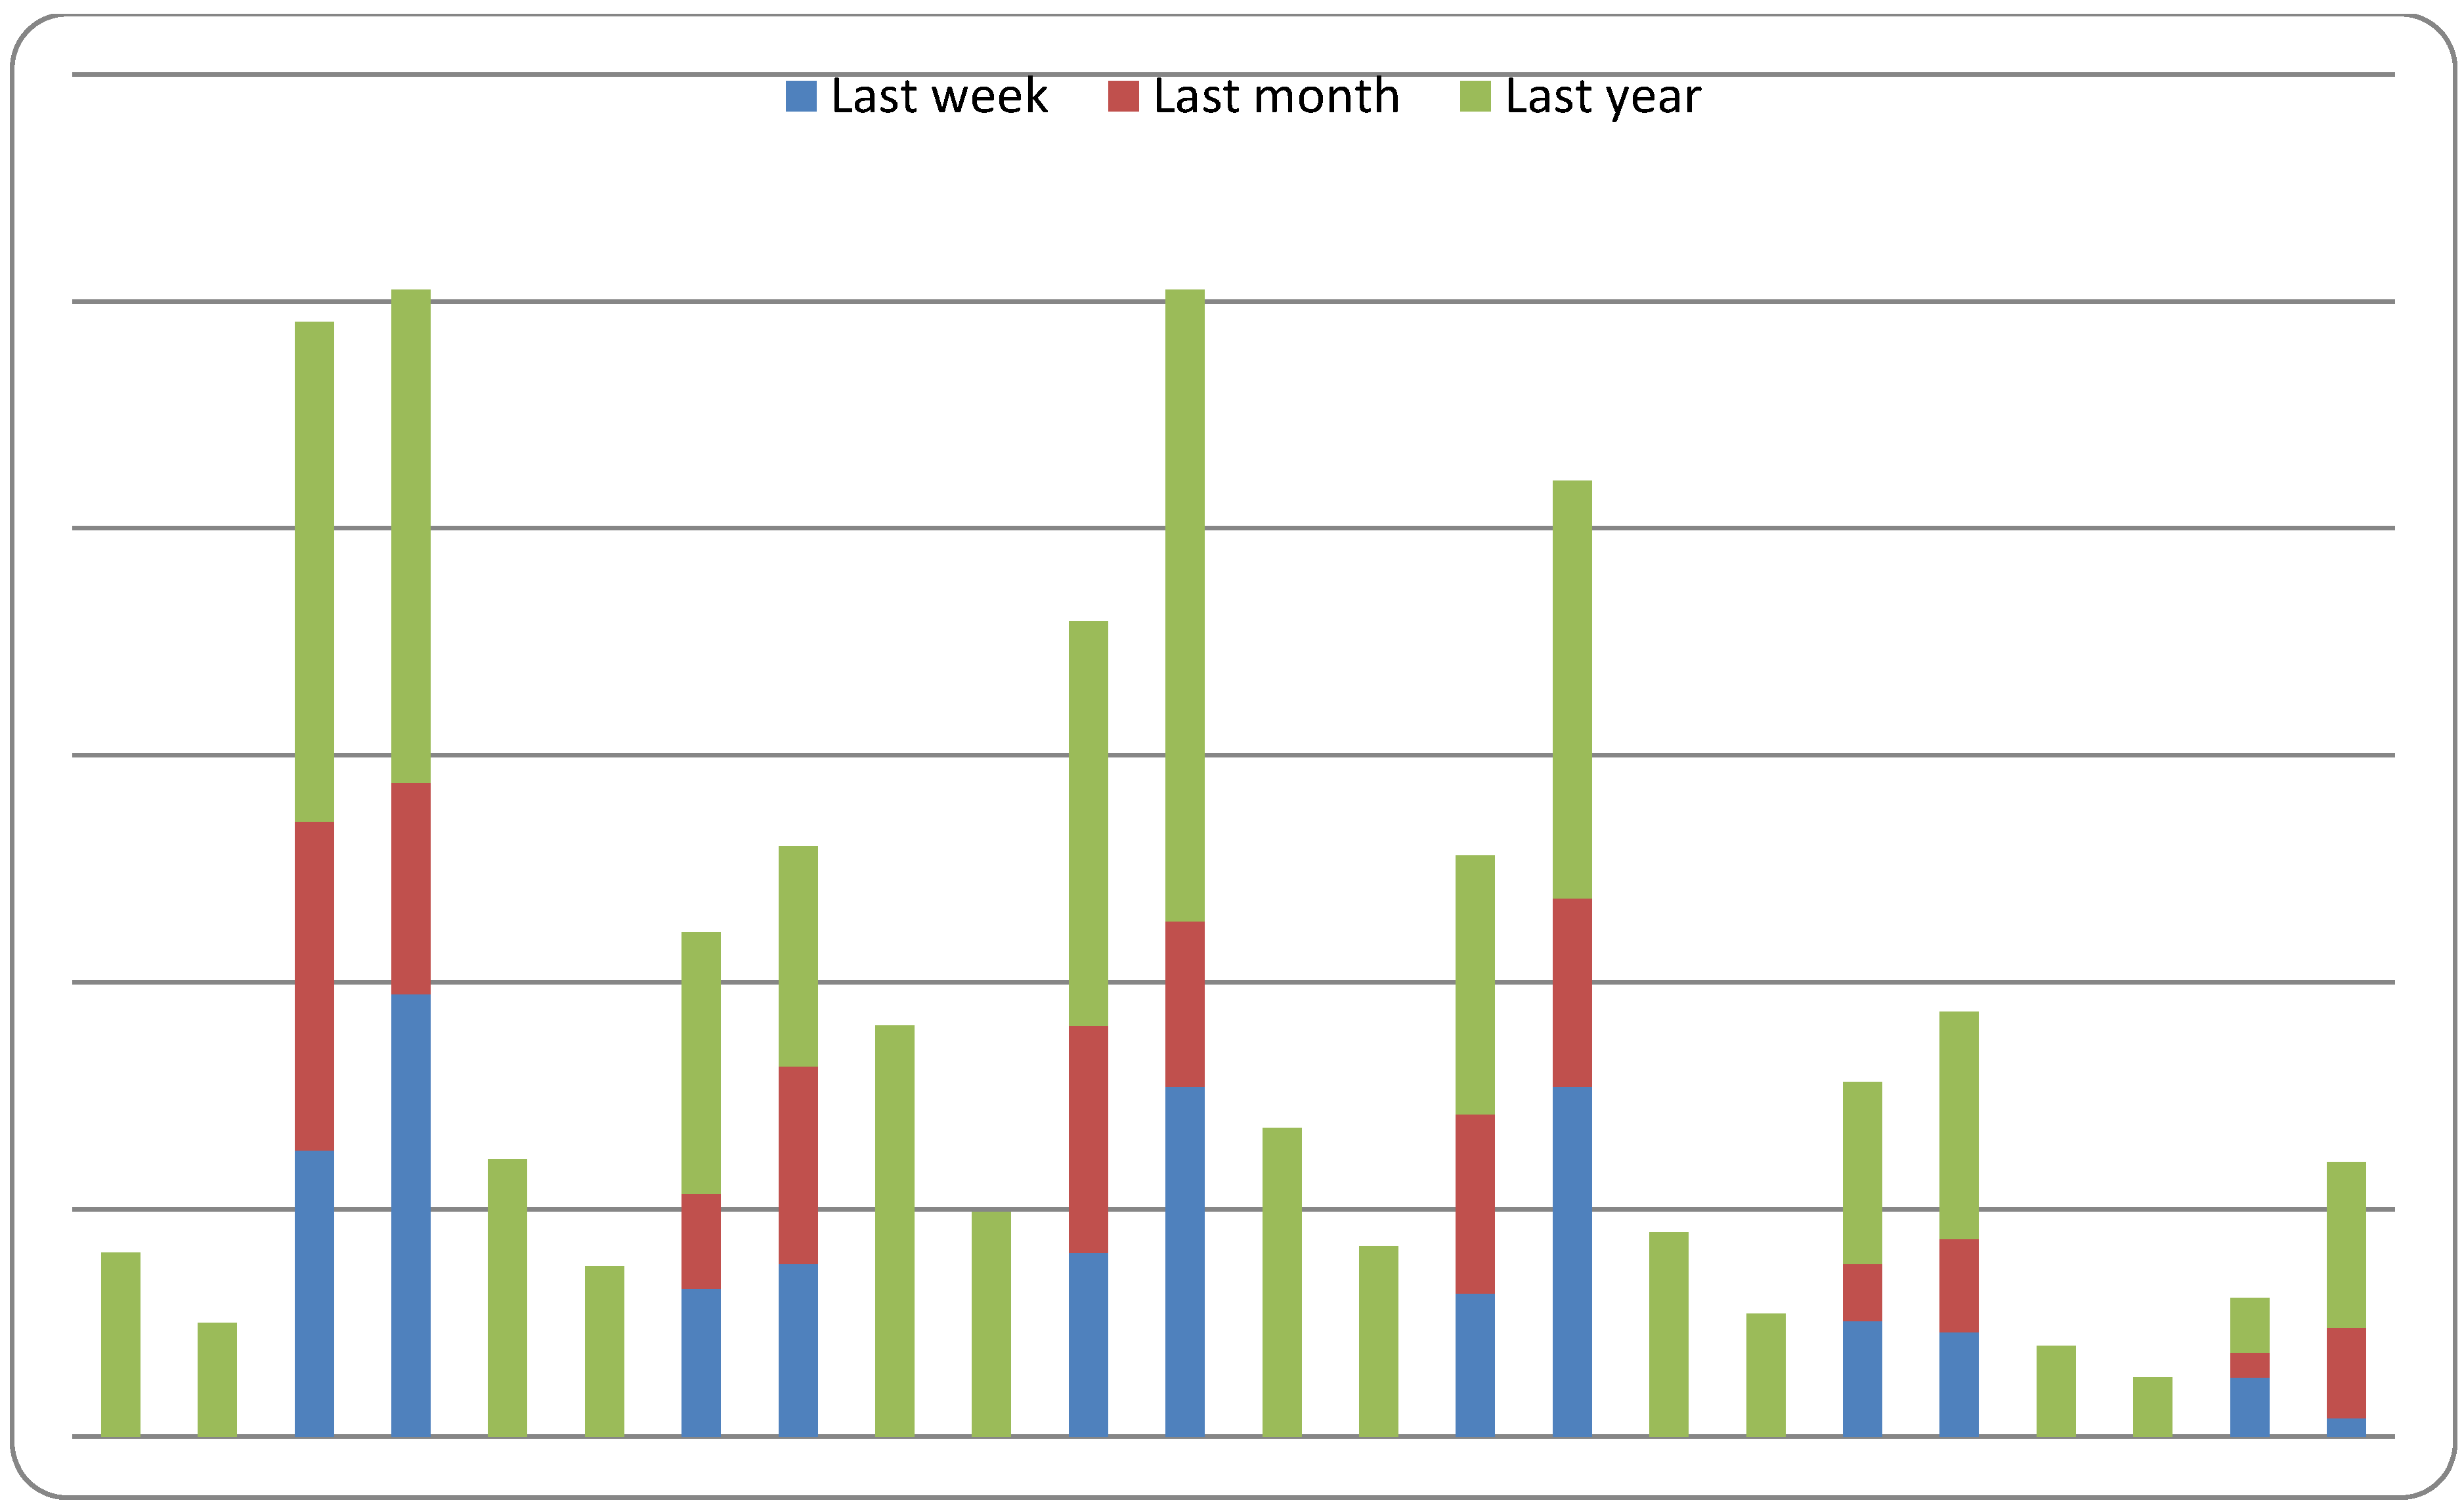
Using the same age groupings, the Cycling Participation Survey estimates were reasonably aligned with those from the Sydney and south-west Sydney surveys (Figure 2). The two Sydney surveys (with data regrouped to match age categories) also showed higher estimates than the ERASS or ABS surveys (Figure 3).
Figure 3.
Cycling participation by age for four cycling surveys*
* Cycling participation Survey was excluded from this figure because of lack of comparability of age bands
Figure 3.
Cycling participation by age for four cycling surveys*
* Cycling participation Survey was excluded from this figure because of lack of comparability of age bands
5. Discussion
Despite some inconsistency with age groupings, comparing the estimates of cycling participation from five separate surveys shows that the ABS and ERASS surveys generate lower estimates of cycling participation by at least two to three times that of the other surveys, and even more in the younger age groups. There was some consistency of cycling estimates between the national Cycling Participation Survey and the two surveys from Sydney and south-west Sydney.
While all five surveys used telephone interviews to collect the data, the main difference is that the ABS and ERASS surveys asked respondents to identify up to ten activities they had participated in over the past 12 months without interviewer prompting. It is likely respondents identified only those activities they participated in most regularly or recently, or only those of an organised nature (such as organised sporting activities such as football or cricket). The limited scope of purposes in ERASS (exercise, recreation and sport) would exclude those who cycle only for other purposes (e.g. commuting). ERASS excludes those aged less than 16 years, where there is are very high levels of cycling participation. However, this present analysis has excluded children.
The other surveys asked specifically about the most recent occasion of cycling. The different approaches to data collection most likely explain the obvious differences across surveys.
There was some variation between the national estimates and those from Sydney. For example, there was less cycling by women in south-western Sydney, but this is plausible given the low density urban sprawl of this area and dominant car-based culture. Similarly, the south-western Sydney data showed higher cycling participation in the younger age group, and again, this reflects the youthful demographic of the area and the relative lack of public transport. Of all the Australian capital cities, Sydney has the lowest levels of bicycle ownership, [10] and arguably an media and social environment hostile to cycling, [11] and this also contributes to lower cycling participation in Sydney than nationally.
There were also some differences between the ABS and ERASS surveys, with the ABS estimates generally lower than that of ERASS. One possible explanation for this may be that the lower response rate in the ERASS survey means that those participating are more likely to be interested in physical activity, and may be more likely to recall the different activities they were involved with.
There are a number of limitations to the present analysis, in particular the inability to directly match the data from the Cycling Participation Survey with the exact age categories of the other surveys (because age of respondents was collected in specific age bands). The data from south-western Sydney was collected a few years earlier than the other studies, although this is unlikely to change the conclusion of this paper. Sydney is only one capital city in Australia, and ideally data from other Australian cities would further validate the higher cycling participation estimates of the national Cycling Participation Survey.
Despite these limitations, there is clear evidence that the style of questions used in the ABS and ERASS surveys generates lower estimates of cycling participation than direct questions, and should not be relied upon as an estimate of population prevalence of cycling. However, examining trends in cycling over time using the same methods (as has been done with ERASS data) is still justified.
Another limitation of measuring population cycling in simple telephone surveys is that without considerable additional questions about time spent cycling, and levels of intensity, it is difficult to interpret cycling participation for its contribution to health. Without time and intensity, we do not know if the participation has been to a level that is sufficient for health benefits.
The accurate assessment of levels of cycling in Australia is important. If cycling participation is low (as described by the ERASS and ABS data) then much more needs to be done to improve cycling infrastructure and promote cycling. If higher estimates of cycling are correct, then advocates for cycling can congratulate themselves and potentially change their focus from generally encouraging cycling, perhaps to transitioning recreation cycling to transport cycling.
Appendix 1 Wording of questions used to measure cycling participation
ERASS and ABS
The following questions are about physical activities you have participated in during the last 12 months for exercise, recreation or sport. Do not include any activities that were part of work or household and garden chores.
Q1 During the last 12 months did you participate in any physical activities for exercise, recreation or sport?
- Yes.............................................................................................................................1
- No.............................................................................................................................. 2
- Don’t know...........................................................................................................9
Q2 What activities did you participate in?
Up to maximum of ten activities to be coded
Cycling Participation Survey
Q2. When did you last ride a bicycle? READ OUT
- Never
- More than a year ago
- More than a month ago
- In the last 4 weeks
- In the last 3 weeks
- In the last 2 weeks
- Sometime in the last 7 days
Sydney Omnibus Survey
When was the last time you rode a bicycle? Was it: [READ OUT]
- Today
- Within the last week
- Within the last month
- Within the last year
- Longer than a year
- Never
South-west Sydney
When was the last time you rode a bicycle for any reason? Was it: [READ OUT]
- Within the last seven days
- Within the last month
- Within the last year
- Longer than a year
- Never
References
- Australian Bicycle Council (2000) Cycling Data and Indicator Guidelines. (Last accessed December 20, 2011.). Available online: http://www.austroads.com.au/abc/images/pdf/guidelinesandindicators1.pdf.
- Mees, P.; Sorupia, E.; Stone, J. (2007) Travel to work in Australian capital cities, 1976-2006: an analysis of census data. Australasian Centre for the Governance and Management of Public Transport and the University of Melbourne. 2006. Available online: http://www.abp.unimelb.edu.au/gamut/pdf/travel-to-work.pdf (last accessed October 2011). Melbourne.
- Australian Sports Commission (2011) Exercise, Recreation and Sport Survey (ERASS) past report. Australian Sports Commission. Available online: http://www.ausport.gov.au/information/scors/ERASS. Accessed July 5 2011.
- New South Wales Transport Data Centre (2008) Cycling in Sydney: Bike Ownership and Use 2008. NSW Ministry of Transport and NSW Roads and Traffic Authority, 2008. (Last accessed January 21, 2012.). Sydney. Available online: http://www.bts.nsw.gov.au/Publications/Brochures/Brochures/default.aspx.
- Munro, C. (2011) Australian Cycling Participation 2011. Austroads, Canberra.
- Australian Bicycle Council (2010) The Australian National Cycling Strategy 2011-2016 Austroads Sydney.
- Rissel, C.; Wen, L.M. The possible effect on frequency of cycling if mandatory bicycle helmet legislation was repealed in Sydney, Australia: a cross sectional survey. Health Prom. J. Australia 2011, 22, 178–183. [Google Scholar]
- Rissel, C.; Merom, D.; Bauman, A.; Garrard, J.; Wen, L.M.; New, C. Current cycling, bicycle path use, and willingness to cycle more-findings from a community survey of cycling in southwest Sydney, Australia. J. Phys. Act. Health 2010, 7, 267–272. [Google Scholar] [PubMed]
- Rissel, C.E.; New, C.; Wen, L.M.; Merom, D.; Bauman, A.E.; Garrard, J. The effectiveness of community-based cycling promotion: findings from the Cycling Connecting Communities project in Sydney, Australia. Int. J. Behav. Nutr. Phys. Act. 2010, 7, 8. [Google Scholar] [CrossRef] [PubMed]
- Australian Bicycle Council (2004) Australia Cycling - Bicycle Ownership, Use and Demographics. Australian Bicycle Council. (Last accessed December 21, 2011). Canberra. Available online: http://www.cycle-helmets.com/australia-strategy-2004.pdf.
- Pucher, J.; Garrard, J.; Greaves, S. Cycling down under: a comparative analysis of bicycling trends and policies in Sydney and Melbourne. J. Transp. Geogr. 2010, 18, 332–345. [Google Scholar]
© 2013 by the authors; licensee MDPI, Basel, Switzerland. This article is an open-access article distributed under the terms and conditions of the Creative Commons Attribution license (http://creativecommons.org/licenses/by/3.0/).
Share and Cite
MDPI and ACS Style
Rissel, C.; Munro, C.; Bauman, A. Assessing Cycling Participation in Australia . Sports 2013, 1, 1-9. https://doi.org/10.3390/sports1010001
AMA Style
Rissel C, Munro C, Bauman A. Assessing Cycling Participation in Australia . Sports. 2013; 1(1):1-9. https://doi.org/10.3390/sports1010001
Chicago/Turabian StyleRissel, Chris, Cameron Munro, and Adrian Bauman. 2013. "Assessing Cycling Participation in Australia " Sports 1, no. 1: 1-9. https://doi.org/10.3390/sports1010001