2. Context
The transfer of the mechanical energy produced by the rider from the pedal to the rear wheel is achieved by the bicycle frame [
7]. The frame is the main component of a bicycle; it provides a structural function by linking the various mechanical parts, and supports the rider. A highly efficient frame has to deliver the mechanical power output of the rider to the drive train while minimizing energy loss due to the strain [
8].
Watt
et al. [
9] showed that a significant positive correlation exists between the power output and the strain observed in the bicycle frame. Under high-level BMX race conditions, the frame is expected to experience high levels of strain due to the elevated power output. To develop frames capable of efficiently transferring mechanical power, it is necessary to analyse frame response as a function of the force applied to the pedals during all pedaling conditions (standing position, isometric muscular contraction,
etc.). The use of 3-axis dynamometric pedals allows measurement of the forces directly applied by the cyclist to the pedals and cranks (
Figure 1). Providing information on the relationship between forces applied to the pedals and resultant tube strain could be useful to optimise the BMX frame design. In fact, since BMX racing became an Olympic sport, no study has focused on whether the current BMX frame design is optimised for racing at this level. In high-level competitions, races can be won or lost in 0.01 s. Additional research has ascertained that the margin between 1st and 2nd place in the 2012 BMX world cup series was 0.49 ± 0.36 s [
10]. Clearly, any optimisation of the frame could be an important factor in future world championships or Olympics games. The major aim of this study was to discuss of the optimisation of bicycle frames from analysis of the relationship between local frame loads measured on an instrumented BMX and pedal forces applied by a rider measured by 3-axis dynamometric pedals in different conditions.
Figure 1.
Stress (von Mises) analysis performed with finite element analysis to identify the location of higher strain in the frame.
Figure 1.
Stress (von Mises) analysis performed with finite element analysis to identify the location of higher strain in the frame.
3. Method
3.1. Participant and Procedures
One competitive male cyclist of national level (age = 24 years, body mass = 77.5 kg, body height = 1.75 m) volunteered as a participant for this study. The cyclist read and signed an informed consent form prior to his involvement in the study. This research was approved by our academic Human Subjects Review Committee and in accordance with the Declaration of Helsinki.
To study the influence of the applied forces on the frame strain, different tests were conducted: (1) A bar system was designed to simulate the forces applied to the pedals by the rider in static standing condition; (2) the BMX bicycle was placed on a cycle-trainer and the rider applied a maximal muscular isometric force on one pedal (during this exercise, the rider had his hands on the handlebars); and (3) the rider performed three submaximal pedaling exercises at the following different pedaling cadences 60, 100 and 200 revolutions per minute (revs·min−1), corresponding to a mean power output at the crank of 150, 300 and 550 W, respectively.
3.2. Instrumentation of the Frame with Strain Gauges
To quantify the strain during the different conditions of this protocol, the BMX frame (aluminum alloy 7005) was fitted with eight uniaxial strain gauges (CEA-13-125UN-350, Vishay Measurements, France). The gauge had lengths of 3.18 mm and a nominal resistance of 350% ± 0.3% Ω. At 24 °C, the gauge factor and transverse sensitivity were 2.125% ± 0.5% and 0.5% ± 0.2%, respectively.
In order to place the strain gauges on the BMX frame, a finite element analysis was performed to locate the areas of highest strain. A numerical model of the frame was designed using Pro/ENGINEER® Wildfire™ 2.0, PTC, USA. All dimensions of the framework components (lengths and diameters of tubes) were measured using a caliper (±0.01 mm sensitivity). The welds were not taken into account. The 3D model of the BMX frame was imported into a finite element analysis software package (ABAQUS™, SIMULIA, Dassault Systems, France). A mesh was created consisting of 184,091 nodes and 646,209 tetrahedral 3D elements to four nodes (C3D4-Abaqus). This mesh permitted the study of the exact locations of the strain gauges on the frame. The material used in this modeling is an aluminum alloy whose main characteristics (Young's modulus (E) of 72,000 MPa and a Poisson's ratio (ν) of 0.33) were similar to the BMX frame alloy (Aluminum 7005).
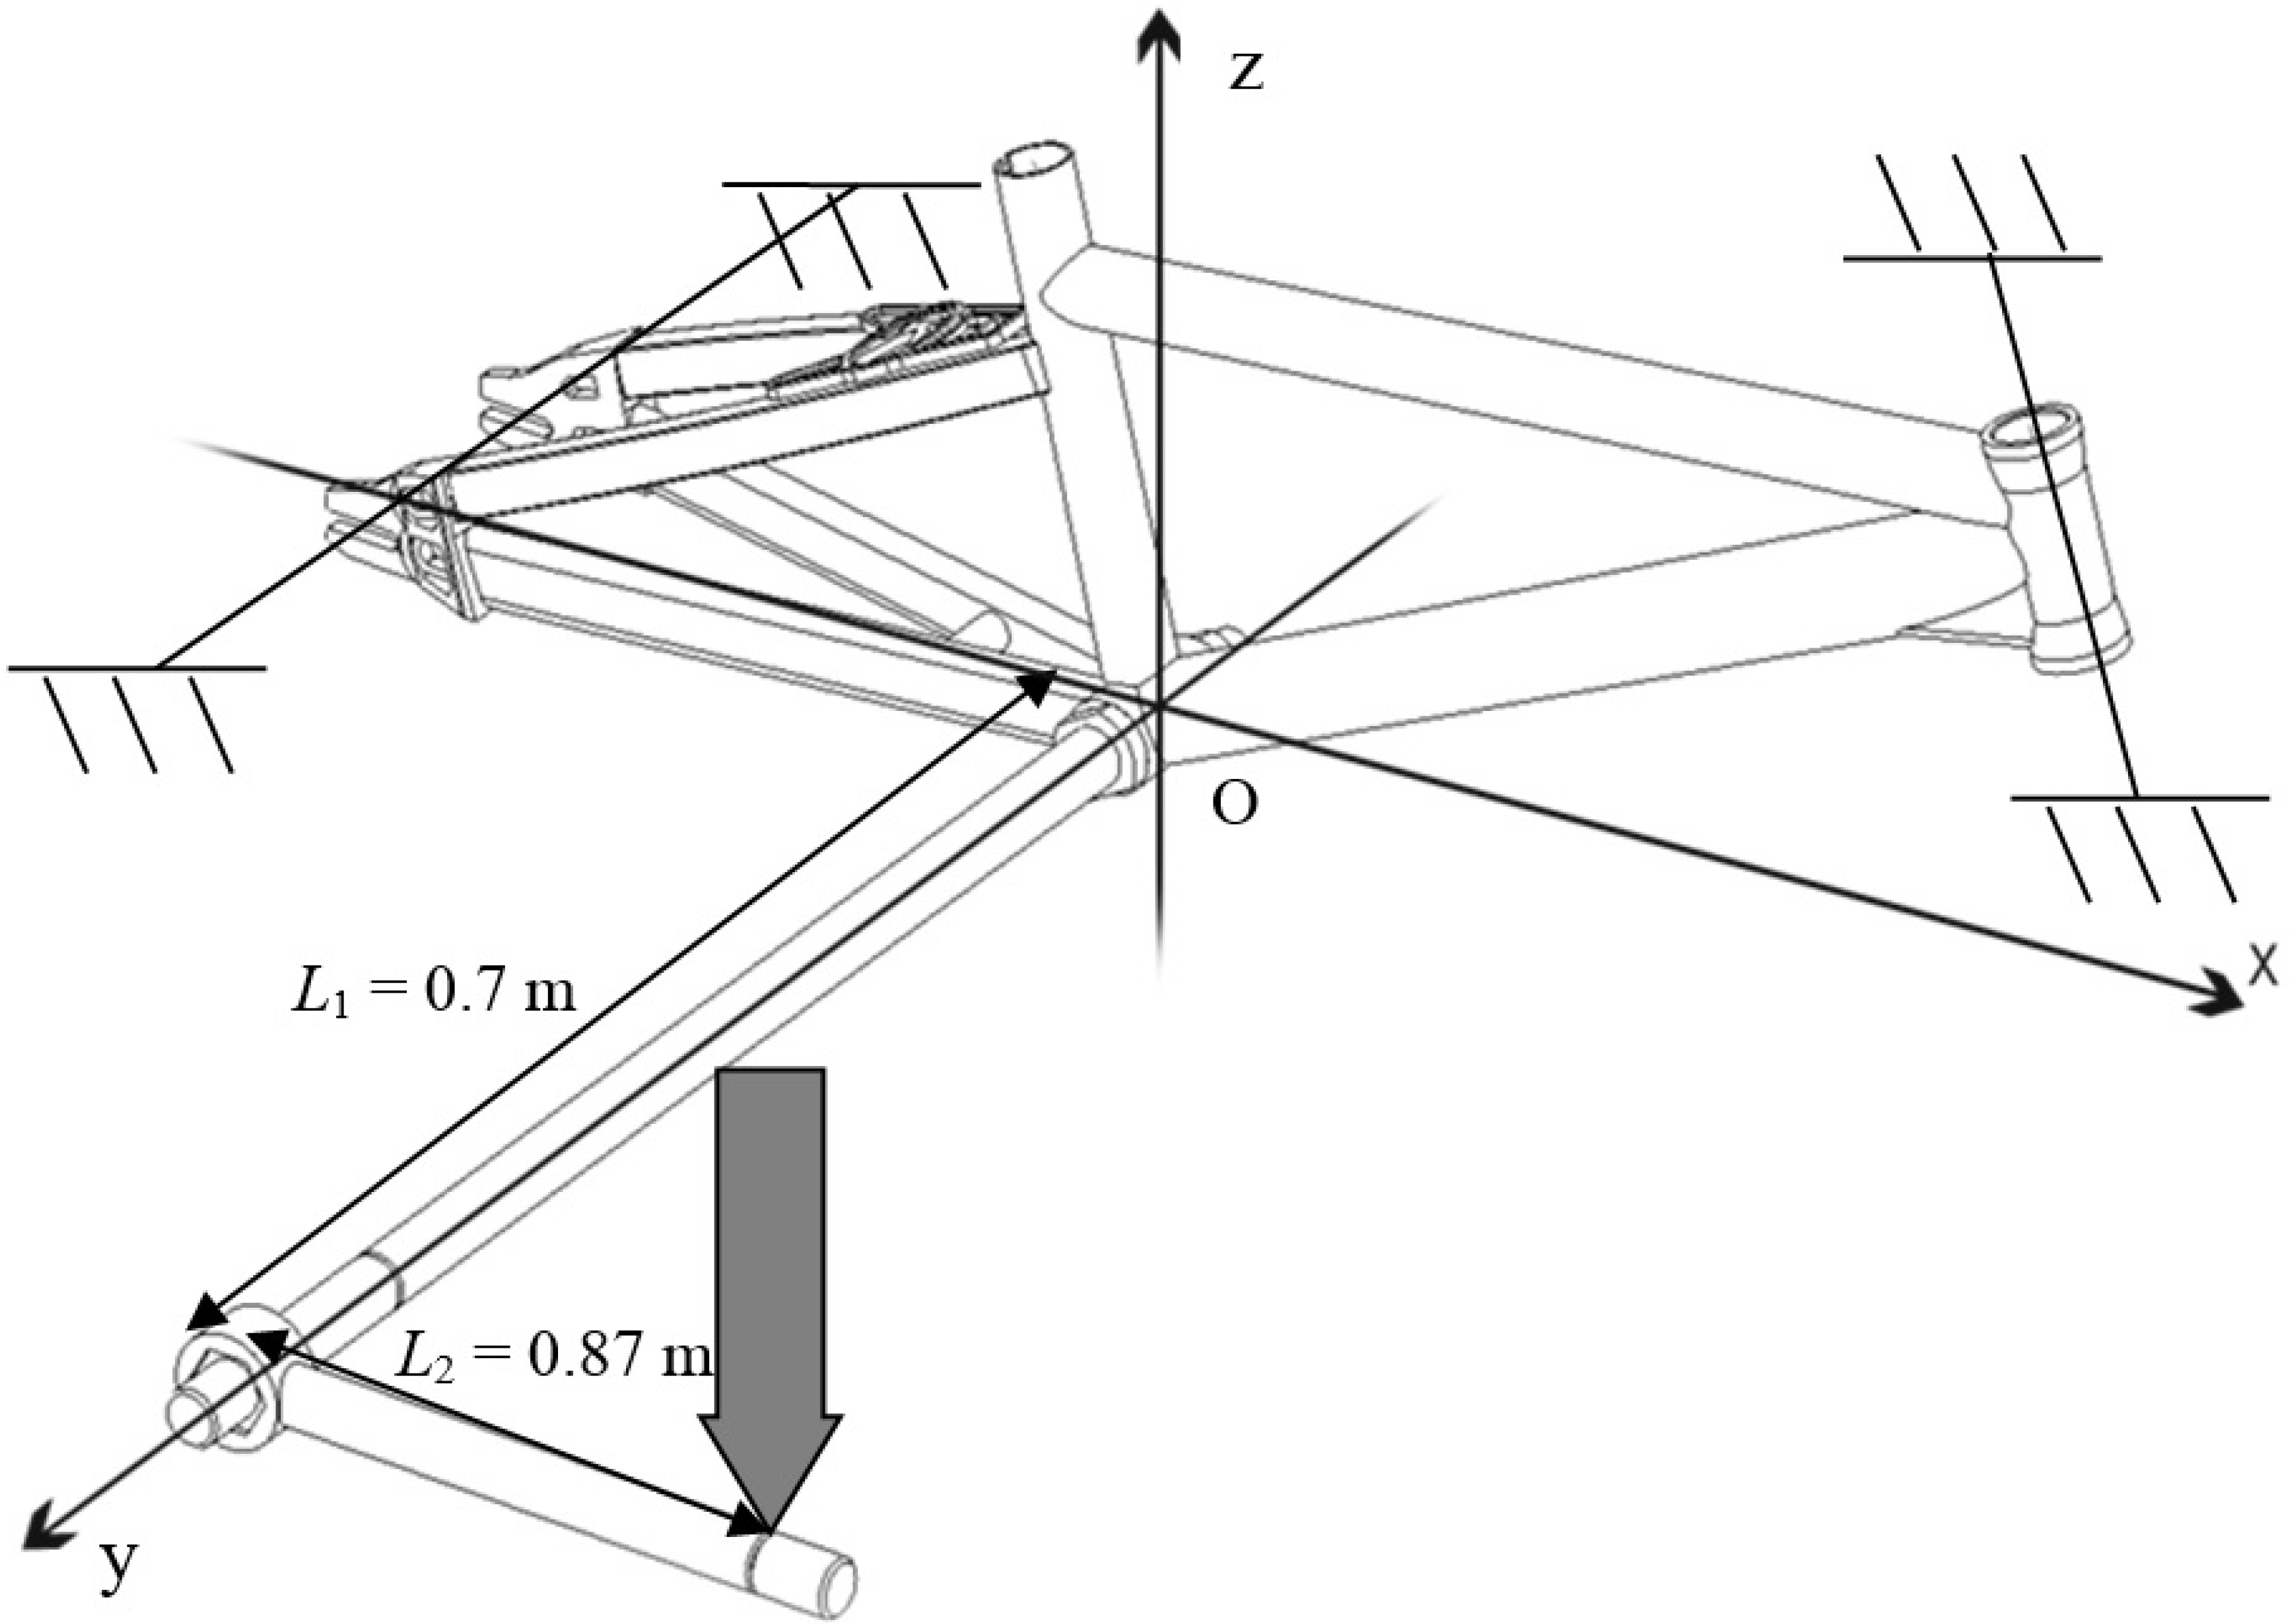
The finite element analysis consisted of applying a force of 1200 N on a system with two lever arms fixed in the center of the bottom bracket to represent the crank (
Figure 1). The lever arms lengths were 0.14 and 0.175 m. The frame was fixed at the head tube and the axis of the rear wheels with zero degrees of freedom. The areas with the highest strain are shown in
Figure 1.
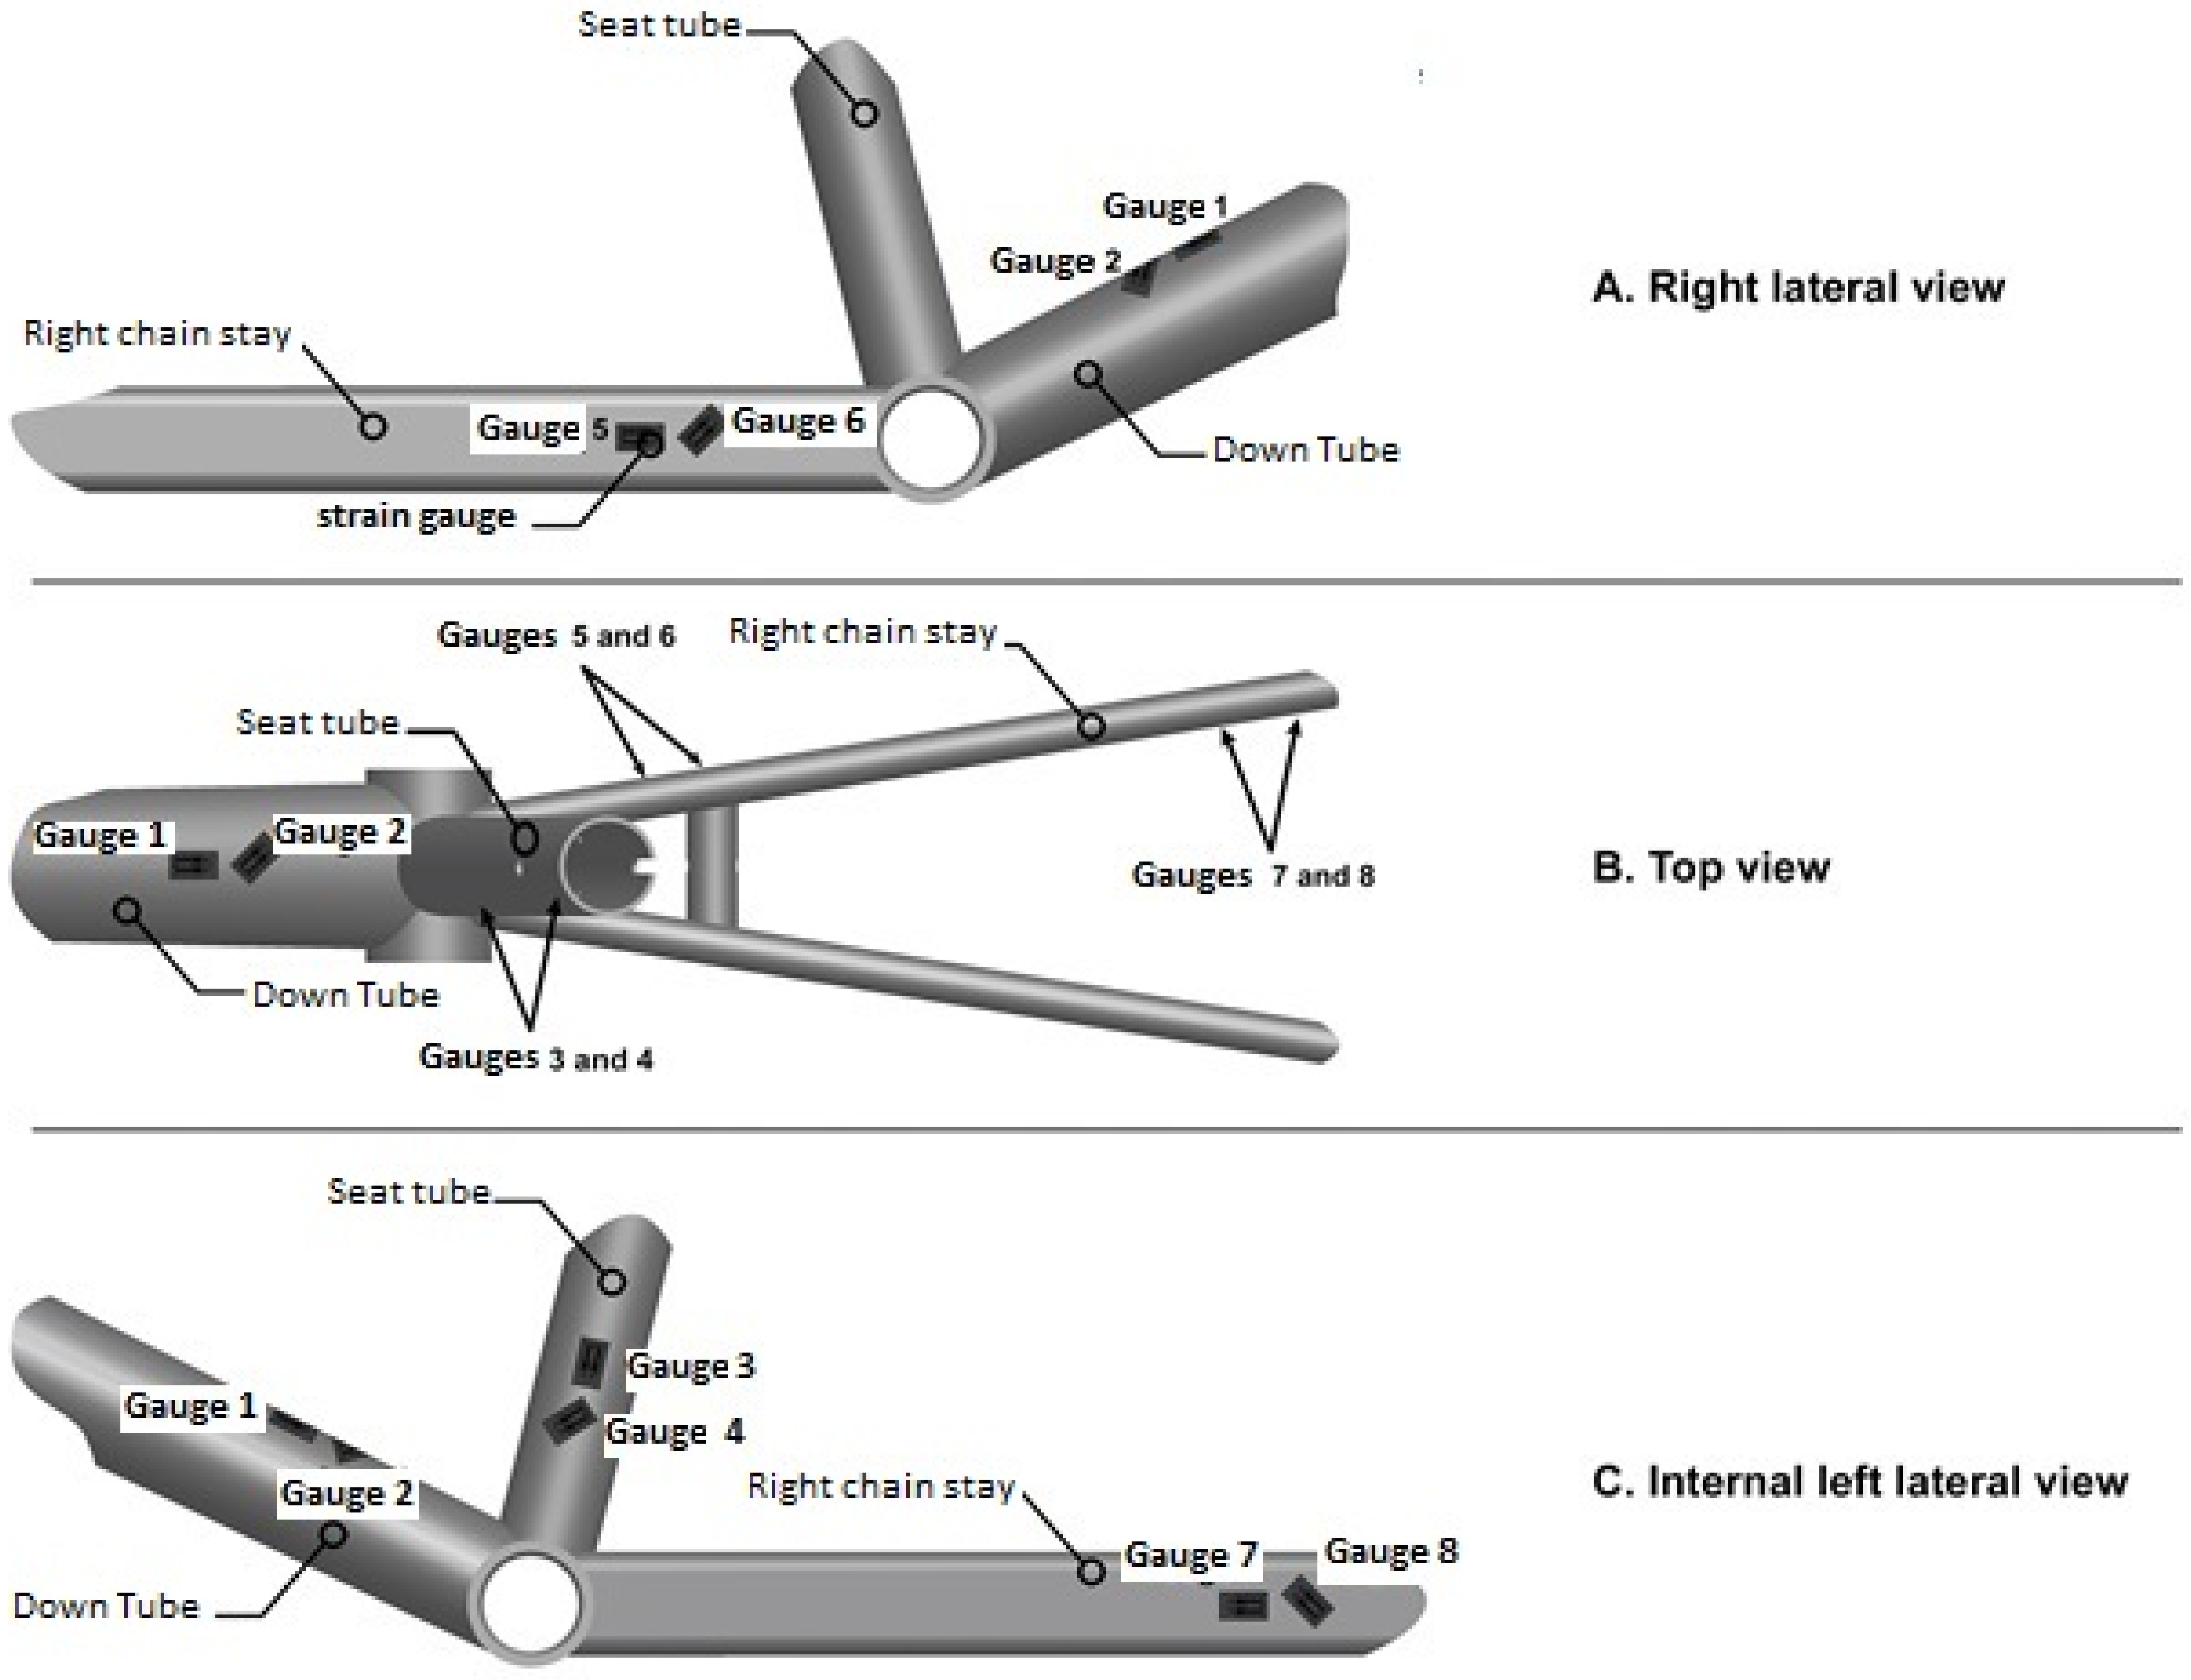
With respect to the finite element analysis results, the eight strain gauges used in this study were placed on the frame as shown in
Figure 2. The gauges were fixed according to the recommendations of the manufacturer (CEA-13-125UN-350, Vishay Measurements, France). Three pairs of gauges were located on the top of the down tube, on the left lateral side of the seat tube, and on the medial side of the right chain stay. Gauges were paired, with one placed parallel to the axis of the tube to analyse the strain in tension/compression, and the other oriented at 45° to the axis of the tube to analyse the strain in torsion. The gauges were located to have at least 30 mm of clearance from the weld. This distance was chosen to avoid strain concentrations at the joints and a changing strain field under the strain gauges [
11].
Figure 2.
Strain gauge locations on the BMX frame.
Figure 2.
Strain gauge locations on the BMX frame.
3.3. Static Experiment
The bicycle frame instrumented with strain gauges was mounted on a test bench with boundary conditions (0 degree of freedom) at the front and rear of the frame. To simulate the perpendicular force applied at the pedal by the rider during pedaling, a system of two manufactured bars (Steel XC 38) was designed and screwed into the bottom bracket. This bar system (
Figure 3) represents the two lever arms (
i.e., crank arm and pedal) applied during the pedaling. The bar that was screwed directly into the bottom bracket, and which is transversal to the frame, represents the distance perpendicular to the frame between the point of force application on the pedal and the center of the bottom bracket (0.14 m). The second bar, parallel to the frame and to the ground, represents the crank length (0.175 m). To simulate perpendicular forces applied on a right pedal by a rider under actual conditions from 40 to 880 N (Personal data), loads from 1 to 18 kg were applied on the bar system (on the right side of the frame) using a steel cable and the resultant strain was recorded. In this test configuration, a load of 18 kg in the bench test corresponds to a force of 880 N applied perpendicularly to the BMX pedal. In the present study, we have chosen to test extreme condition and we have used a maximal load up to 21 kg that corresponds at a perpendicularly pedal force of 1044 N and a crank torque of 179 N.m.
Figure 3.
BMX frame during the static bench test.
Figure 3.
BMX frame during the static bench test.
3.4. Maximal Muscular Isometric Force Applied on a 3-Axis Dynamometric Pedal
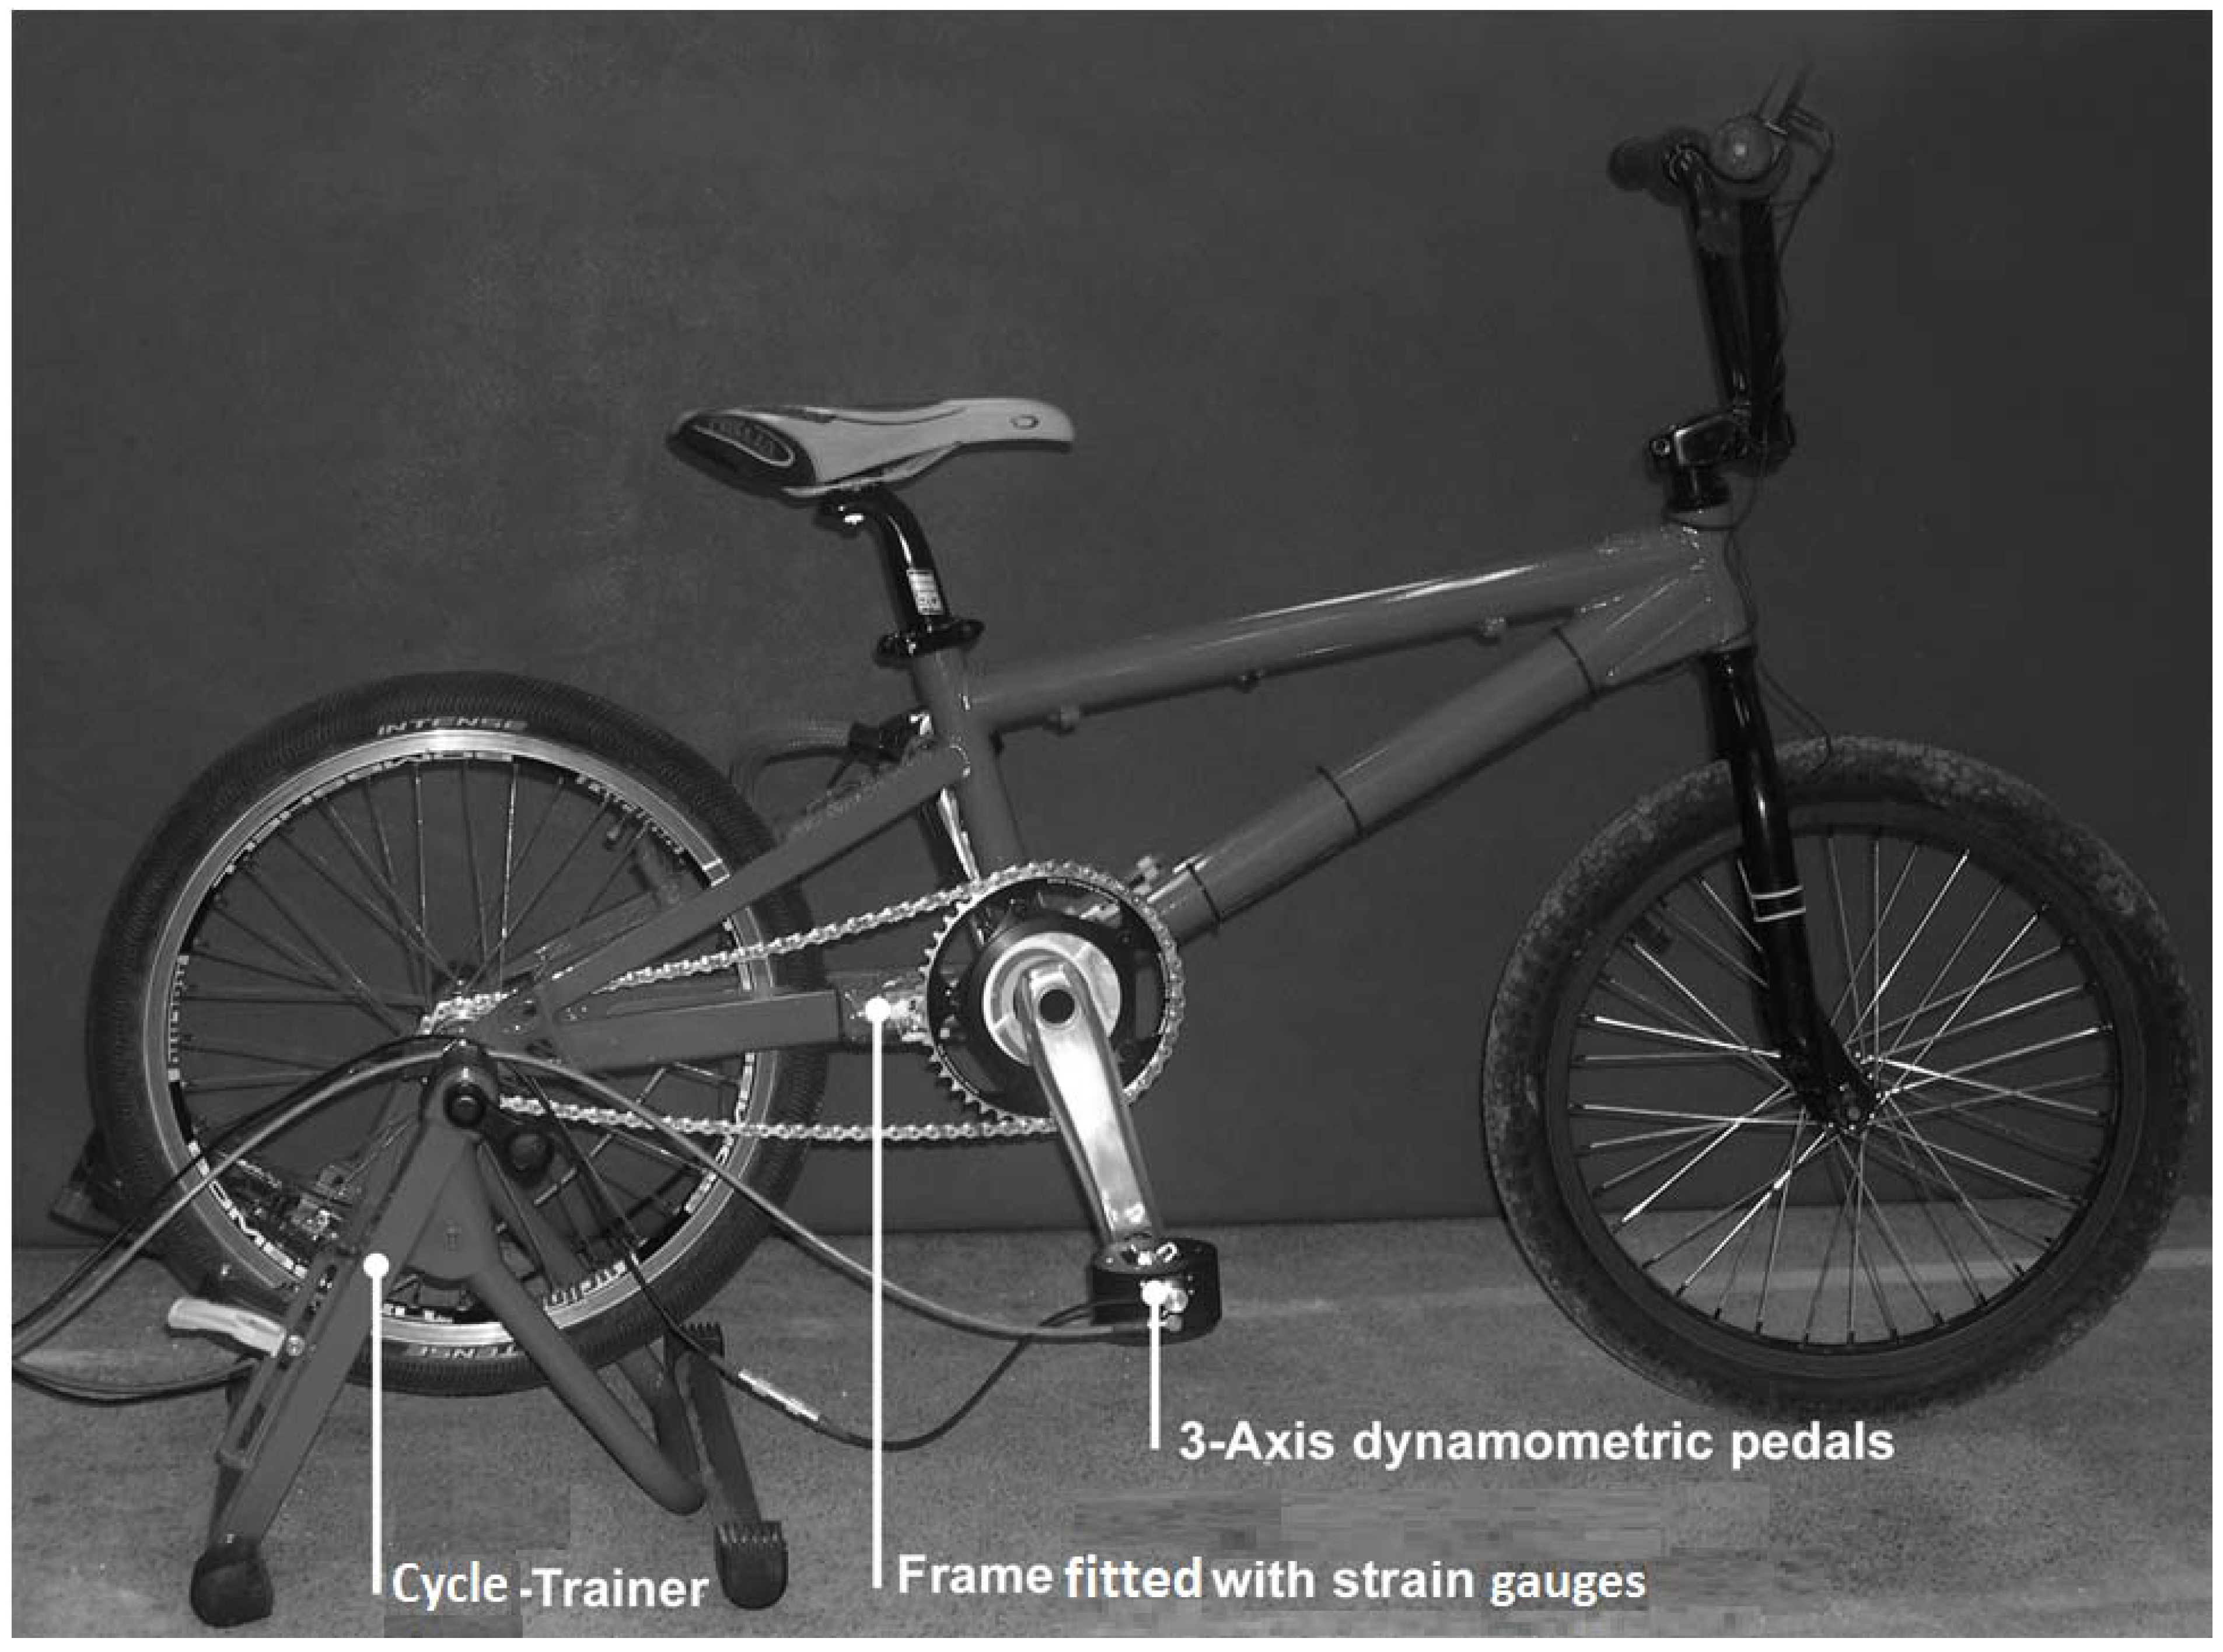
The BMX bicycle was placed on a cycle-trainer through the axis of the rear wheel (
Figure 4). The bicycle was leveled horizontally and equipped with two clipless pedals instrumented with six-component force sensors (Sensix, France). The sampling frequency of these sensors was 250 Hz. These pedals measured antero-posterior and vertical forces applied on the right pedal (F
XP and F
ZP, in N) and the right crank (F
XC and F
ZC, in N) as a function of time. During the trials, the strain as a function of time was recorded with the help of a computer and a dynamic data acquisition system (Model 5100A scanner, Vishay Instruments Division, France) whose sampling frequency was 10 Hz. The rider in standing position was instructed to apply a maximal muscular isometric force on the right pedal. During this exercise, the rider had his hands on the handlebars as in actual conditions. In order to compare the results with the experimental static condition, the cranks (0.175 m) were horizontal, with the right pedal forward. In standing pedaling, the maximal force is applied to the pedal when the angle of the crank is about 140 degrees forward [
12]. However, to allow a maximal muscular isometric force to be applied, the rider had to place the crank in a horizontal position allowing a better configuration for the muscular length of the right leg. The rear wheel was locked. The rider was wearing shoes with an automatic attachment system (
i.e., clipless pedals). The inflation pressure for the front and rear tires were 200 and 250 kPa, respectively.
Figure 4.
BMX bike on cycle-trainer with 3-axis dynamometric pedals and a frame with strain gauges.
Figure 4.
BMX bike on cycle-trainer with 3-axis dynamometric pedals and a frame with strain gauges.
3.5. Pedaling Tests on a Cycle-Trainer
On the cycle-trainer with the same equipment as described previously, the rider pedaled for 10 s in steady-state while in a standing position on the 3-axis dynamometric pedals. The rider was instructed to pedal at three different submaximal intensities: 150, 300 and 550 W at a mean pedaling cadence of 60, 100 and 200 revs·min−1, respectively. Power outputs (W) and pedaling cadences were monitored using a BMX powermeter (SRM Training system, Schoberer Rad Messtechnik, Germany). In order to study the influence of the applied forces by the rider on the frame during pedaling, the vertical and antero-posterior forces were applied on the pedals (FZP and FXP, respectively) and on the cranks (FZC and FXC, respectively) and the frame strains were simultaneously measured as a function of time.
3.6. Statistical Analyses
A matrix of Pearson product-moment correlation coefficients (r) was used to determine the significance between the right peak FZP, FZC, FXP, FXC, the mechanical power output and the peak strain during the pedaling tests on the cycle-trainer. This correlation matrix was performed using the software Statistica 7.1 (StatSoft, France). The significance level was set at p < 0.05. Data are presented as mean values ± SD.
4. Results
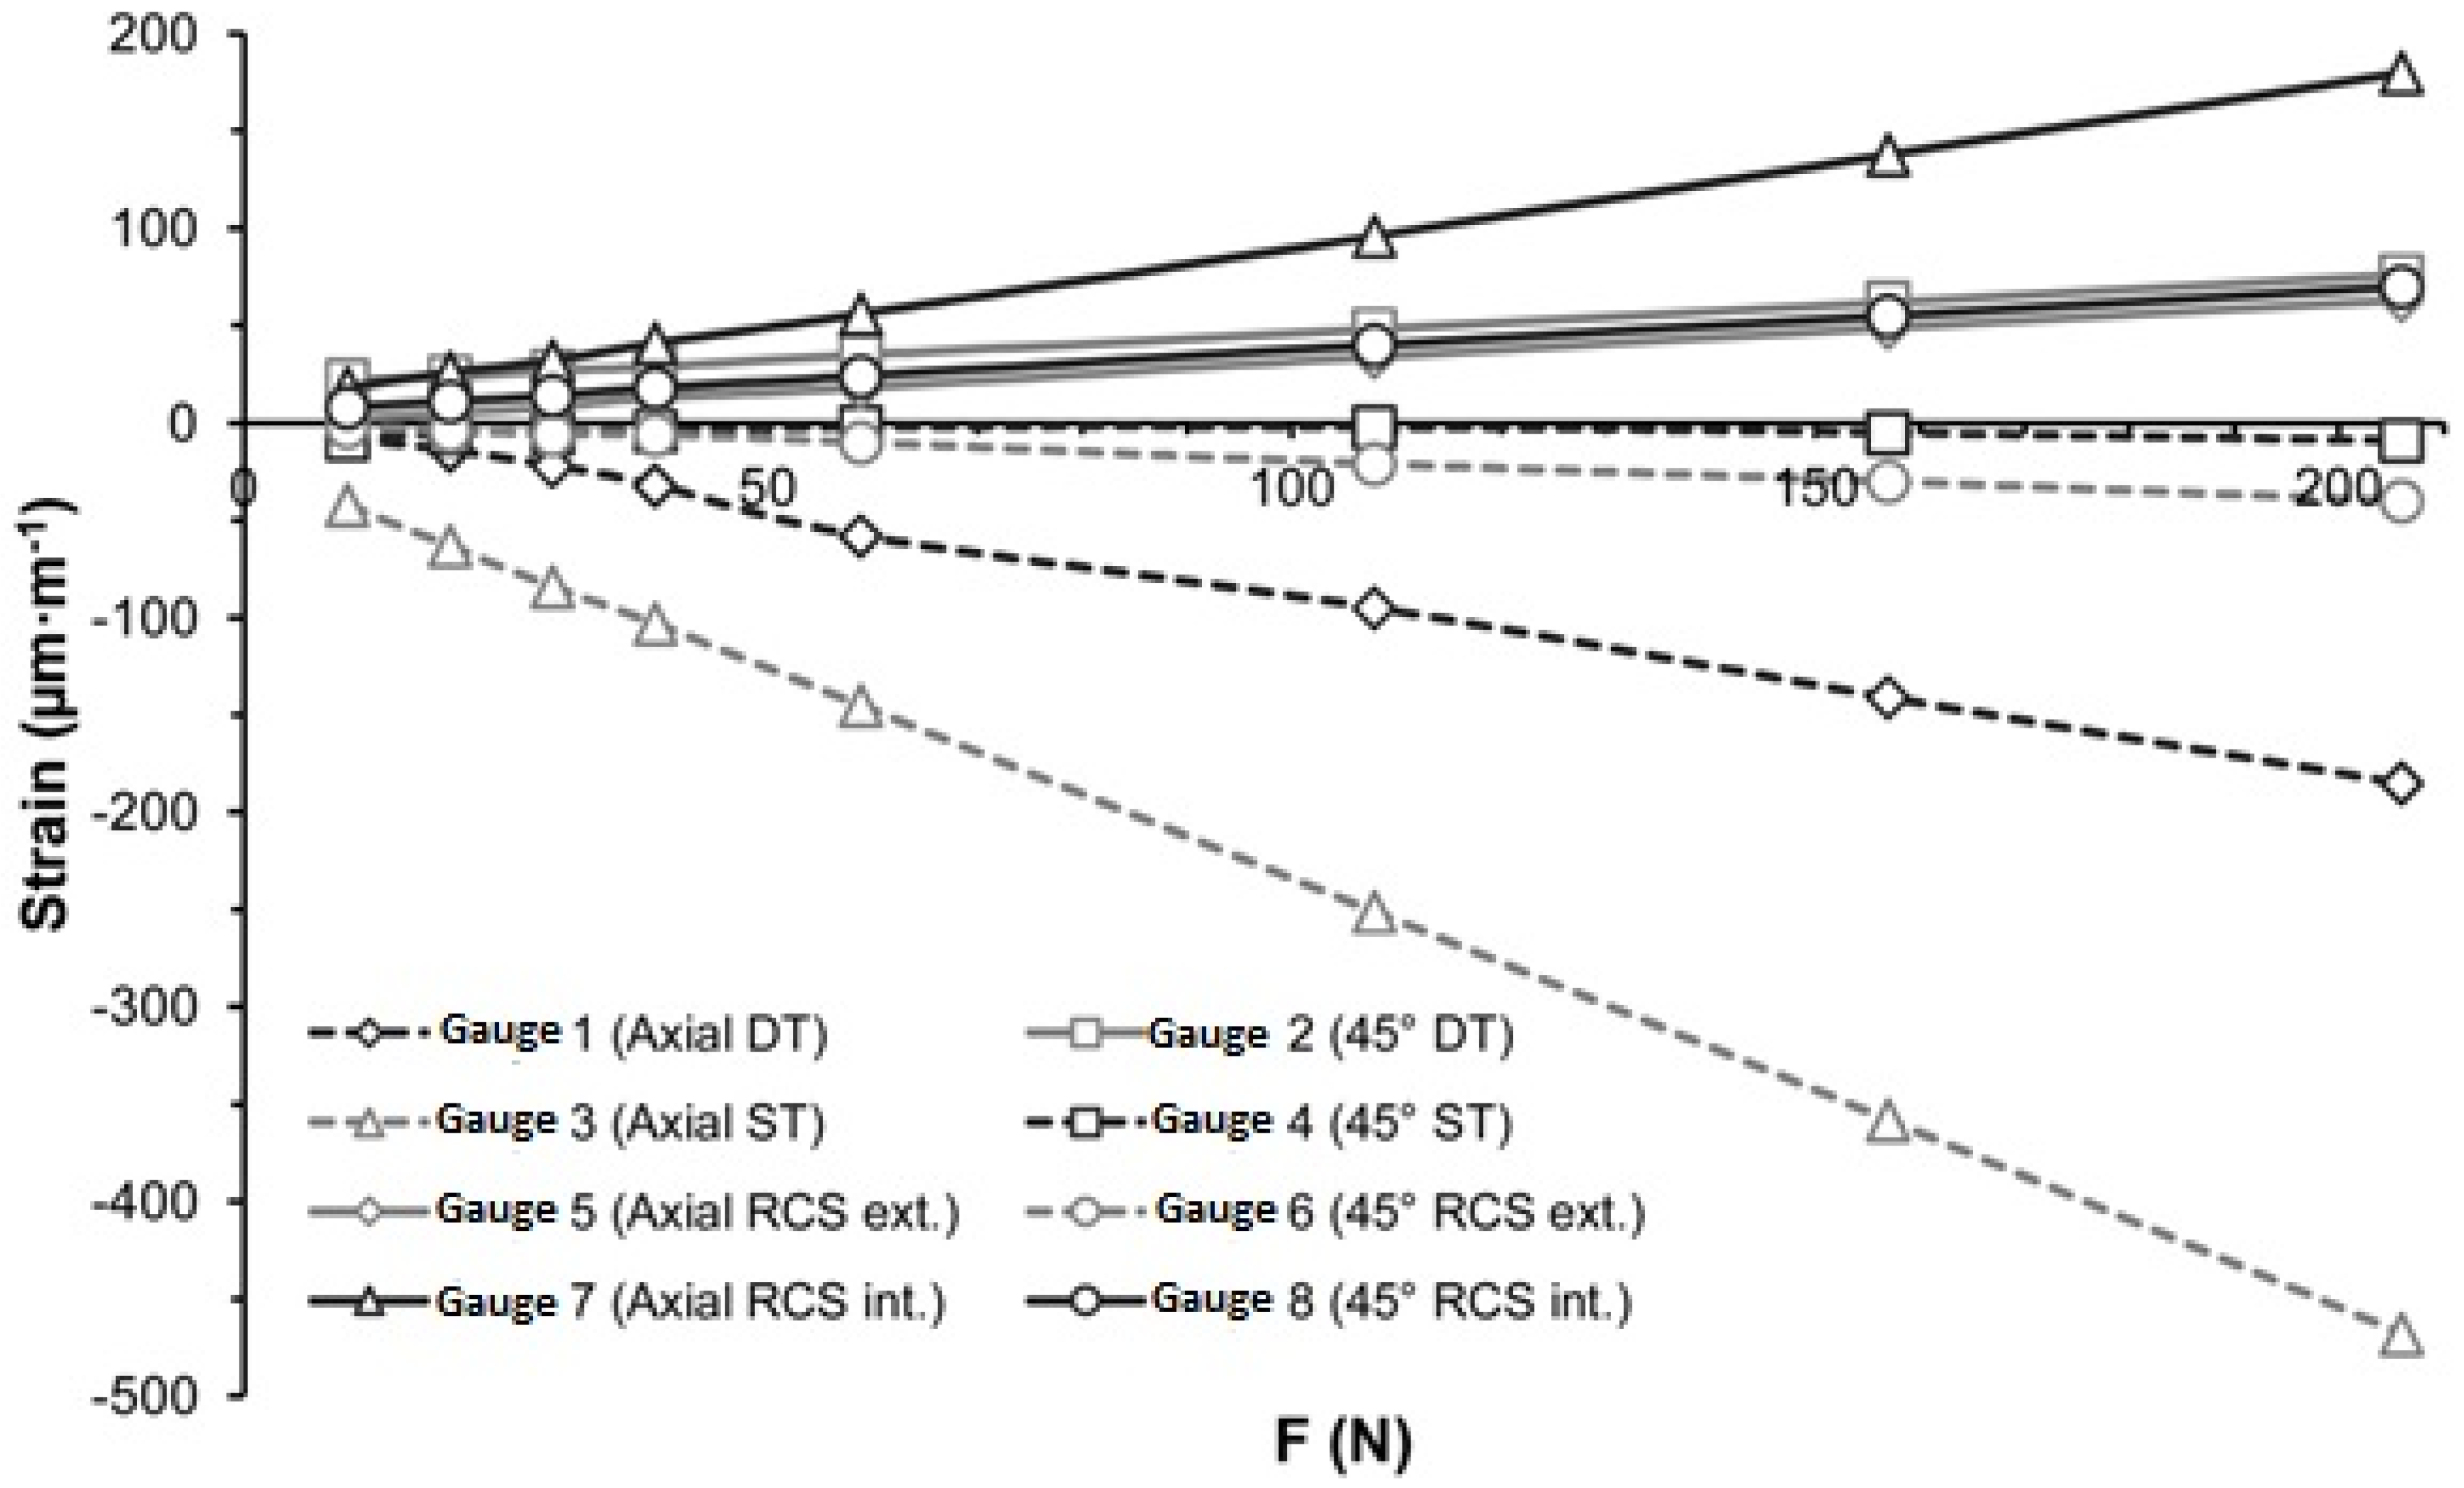
For the static test, the strain increased with applied force (
Figure 5). Strain gauges 2, 5, 7 and 8 measured strain in compression, and gauges 1, 3, and 6 measured strain in tension. The highest strains were recorded on the seat tube (gauge 3), the down tube (gauge 1) and the internal rear right chain stay (gauge 7), with maximal values of 468, 185 and 180 μm/m, respectively (
Table 1).
Figure 5.
Strain in static conditions in applying a force causing a torque about the X and Y axes. DT: Down Tube; ST: Seat Tube; RCS: Right Chain Stay; ext.: external; int.: internal. Positive and negative values represent compression and tension, respectively.
Figure 5.
Strain in static conditions in applying a force causing a torque about the X and Y axes. DT: Down Tube; ST: Seat Tube; RCS: Right Chain Stay; ext.: external; int.: internal. Positive and negative values represent compression and tension, respectively.
Table 1.
Maximum strain and stress measured with strain gauges placed on a bicycle motocross (BMX) frame for different conditions.
Table 1.
Maximum strain and stress measured with strain gauges placed on a bicycle motocross (BMX) frame for different conditions.
| | Bar System | Maximal isometric force | Pedaling tests |
|---|
| | Strain
(µm·m-1) | Stress
(MPa) | Strain
(µm·m-1) | Stress
(MPa) | Strain
(µm·m-1) | Stress
(MPa) |
| Gauge 1 (Axial DT) | 185T | 13.3 | 52T | 3.7 | 6C | 0.4 |
| Gauge 2 (45° DT) | 76C | 5.5 | 328C | 23.6 | 69T | 5 |
| Gauge 3 (Axial ST) | 468T | 33.7 | 408T | 29.4 | 301C | 21.7 |
| Gauge 4 (45° ST) | 9T | 0.6 | 42C | 3 | 48T | 3.5 |
| Gauge 5 (Axial RCS ext.) | 63C | 4.5 | 573T | 41.3 | 58C | 4.2 |
| Gauge 6 (45° RCS ext.) | 40T | 2.9 | 316T | 22.7 | 62C | 4.5 |
| Gauge 7 (Axial RCS int.) | 180C | 13 | 221T | 15.9 | 155T | 11.2 |
| Gauge 8 (45° RCS int.) | 70C | 5 | 32C | 2.3 | 22T | 1.6 |
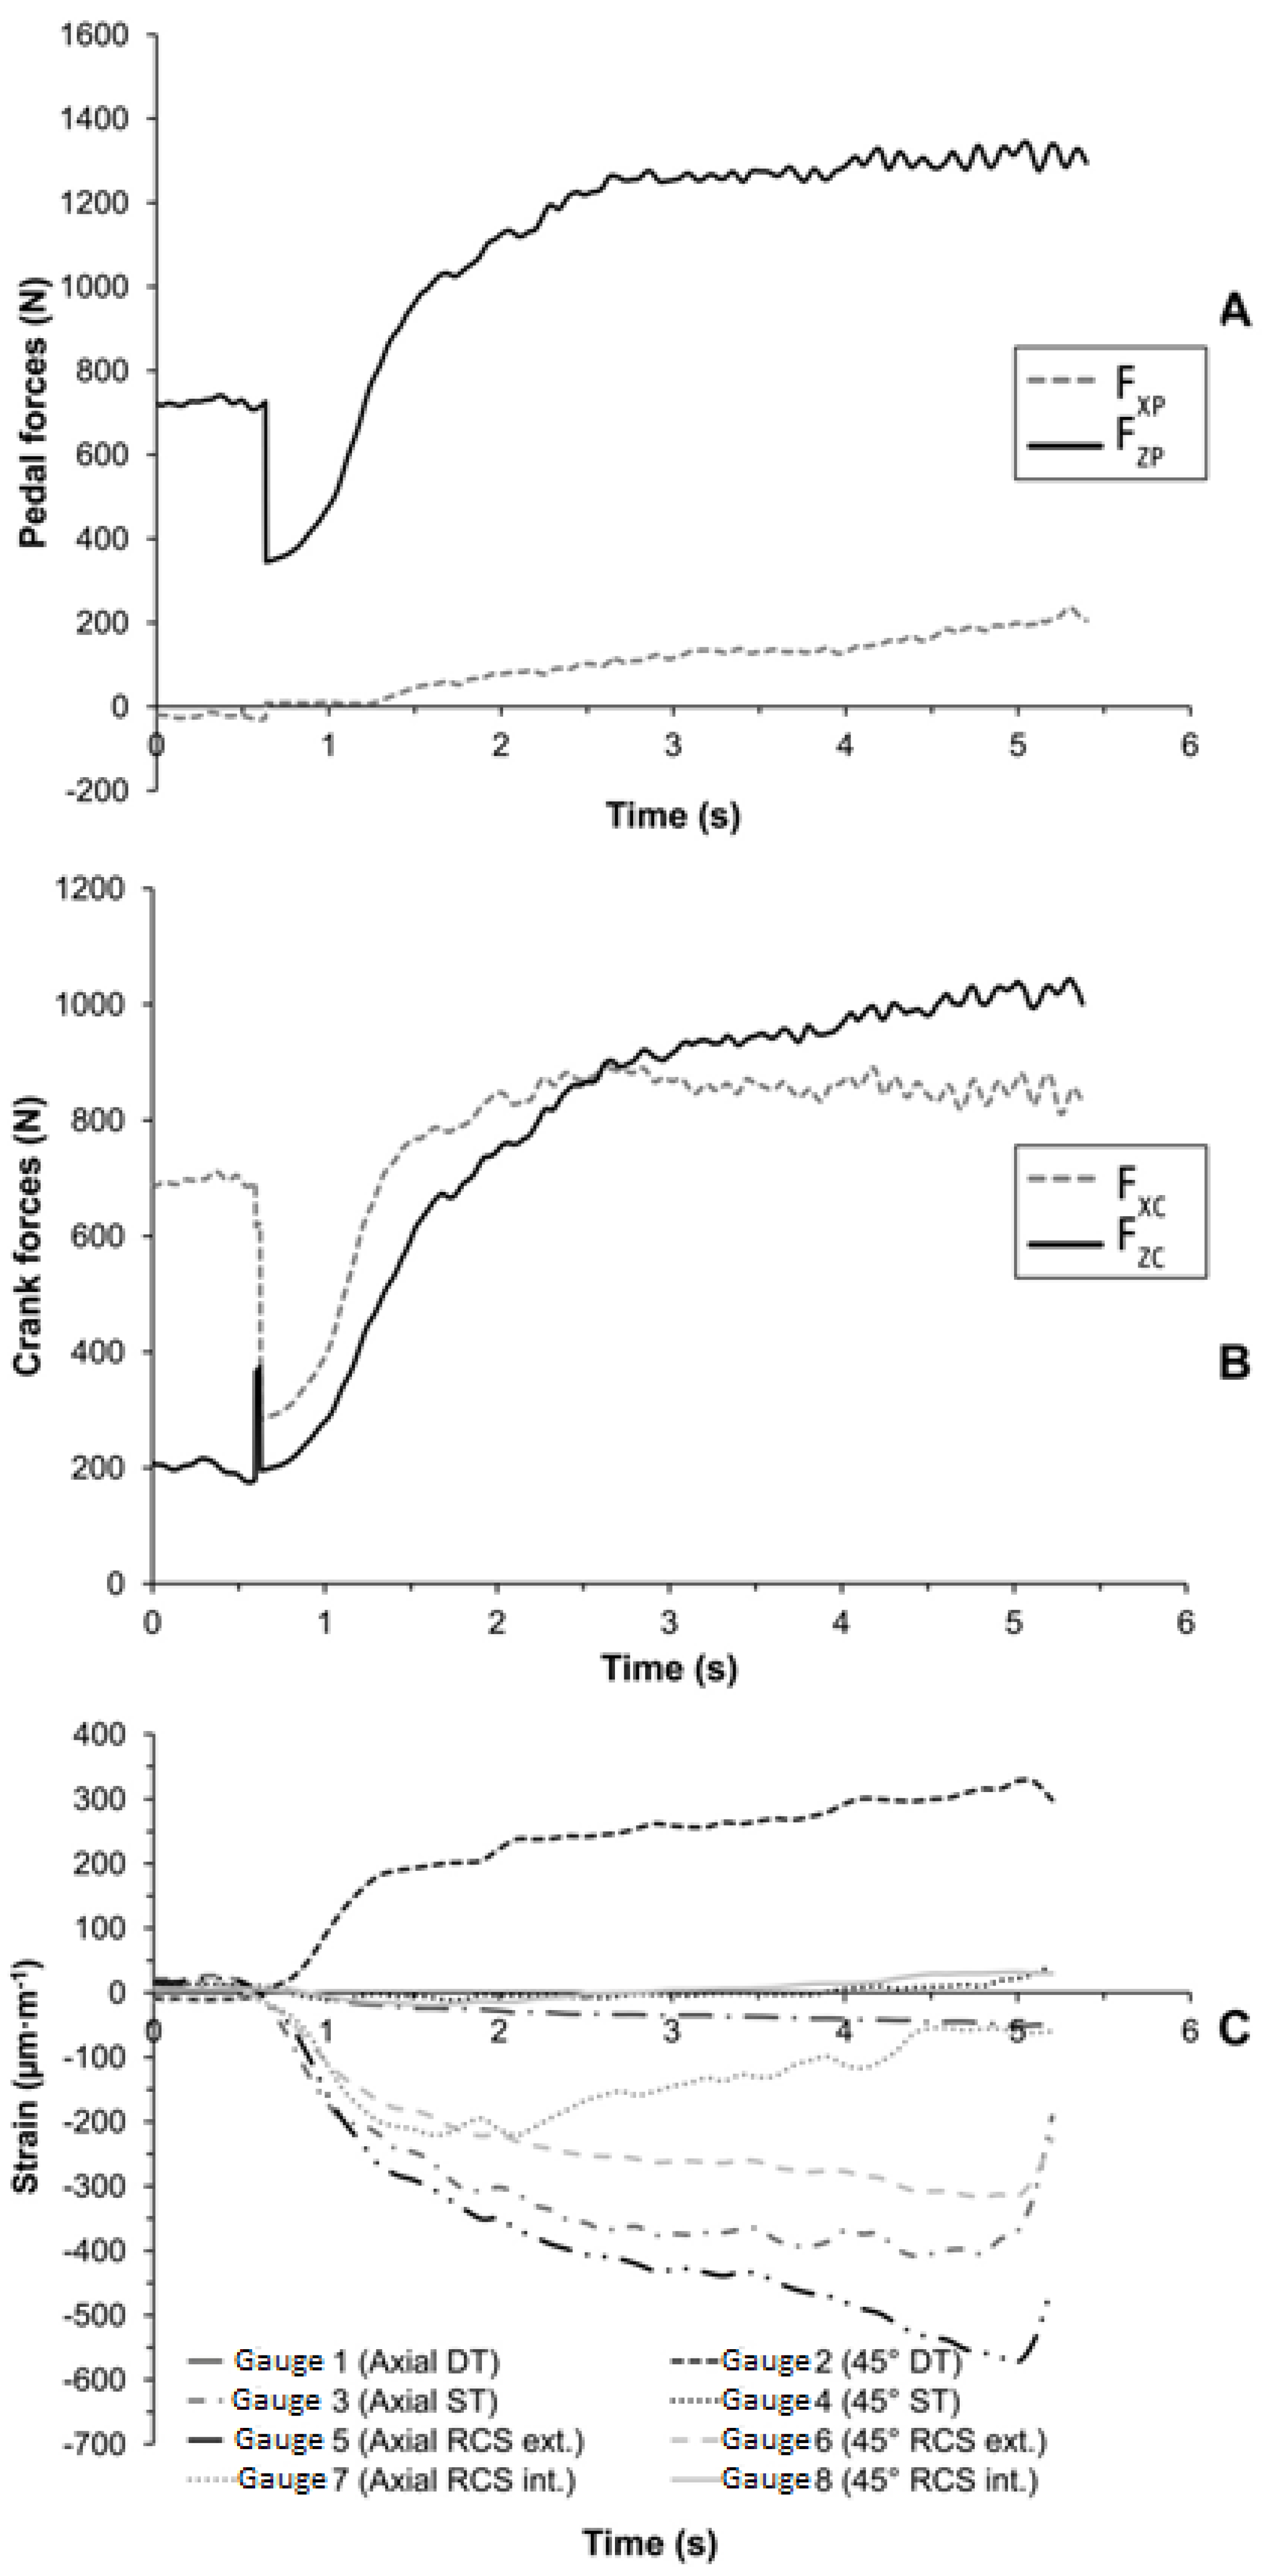
For the maximal muscular isometric effort on the right pedal, F
ZP and F
ZC (vertical forces applied on the right pedal and right crank, respectively) reached maximal peak force of 1344 N and 1035 N (
Figure 6A,B), respectively. At
t = 0.6 s, the rider started to apply a muscular isometric force on the pedal until the maximal force was reached. The frame strains (
Figure 6C) increased with F
ZP and F
ZC, except for gauge 7, located in the rear of the right chain stay. Three gauges measured strain in compression (gauges 2, 4 and 8), and five gauges measured strain in tension (gauges 1, 3, 5, 6 and 7). The largest strains were recorded on the right chain stay (gauges 5, 6 and 7), the seat tube (gauge 3) and the down tube (gauge 2). The maximal strain values recorded were 573, 408, 328, 316 and 221 µm·m
−1 for gauges 5, 3, 2, 6 and 7, respectively (
Table 1).
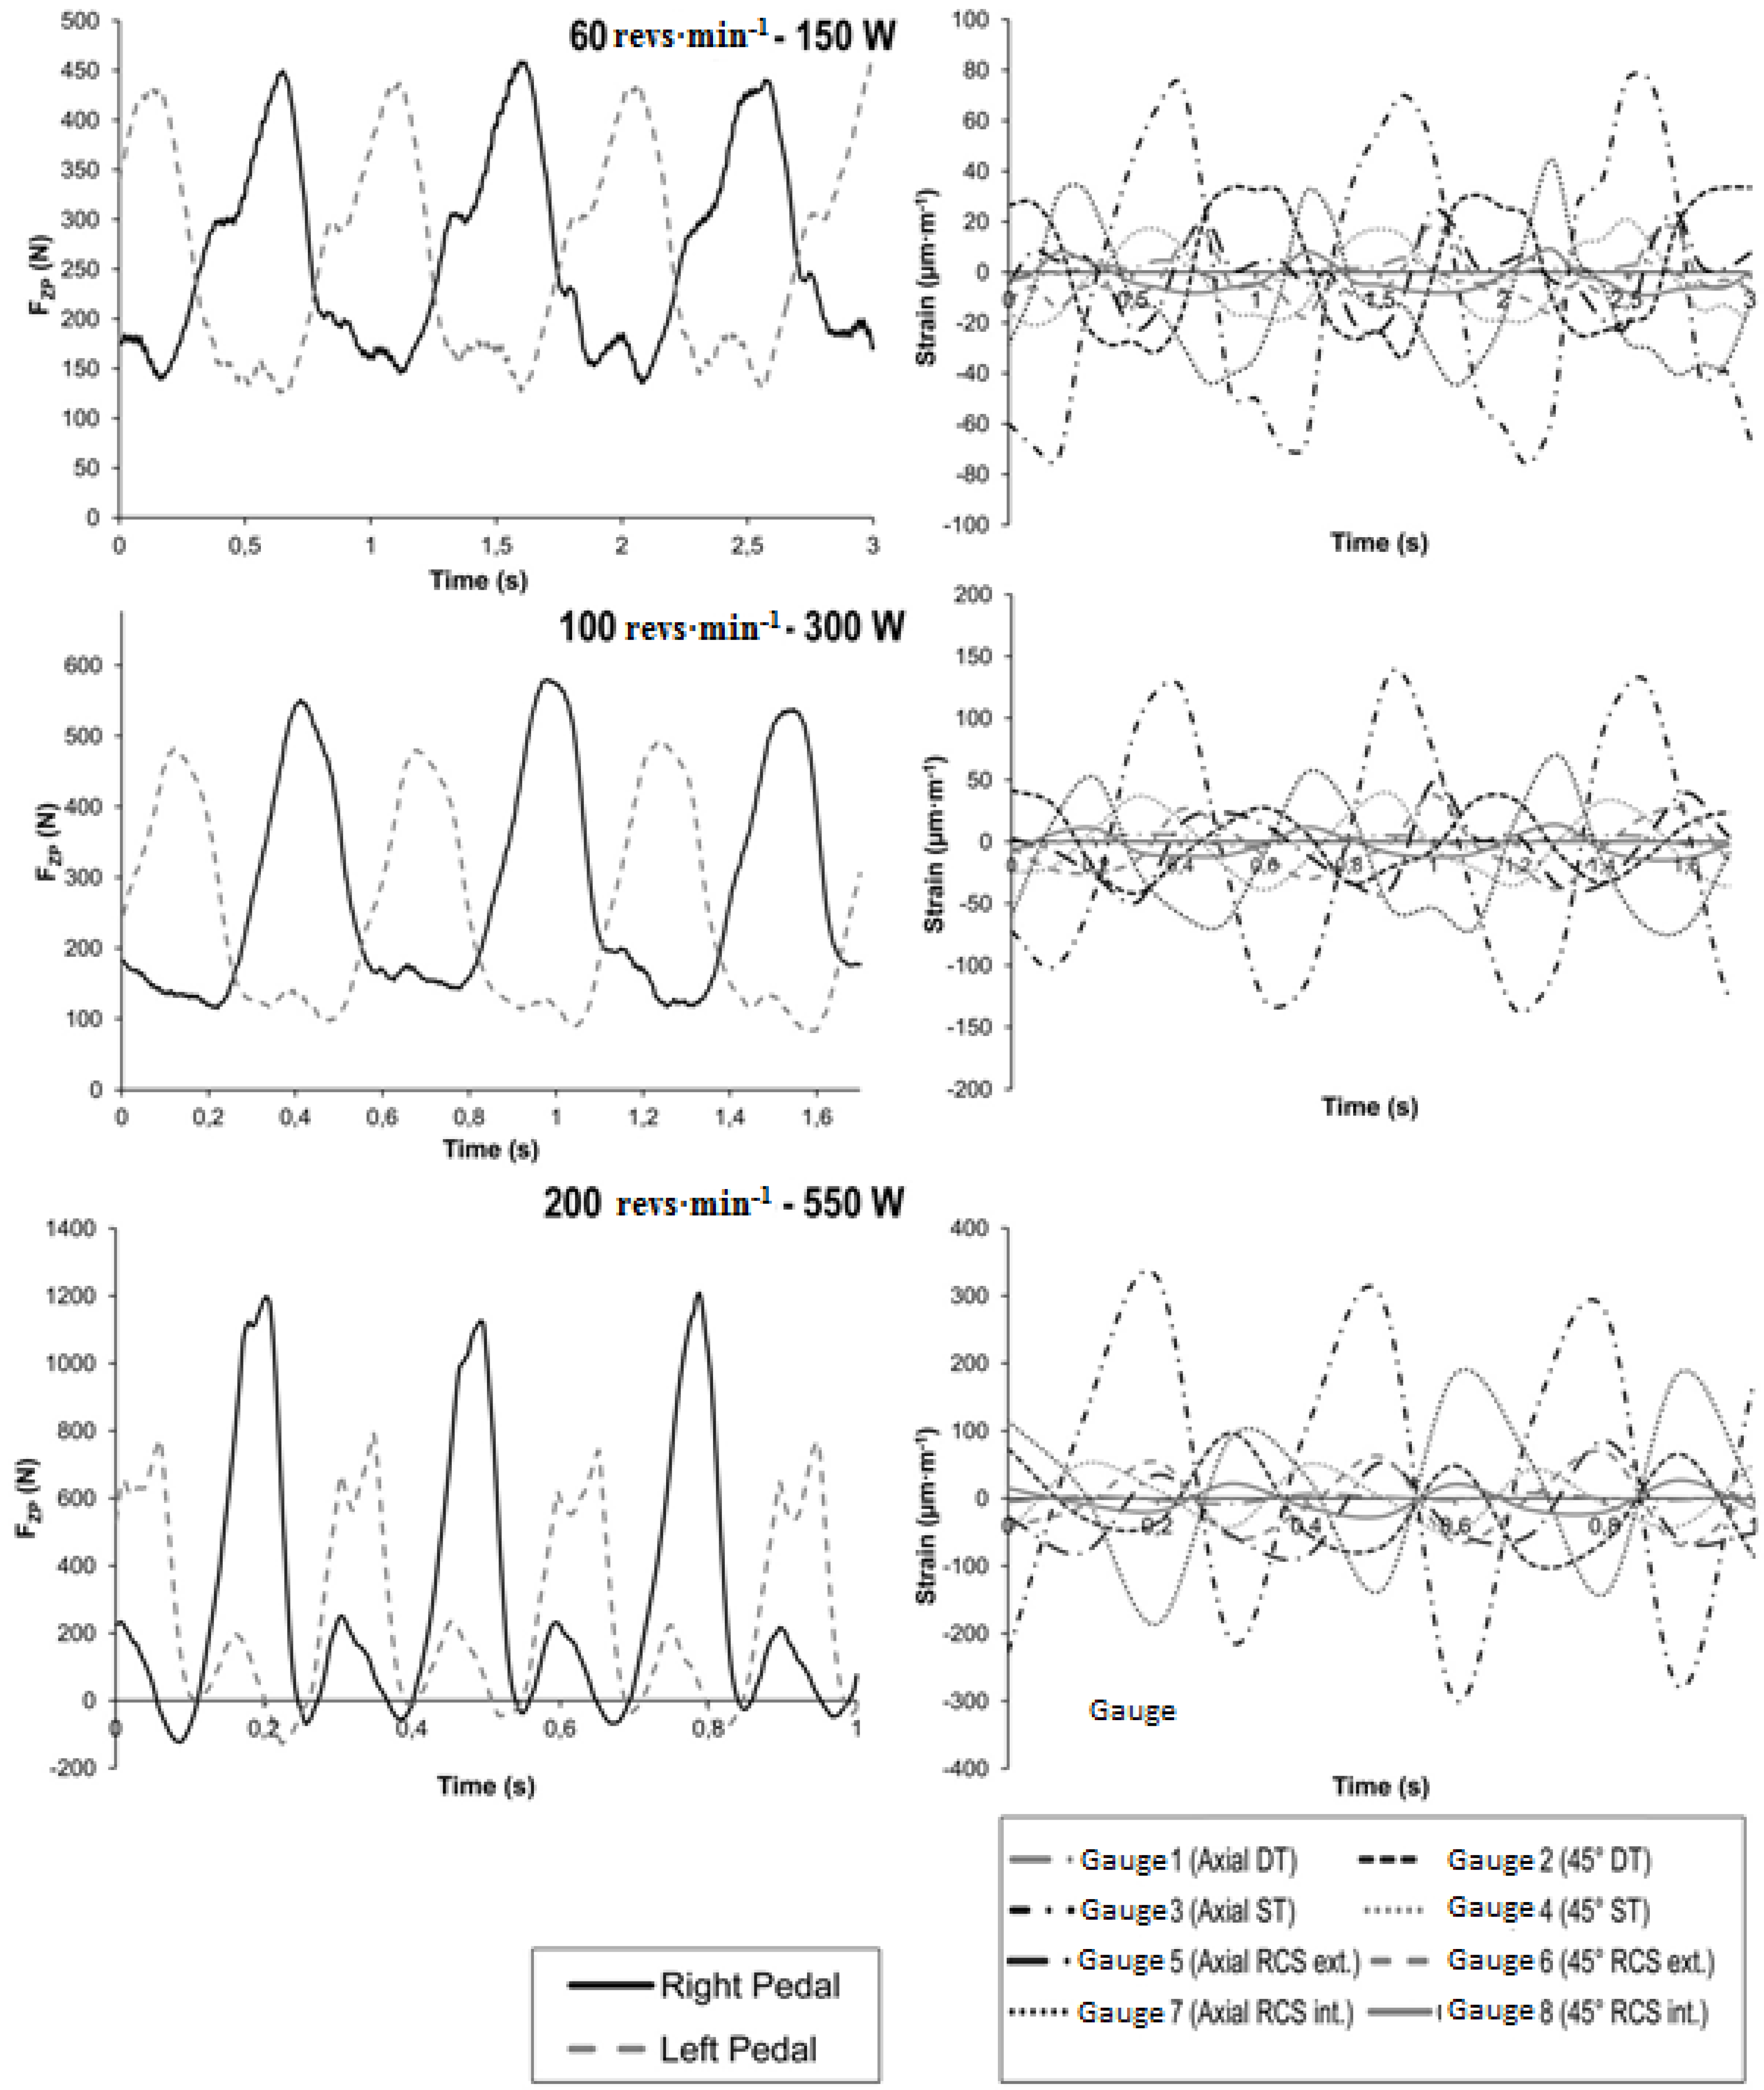
For the pedaling tests on the cycle-trainer, we observed that F
ZP, F
ZC and the peak strains were the highest during the 200 revs·min
−1 pedaling cadence condition (
Table 2).
Figure 7 illustrates three cycles during each condition with the corresponding frame strain. For each pedaling condition, gauge 3 (seat tube) and gauge 7 (internal right chain stay) recorded the highest strains. The
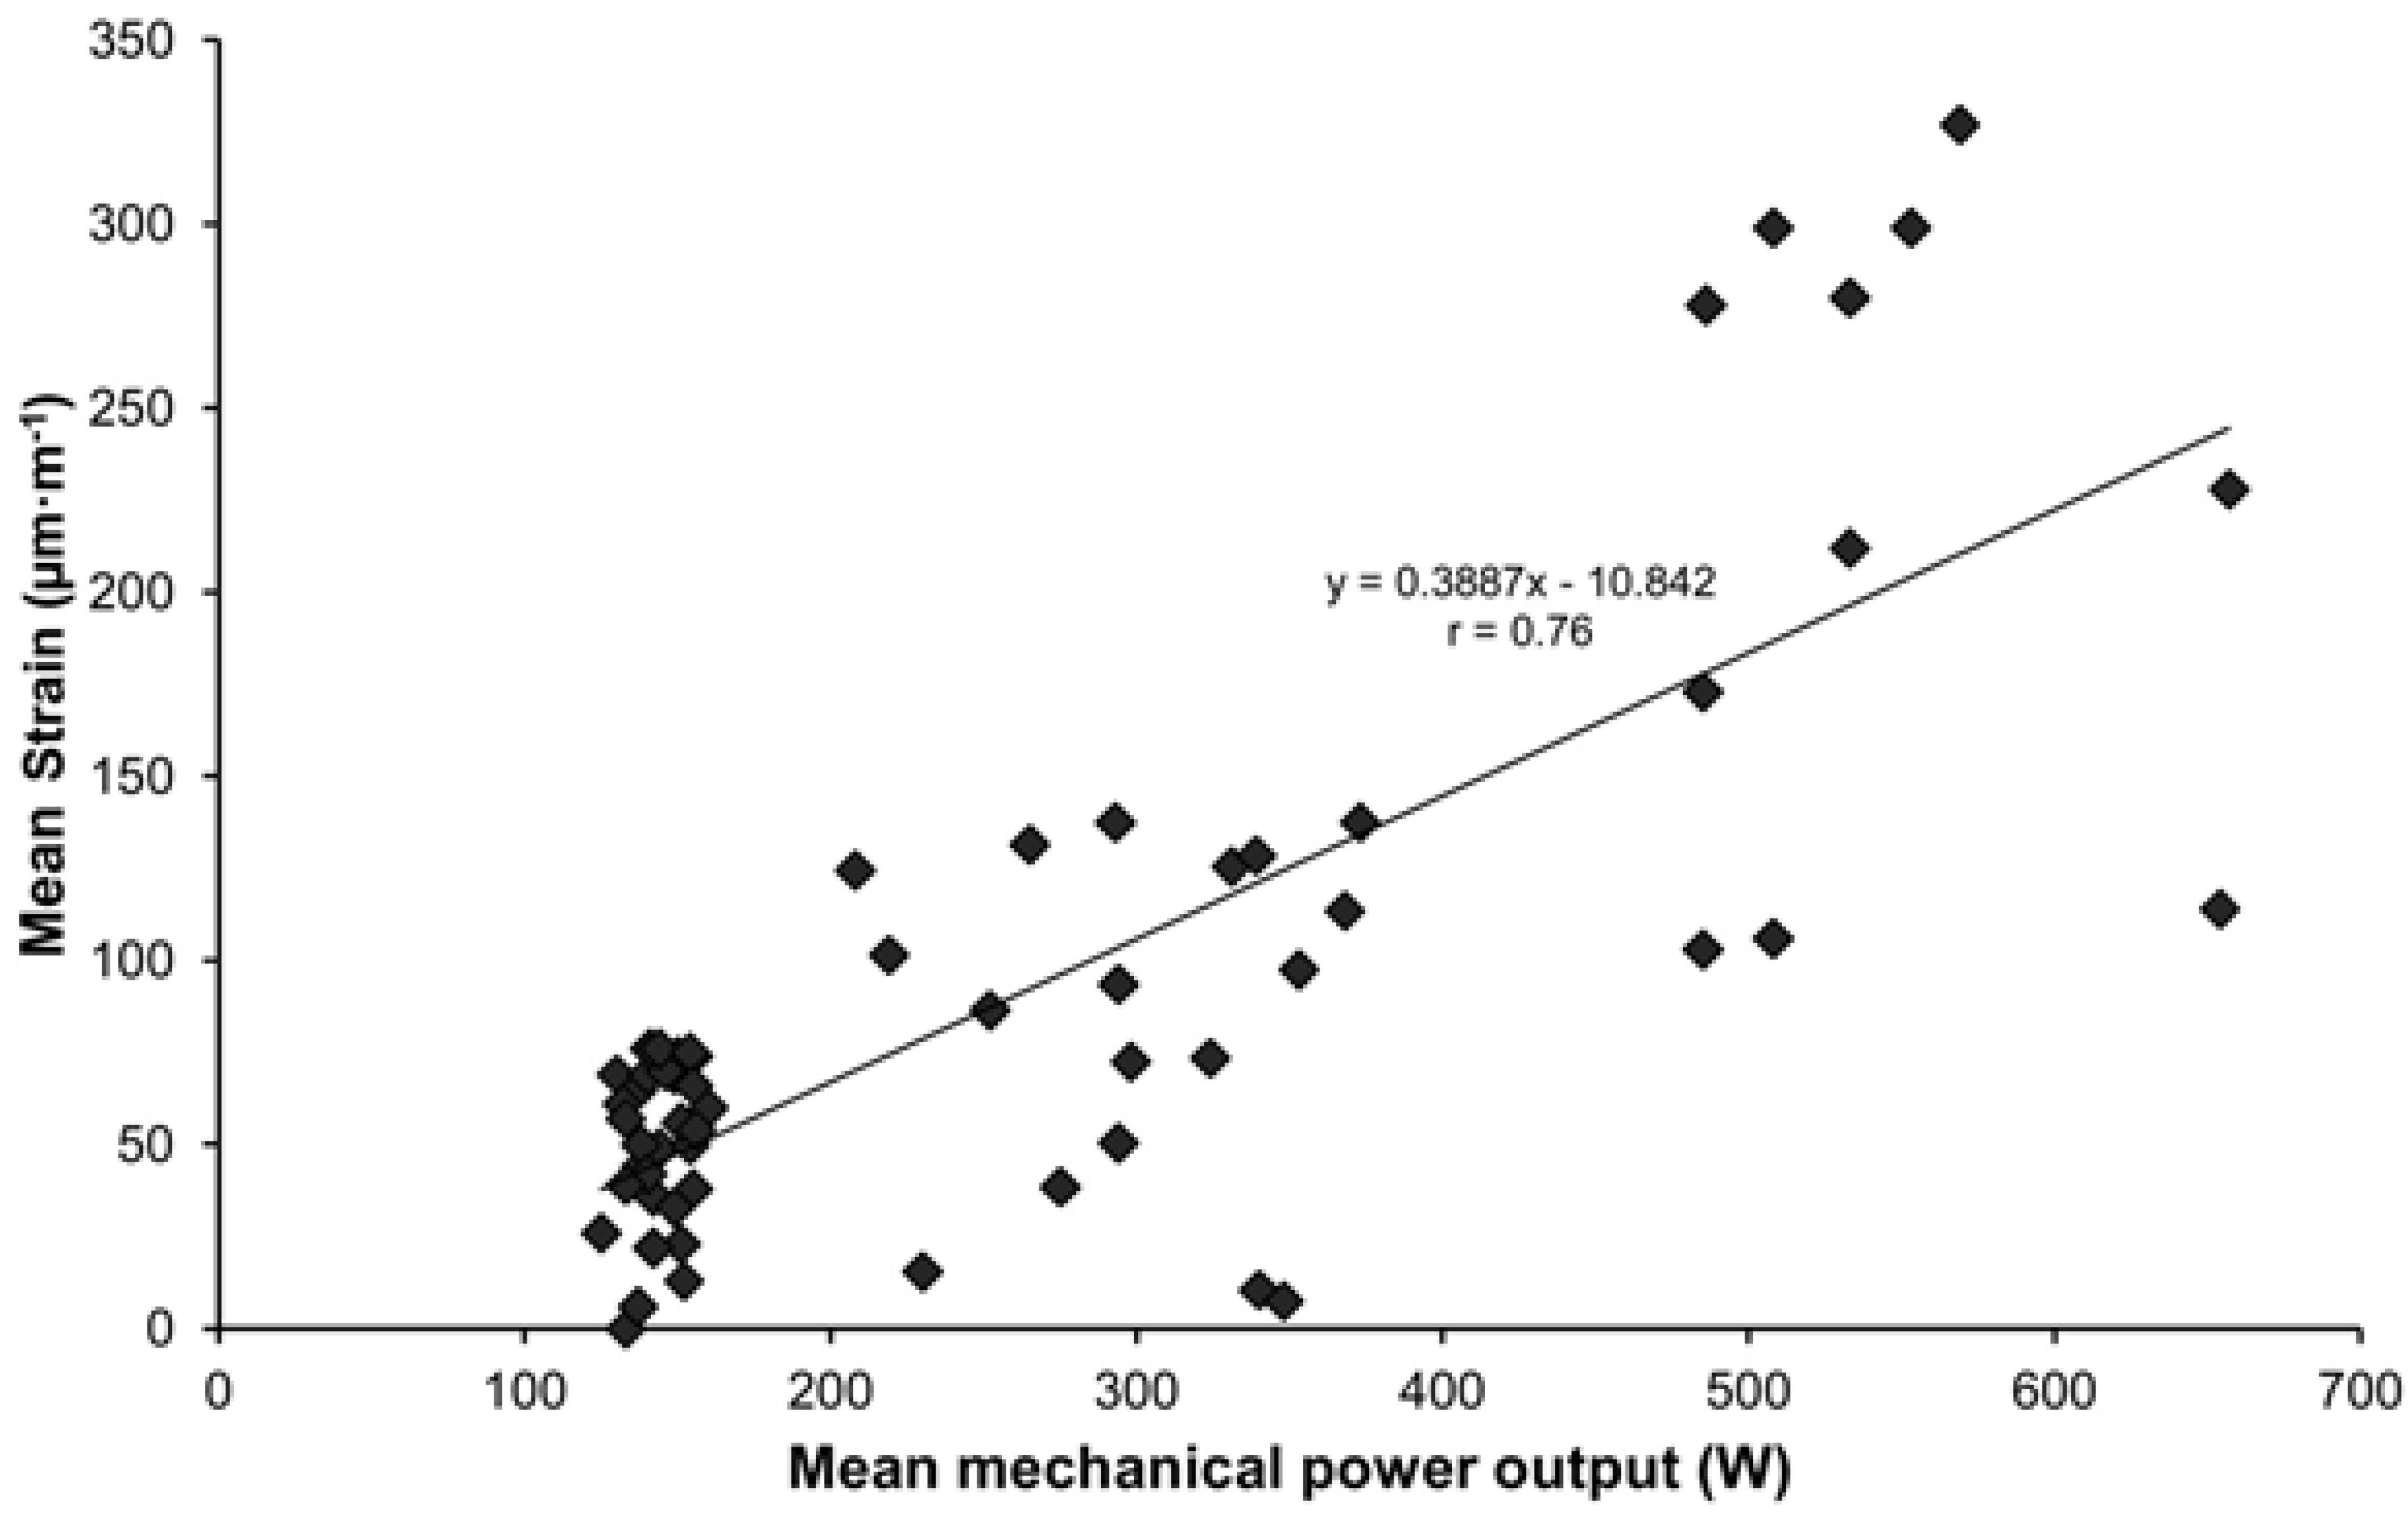
Figure 8 shows the linear regression of the mean strain of a BMX frame as function of the mean mechanical power output during pedaling on a cycle-trainer.
The matrix of Pearson product-moment correlation coefficients show that F
ZP, F
XP, F
ZC, F
XC and P during pedaling tests were significantly correlated with the frame strain for almost all gauges (
Table 3). No correlation has been observed with the strain in gauge 1 (down tube), between F
ZP and the strain in gauge 5 (external right chain stay) and between power output and the strain in gauge 8 (internal right chain stay).
Table 2.
Mean values (SD) of the forces applied to the right pedal and crank during pedaling tests on a cycle-trainer. All forces are in N, and strains in µm·m−1.
Table 2.
Mean values (SD) of the forces applied to the right pedal and crank during pedaling tests on a cycle-trainer. All forces are in N, and strains in µm·m−1.
| | Pedaling Conditions |
|---|
| | 60 rpm
150 W | 100 rpm
300 W | 200 rpm
500 W |
| FZP | 449 ± 9 | 556 ± 22 | 1177 ± 45 |
| FXP | 18 ± 8 | 18 ± 2 | 41 ± 9 |
| FZC | 388 ± 53 | 271 ± 156 | 970 ± 51 |
| FXC | 210 ± 89 | 466 ± 74 | 667 ± 24 |
| Gauge 1 (Axial DT) | 5 ± 1 | 5 ± 1 | 6 ± 3 |
| Gauge 2 (45° Axial DT) | 30 ± 5 | 36 ± 5 | 69 ± 30 |
| Gauge 3 (Axial ST) | 73 ± 3 | 132 ± 6 | 301 ± 25 |
| Gauge 4 (45° ST) | 18 ± 2 | 36 ± 3 | 48 ± 5 |
| Gauge 5 (Axial RCS ext.) | 23 ± 1 | 41 ± 7 | 58 ± 25 |
| Gauge 6 (45° RCS ext.) | 17 ± 2 | 30 ± 7 | 62 ± 8 |
| Gauge 7 (Axial RCS int.) | 43 ± 2 | 69 ± 1 | 155 ± 27 |
| Gauge 8 (45° RCS int.) | 8 ± 1 | 13 ± 2 | 22 ± 4 |
Table 3.
Correlation coefficients during pedaling tests on a cycle-trainer.
Table 3.
Correlation coefficients during pedaling tests on a cycle-trainer.
| | FZP (N) | FXP (N) | FZC (N) | FXC (N) | P (W) |
|---|
| Gauge 1 (Axial DT) (µm·m-1) | 0.29 | 0.37 | 0.22 | 0.37 | -0.09 |
| Gauge 2 (45° Axial DT) (µm·m-1) | 0.76* | 0.79* | 0.70* | 0.69* | 0.53* |
| Gauge 3 (Axial ST) (µm·m-1) | 0.98* | 0.83* | 0.88* | 0.89* | 0.76* |
| Gauge 4 (45° ST) (µm·m-1) | 0.84* | 0.72* | 0.68* | 0.90* | 0.42* |
| Gauge 5 (Axial RCS ext.) (µm·m-1) | 0.70* | 0.67* | 0.58 | 0.74* | 0.64* |
| Gauge 6 (45° RCS ext.) (µm/m) | 0.96* | 0.88* | 0.86* | 0.89* | 0.48* |
| Gauge 7 (Axial RCS int.) (µm·m-1) | 0.97* | 0.75* | 0.88* | 0.86* | 0.62* |
| Gauge 8 (45° RCS int.) (µm·m-1) | 0.89* | 0.90* | 0.75* | 0.87* | 0.22 |
Figure 6.
Antero-posterior and vertical forces on right pedal (FXP and FZP) (A) and crank (FXC and FZC) (B) and frame strain recorded (C) during maximal isometric effort on the right pedal with help of the handlebars. DT: Down Tube; ST: Seat Tube; RCS: Right Chain Stay; ext.: external; int.: internal.
Figure 7.
Perpendicular forces to right pedal and frame strain recorded during three bouts of steady-state pedaling at different intensity: 150, 300 and 550 W on a cycle-trainer. FZP: Force perpendicular to pedal; DT: Down Tube; ST: Seat Tube; RCS: Right Chain Stay; ext.: external; int.: internal.
Figure 7.
Perpendicular forces to right pedal and frame strain recorded during three bouts of steady-state pedaling at different intensity: 150, 300 and 550 W on a cycle-trainer. FZP: Force perpendicular to pedal; DT: Down Tube; ST: Seat Tube; RCS: Right Chain Stay; ext.: external; int.: internal.
Figure 8.
Linear regression of the mean strain of a BMX frame as function of the mean mechanical power output during pedaling on a cycle-trainer.
Figure 8.
Linear regression of the mean strain of a BMX frame as function of the mean mechanical power output during pedaling on a cycle-trainer.
5. Discussion
The aim of this study was to investigate the effect of forces applied to 3-axis dynamometric pedals on the local strain response of an instrumented BMX frame under various conditions. These results have been analysed and compared to other studies e.g., [
7,
8,
9,
13]. The strain observed in the frame tubes increases with the forces perpendicular to the pedal and crank applied by the rider, for all conditions. The absolute maximum strain values were observed under the conditions of maximal muscular isometric effort (
Table 1). These values were observed in the seat tube (gauge 3: 468 μm·m
−1) and the right chain stay (gauge 5: 573 μm·m
−1), with corresponding forces F
ZP of 880 and 1350 N, respectively. The maximum stress calculated according to the Von Mises criterion is equal to 41 MPa for the right chain stay (gauge 5), during the maximal isometric effort condition (
Figure 6 and
Table 1). The yield strength of the aluminum alloy used is 460 MPa so the measured stress is 11 times smaller than the yield strength so that the system remains elastic. At this stress, there is no possibility for the frame tubes to break, assuming critical flaws are not present. For a static load of 445 N, applied to a horizontal crank, Davis and Hull [
7] observed the strain in the bottom bracket area with gauges on an aluminum road bicycle frame. They measured stresses from 30.4 to 39.7 MPa. These values are consistent with our results even though the applied force was two times greater in our study. This can be explain by difference in muscular characteristics of the cyclist that have participated at these two studies. In our study, the subject was a BMX rider with high force muscular capacity contrary to the Davis and Hull study [
7]. This can also be explained by the difference in the materials of the studied frames. The road bicycle frame was aluminum 6061-T6, with a Young’s modulus of 69 GPa and a yield strength of 250 MPa, whereas in our study the aluminum alloy was 7005 with a Young’s modulus of 72 GPa and a yield strength of 460 MPa. Moreover, the road bicycle frame tubes are thinner and lighter than those in a BMX frame. These reasons can explain the higher stress observed by Davis and Hull (1981) in the bottom bracket area.
Arola
et al. [
8] studied the static strain in a BMX bicycle frame composed of titanium alloy (Ti6Al4V) for most tubes and aluminum alloy (6061-T6) for the head tube and bottom bracket. Loads were applied vertically on the pedals but the position of the crank was not specified. The strain observed in the joint between the down tube and the head tube was approximately 110 μm·m
−1 for 910 N. This value seems consistent with our result even though we did not study the head tube area. Moreover, the yield strength of the titanium alloy is 830 MPa with a Young’s modulus of 105-120 GPa, so smaller strains are expected for comparable geometries.
During the pedaling tests (
Table 1 and
Table 2,
Figure 7), the maximum strain values were observed for the 200 revs·min
−1 pedaling cadence test condition (550 W) in the seat tube (gauge 3: 301 ± 25 μm·m
−1). We also observed a significant correlation (
Table 3,
Figure 8) between the power output at the crank and the frame strain. Watt
et al. [
9] found a similar correlation, but they did not mention the measured strain during their experiment. Despite a high value of perpendicular force on the pedal, from 1200 to 1350 N, most of the frame tubes show a relative low strain. The bench tests have exhibited more strain than the dynamic ones. During the pedaling test, the front wheel was not fixed and static contrary during the bench test where the front fork was rigidly connected. This difference could be explained, in part, by the difference between the two experimental conditions.
During a BMX race, jumps and landings from different heights occur and could cause high strain in the frame. The results of Arola
et al. [
8] mean that if an impact occurs at a speed of 10 m.s
−1, the BMX frame will be destroyed, even though the frontal impact on the front wheel is not a current event in a BMX race. In actual competition, the height jumps can be higher than 2 m. However, the technical skills of the riders enables the impact on landing to be reduced. Landings from high jumps are usually made on inclined planes, which further reduces the impact. A high impact would mean a failed landing, a loss of time, and, thus, a lost race. To verify this assumption, further study of the frame strain during a complete lap on a BMX track should be undertaken.
The different conditions highlighted the localisation of the highest strain in the tubes near the bottom bracket and the rear wheel axis. The use of 3-axis dynamometric pedals and strain gauges allow measurement of the input forces and knowledge of the corresponding stresses on the bicycle frame as function of the force applied to the pedal and crank. This information can be important for the process of frame design. Moreover, the results suggest that the vertical and antero-posterior forces on the pedal and crank show significant correlation with the frame strain during pedaling. The highest correlations were observed in the seat tube and the right chain stay with the force perpendicular to pedal. Although the force perpendicular to the crank is the motor force which contributes to crank rotation, it appears that the correlation is stronger between the frame and the force perpendicular to pedal. However, there is no way to distinguish the effect of a specific force on the frame strain although the pedaling condition was executed on a cycle-trainer, which does not allow a lateral tilt of the frame. The lateral tilt is encountered during standing pedaling in BMX and it could change the force pattern. This hypothesis is confirmed by the fact that the sprint performances in standing position were lower in laboratory conditions with no lateral tilt [
14]. Indeed, some riders could produce high forces on pedals but with a low index of efficiency [
12]. These inefficient pedaling forces could contribute to the largest strain, and the loss of energy to the frame could be a significant source of reduced performance. Studies should be conducted under actual conditions to determine the correlation between frame strain and the applied forces on the pedals and cranks and in order to see if frame tilt has an influence on frame strain. De Lorenzo and Hull have analysed the strain on the handlebar and on the hubs of both wheels on mountain bike in actual condition. However, it is difficult to compare their results with our study because they didn’t instrument the frame and they didn’t specifically explore the link between frame load and pedal forces.
For a perpendicular pedal force greater than 1300 N, the maximum stress observed during these tests was 11 times smaller than the yield strength of the aluminum alloy 7005. One of the major results of this study was that the safety coefficient of this bicycle frame is high. The mass of this frame is equal to approximately 2 kg. It would be interesting to lower the safety coefficient by decreasing the mass and/or by changing the material since, for a given material, decreasing the quantity of the material will result in an increase of the strain for a given geometry. Furthermore, the force applied by a female or a male athlete is different. The maximal mechanical power output for a male and a female high-level BMX athlete is approximately 2270 and 1500 W (personal data), respectively. Based on the pedaling tests, the relationship of the mean strain in the seat tube to the mean mechanical power output was determined (
Figure 8). It is important to point out that this relationship is valid specifically for the frame studied in the present study; for other frames (e.g., geometry, composition), this relationship could be determined using the same methods. Under the conditions of the present study, for 2270 and 1500 W, the mean strain would be 968 and 631 μm·m
−1, respectively. For the frame studied in this study, the corresponding stress would be equal to 70 and 45 MPa, respectively. In this case, the BMX frame could be lighter for a woman. In analysing the forces applied on pedals, this protocol could be useful in testing the frames and in finding a better compromise between safety coefficient, mass, strain, and performance for each rider as a function of his/her force and competition level. However, our results are based on laboratory tests and the location of the strain gauges was chosen according to a finite element analysis. Although numerical analyses are recognized to be effective, a 3D model of the frame could be more accurate in taking into account the weld, for example. Moreover, eight uniaxial strain gauges were used to study the bottom bracket area and the rear axis, more gauges could be placed on the frame to study the strain in all tubes and the use of three-gauge rosettes could amplify the accuracy of the results. More research on the frame strain should be done in actual conditions during an all-out sprint. The supplementary information obtained would allow a more complete understanding of the strain and could provide a better basis for the design of a race frame. The present study has several limits. Firstly, further studies should be performed with a greater sample size to confirm the present results. Secondly, even though it is difficult to perform high intensity exercise on a specific BMX cycle-trainer, further tests should be performed at higher intensities of exercise to better reflect the actual BMX condition. Thirdly, the results of this study should be considered specific to the BMX frame characteristics used in this study and should be used with caution for other BMX frames. Even if this study has several limits, the present study provides original findings illuminating the mechanical behavior of the BMX frame under different conditions of tests and pedaling and provides a methodology that could be used to test different cycle frames type (e.g., road, mountain bike). The results could give information for the riders or coaches for the choice of BMX frame or manufacturer.
In the future, the transfer of energy could be analysed by comparing the power output measured at the instrumented pedals and those transmitted to the ground. This data could be obtained using a force platform. Moreover, the 3-axis pedal system could facilitate the study of the frame strain as a function of the pedaling index of efficiency.


