Maximum Strength, Rate of Force Development, Jump Height, and Peak Power Alterations in Weightlifters across Five Months of Training

 ,
,  ,
, 
Abstract
:1. Introduction
1.1. Background and Nuances
1.2. Brief Weightlifting Overview
2. Materials and Methods
2.1. Athletes
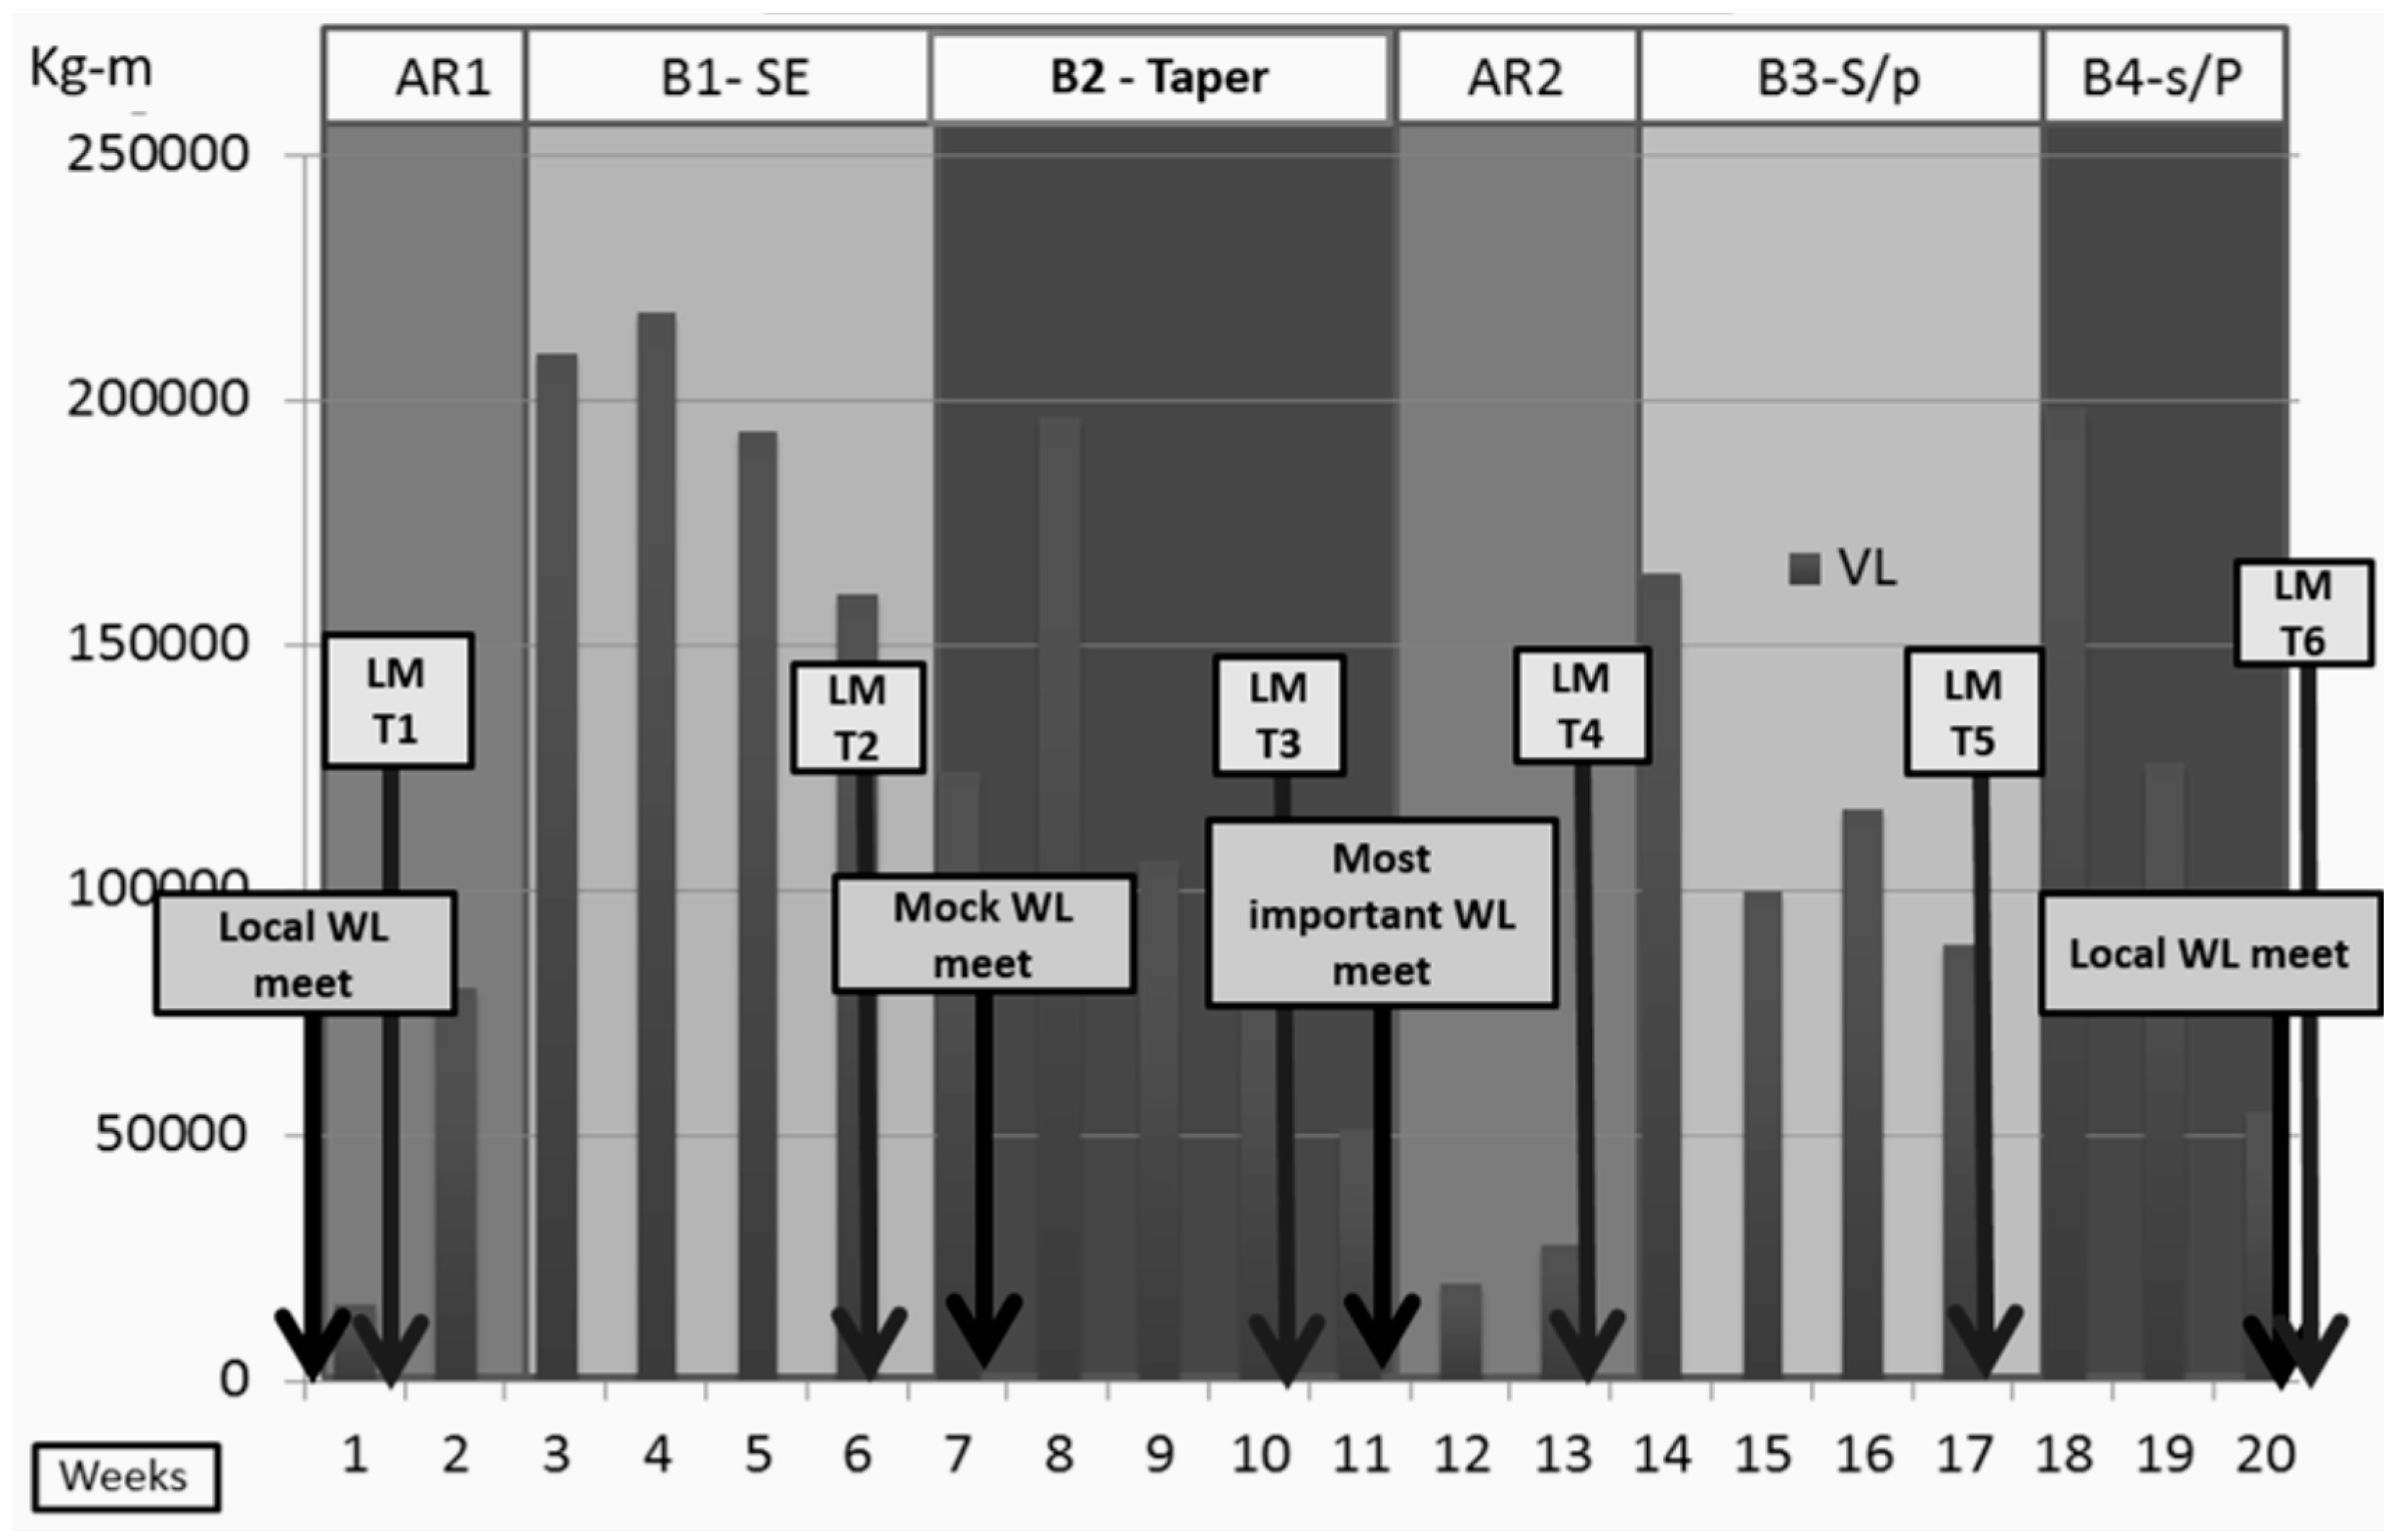
2.2. Timeline
2.3. The Training Plan
2.4. Daily Monitoring
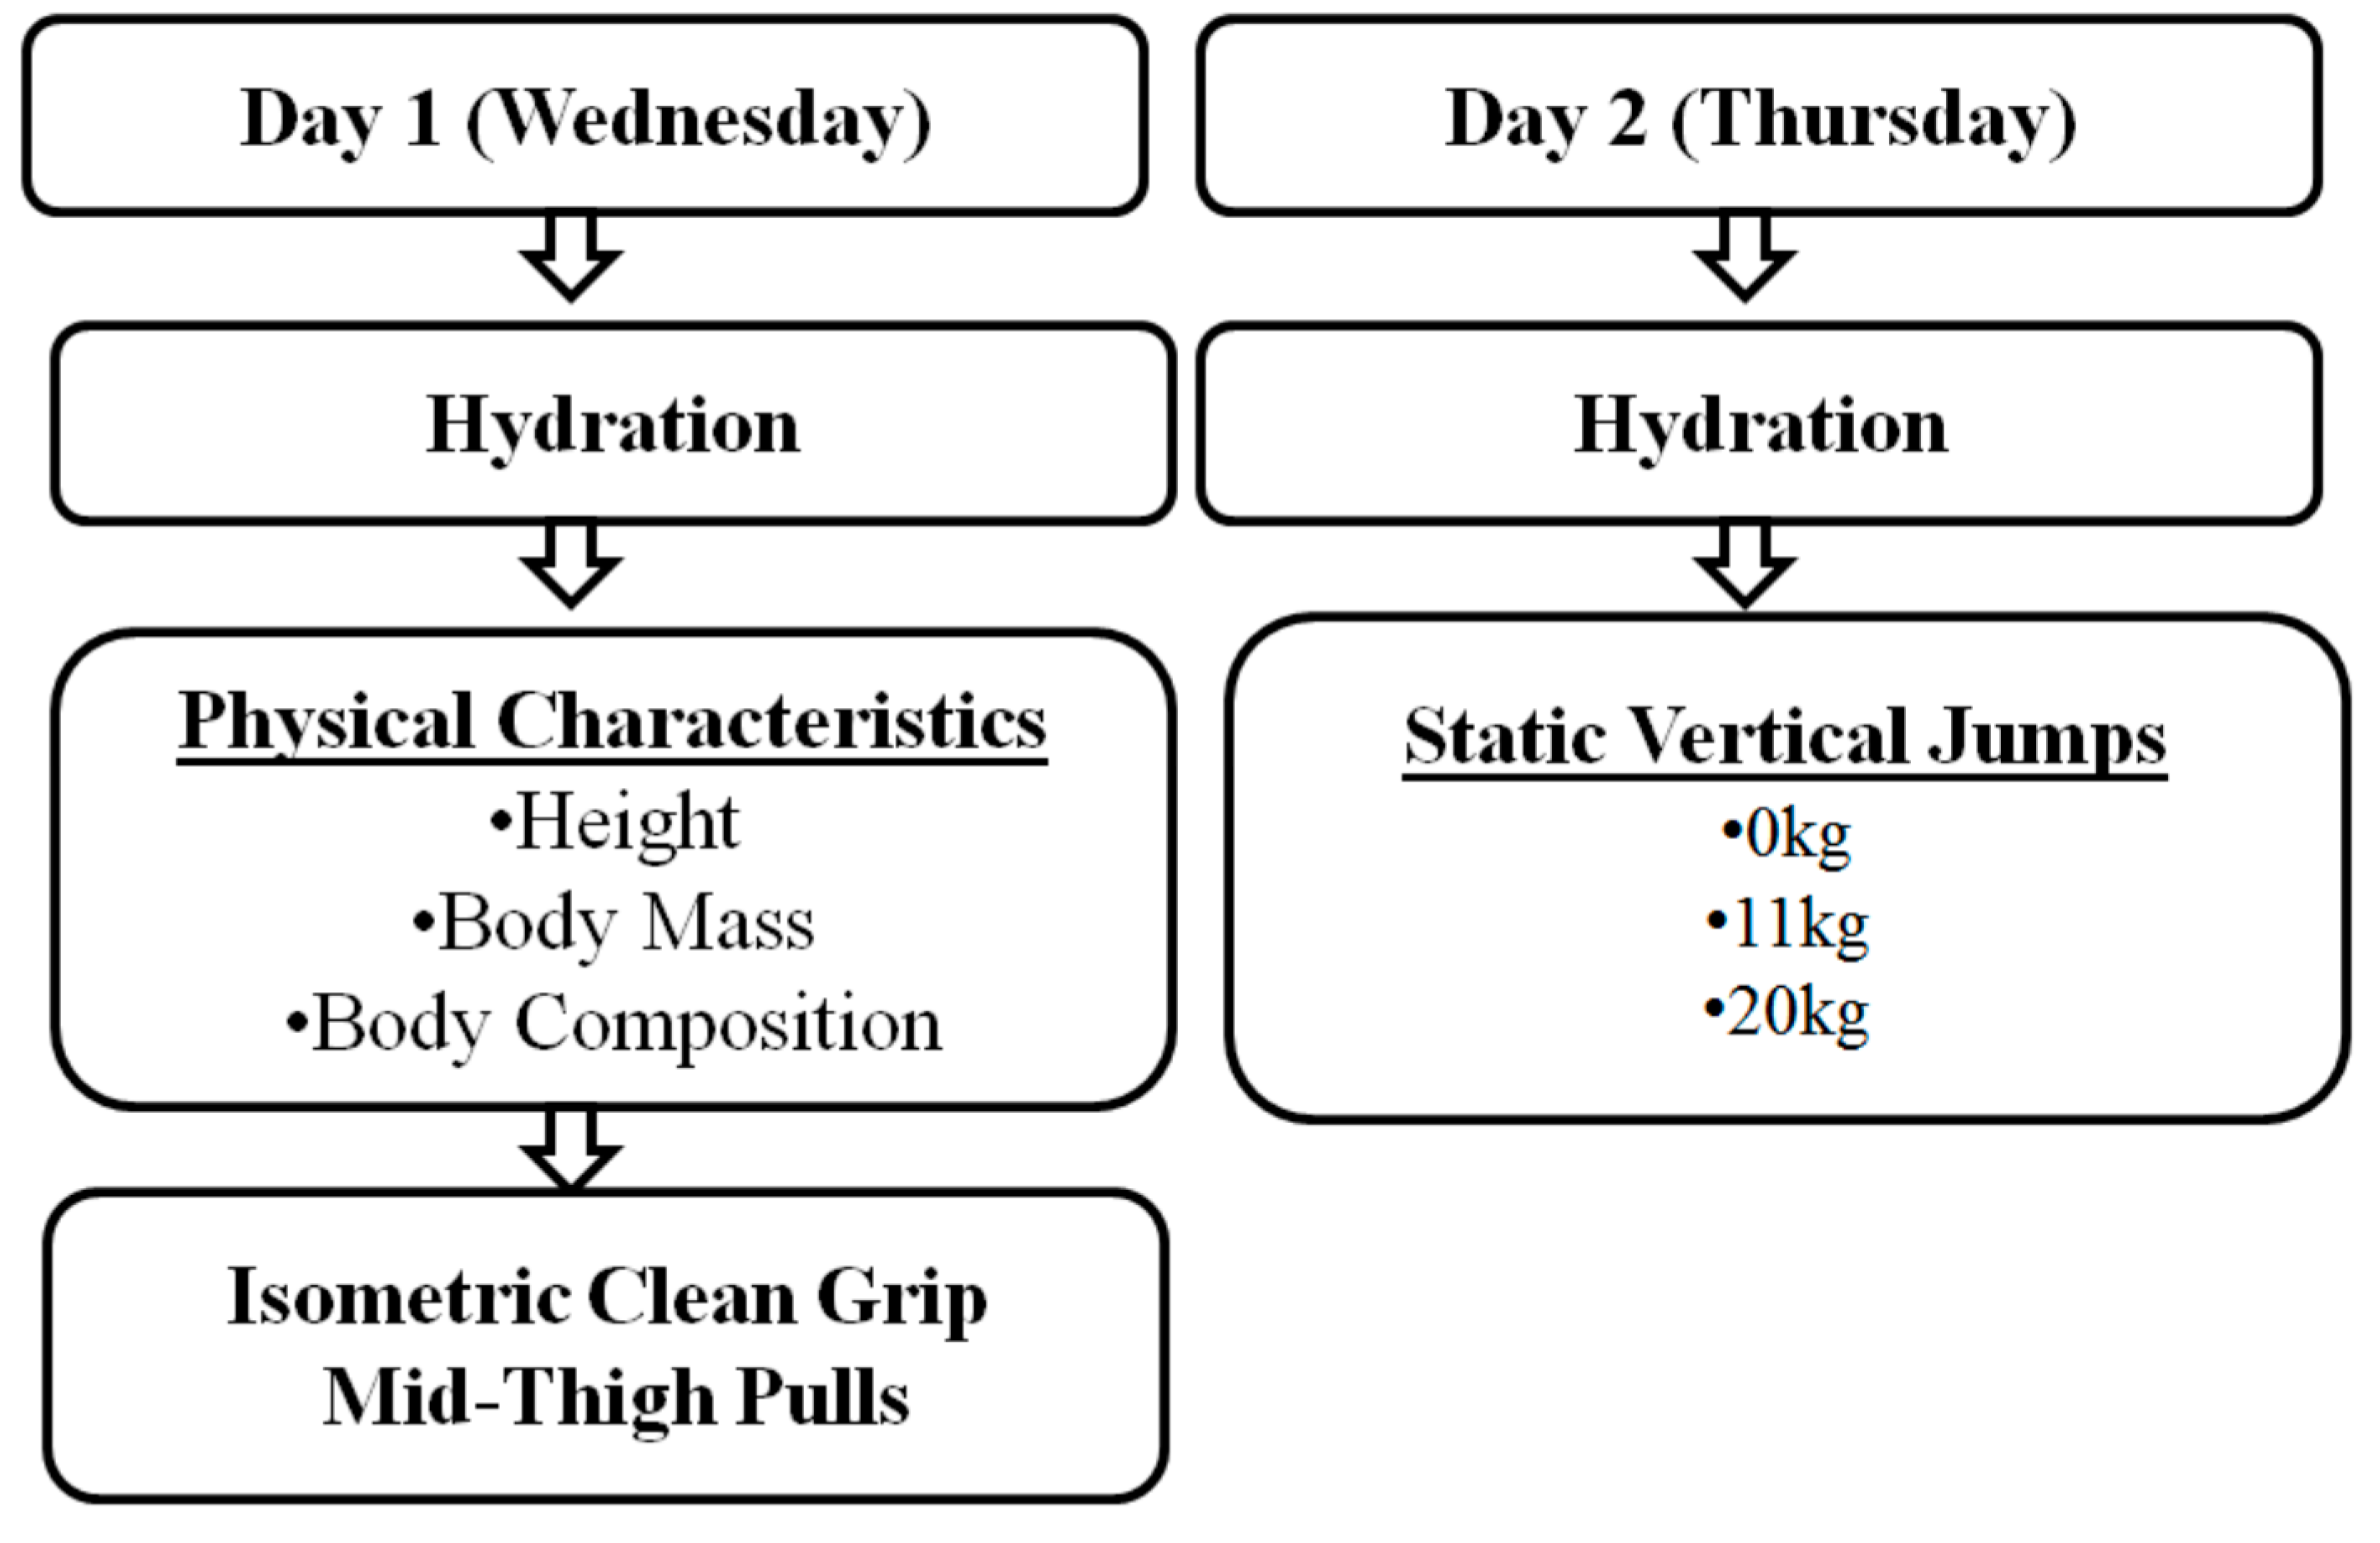
2.5. Measurements of Underlying Mechanisms (Performance Testing)
2.6. Anthropometric
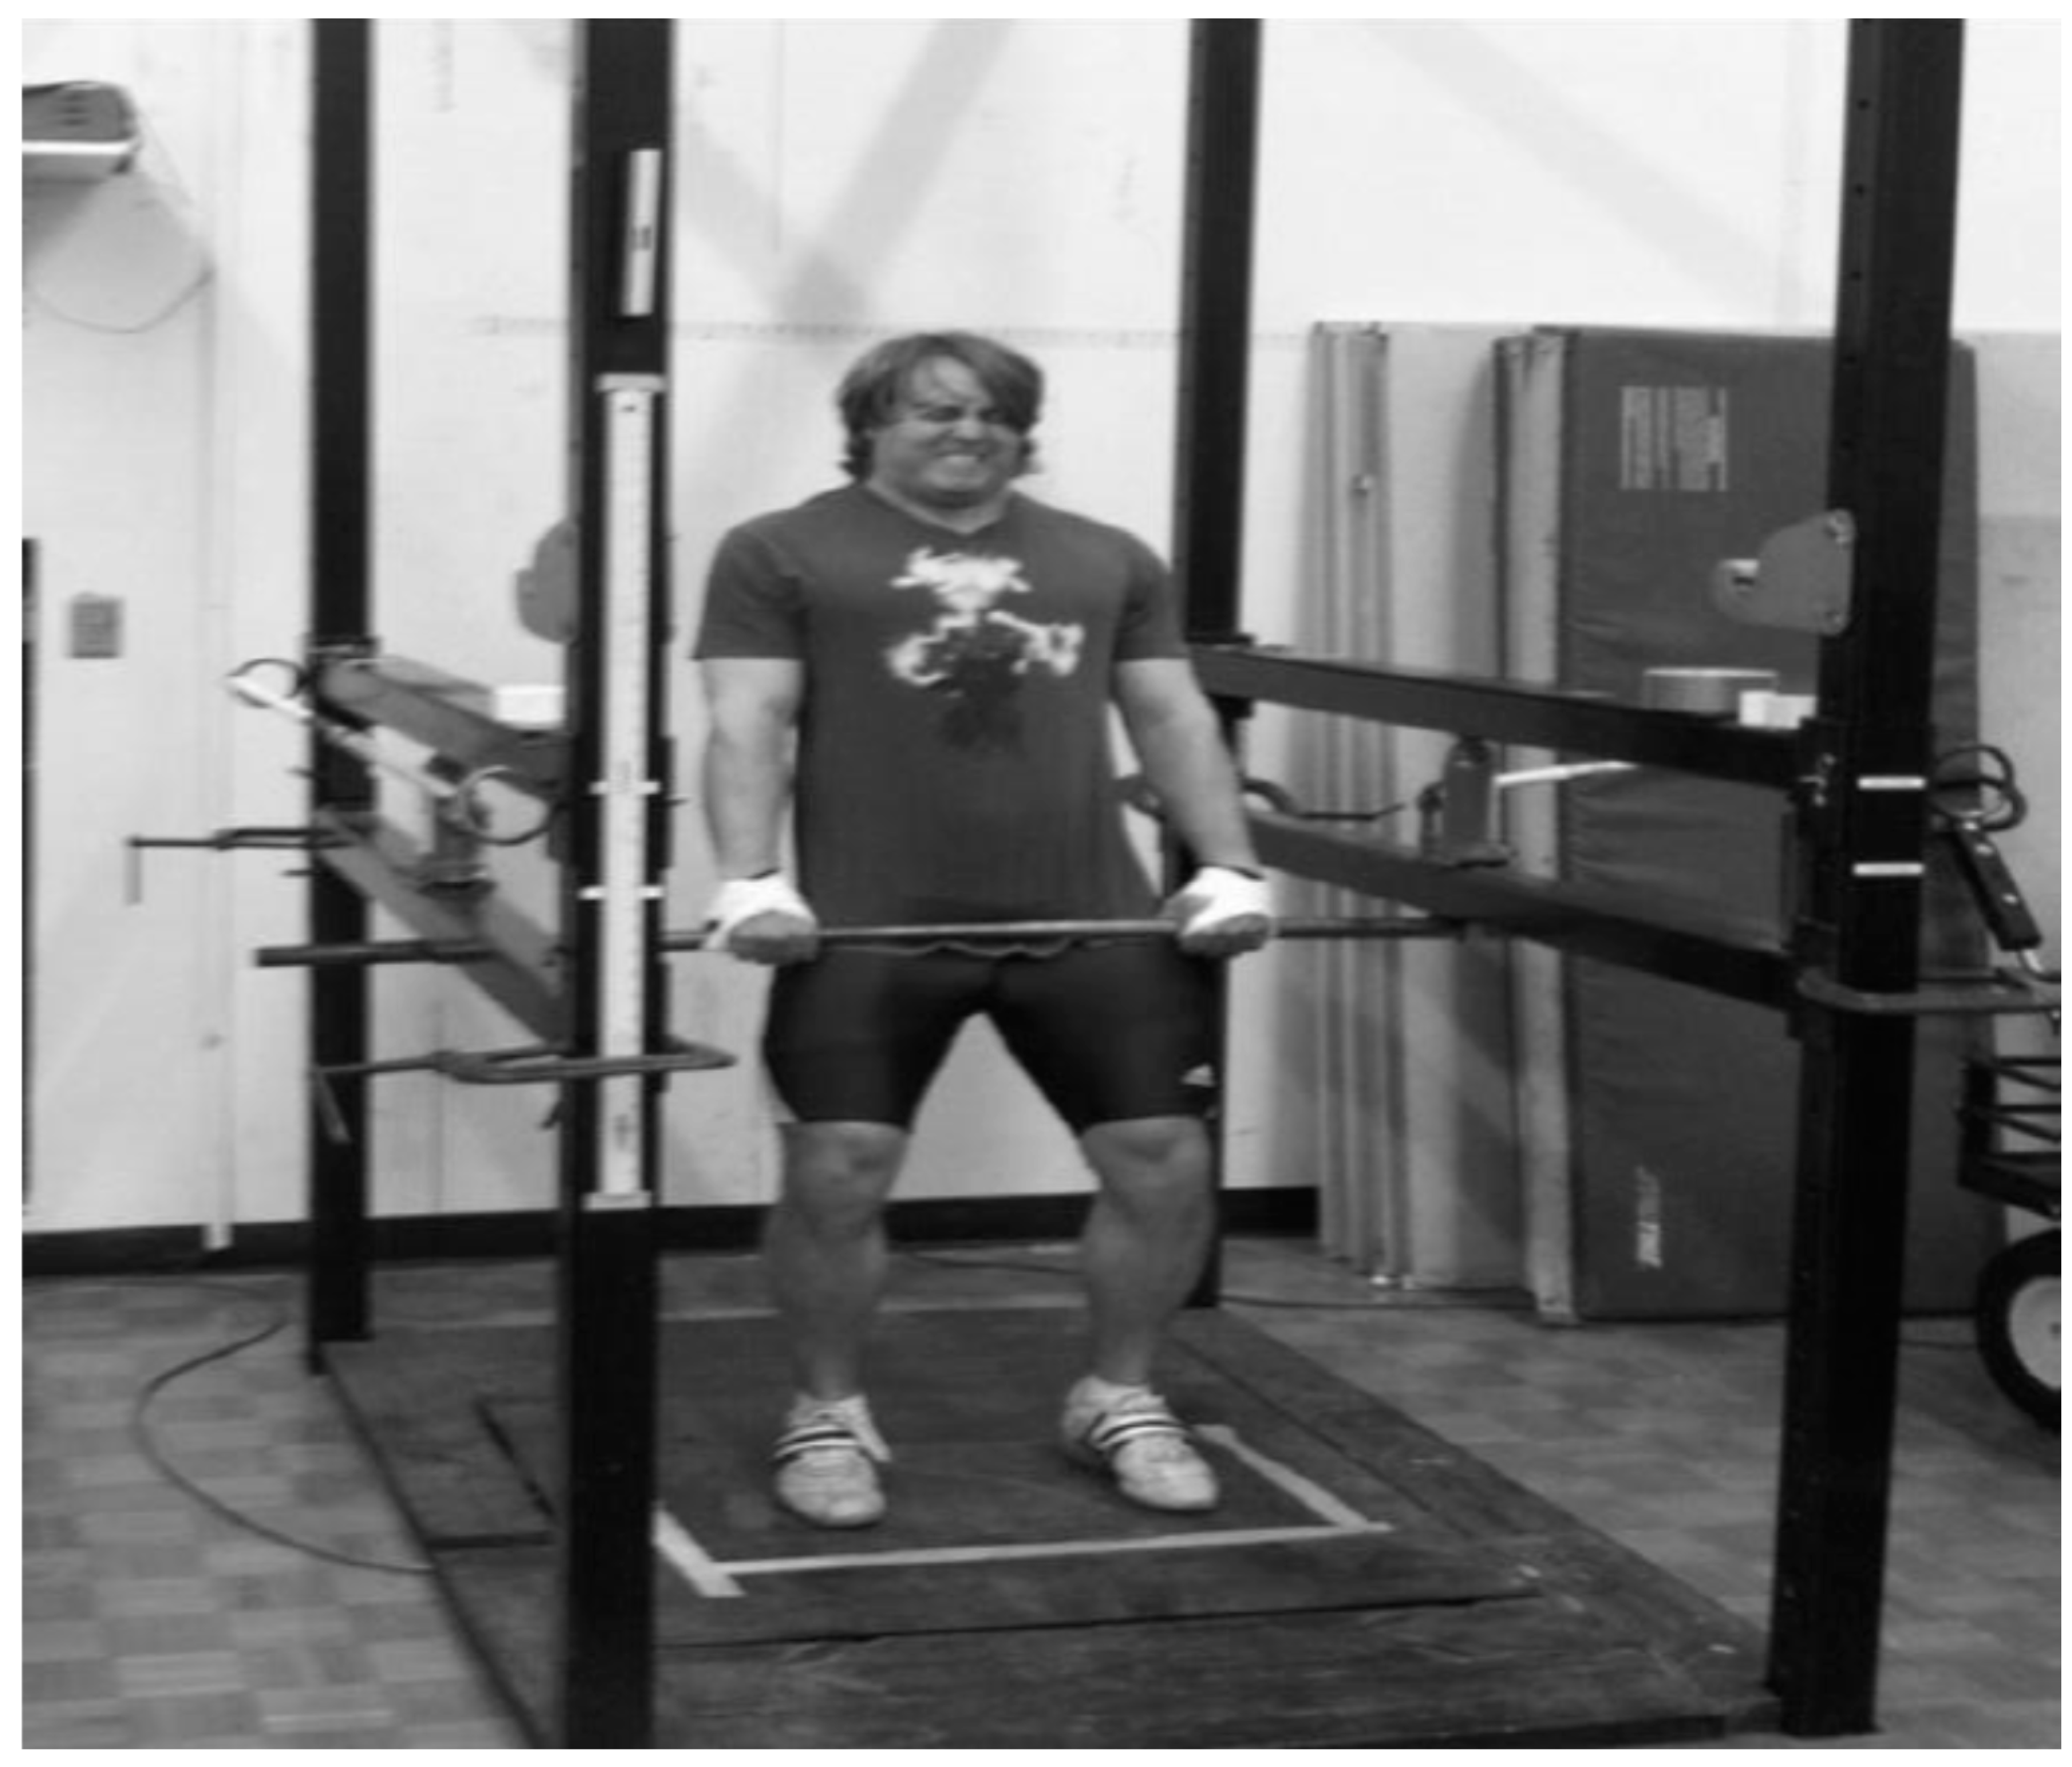
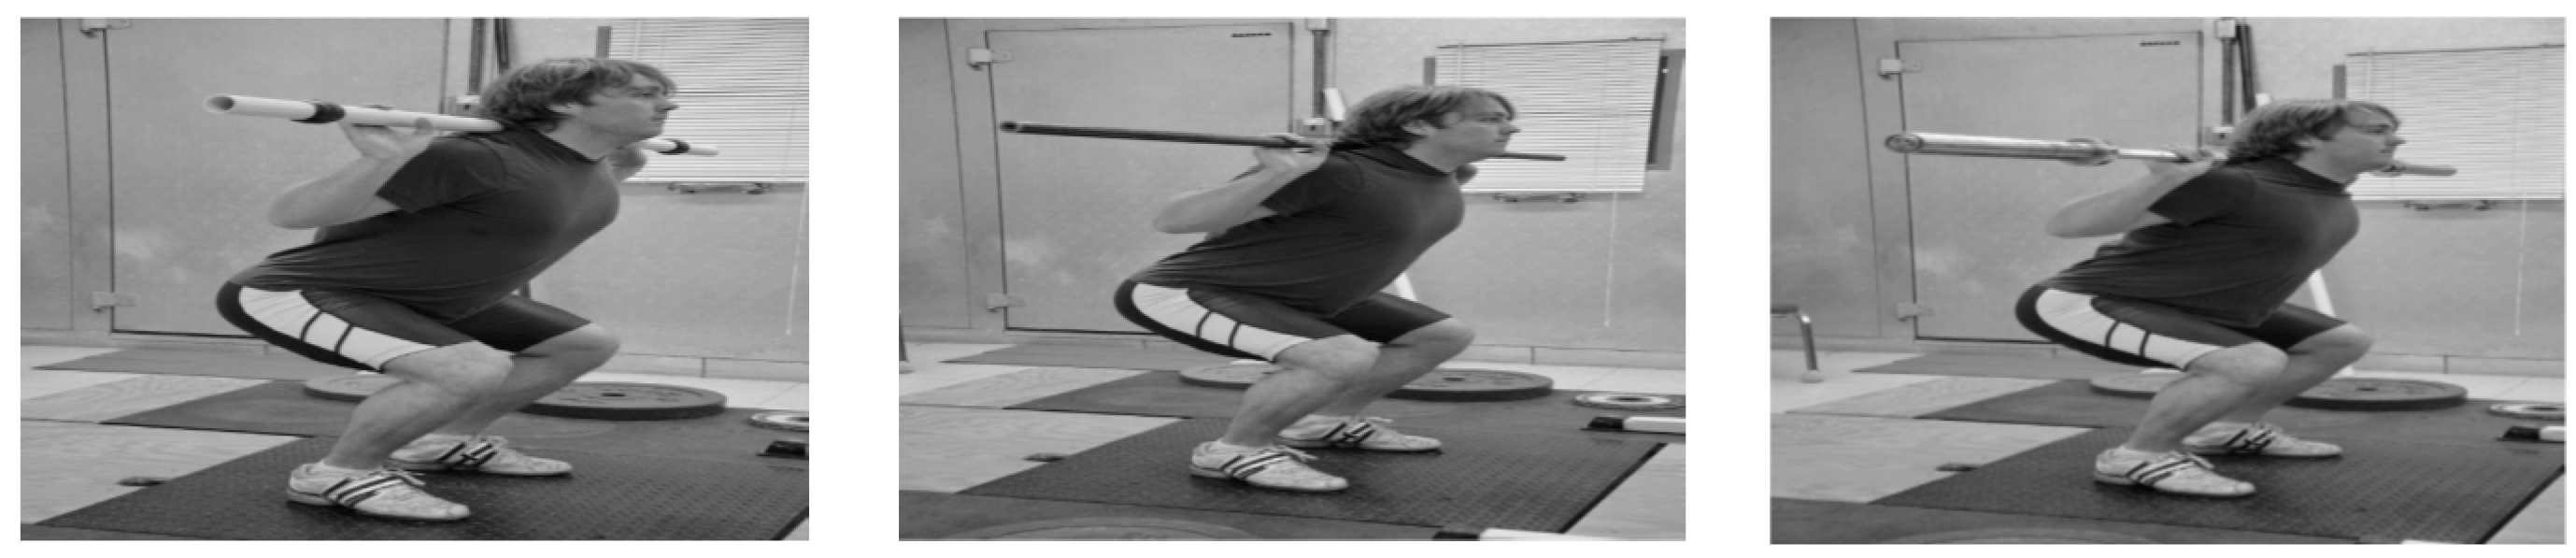
2.7. Isometric Mid-Thigh Clean Pull
2.8. Static Vertical Jumps
2.9. The Expected General Adaptation Trend
2.10. Statistical Analyses
3. Results
3.1. Volume Load
3.2. Body Composition
3.3. Weightlifting Performance
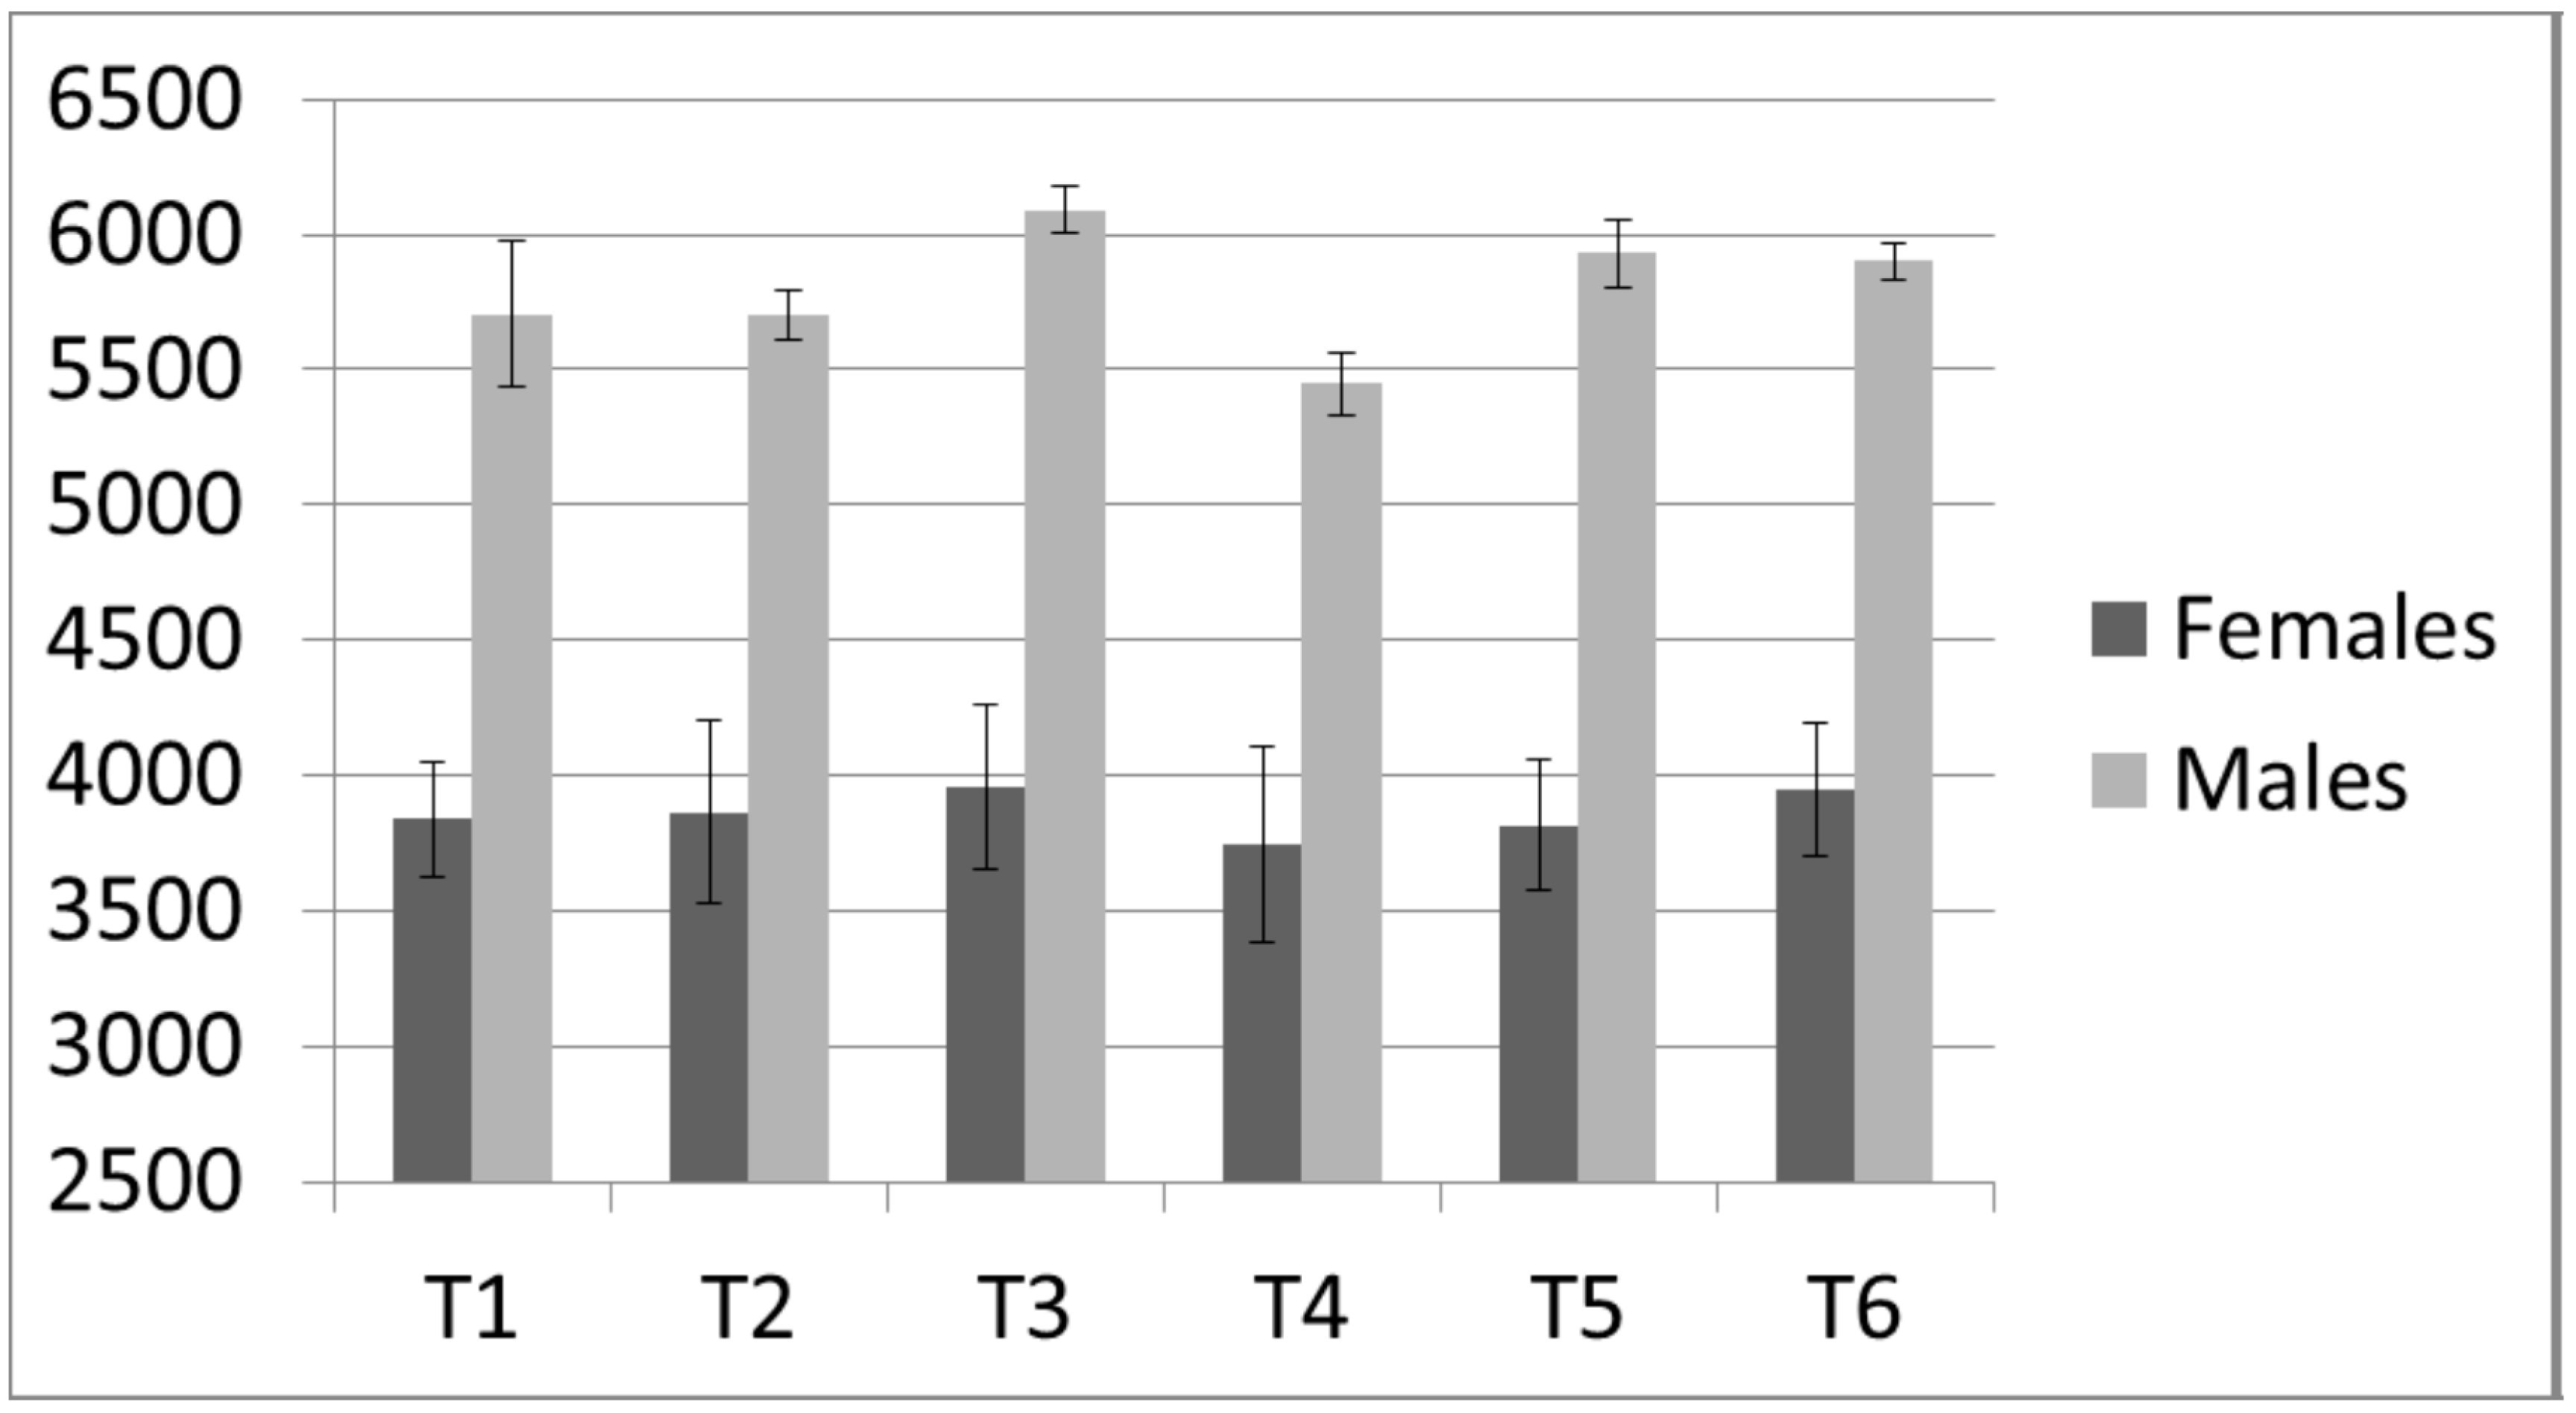
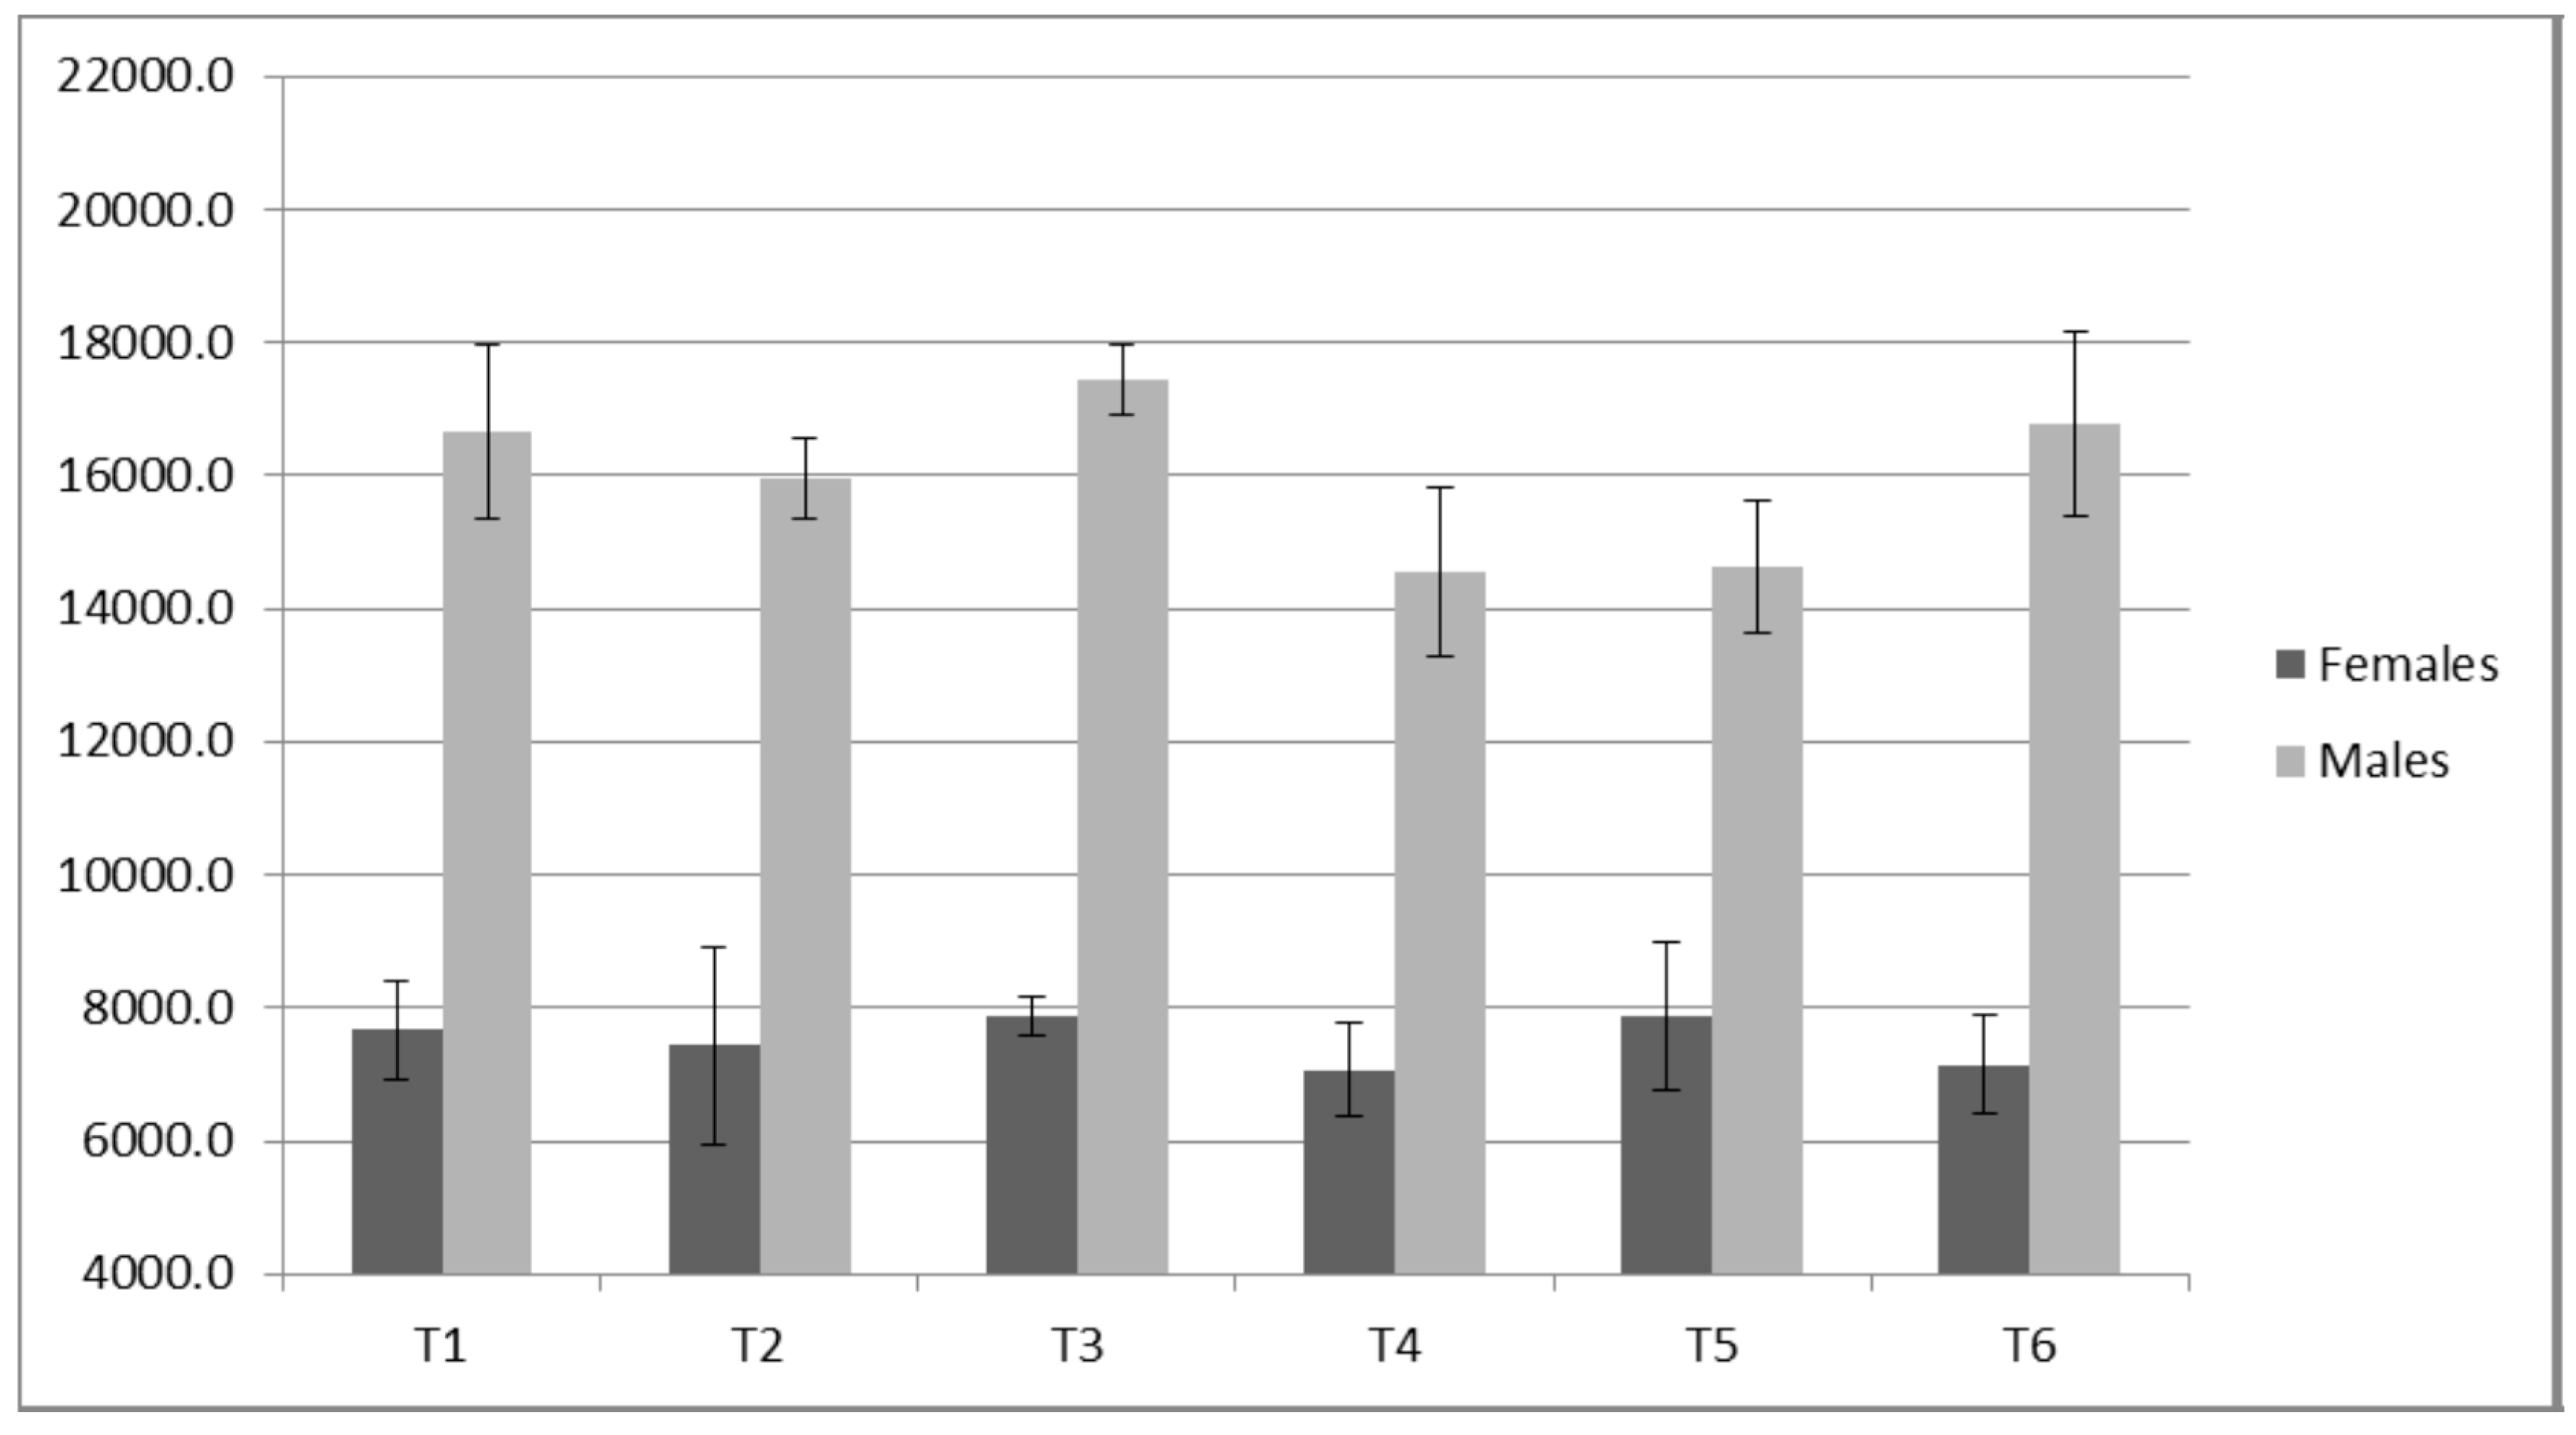
3.4. Isometric Mid-Thigh Pull
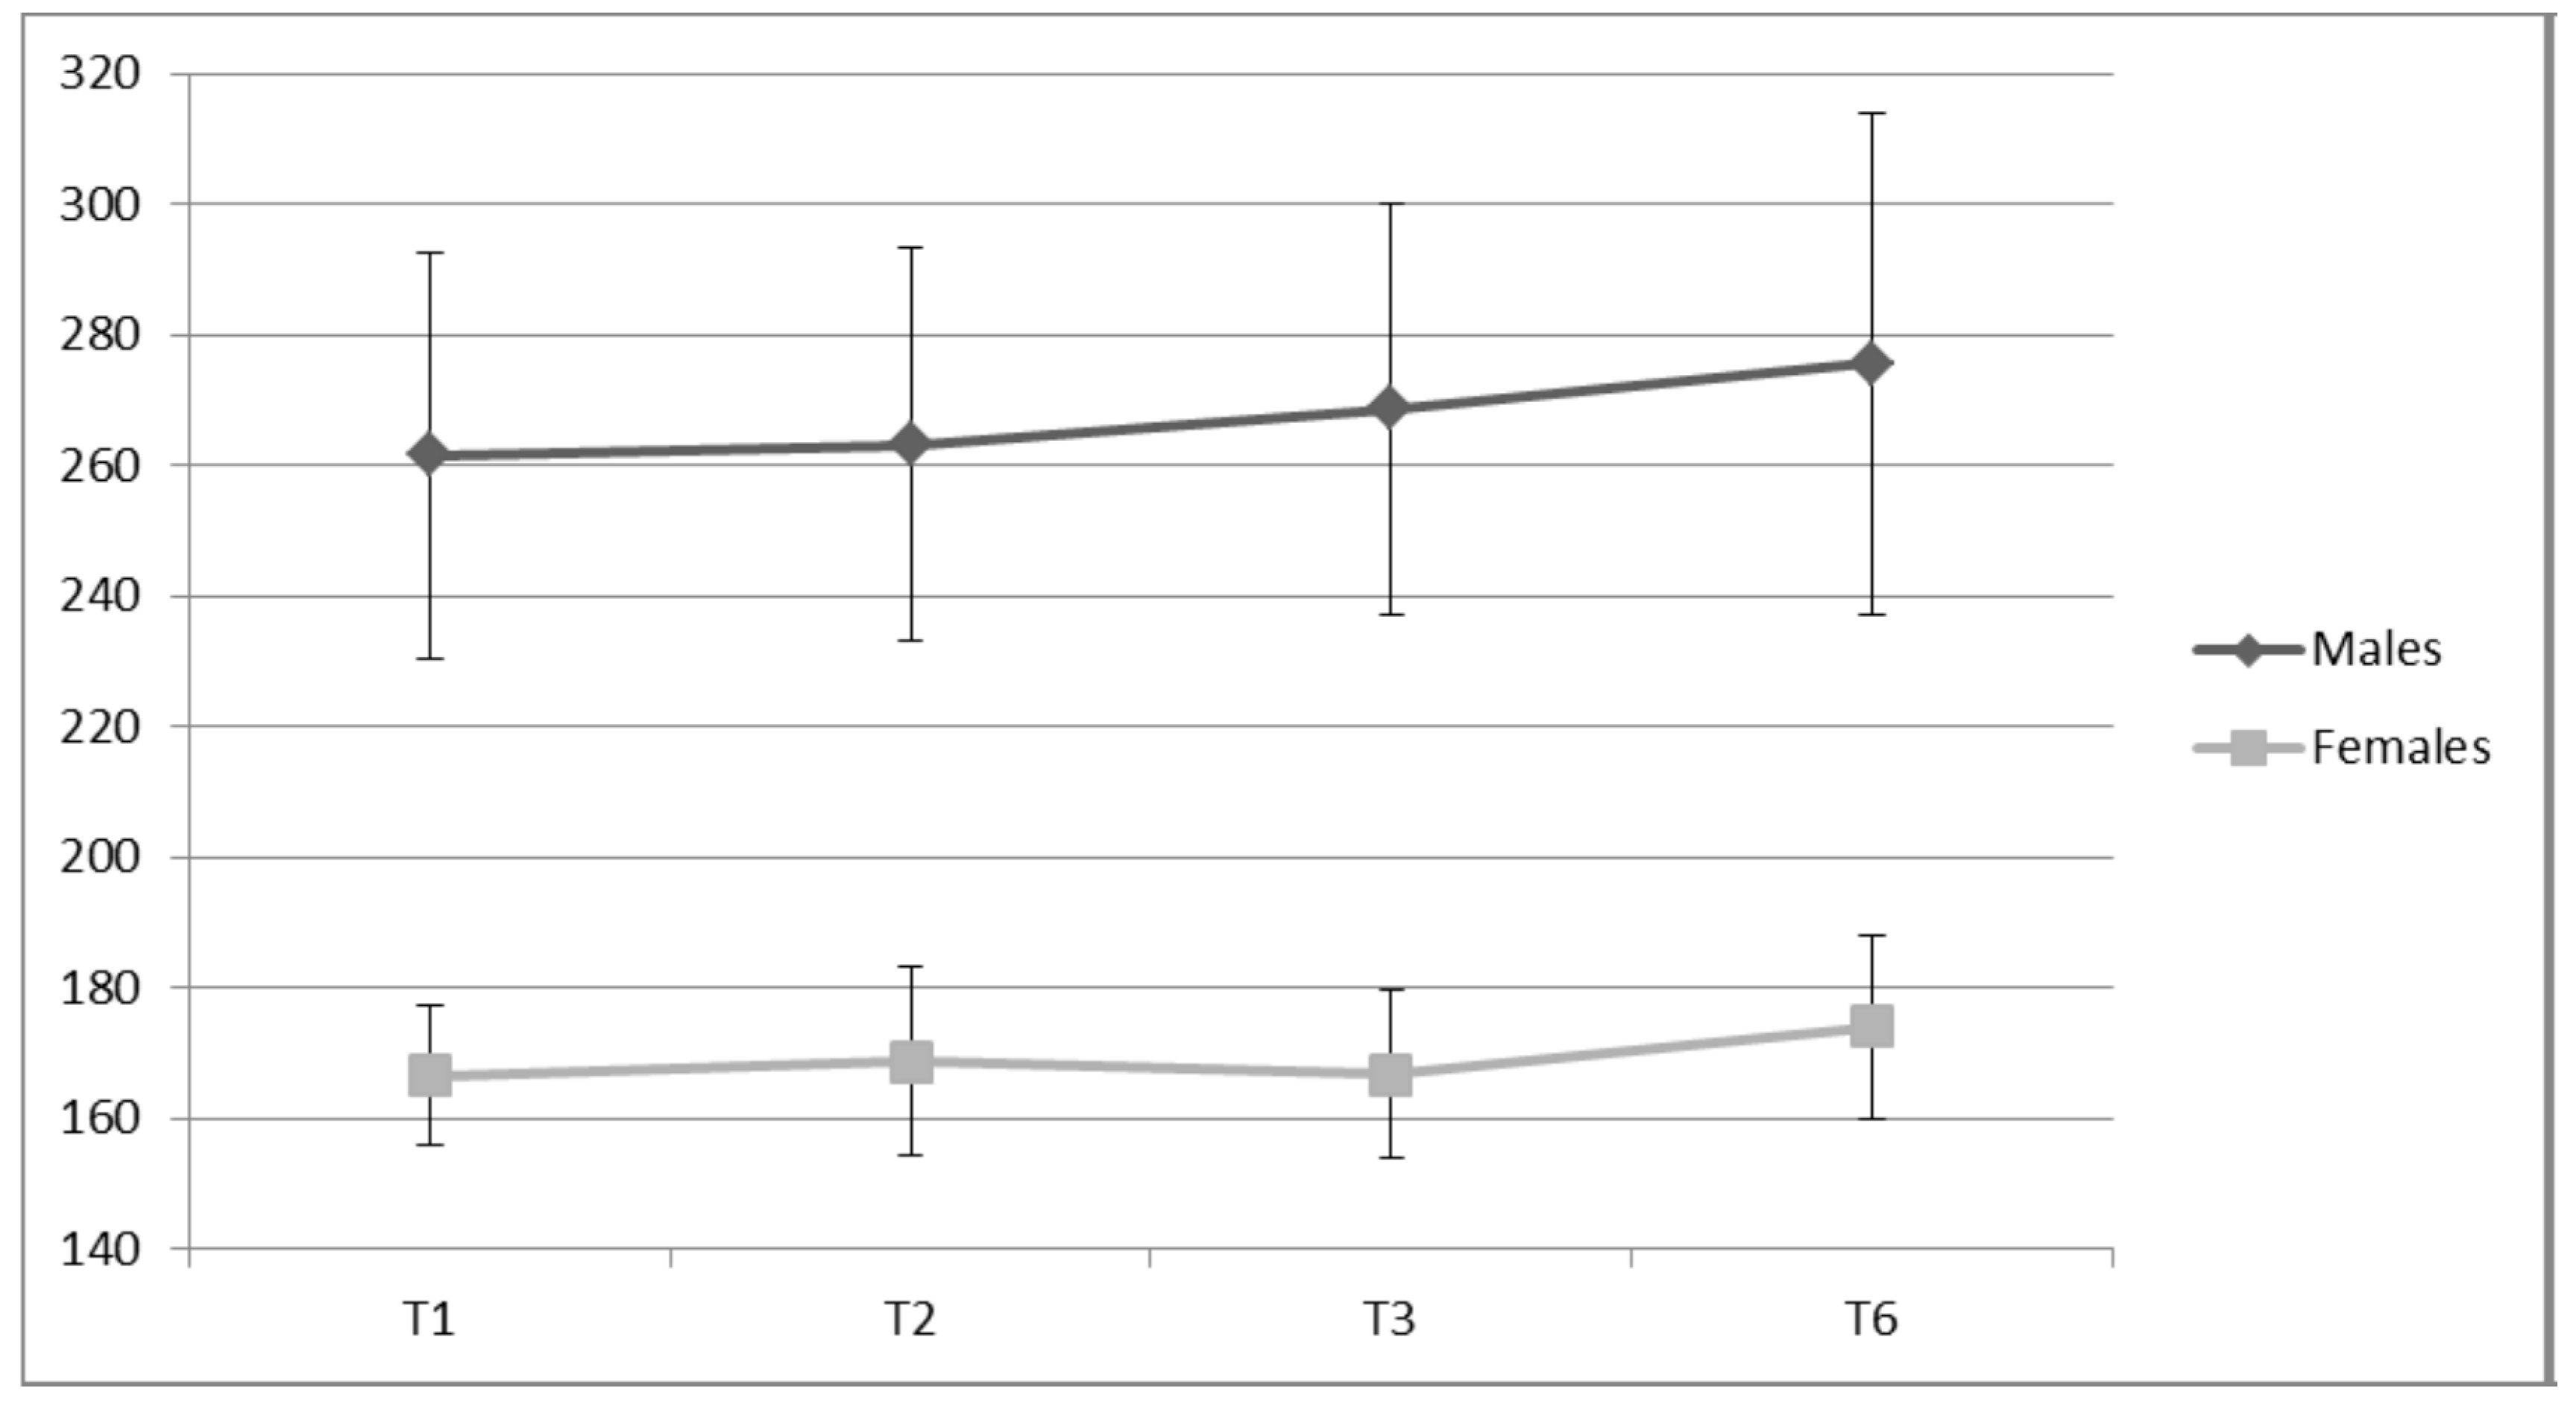
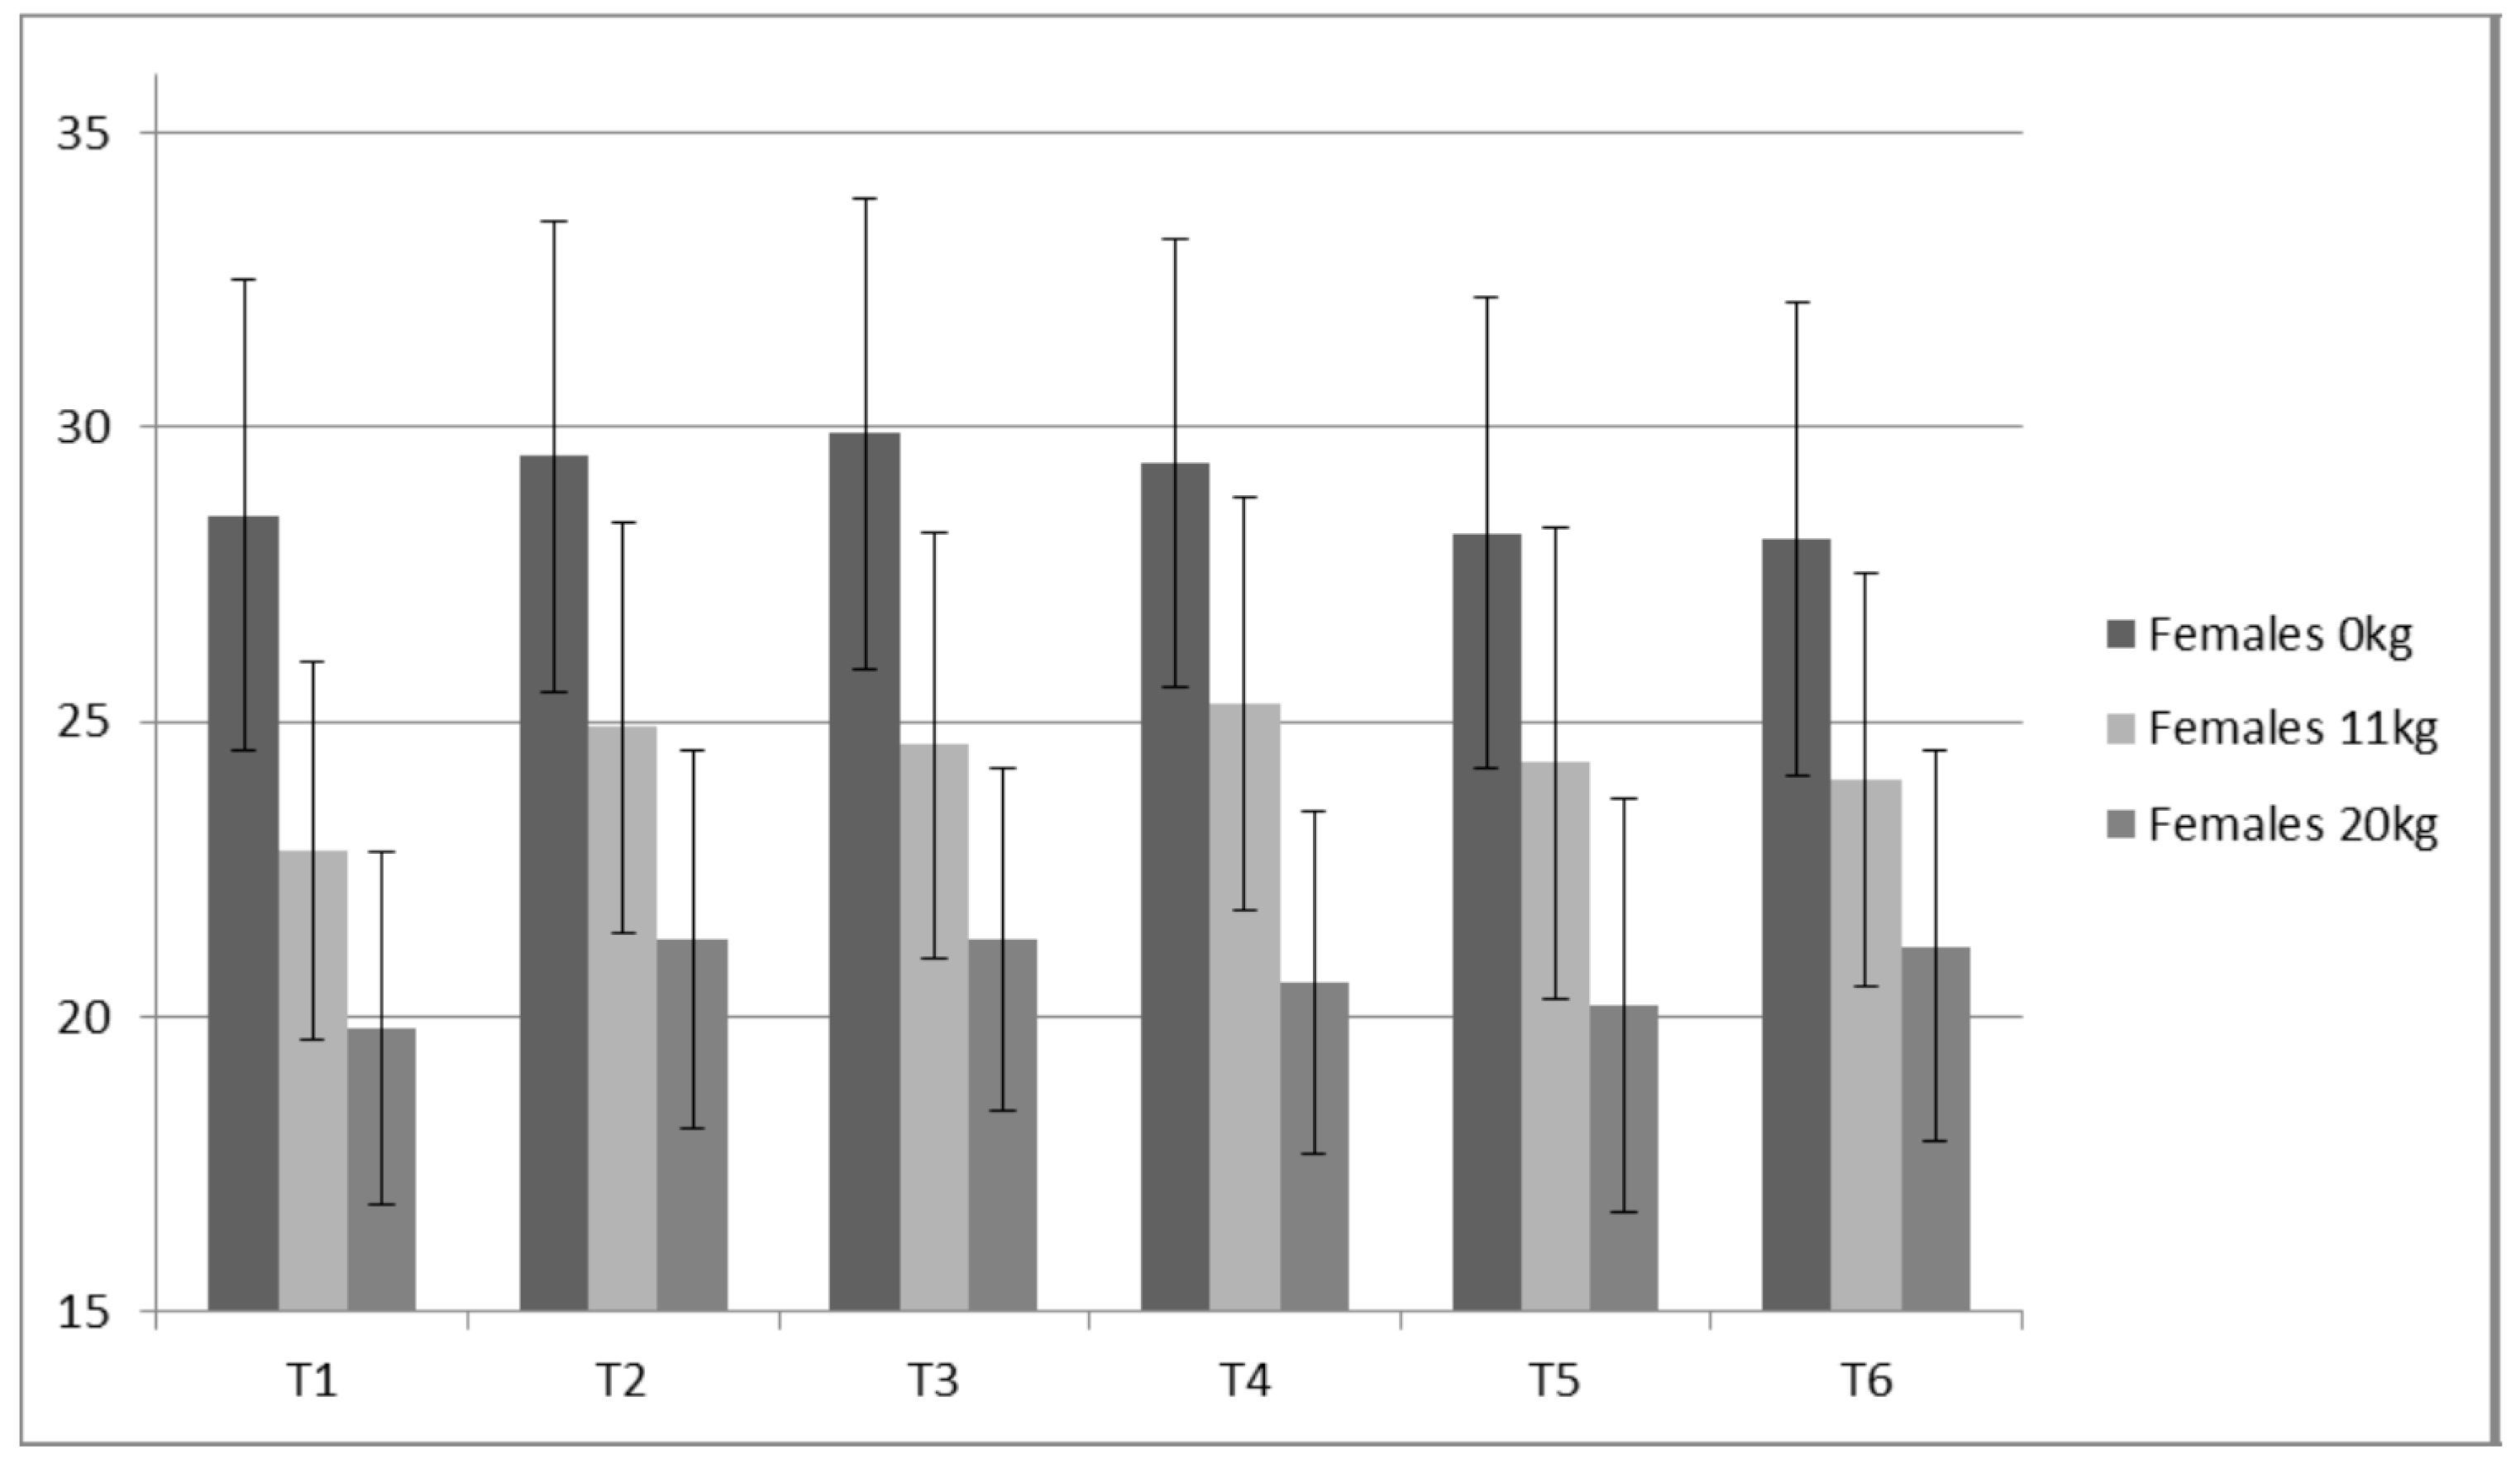
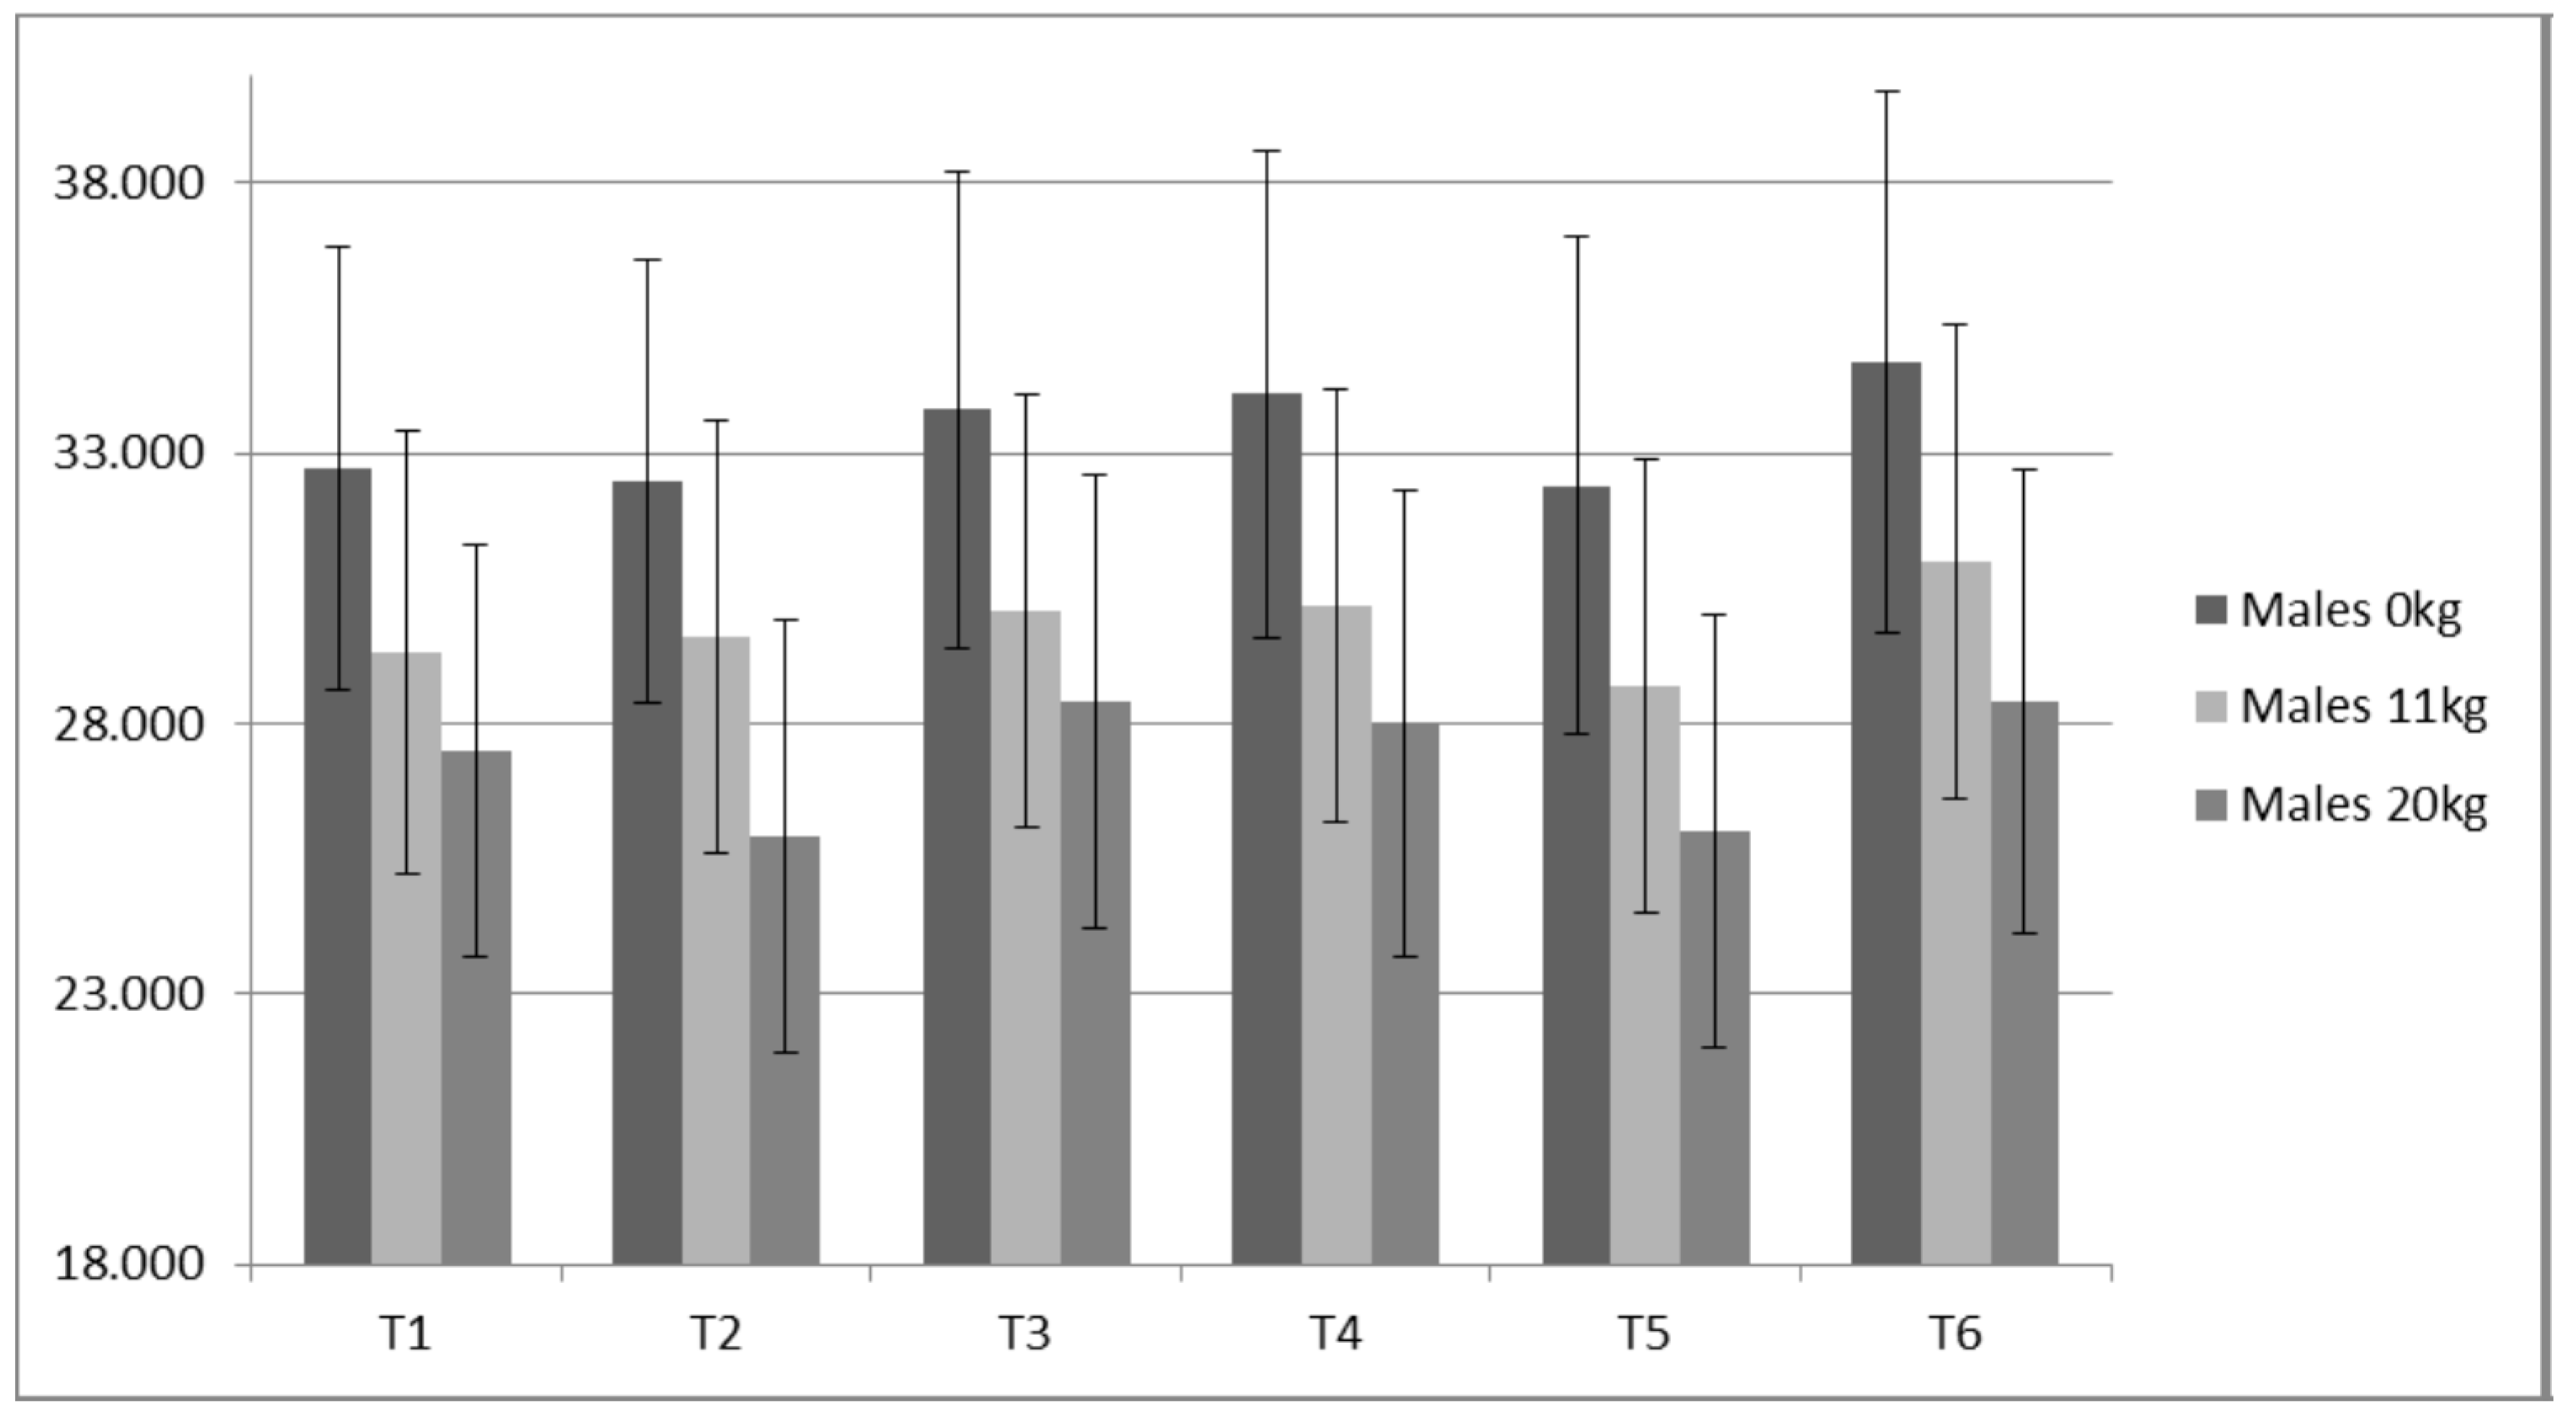
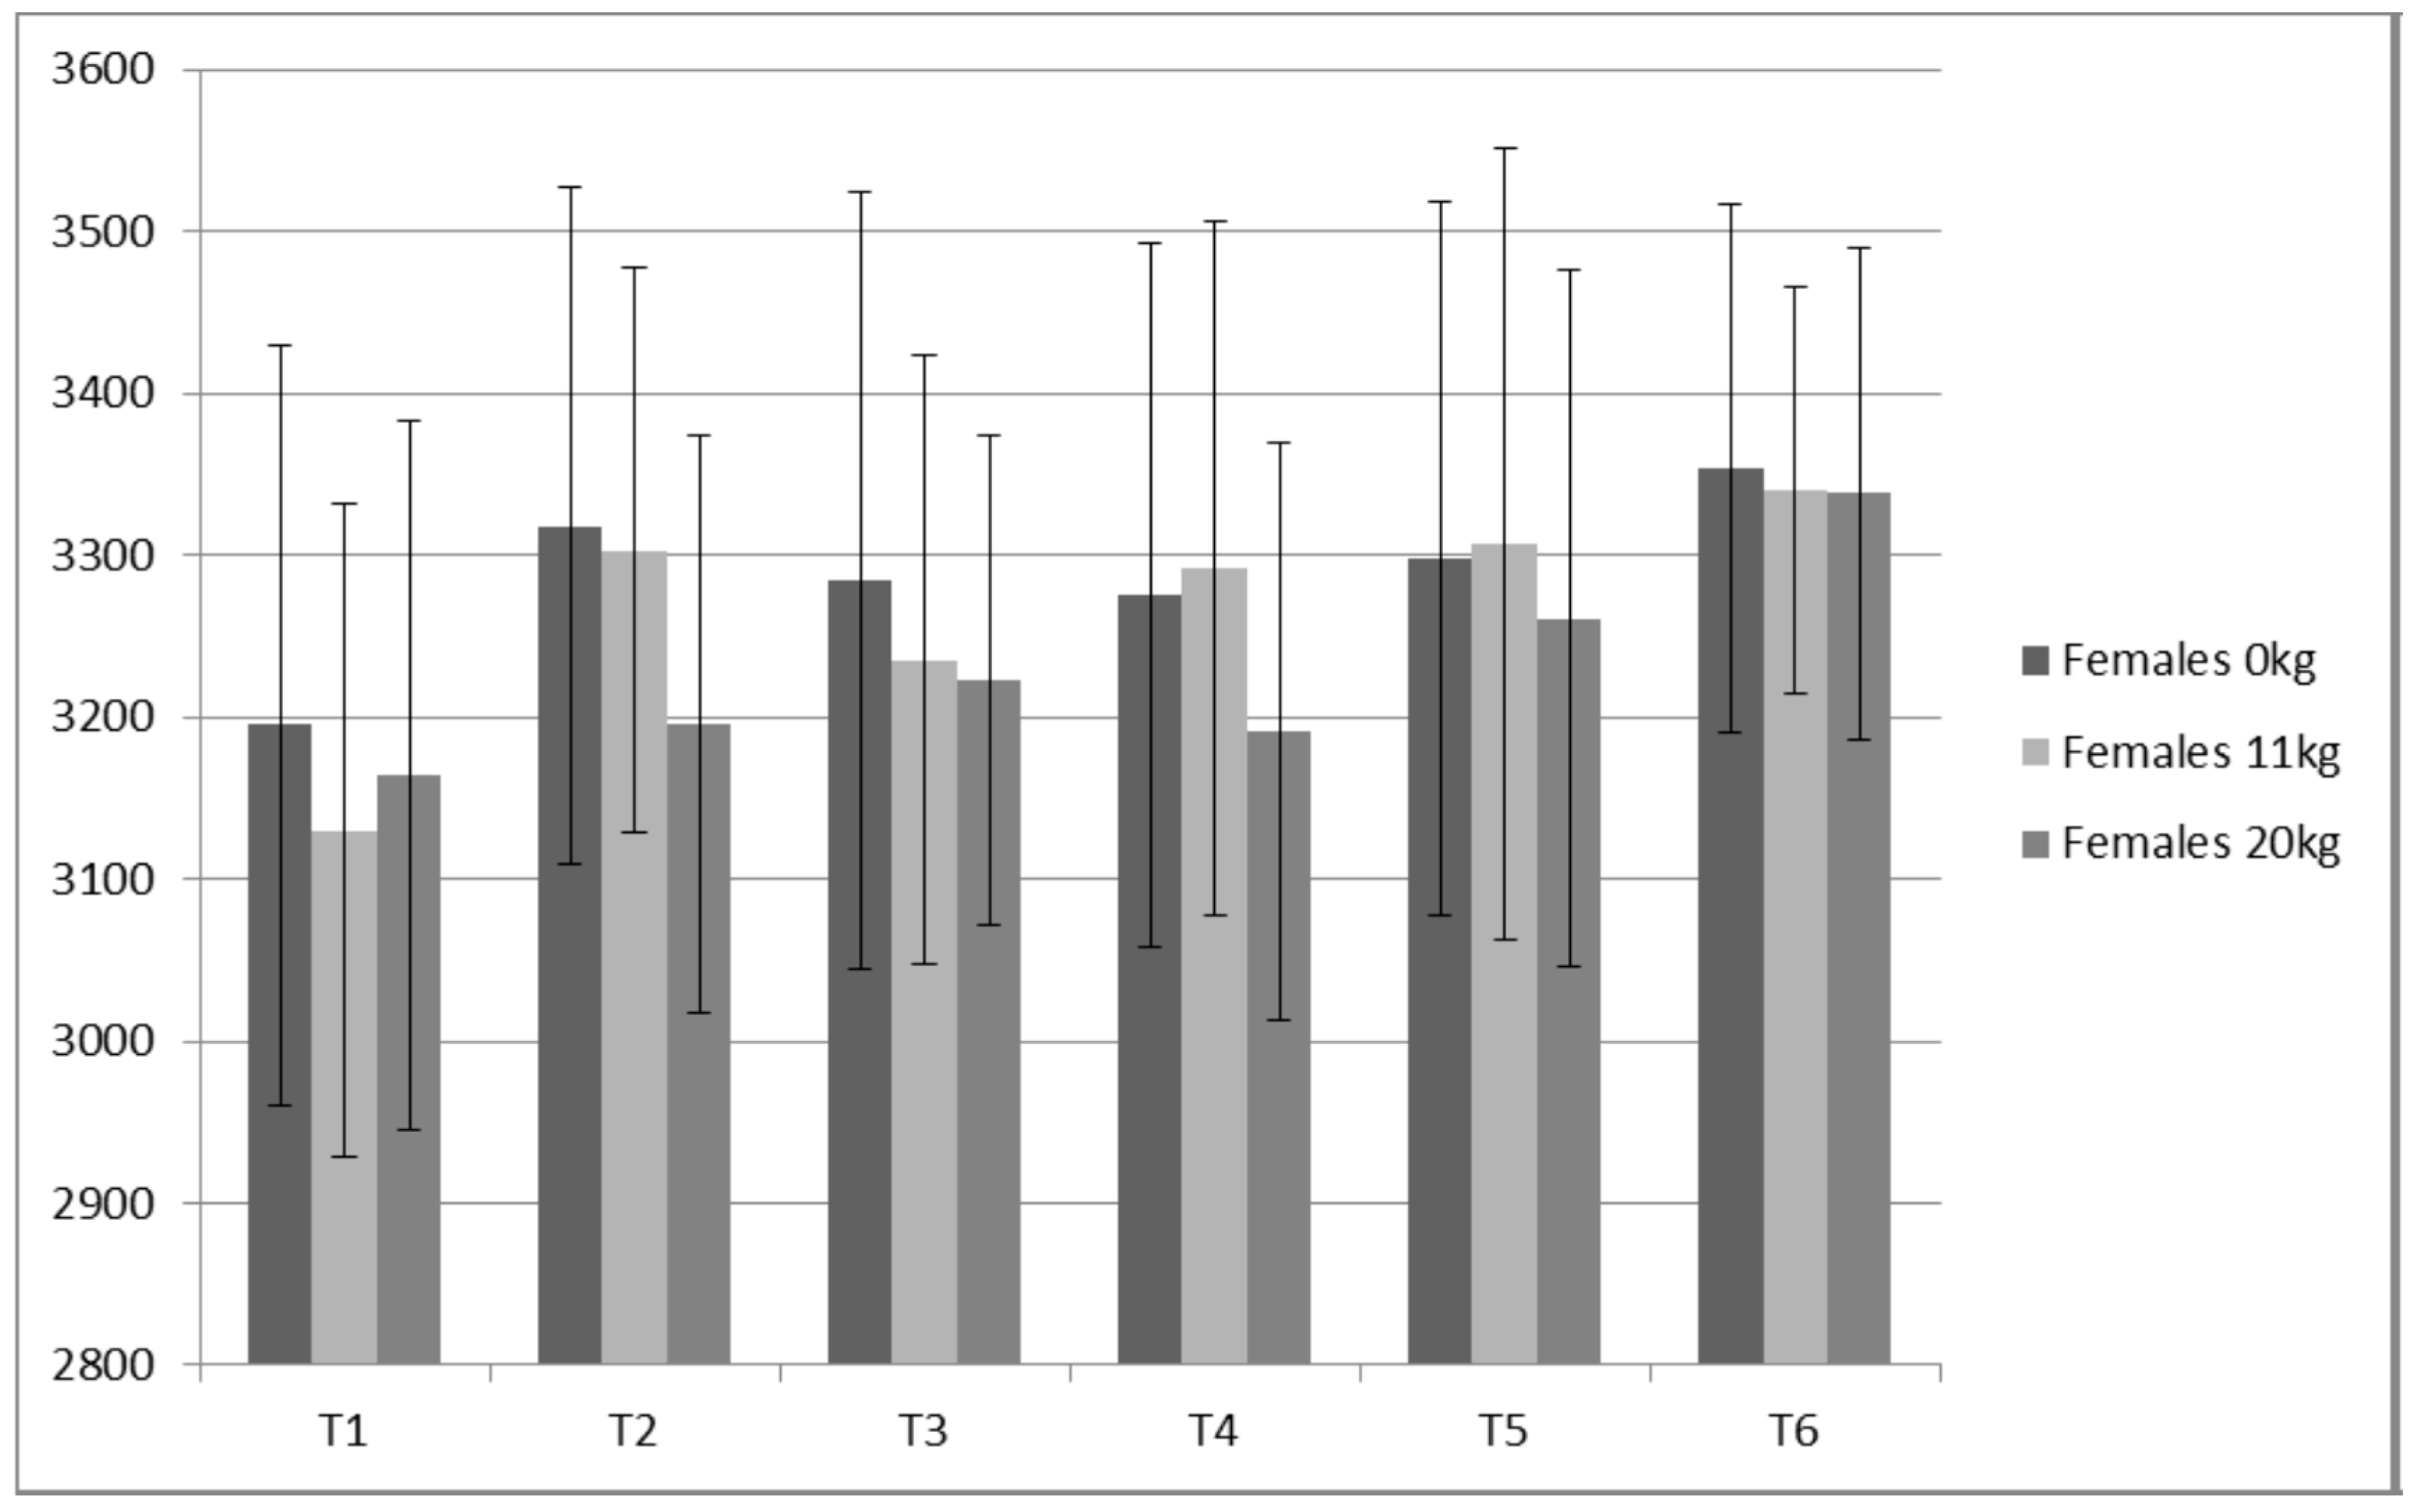
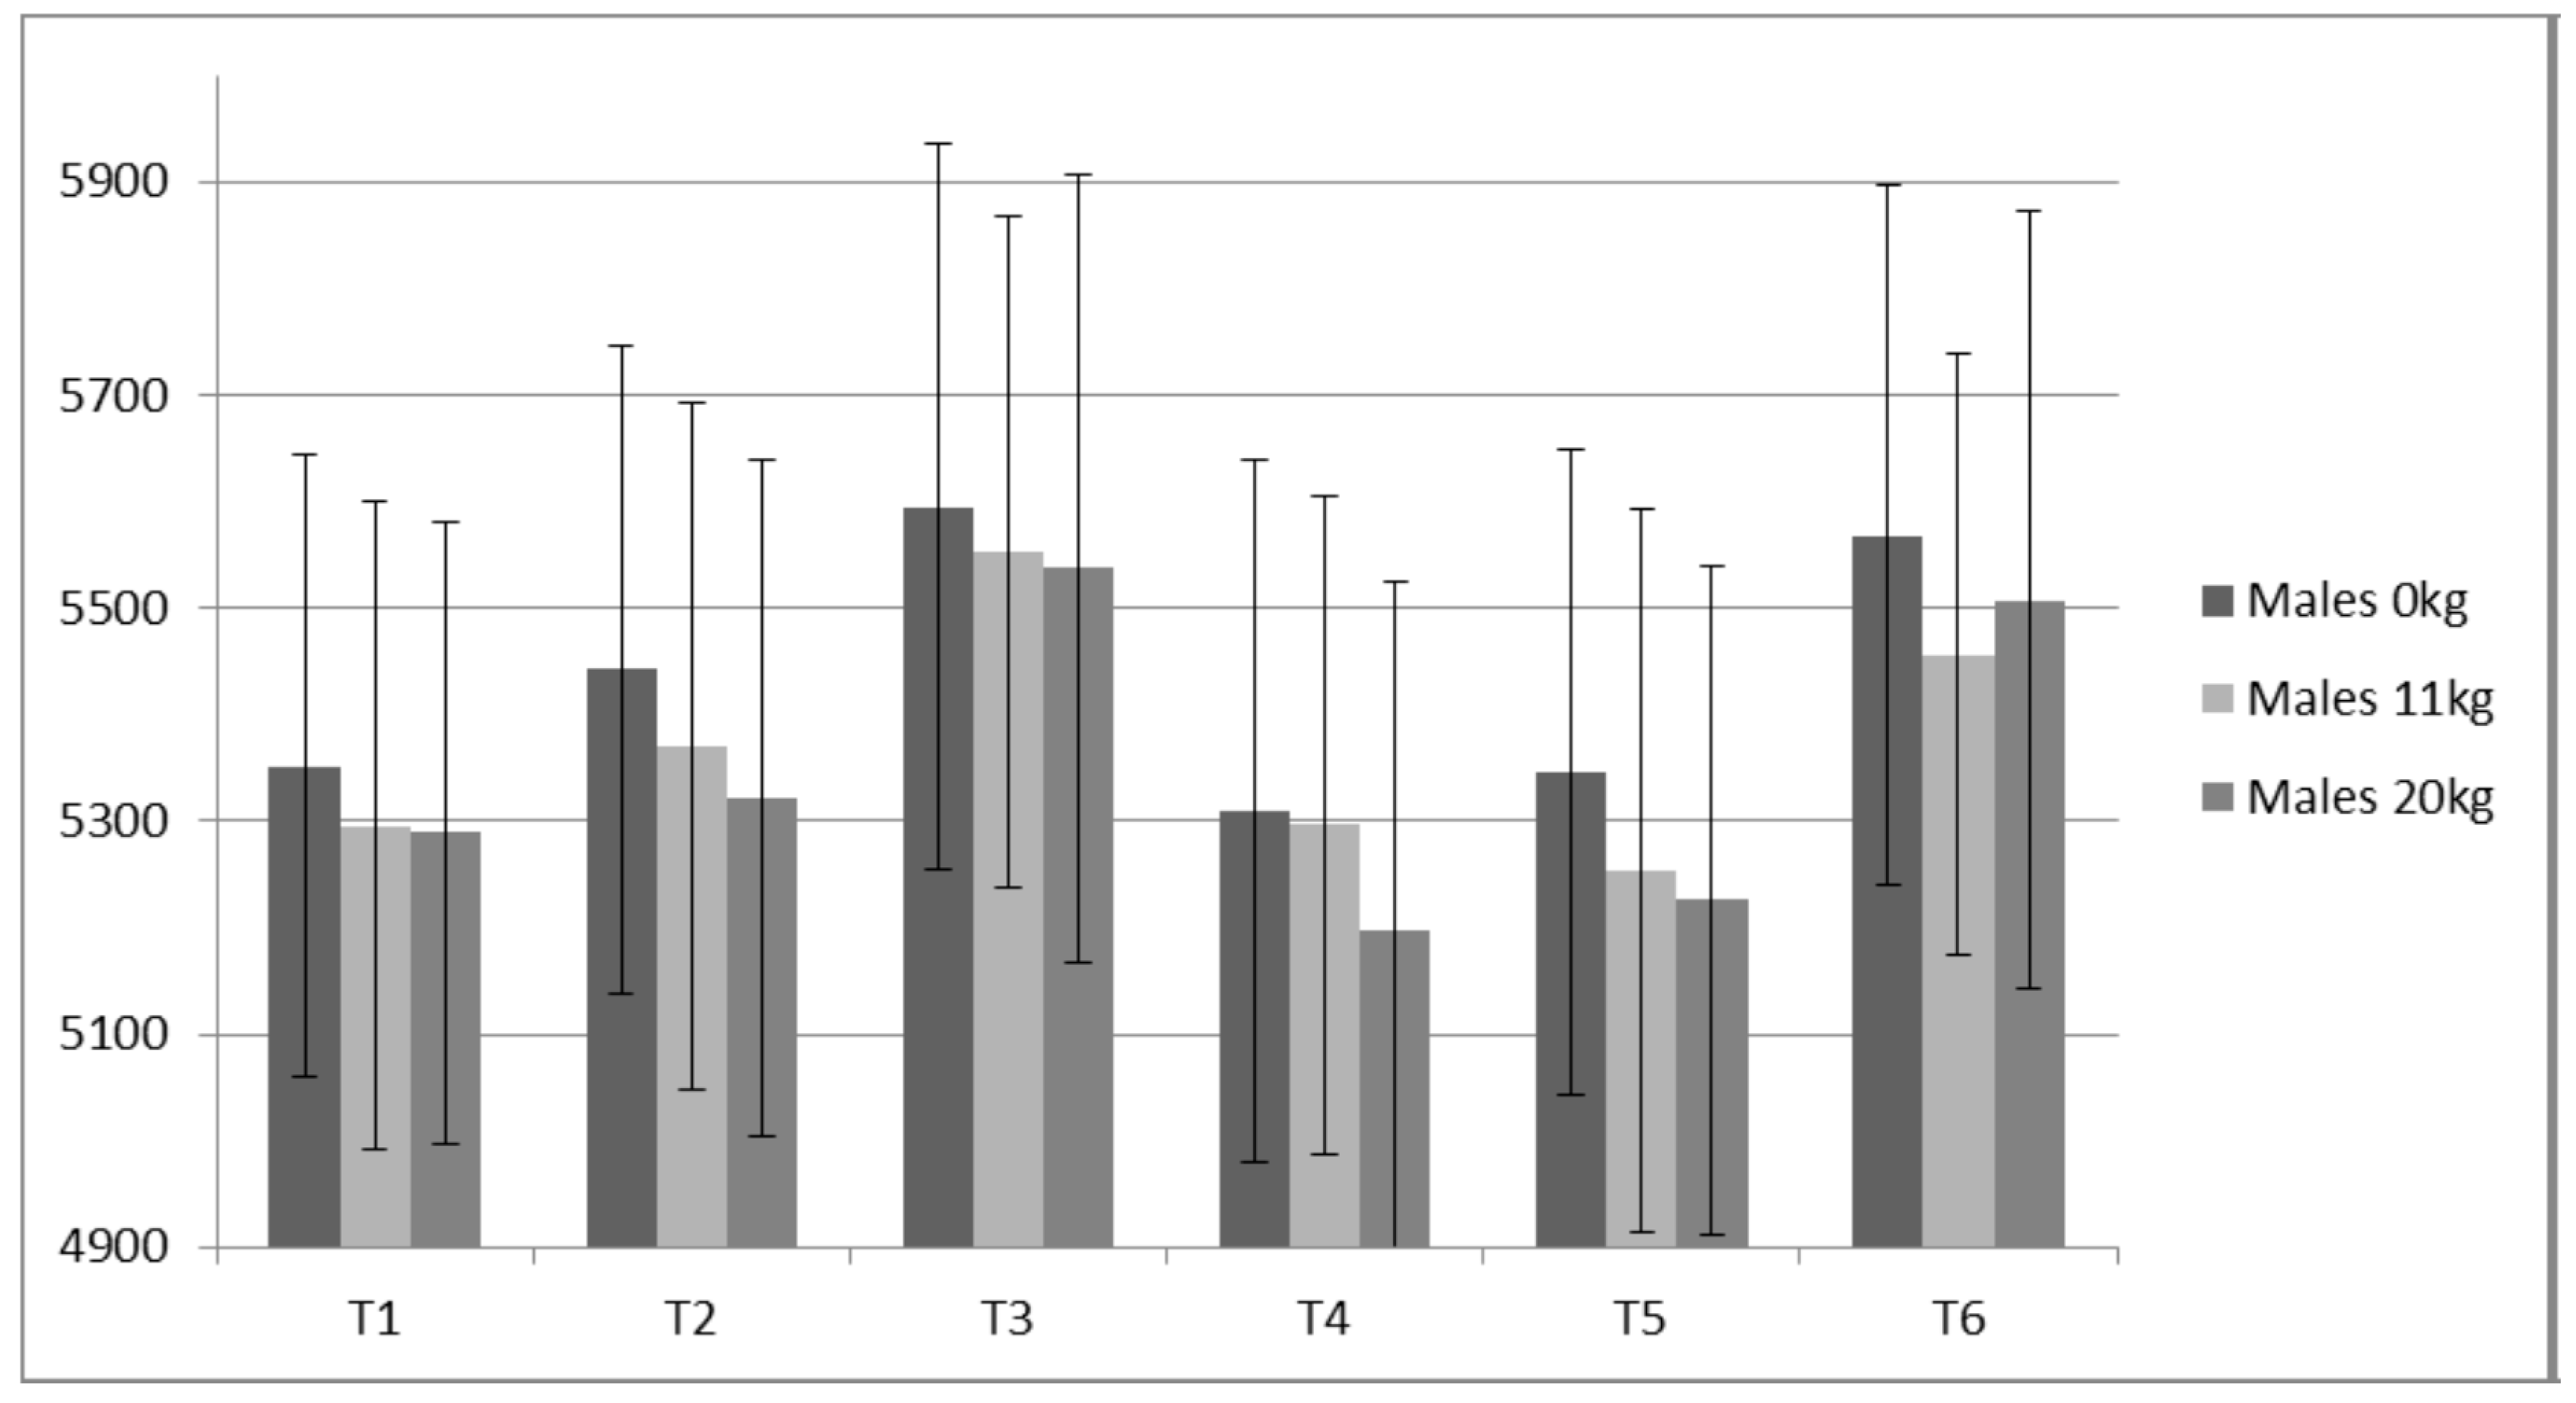
3.5. Static Vertical Jumping
4. Discussion
4.1. Body Composition
4.2. Isometric Mid-Thigh Pull Variables
4.3. Static Vertical Jump Data
4.4. Manipulating Training Stress
5. Conclusions
Author Contributions
Conflicts of Interest
References
- DeWeese, B.H.; Hornsby, W.G.; Stone, M.; Stone, M.H. The training process: Planning for strength–power training in track and field. Part 1: Theoretical aspects. J. Sport Health Sci. 2015, 4, 308–317. [Google Scholar] [CrossRef]
- DeWeese, B.H.; Hornsby, W.G.; Stone, M.; Stone, M.H. The training process: Planning for strength–power training in track and field. Part 2: Practical and applied aspects. J. Sport Health Sci. 2015, 4, 318–324. [Google Scholar] [CrossRef]
- Issurin, V.B. Generalized training effects induced by athletic preparation: A review. J. Sports Med. Phys. Fit. 2009, 49, 4. [Google Scholar]
- Issurin, V.B. New horizons for the methodology and physiology of training periodization. Sports Med. 2010, 40, 189–206. [Google Scholar] [CrossRef] [PubMed]
- Sands, W.A.; Kavanaugh, A.A.; Murray, S.R.; McNeal, J.; Jemni, M. Modern Techniques and Technologies Applied to Training and Performance Monitoring. Int. J. Sports Physiol. Perform. 2017, 12, 63–72. [Google Scholar] [CrossRef] [PubMed]
- Sands, W.A.; McNeal, J.R. Predicting athlete preparation and performance: A Theoretical perspective. J. Sport Behav. 2000, 23, 289–310. [Google Scholar]
- Smith, D.J. A framework for understanding the training process leading to elite performance. Sports Med. 2003, 33, 1103–1126. [Google Scholar] [CrossRef] [PubMed]
- Cissik, J.; Hedrick, A.; Barnes, M. Challenges applying the research on periodization. Strength Cond. J. 2008, 30, 45–51. [Google Scholar] [CrossRef]
- Haff, G.G. Roundtable discussion: Periodization of Training—Part 1. Strength Cond. J. 2004, 26, 50–69. [Google Scholar] [CrossRef]
- Stone, M.H.; Wathen, D. Letter to the editor. Strength Cond. J. 2001, 23, 7–9. [Google Scholar] [CrossRef]
- Painter, K.B.; Haff, G.G.; Ramsey, M.W.; McBride, J.; Triplett, T.; Sands, W.A.; Lamont, H.S.; Stone, M.E.; Stone, M.H. Strength Gains: Block Vs Dup Weight-Training among Track and Field Athletes. Int. J. Sports Physiol. Perform. 2012, 7, 161–169. [Google Scholar] [CrossRef] [PubMed]
- Bazyler, C.; Mizuguchi, S.; Sato, K.; DeWeese, B.; Stone, M.H. Changes in Muscle Architecture, Explosive Ability, and Track and Field Throwing Performance Throughout a Competitive Season and Following a Taper. J. Strength Cond. Res. 2017, 31, 2785–2793. [Google Scholar] [CrossRef] [PubMed]
- Kauhanen, H.; Hakkinen, K.; Komi, P.V. A biomechanical analysis of the snatch and clean & jerk techniques of Finnish elite and district level weightlifters. Scand. J. Med. Sci. Sports 1984, 6, 47–56. [Google Scholar]
- Carlock, J.M.; Smith, S.L.; Hartman, M.J.; Morris, R.T.; Ciroslan, D.A.; Pierce, K.C.; Stone, M.H. The relationship between vertical jump power estimates and weightlifting ability: A field-test approach. J. Strength Cond. Res. 2004, 18, 534–539. [Google Scholar] [CrossRef] [PubMed]
- Stone, M.H.; Sands, W.A.; Pierce, K.C.; Carlock, J.; Cardinale, M.; Newton, R.U. Relationship of maximum strength to weightlifting performance. Med. Sci. Sports Exerc. 2005, 37, 1037–1043. [Google Scholar] [PubMed]
- Garhammer, J. A Comparison of Maximal Power Outputs between Elite Male and Female Weightlifters in Competition. Int. J. Sport Biomech. 1991, 7, 3–11. [Google Scholar] [CrossRef]
- Chiu, L.Z. Powerlifting versus Weightlifting for Athletic Performance. J. Strength Cond. Res. 2007, 29, 55–57. [Google Scholar] [CrossRef]
- Plisk, S.; Stone, M.H. Periodization strategies. Strength Cond. J. 2003, 25, 37. [Google Scholar] [CrossRef]
- Hornsby, W.G.; Haff, G.G.; Sands, W.A.; Ramsey, M.W.; Stone, M.E.; Stone, M.H. Strength Characteristics for Isometric and Dynamic Mid-Thigh Pulls in Collegiate Thrower’s across 11 Weeks of Training. Gazz. Med. Ital. 2013, 172, 929–940. [Google Scholar]
- Stone, M.H.; Pierce, K.C.; Sands, W.A.; Stone, M.E. Weightlifting Part 1: A brief overview. Strength Cond. J. 2006, 28, 50–66. [Google Scholar] [CrossRef]
- Stone, M.H.; Pierce, K.C.; Sands, W.A.; Stone, M.E. Weightlifting Part 2: Program Design. Strength Cond. J. 2006, 10–17. [Google Scholar]
- Stone, M.H.; O’Bryant, H.S.; McCoy, L.; Coglianese, R.; Lehmkuhl, M.; Schilling, B. Power and maximum strength relationships during performance of dynamic and static weighted jumps. J. Strength Cond. Res. 2003, 17, 140–147. [Google Scholar] [PubMed]
- Haff, G.G. Quantifying Workloads in Resistance Training: A Brief Review. Prof. Strength Cond. 2010, 19, 31–40. [Google Scholar]
- MacLeod, H.; Sunderland, C. Fluid balance and hydration habits of elite female field hockey players during consecutive international matches. J. Strength Cond. Res. 2009, 23, 1245–1251. [Google Scholar] [CrossRef] [PubMed]
- Beckham, G.K.; Lamont, H.S.; Sato, K.; Ramsey, M.W.; Haff, G.G.; Stone, M.H. Isometric strength of powerlifters in key positions of the conventional deadlift. J. Trainol. 2012, 1, 32–35. [Google Scholar] [CrossRef]
- Beckham, G.K.; Sato, K.; Mizuguchi, S.; Haff, G.G.; Stone, M.H. Effect of body position on force production during the isometric mid-thigh pull. J. Strength Cond. Res. 2017. [Google Scholar] [CrossRef] [PubMed]
- Sands, W.A.; Stone, M.H. Are you progressing and how would you know? Olymp. Coach. 2005, 17, 4–10. [Google Scholar]
- Stone, M.H.; Stone, M.E.; Sands, W.A. Principles and Practice of Resistance Training; Human Kinetics: Champaigne, IL, USA, 2007. [Google Scholar]
- Hopkins, W.G.; Marshall, S.W.; Batterham, A.M.; Hanin, J. Progressive statistics for studies in sports medicine and exercise science. Med. Sci. Sports Exerc. 2009, 41, 3–13. [Google Scholar] [CrossRef] [PubMed]
- Buchhiet, M. Want to See My Report, Coach? Sport Science Reporting in the Real World. Aspetar Sports Med. J. 2017, 6, 36–42. [Google Scholar]
- Storey, A.G.; Birch, N.P.; Smith, H.K. Stress responses to short-term intensified and reduced training in competitive weightlifters. Scand. J. Med. Sci. Sports 2016, 26, 29–40. [Google Scholar]
- Scott, B. Quantifying the immediate recovery energy expenditure of resistance training. J. Strength Cond. Res. 2001, 25, 1159–1163. [Google Scholar] [CrossRef] [PubMed]


| N | Height (cm) | Body Mass (kg) | Age (year) | RT Age (years) | WL Age (years) | Snatch (kg) | Clean and Jerk (kg) | |
|---|---|---|---|---|---|---|---|---|
| Males | 4 | 175 ± 3.7 | 97.42 ± 11.6 | 27.8 ± 3.1 | 10.5 ± 5.6 | 6.1 ± 5.1 | 106.5 ± 31.8 | 132 ± 31.8 |
| Females | 3 | 166.2 ± 4.6 | 64.8 ± 2.9 | 22.8 ± 3.4 | 5.3 ± 2.5 | 3.0 ± 1.4 | 55.3 ± 6.4 | 69 ± 8.5 |
| Week | Measurement | Training Foci | Sets & Repetitions |
|---|---|---|---|
| 0 | WL | ||
| 1 | LM | Active Rest | 3 × 3 |
| 2 | Active Rest | 3 × 3 | |
| 3 | Strength Endurance | 3 × 10 | |
| 4 | Strength Endurance | 3 × 10 | |
| 5 | Strength Endurance | 3 × 10 | |
| 6 | LM | Strength Endurance | 3 × 10 |
| 7 | WL | Basic Strength | 3 × 5 (1 × 5) |
| 8 | Planned Overreaching | 5 × 5 | |
| 9 | Taper/Peaking | 3 × 3 (1 × 5) | |
| 10 | LM | Taper/Peaking | 3 × 3 (1 × 5) |
| 11 | WL | Taper/Peaking | 3 × 2 (1 × 5) |
| 12 | Active Rest | 3 × 3 (1 × 5) | |
| 13 | LM | Active Rest | 3 × 3 (1 × 5) |
| 14 | Planned Overreaching | 5 × 5 | |
| 15 | STRENGTH/power | 3 × 3 (1 × 5) | |
| 16 | STRENGTH/power | 3 × 3 (1 × 5) | |
| 17 | LM | STRENGTH/power | 3 × 2 (1 × 5) |
| 18 | Planned Overreaching | 5 × 5 | |
| 19 | Strength/POWER | 3 × 3 (1 × 5) | |
| 20 | WL & LM | Strength/POWER | 3 × 2 (1 × 5) |
| Block 1: Weeks 3–6 | Block 2: Weeks 7–11 | Block 3: Weeks 14–17 | Block 4: Weeks 18–20 |
|---|---|---|---|
| Monday/Thursday | Monday/Thursday | Monday/Thursday | Monday/Thursday |
| AM | AM | AM | AM |
| Squats | Squats (drop after 2nd week) | Squats | Squats |
| PM | PM | PM | PM |
| Front Squats | Push Press- | Push Press | Push Jerks (front squat 1st rep) |
| Standing Press | change to Push Jerks on week 3 | Jerk Recoveries | Jerk Recoveries |
| Wednesday | Wednesday | Wednesday | Wednesday |
| AM | AM | AM | AM |
| CGSS | CGSS | CGSS | CGSS |
| CGMTP | CG Pulls-Floor | CG Pulls-Floor | CG Pulls-Floor |
| PM | PM | PM | PM |
| CGSS (20% less) | CGSS (20% less) | CGSS (20% less) | CGSS (20% less) |
| CG Pulls-Knee | CG Pulls-Knee | CG Pulls-Knee | CG Pulls-Knee |
| CGMTP | CGMTP | CGMTP | CGMTP |
| SLDL | SLDL | SLDL | SLDL |
| Saturday | Saturday | Saturday | Saturday |
| SGSS | SGSS | SGSS | SGSS |
| Undulating Snatch 10 × 1 | Undulating Snatch 5 × 1 | Undulating Snatch 5 × 1 | Undulating Snatch 5 × 1 |
| (up to 85% of best on week 4) | (up to 90% of best on week 4) | (up to 85% of best on week 4) | (up to 90% of best on week 2) |
| SG-SLDL | Undulating Clean and Jerk 5 × 1 | Undulating Clean and Jerk 5 × 1 | Undulating Clean and Jerk 5 × 1 |
| Lateral raises | (up to 90% of best on week 3) | (up to 80% of best on week 3) | (up to 90% on week 1) |
| SG-SLDL | SG-SLDL | SG-SLDL |
| Week | Monday | Wednesday | Thursday | Friday | Saturday |
|---|---|---|---|---|---|
| 1 | 60–65% | 60–65% | |||
| 2 | 60–65% | 65–70% | 65–70% | ||
| 3 | 75–80% | 70–75% | 80–85% | 80–85% | |
| 4 | 80–85% | 70–75% | 80–85% | 85–90% | |
| 5 | 85–90% | 70–75% | 75–80% | 90–95% | |
| 6 | 75–80% | 70–75% | 75–80% | WL | |
| 7 | 75–80% | 70–75% | 80–85% | 80–85% | |
| 8 | 80–85% | 75–80% | 80–85% | 85–90% | |
| 9 | 85–90% | 75–80% | 75–80% | 90–95% | |
| 10 | 90–95% | 80–85% | 70–75% | 90–95% | |
| 11 | 75–80% | 70–75% | 75–80% | WL | |
| 12 | 70–75% | 70–75% | 75–80% | ||
| 13 | 75–80% | 70–75% | 70–75% | ||
| 14 | 75–80% | 70–75% | 80–85% | 80–85% | |
| 15 | 80–85% | 75–80% | 80–85% | 85–90% | |
| 16 | 85–90% | 75–80% | 75–80% | 90–95% | |
| 17 | 90–95% | 80–85% | 70–75% | 90–95% | |
| 18 | 75–80% | 75–80% | 80–85% | 80–85% | |
| 19 | 80–85% | 75–80% | 80–85% | 85–90% | |
| 20 | 85–90% | 80–85% | 70–75% | WL |
| Variable | T1 | T2 | T3 | T4 | T5 | T6 | %Δ (T1–T6) |
|---|---|---|---|---|---|---|---|
| Females Bdm (kg) | 64.8 ± 3.7 | 64.7 ± 2.8 | 64.9 ± 2.9 | 64.7 ± 3 | 65.8 ± 4.3 | 64.8 ± 2.9 | 0 |
| Females % Fat | 16.5 ± 6.3 | 15.9 ± 4.3 | 16.1 ± 4.7 | 15.2 ± 6.4 | 17.2 ± 6.0 | 17.0 ± 6.3 | 3 |
| Females FFM (kg) | 53.9 ± 2.6 | 54.3 ± 0.4 | 54.4 ± 0.7 | 54.7 ± 1.6 | 54.3 ± 0.7 | 53.7 ± 1.7 | −0.4 |
| Males Bdm (kg) | 97.4 ± 11.6 | 100.4 ± 10.9 | 99.1 ± 10.8 | 99.4 ± 10.9 | 100 ± 11.4 | 99 ± 11.8 | 1.6 |
| Males % Fat | 22.5 ± 10.4 | 19.7 ± 10.6 | 20.5 ± 11.9 | 21 ± 11 | 21.6 ± 11 | 20.9 ± 10.9 | −7.1 |
| Males FFM (kg) | 74.8 ± 7.06 | 79.9 ± 6.2 | 78 ± 8 | 77.6 ± 6.9 | 77.7 ± 5.6 | 77.5 ± 6.9 | 3.6 |
| T1 | T2 | T3 | T4 | T5 | T6 | p Value | |
|---|---|---|---|---|---|---|---|
| Females PF (N) | 3840 ± 440 | 3865 ± 706 | 3952 ± 3641 | 3745 ± 756 | 3815 ± 502 | 3946 ± 519 | 0.403 |
| Females RFD (N∙s−1) | 7663 ± 1581 | 7430 ± 3141 | 7867 ± 600 | 7069 ± 1476 | 7873 ± 2352 | 7152 ± 1580 | 0.727 |
| Males PF (N) | 5705 ± 621 | 5703 ± 193 | 6089 ± 178 | 5448 ± 5448 | 5932 ± 272 | 5900 ± 131 | 0.771 |
| Males RFD (N∙s−1) | 16,652 ± 3042 | 15,952 ± 1397 | 17,427 ± 1209 | 14,563 ± 2933 | 14,639 ± 2292 | 16,772 ± 3210 | 0.400 |
| MBI | T1–T2 | T2–T3 | T3–T4 | T4–T5 | T5–T6 | T1–T6 |
|---|---|---|---|---|---|---|
| Females PF %Δ | 0.65% | 2.26% | −5.23% | 1.87% | 3.42% | 2.77% |
| Females PF d | 0.04 | 0.13 | 0.29 | 0.11 | 0.26 | 0.22 |
| Males PF %Δ | −0.04% | 6.77% | −10.53% | 8.88% | −0.05% | 3.40% |
| Males PF d | 0.01 | 2.08 | 2.89 | 1.83 | 0.15 | 0.43 |
| Females RFD %Δ | −3.00% | 5.88% | −10.14% | 11.38% | −9.15% | −6.66% |
| Females RFD d | 0.09 | 0.19 | 0.7 | 0.41 | 0.36 | 0.32 |
| Males RFD %Δ | −4.20% | 9.25% | −16.43% | 0.52% | 14.57% | 0.72% |
| Males RFD d | 0.3 | 1.13 | 1.28 | 0.03 | 0.76 | 0.38 |
| T1 | T2 | T3 | T4 | T5 | T6 | p Value | |
|---|---|---|---|---|---|---|---|
| Females 0 kg JH | 28.5 ± 3.9 | 29.5 ± 5.3 | 29.9 ± 5.4 | 29.4 ± 4.2 | 28.2 ± 6.1 | 28.1 ± 5.6 | 0.55 |
| Females 11 kg JH | 22.8 ± 4.1 | 24.9 ± 4 | 24.6 ± 4.6 | 25.2 ± 3.9 | 24.3 ± 6 | 24 ± 3.9 | 0.223 |
| Females 20 kg JH | 19.8 ± 3 | 21.3 ± 4 | 21.3 ± 2 | 20.6 ± 2.6 | 20.2 ± 5.2 | 21.2 ± 3.9 | 0.715 |
| Females 0 kg PP | 3195 ± 495 | 3318 ± 437 | 3284 ± 505 | 3275 ± 457 | 3298 ± 463 | 3353 ± 340 | 0.365 |
| Females 11 kg PP | 3130 ± 424 | 3303 ± 365 | 3235 ± 392 | 3292 ± 448 | 3307 ± 512 | 3340 ± 257 | 0.029 |
| Females 20 kg PP | 3164 ± 496 | 3196 ± 372 | 3223 ± 313 | 3191 ± 371 | 3261 ± 451 | 3338 ± 315 | 0.048 |
| Males 0 kg JH | 32.7 ± 7.5 | 32.5 + 7.2 | 33.8 + 7.5 | 34.1 + 8.3 | 32.4 + 8 | 34.7 + 9.2 | 0.572 |
| Males 11 kg JH | 29.3 ± 7 | 29.6 ± 7 | 30.1 ± 6.7 | 30.2 ± 6.7 | 28.7 ± 7.6 | 31 ± 8 | 0.197 |
| Males 20 kg JH | 27.5 ± 6.7 | 25.9 ± 7.5 | 28.4 ± 7.4 | 28.0 ± 7.8 | 26 ± 7 | 28.4 ± 7.7 | 0.266 |
| Males 0 kg PP | 5257 ± 672 | 5361 ± 698 | 5560 ± 781 | 5240 ± 758 | 5193 ± 698 | 5536 ± 753 | 0.466 |
| Males 11 kg PP | 5240 ± 697 | 5273 ± 740 | 5477 ± 724 | 5252 ± 709 | 5159 ± 781 | 5408 ± 646 | 0.396 |
| Males 20 kg PP | 5261 ± 669 | 5239 ± 730 | 5471 ± 849 | 5216 ± 752 | 5130 ± 721 | 5411 ± 840 | 0.756 |
| MBI | T1–T2 | T2–T3 | T3–T4 | T4–T5 | T5–T6 | T1–T6 |
|---|---|---|---|---|---|---|
| Females PP 0kg %Δ | 3.85% | −1.03% | −0.25% | 0.69% | 1.65% | 4.90% |
| Females PP 0kg d | 0.26 | 0.07 | 0.02 | 0.05 | 0.13 | 0.37 |
| Males PP 0kg %Δ | 1.98% | 3.71% | −5.76% | −0.90% | 6.60% | 5.30% |
| Males PP 0kg d | 0.15 | 0.27 | 0.42 | 0.06 | 0.47 | 0.39 |
| Females PP 11kg %Δ | 5.52% | −2.05% | 1.76% | 0.44% | 1.00% | 6.70% |
| Females PP 11kg d | 0.44 | 0.18 | 0.13 | 0.03 | 0.08 | 0.6 |
| Males PP 11kg %Δ | 0.63% | 3.87% | −4.11% | −1.77% | 4.83% | 3.20% |
| Males PP 11kg d | 0.05 | 0.28 | 0.31 | 0.12 | 0.35 | 0.25 |
| Females PP 20kg %Δ | 1.00% | 0.86% | −1.00% | 2.19% | 2.36% | 5.50% |
| Females PP 20kg d | 0.07 | 0.08 | 0.09 | 0.17 | 0.2 | 0.42 |
| Males PP 20kg %Δ | −0.42% | 4.43% | −4.66% | −1.65% | 5.48% | 2.85% |
| Males PP 20kg d | 0.03 | 0.29 | 0.32 | 0.12 | 0.36 | 0.2 |
© 2017 by the authors. Licensee MDPI, Basel, Switzerland. This article is an open access article distributed under the terms and conditions of the Creative Commons Attribution (CC BY) license (http://creativecommons.org/licenses/by/4.0/).
Share and Cite
Hornsby, W.G.; Gentles, J.A.; MacDonald, C.J.; Mizuguchi, S.; Ramsey, M.W.; Stone, M.H. Maximum Strength, Rate of Force Development, Jump Height, and Peak Power Alterations in Weightlifters across Five Months of Training. Sports 2017, 5, 78. https://doi.org/10.3390/sports5040078
Hornsby WG, Gentles JA, MacDonald CJ, Mizuguchi S, Ramsey MW, Stone MH. Maximum Strength, Rate of Force Development, Jump Height, and Peak Power Alterations in Weightlifters across Five Months of Training. Sports. 2017; 5(4):78. https://doi.org/10.3390/sports5040078
Chicago/Turabian StyleHornsby, W. Guy, Jeremy A. Gentles, Christopher J. MacDonald, Satoshi Mizuguchi, Michael W. Ramsey, and Michael H. Stone. 2017. "Maximum Strength, Rate of Force Development, Jump Height, and Peak Power Alterations in Weightlifters across Five Months of Training" Sports 5, no. 4: 78. https://doi.org/10.3390/sports5040078