Article

A Psychometric Evaluation of a Swedish Version of the Positive–Negative Sex-Role Inventory (PN-SRI)

Neuropsychiatric Epidemiology Unit, Department of Psychiatry and Neurochemistry, Institute of Neuroscience and Physiology, Sahlgrenska Academy, Centre for Ageing and Health (AgeCap) at the University of Gothenburg, Wallinsgatan 6, 43141 Mölndal, Sweden
*
Author to whom correspondence should be addressed.
Ingmar Skoog and Hanna Falk are joint senior authors.
Societies 2018, 8(1), 13; https://doi.org/10.3390/soc8010013
Submission received: 22 December 2017 / Revised: 26 January 2018 / Accepted: 30 January 2018 / Published: 22 February 2018

Abstract

:
The Positive–Negative Sex-Role Inventory (PN-SRI) assesses gender identity. The aim of this study was to evaluate the validity and reliability of a Swedish version of the PN-SRI in a population of 70-year-olds within the Gothenburg H70-study in Sweden. The overarching objective of testing the PN-SRI within the H70-study was to evaluate its usability to further study gender identity in large population-based samples of older adults. A total of 1124 individuals participated in the psychometric testing. A sub-sample of these (n = 406) provided a comprehensive survey regarding societal norms on femininity and masculinity. Reliability and validity tests were performed using Cronbach’s Alpha and factor analyses. The Cronbach’s α coefficients (0.734–0.787) indicated a satisfactory level of internal consistency, and the four-factor model (Model 2) fitted the data at an acceptable level (root-mean-square error of approximation, RMSEA = 0.068, standardized root-mean-square residual, SRMR = 0.07). This cross-cultural adaptation of the PN-SRI indicates that it may be applicable in a Swedish research setting comprising older adults. Future research is needed to further test the psychometric properties of this scale. Adding the PN-SRI to population-based studies will contribute to providing a nuanced way of analyzing differences and similarities among men and women.

1. Introduction

The Positive–Negative Sex-Role Inventory (PN-SRI) is an instrument assessing gender identity and was developed in Germany in 2013 [1]. In addition to the PN-SRI, previous instruments designed to assess gender identity include the Sex Role Stereotype Questionnaire [2], the Personal Attributes Questionnaire [3], the Extended Personality Attributes Questionnaire [4], and the Bem Sex Role Inventory (BSRI) [5], all developed during the 1960s and 1970s. The researchers behind the PN-SRI argue that previous measures of gender identity have almost exclusively focused on the positive aspects of feminine and masculine personality traits, despite evidence that this self-concept includes both positive and negative aspects, in accordance with societal desirability [6]. The PN-SRI comprises both negative and positive aspects of masculinity and femininity, reflecting both desirability of personality traits (i.e., injunctive norms), as well as the extent to which the personality traits are stereotypically more common (i.e., descriptive norms) in men and women. Also, the original authors argue that negative aspects of gender identity make a unique contribution to the understanding of gender-related differences. Both positive and negative aspects of femininity, masculinity and androgyny have previously been suggested to be associated with various outcomes in health [7], such as self-reported wellbeing [8], sickness absence [9], allostatic load and physical complaints [10], as well as depression [11], indicating that gender may cross-cut the effects of biological sex [12]. There may be preconceptions that we become more ‘gender neutral’ as we age, due to a strong medical focus on the physical body when studying older persons, but norms, stereotypical behavior and gender identity are as present in older adults as in those who are younger or middle-aged [13].
There are only a small number of instruments measuring gender identity that are available in Swedish. The measure of psychological androgyny within BSRI was validated in a Swedish sample in 1980 [14]. Still, because normative attitudes regarding gender identity can change across time [15,16], it is crucial to modernize the content of measuring instruments in order to capture current gender norms, with which the PN-SRI may be a more suitable fit. Also, there are no Swedish instruments containing both positive and negative dimensions of gender-coded personality traits. The PN-SRI has so far been evaluated in a sample of young adults (approximated mean age 25 years) in Germany, showing good reliability and validity [1]. To establish the generalizability of the PN-SRI to a Swedish setting, the psychometric properties of the instrument need to be examined, and the items need to be translated. The aim of the present study was to evaluate the validity and reliability of a Swedish version of the Positive–Negative Sex-Role Inventory (PN-SRI) in a population of 70-year-olds within the Gothenburg H70-study in Sweden. The overarching objective of testing the PN-SRI within the H70-study was to evaluate the usability of the instrument and to further study gender identity in large population-based samples of older adults.

2. Materials and Methods

2.1. Setting and Sample

This study is part of the Gothenburg H70-study, which aim to study health and health-related factors in representative samples of older populations living in both ordinary and special housing in Gothenburg, Sweden. So far, the H70-study comprise six birth cohorts: (1) birth cohort 1901–1902 (baseline examination 1971–1972); (2) birth cohort 1906–1907 (baseline examination 1976–1977); (3) birth cohort 1911–1912 (baseline examination 1981–1982); (4) birth cohort 1922 (baseline examination 1992–1993); (5) birth cohort 1930 (baseline examination 2000–2001); and (6) birth cohort 1944 (baseline examination 2014–2016). A full description of the H70-study has been published in detail elsewhere [17]. As part of the H70-study, this study was conducted in accordance with the Declaration of Helsinki and was approved by the Regional Ethics Committee in Gothenburg (EPN) (dnr 869-13). All subjects gave their informed consent for inclusion before they participated in the study.
In 2014–2016, the H70-study birth cohort 1944, comprising 70-year-old men and women, was examined (n = 1203, response rate 72%). Out of 1203, a total of 1124 agreed to participate in the psychometric testing of gender identity. A convenience sample of those participating in the psychometric testing during the first three months (n = 446) was asked to take part in an additional, more comprehensive survey regarding societal norms on femininity and masculinity. Out of these 446, the additional comprehensive survey was completed by 406 participants. Only the sample participating in the psychometric testing of gender identity (n = 1124), and the sample completing the comprehensive survey (n = 406) will be in included in the analyses.

2.2. Instruments

Questions about gender identity were collected using the PN-SRI as a self-rating form. The PN-SRI comprises 24 gender-coded personality traits (items) that are self-rated as to the participant’s level of agreement on a seven-step scale, ranging from 1 point (never or almost never true) to 7 points (always or almost always true). The scale contains dimensions of social desirability, and all items are classified as either positive (desirable) or negative (undesirable). Item classification of femininity, masculinity and social desirability is further described in the third study of the original publication [1]. The study participants in the original publication were asked to rate each personality trait in terms of its typicality for men and women, and its desirability for a person to possess it. The 24 items are divided into one femininity scale (12 items) and one masculinity scale (12 items), ranging from 12 points (indicating low level of femininity/masculinity) to 84 points (indicating high level of femininity/masculinity). The femininity scale and masculinity scale each consist of two sub-scales: FEM+ with six items reflecting positive feminine personality traits, and FEM− with six items reflecting negative feminine personality traits; MAS+ with six items reflecting positive masculine personality traits, and MAS− with six items reflecting negative masculine personality traits (see Table 1). Each sub-scale ranges from 6 to 42 points. In the original publication, the Cronbach’s α coefficients for the four sub-scales were: 0.81 (M+); 0.80 (M−); 0.88 (F+); and 0.74 (F−) [1].
An androgyny score is calculated as the difference (t ratio) between the femininity scale and the masculinity scale, reflecting the relative amount of masculinity and femininity that a person includes in his or her self-descripted gender identity. The higher the value of the t ratio, the stronger masculine or feminine gender role a person has. A value closer to 0 indicates an androgynous gender role where both masculine and feminine personality traits are endorsed. The androgynous gender role can be predominantly positive, negative, or neutral based on which gender-coded personality traits are included. The dimensions of the PN-SRI are illustrated in Figure 1.

2.3. Translation

After obtaining permission from the original authors, a cyclic process of forward translations, back translations, and evaluation of translation correspondence by professional translators was conducted to achieve conceptual equivalence between the original and Swedish translation of the PN-SRI (see Appendix Table A1). Respondents reported no problems related to understanding the wording in the Swedish version of the PN-SRI.

2.4. Additional Survey

In order to support the face validity of the PN-SRI classification of feminine and masculine personality traits confirmed by the authors of this paper, data from the study participants were used. Six months following the examination, a more comprehensive survey was provided by mail to the sub-sample (n = 406) regarding the PN-SRI attributes in accordance with Swedish societal norms. First, the participants were asked to choose whether the listed personality traits were considered to be desirable (positive) or non-desirable (negative), according to Swedish norms. Second, they were asked whether the listed personality traits were considered to be stereotypically more feminine or masculine. The choices of answers for all questions were binary (positive/negative and feminine/masculine).

2.5. Statistical Analysis

The distribution of the PN-SRI scores obtained from the psychometric testing (n = 1124) were examined regarding skewness, kurtosis, proportion of respondents scoring at maximum (ceiling) and minimum (floor) levels and the extent to which the full range of possible scores was used. To test whether the scale distribution for the total, femininity, and masculinity scales were normal or non-normal, a Kolmogorov–Smirnov test was performed. There is no theoretical justification for creating a total score across all 24 items or across the positive and negative facets of the masculine and feminine subscales. Therefore, internal consistency of the femininity scale, the masculinity scale, and the four sub-scales (MAS+, MAS−, FEM+ and FEM−) was examined using Cronbach’s Alpha. The level for acceptable reliability was set to α ≥ 0.7 [18,19].
To compare proportions between those who participated in both the psychometric testing and the additional comprehensive survey (n = 406) and those who only participated in the psychometric testing (n = 718), Fisher’s exact test was used. The answers from the additional survey were examined using Cronbach’s Alpha. The level for acceptable reliability was set to α ≥ 0.7 [18,19]. Statistical analyses were carried out using IBM SPSS STATISTICS 22.
To test whether the 24 items were correlated, a Pearson correlation test was performed. Construct validity was tested with factor analysis using three models. To investigate the internal structure of the scale, an exploratory factor analysis (Model 1) was performed on the full range of the seven-point metric response scale. To test whether the four sub-scales (MAS+, MAS−, FEM+ and FEM−) represented independent scales, as in the original article [1], a confirmatory factor analysis without constraints was performed (Model 2) on the full range of the seven-point metric response scale. The subsequent factor structure was: (1) MAS+ (factor): analytical, logical, objective, practical, rational, and solution-focused (indicators); (2) MAS− (factor): arrogant, boastful, harsh, inconsiderate, power-hungry, and ostentatious (indicators); (3) FEM+ (factor): emotional, empathic, loving, passionate, sensitive, and tender (indicators); and (4) FEM− (factor): anxious, disoriented, naïve, overcautious, oversensitive, and self-doubting (indicators). To confirm the proposed model based on a priori information of the exploratory factor analysis, two confirmatory factor analyses of principal components were performed (Models 3 and 4). Goodness-of-fit for Models 2, 3 and 4 was indicated by the standardized root-mean-square residual (SRMR ≤ 0.08), the root-mean-square error of approximation (RMSEA ≤ 0.08, p < 0.05) and standardized factor loadings. Factors were allowed to correlate. The statistical package used for the factor analyses was R (Lavaan package) [20].

3. Results

3.1. Demographic Data

Demographic characteristics for the total sample (n = 1124) and the sub-sample (n = 406) are presented in Table 2. There were no differences between those who participated in the sub-sample (n = 406) and those who did not (n = 718), except that educational level was higher among those who participated in the sub-sample compared to those who did not.

3.2. Score Distributions

The distribution of the PN-SRI scores obtained from the total sample (n = 1124) can be seen in Table 3. In this table, results from comparing the scores between men and women are also shown. The mean difference in the self-rating between women and men was significant for all except seven of the 24 items (rational, naïve, harsh, passionate, disoriented, inconsiderate, and overcautious). The mean and median scores were similar for the total, femininity and masculinity scales. The significance test for normality for the total scale (D(1117) = 0.05, p < 0.05), the femininity scale (D(1117) = 0.04, p < 0.05), and the masculinity scale (D(1117) = 0.06, p < 0.05), showed that they were non-normal.

3.3. Reliability Tests

The Cronbach’s α coefficient of the 12 PN-SRI masculinity scale items was 0.734; and the 12 PN-SRI femininity scale items was 0.747, indicating a satisfactory level of internal consistency (n = 1124). Further, the Cronbach’s α coefficient for the four sub-scales was 0.775 (MAS+); 0.748 (MAS−); 0.785 (FEM+); and 0.710 (FEM−). In addition, the coefficient of the survey answers was 0.787 for the 24 PN-SRI items on a total scale (n = 406).

3.4. Validity Tests

Table 4 displays the participant item classification (desirability, femininity and masculinity) collected by the additional survey (n = 406). The majority of both men and women confirmed the original classification of the PN-SRI items, both regarding whether they are considered socially desirable and whether they are considered to be feminine or masculine. The results suggest strong face validity of the PN-SRI content.
In Table 5, the loadings of the items on their respective factor are presented for Models 1, 2, 3 and 4. In Model 1, four factors emerged with the same item structure as proposed in the original publication (MAS+, MAS−, FEM+, FEM−). In Model 2, the results from testing the four-factor solution without constraints showed that the model fitted the data on an acceptable level (RMSEA = 0.068 p < 0.05, SRMR = 0.07). MAS+ and MAS− showed a positive but weak correlation (r = 0.12, p < 0.01), as did FEM+ and FEM− (r = 0.24, p < 0.01), MAS+ and FEM+ (r = 0.34, p < 0.01); and MAS− and FEM− (r = 0.41, p < 0.01). Negative correlations were found between MAS+ and FEM− (r = −0.22, p < 0.01), as well as between MAS− and FEM+ (r = −0.08, p < 0.05).
Figure 2 shows a correlation matrix for all 24 PN-SRI items, indicating the four data clusters (MAS+, MAS−, FEM+, FEM−).

4. Discussion

The aim of this study was to examine the reliability and validity of a Swedish version of the Positive-Negative Sex-Role Inventory (PN-SRI) in a representative population-based sample of 70-year-olds.
The scores of the PN-SRI were not normally distributed. However, the full range of the scale was used with no ceiling or floor effects, indicating that PN-SRI may be a suitable instrument measuring gender-roles in population-based studies. The results showed acceptable psychometric properties in regard to validity and reliability. The response rate was high, both in the total sample (93.5%) and in the sub-sample (91.0%), and the representativeness regarding sex and other socioeconomic factors adds to the generalizability of our findings.
There was a discrepancy between the identified norms, and the PN-SRI self-ratings. The mean difference in the self-rating between women and men was not significant for the PN-SRI total score or for seven of the individual 24 items: rational, naïve, harsh, passionate, disoriented, inconsiderate, and overcautious. This suggests that, despite the awareness of societal gender norms, the expression of gender identity in this population is, in total, not significantly different between men and women. However, the mean difference between women and men was significant for the femininity scale, the masculinity scale, and for each of the four sub-scales (MAS+, MAS−, FEM+, FEM−). At an item level, men and women may incorporate feminine or masculine traits to a smaller, higher, or equal degree. While, for example, it was revealed that the item ‘naïve’ was not significantly different between the sexes, women showed a higher mean level for the item ‘emotional’ (confirming societal descriptive norm), and the item ‘practical’ (rejecting societal descriptive norms). These findings add to the idea that the PN-SRI contributes by providing a nuanced way of comparing men and women in research settings, by considering gender.
Gender is a social construction in which both men and women engage when being members of a society, shaping and submitting to normative social structures of femininity and masculinity, which can change over time and differ between cultures [15,16]. To varying degrees, we all incorporate these shared beliefs about the qualities of women and men into our own self-concept, creating a gender identity [16]. Most research in the field of medicine uses the biological meaning of “sex” when distinguishing women from men, leaving out the aspects of gender. Here, the term “sex” refers to the biological male and female characteristics, while the term “gender” or “gender identity”—containing gender coded personality traits—refers to attributes that traditionally can be associated with one sex or the other, according to societal norms [16,21]. Due to stigma, as well as political awareness, the gender-coded personality traits are potentially at risk of social desirability bias. Also, there is always a risk of the consolidation of gender roles when they are put in focus. When analyzing and discussing the results generated from the PN-SRI data, aspects of equality and the discrepancies between men and women regarding societal power structures should be included. Reducing gender identity to a fixed set of personality traits requires serious consideration of the ways in which it is used to structure differences and similarities between individuals. Thus, when including gender identity in research, results must be interpreted with caution.
This study has several strengths. Unlike some of the previous and most frequently used gender scales [5,22], the PN-SRI includes both positive and negative facets of gender identity, recognizing that our self-concept is not limited only to positive personality traits [6]. The use of a combination of positive and negative aspects of gender identity has recently been supported by others [23], and research related to the division of the positive/negative feminine, masculine and androgynous aspects of gender identity has previously been published; however, these were based on other gender-coded personality traits than those used in the PN-SRI [7]. To the best of our knowledge, this is the first time the gender-coded personality traits in the PN-SRI have been tested among older adults in a Swedish context. Together with the original authors, we argue that the PN-SRI should be considered in research on gender identity on the basis that the attributes included are up to date with our current normative framework regarding femininity and masculinity [1]. However, this may differ in other cultural contexts, and will change over time. Although the PN-SRI has now been tested for psychometric properties in two different settings, the inference of our findings cannot yet be supported due to a lack of previous studies. More research is needed to establish whether the PN-SRI can be used outside the cultural contexts of Germany and Sweden. However, based on our results we suggest that the PN-SRI, as a four-factor solution, can be an indicator of both positive and negative aspects of femininity and masculinity.

Limitations

The study has some limitations. First, the additional survey provided by the sub-sample, six months after they participated in the H70-study psychometric testing, only included a binary choice of answers for all questions. The study could have benefited from having had a seven-step scale, ranging from 1 point (never or almost never true) to 7 points (always or almost always true), in accordance with the self-rating levels of the PN-SRI. Still, our questions regarding gender-related injunctive and descriptive norms in Swedish society were answered and confirmed by the majority of participants, suggesting strong face validity. Second, the distributions of both the femininity and the masculinity scales were non-normal. Third, when performing the factor analysis, all standardized factor loadings for the indicators, specified to measure their respective factor, did not reach the level of ≥0.50, suggesting only a mediocre level of convergent validity when considering a strict goodness-of-fit criteria [24]. However, in larger samples (>1000), factor loadings >0.162 can be considered significant [25]. Although not reaching a CFI > 0.9 for Models 2 and 3 (CFI = 0.82/0.83), the SRMR and RMSEA were satisfactory, suggesting a sufficiently good fit to support accepting the model [26]. Also, the correlations between the majority of items are low in this study, indicating that a CFI < 0.9 may to some extent be expected, and may therefore be a biased measure for discarding our results. In addition, all items fell into the four dimensions in the exploratory factor analysis (Model 1). R2smc ≥ 0.50 was not reached for all individual indicators. However, the factor structure and indicator loadings showed resemblance with the findings in the original publication [1]. Their slight discrepancy could be due to the difference in population size or mean age between the two studies, or may have been caused by cultural variance between Germany and Sweden. Fourth, the level of education was slightly higher among those who participated in the sub-sample, compared to those who did not. However, this is not considered to have affected the results in a negative way. Fifth, we were unable to compare the Swedish version of the PN-SRI to other measuring scales in this study, due to the lack of other Swedish instruments containing both positive and negative dimensions of gender-coded personality traits. Despite the stated limitations of this study, our results showed acceptable levels of validity and reliability and suggest that a four-factor solution of the PN-SRI may be applicable in a Swedish research setting of older adults. However, future research is needed to further test the psychometric properties of the PN-SRI.

5. Conclusions

This cross-cultural adaptation of the PN-SRI indicates that it may be applicable in a Swedish research setting comprising older adults. Future research is needed to further test the psychometric properties of this scale. Adding the PN-SRI to population-based studies will contribute to providing a nuanced way of analyzing differences and similarities among men and women.

Acknowledgements

Swedish Research Council for Health, Working Life and Welfare (AGECAP no 2013-2300 and no 2013-2496). This study was accomplished while author T.R.S. was affiliated with the Swedish National Graduate School for Competitive Science on Ageing and Health (SWEAH), which is funded by the Swedish Research Council.

Author Contributions

T.R.S. and P.G. designed the study. I.S. was the principal investigator of the Gothenburg H70-study in which this study was carried out. T.R.S. conducted the data collection. T.R.S., K.B. and N.S. conducted the analyses. T.R.S. and H.F. drafted the manuscript. All authors contributed to the interpretation of data, commented on drafts of the manuscript and read and approved the final manuscript.

Conflicts of Interest

The authors declare no conflict of interest. The founding sponsors had no role in the design of the study; in the collection, analyses, or interpretation of data; in the writing of the manuscript, and in the decision to publish the results.

Appendix A

Table A1. Swedish translation of PN-SRI items (from German and English).
German aEnglish aSwedish Translation
1AnalytischAnalyticalAnalytisk
2EinfühlsamEmpathicEmpatisk
3RationalRationalRationell
4NaïveNaïveNaiv
5GefühlvollSensitiveKänslig
6ÜberheblichArrogantArrogant
7ÄngstlichAnxiousÄngslig
8AngeberischOstentatiousUppseendeväckande
9SachlichObjectiveObjektiv
10SchroffHarshSträng/barsk
11ÜberempfindlichOversensitiveÖverkänslig
12LogischLogicalLogisk
13LiedenschaftlichPassionatePassionerad
14EmotionalEmotionalEmotionell
15PrahlerischBoastfulSkrytsam
17PraktischPracticalPraktisk
16OrientierungslosDisorientedDesorienterad
18ZärtlichTenderÖmsint
19RücksichtslosInconsiderateHänsynslös
20MachtbesessenPower-hungryMaktgirig
21ÜbervorsichtigOvercautiousÖverdrivet försiktig
22LiebevollLovingKärleksfull
23SelbstzweifelndSelf-doubtingTvivlar på sig själv
24LösungsorientiertSolution-focusedFokuserad på problemlösning
a Appear in: Berger A, Krahé B. Negative attributes are gendered too: Conceptualizing and measuring positive and negative facets of sex-role identity. Eur J Soc Psychol. 2013; 43(6): 516–31.

References

  1. Berger, A.; Krahé, B. Negative attributes are gendered too: Conceptualizing and measuring positive and negative facets of sex-role identity. Eur. J. Soc. Psychol. 2013, 43, 516–531. [Google Scholar] [CrossRef]
  2. Rosenkrantz, P.; Bee, H.; Vogel, S.; Broverman, I. Sex-role stereotypes and self-concepts in college students. J. Consult. Clin. Psychol. 1968, 32, 287–295. [Google Scholar] [CrossRef] [PubMed]
  3. Spence, J.T.; Helmreich, R.; Stapp, J. The Personal Attributes Questionnaire: A Measure of Sex Role Stereotypes and Masculinity-Femininity; Journal Supplement Abstract Service, American Psychological Association: Washington, DC, USA, 1974; p. 4.
  4. Spence, J.T.; Helmreich, R.L.; Holahan, C.K. Negative and positive components of psychological masculinity and femininity and their relationships to self-reports of neurotic and acting out behaviors. J. Personal. Soc. Psychol. 1979, 37, 1673–1682. [Google Scholar] [CrossRef]
  5. Bem, S.L. The measurement of psychological androgyny. J. Consult. Clin. Psychol. 1974, 42, 155–162. [Google Scholar] [CrossRef] [PubMed]
  6. Banaji, M.R.; Prentice, D.A. The Self in Social Contexts. Annu. Rev. Psychol. 1994, 45, 297–332. [Google Scholar] [CrossRef]
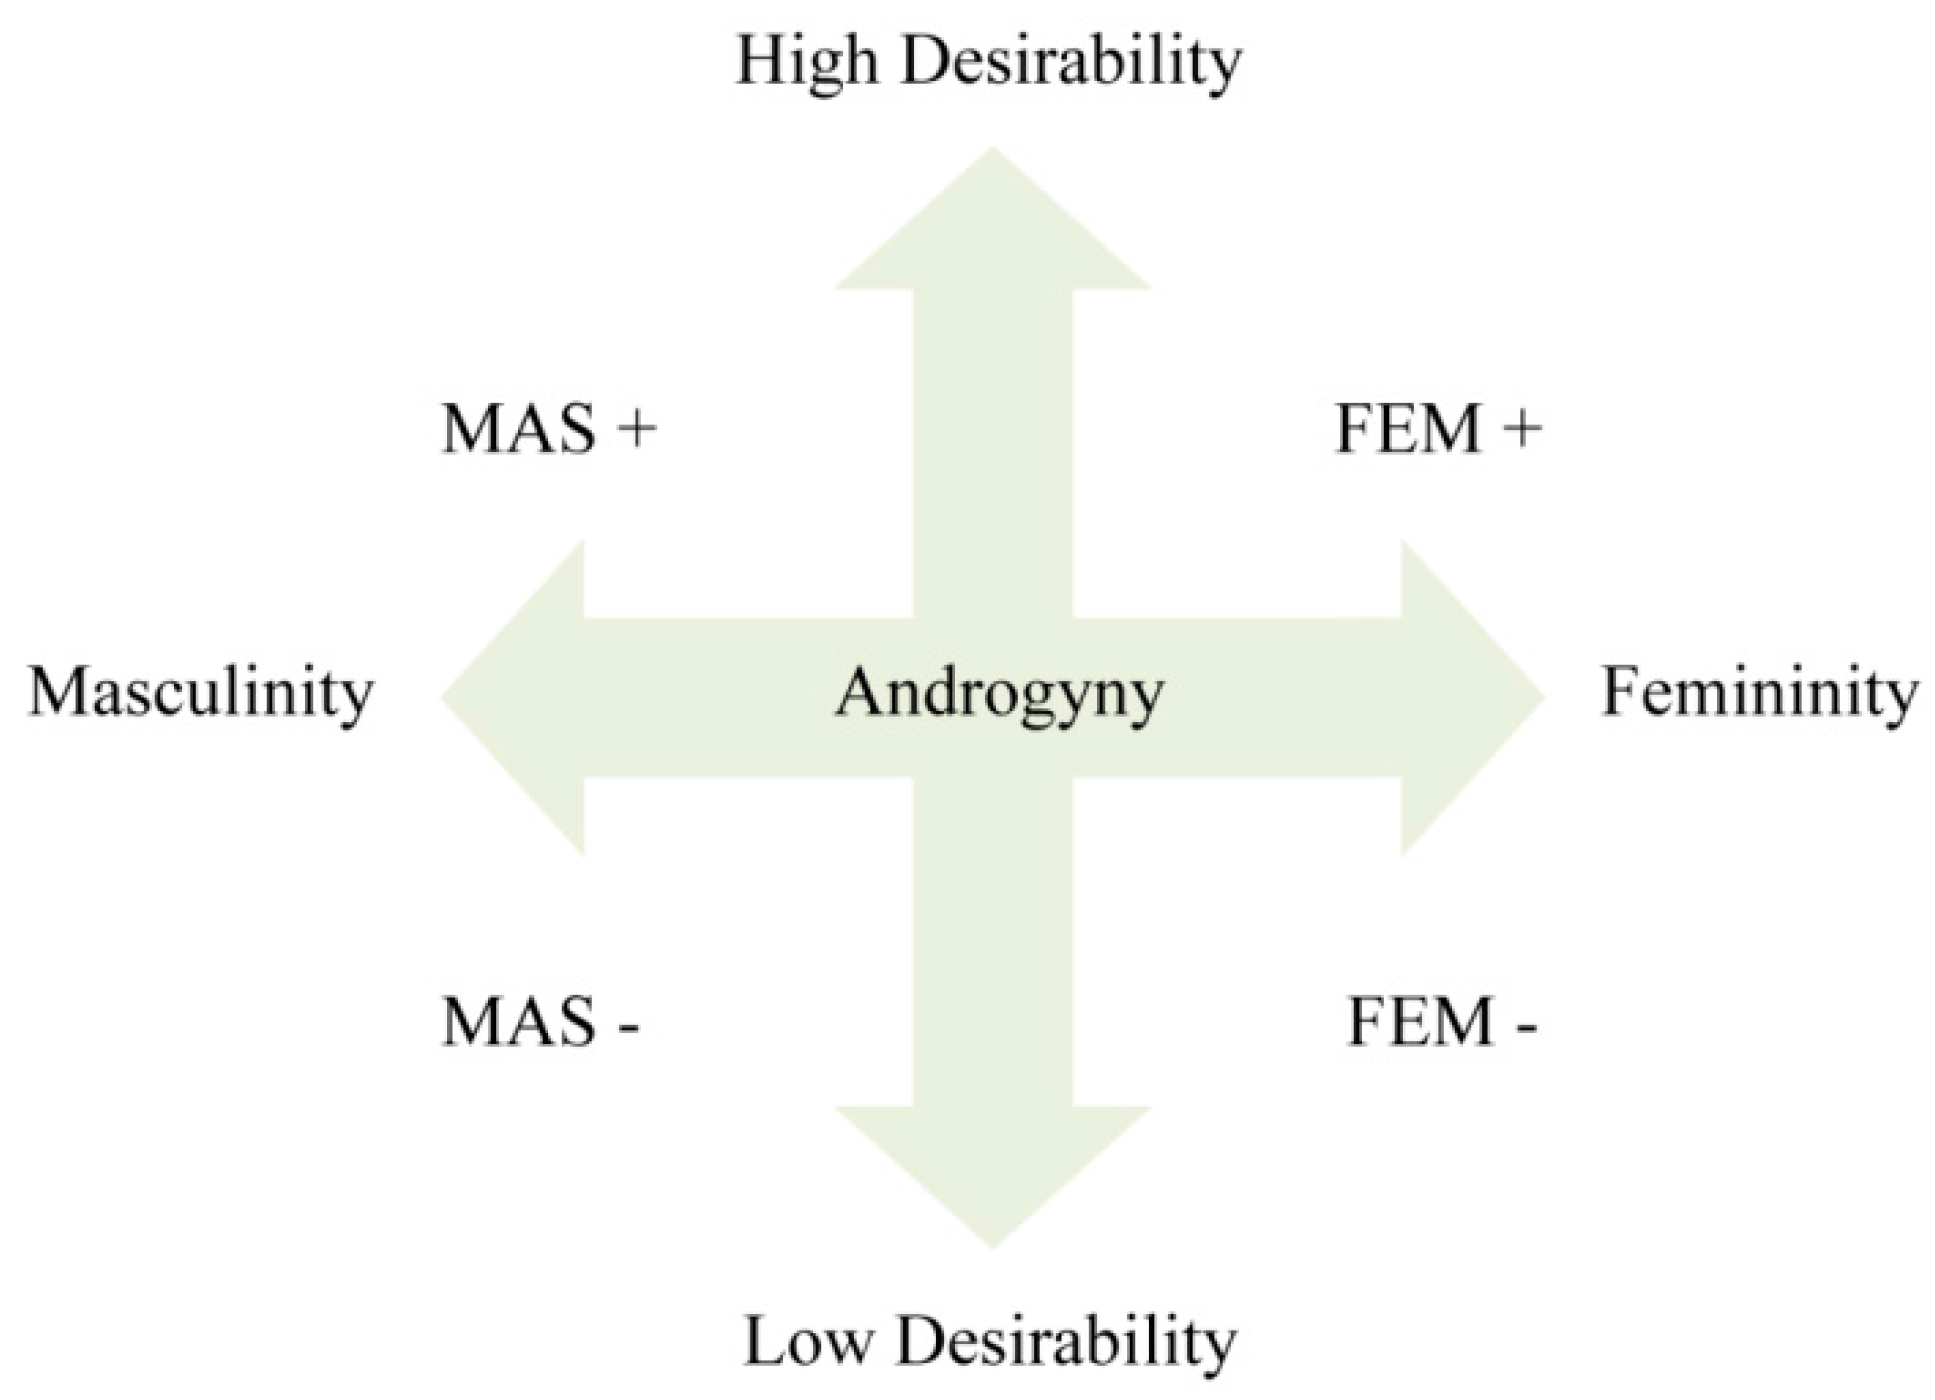
  7. Woodhill, B.M.; Samuels, C.A. Desirable and undesirable androgyny: A prescription for the twenty-first century. J. Gend. Stud. 2004, 13, 15–28. [Google Scholar] [CrossRef]
  8. Juster, R.P.; Pruessner, J.C.; Desrochers, A.B.; Bourdon, O.; Durand, N.; Wan, N.; Tourjman, V.; Kouassi, E.; Lesage, A.; Lupien, S. Sex and Gender Roles in Relation to Mental Health and Allostatic Load. Psychosom. Med. 2016, 78, 788–804. [Google Scholar] [CrossRef] [PubMed]
  9. Evans, O.; Steptoe, A. The contribution of gender-role orientation, work factors and home stressors to psychological well-being and sickness absence in male- and female-dominated occupational groups. Soc. Sci. Med. 2002, 54, 481–492. [Google Scholar] [CrossRef]
  10. Juster, R.P.; Lupien, S. A Sex- and Gender-Based Analysis of Allostatic Load and Physical Complaints. Gend. Med. 2012, 9, 511–523. [Google Scholar] [CrossRef] [PubMed]
  11. Vafaei, A.; Ahmed, T.; Freire Ado, N.; Zunzunegui, M.V.; Guerra, R.O. Depression, Sex and Gender Roles in Older Adult Populations: The International Mobility in Aging Study (IMIAS). PLoS ONE 2016, 1. [Google Scholar] [CrossRef] [PubMed]
  12. Annandale, E.; Hunt, K. Masculinity, Feminity and Sex—An Exploration of Their Relative Contribution to Explaining Gender Differences in Health. Sociol. Health Ill. 1990, 12, 24–46. [Google Scholar] [CrossRef]
  13. Twigg, J. The body, gender, and age: Feminist insights in social gerontology. J. Aging Stud. 2004, 18, 59–73. [Google Scholar] [CrossRef]
  14. Carlsson, M.M.E. Construct validation of the Bem Sex Role Inventory. Scand. J. Psychol. 1980, 21, 27–31. [Google Scholar] [CrossRef]
  15. West, C.; Zimmerman, D.H. Doing Gender. Gend. Soc. 1987, 1, 125–151. [Google Scholar] [CrossRef]
  16. Wood, W. Biosocial Construction of Sex Differences and Similarities in Behavior. Adv. Exp. Soc. Psychol. 2012, 46, 55–123. [Google Scholar] [CrossRef]
  17. Rinder, L.; Roupe, S.; Steen, B.; Svanborg, A. Seventy-year-old people in Gothenburg. A population study in an industrialized Swedish city. Acta Med. Scand. 1975, 198, 397–407. [Google Scholar] [CrossRef] [PubMed]
  18. Altman, D.G. Practical Statistics for Medical Research; Chapman and Hall: London, UK, 1991. [Google Scholar]
  19. Nunnally, J.C. Psychometric Theory; McGraw-Hill: New York, NY, USA, 1978. [Google Scholar]
  20. Rosseel, Y. Lavaan: An R Package for Structural Equation Modeling. J. Stat. Softw. 2012, 48, 1–36. [Google Scholar] [CrossRef]
  21. Torgrimson, B.N.; Minson, C.T. Sex and gender: What is the difference? J. Appl. Physiol. 2005, 99, 785–787. [Google Scholar] [CrossRef] [PubMed]
  22. Spence, J.T.; Helmreich, R.; Stapp, J. Ratings of Self and Peers on Sex-Role Attributes and Their Relation to Self-Esteem and Conceptions of Masculinity and Femininity. J. Personal. Soc. Psychol. 1975, 32, 29–39. [Google Scholar] [CrossRef]
  23. Bernstein, C.; Osman, R. Positives and Negatives: Reconceptualising Gender Attributes within the Context of the Sex Role Identity and Well-Being Litterature: An Examination within the South African Context. SA J. Ind. Psychol. 2016, 42. [Google Scholar] [CrossRef]
  24. Kline, R.B. Principles and Practice of Structural Equation Modeling, 3rd ed.; Guilford Press: New York, NY, USA, 2011. [Google Scholar]
  25. Stevens, J.P. Applied Multivariate Statistics for the Social Sciences, 4th ed.; Lawrence Erlbaum Associates: Mahwah, NJ, USA, 2002. [Google Scholar]
  26. Hu, L.; Bentler, P.M. Cutoff criteria for fit indexes in covariance structure analysis: Conventional criteria versus new alternatives. Struct. Equ. Model. A Multidiscip. J. 1999, 6, 1–55. [Google Scholar] [CrossRef]
Figure 1. The dimensionality of the Positive–Negative Sex-Role Inventory (PN-SRI).
Societies 08 00013 g001
Figure 2. Correlation matrix for the 24 PN-SRI items.
Societies 08 00013 g002
Table 1. The gender-coded personality traits in the four Positive–Negative Sex-Role Inventory (PN-SRI) sub-scales.
Masculinity Scale
Positive Masculinity Subscale (MAS+)Negative Masculinity Subscale (MAS)
AnalyticalArrogant
LogicalBoastful
ObjectiveHarsh
PracticalInconsiderate
RationalOstentatious
Solution-focusedPower-hungry
Femininity Scale
Positive femininity subscale (FEM+)Negative femininity subscale (FEM)
EmotionalAnxious
EmpathicDisoriented
LovingNaïve
PassionateOvercautious
SensitiveOversensitive
TenderSelf-doubting
(MAS+) = Masculine personality traits with high desirability; (FEM+) = Feminine personality traits with high desirability; (MAS−) = Masculine personality traits with low desirability; (FEM−) = Feminine personality traits with low desirability.
Table 2. Sample characteristics.
Total Sample
(n = 1124)
Sub-Sample
(n = 406)
Men (n = 518)Women (n = 606)Men (n = 187)Women (n = 219)
n, %n, %n, %n, %
Education *
  Primary or less a93 (18.0)82 (13.5)27 (14.4)19 (8.7)
  More than primary417 (80.5)514 (84.8)159 (85.0)198 (90.4)
Work
  Working now134 (25.9)105 (17.3)44 (23.5)39 (17.8)
Marital status
  Have partner425 (82.0)380 (62.7)153 (81.8)145 (66.2)
  Living alone130 (25.1)251 (41.4)52 (27.8)86 (39.3)
Ethnicity
  Born in Sweden431 (83.2)523 (86.3)157 (84.0)187 (85.4)
Religion
  Religious b107 (20.7)170 (28.1)39 (20.9)61 (27.9)
* Fisher’s exact test (two-sided) < 0.01; a Primary education: nine years or less; b Self-reported religiosity (any religion).
Table 3. Descriptive statistics of the Positive-Negative Sex-Role Inventory (PN-SRI).
MeanMedianSDMinMaxtdfp b
Total ScaleAllMenWomen
  PN-SRI a91.3690.8891.7891.0013.0336161−1.151115n.s.
Sub-scales
  Masculinity43.8345.4042.4844.007.92016816.221050**
  Femininity47.5145.4249.3047.009.1021980−7.271117**
  MAS+30.9931.6030.4731.005.4769423.451117**
  MAS−12.8313.8012.0012.005.1376405.951119**
  FEM+29.7728.4030.9530.005.517842−7.931118**
  FEM−17.7417.0018.3617.006.188642−3.671118**
a Skewness (SE) = −0.037 (0.073); Kurtosis (SE) = 1.927 (0.146); b Mean differences between men and women; ** p < 0.01; n.s. p > 0.05.
Table 4. The proportion of participants confirming the original item classification of desirability (yes/no), femininity (yes/no) and masculinity (yes/no).
Sub-sample (n = 406)Men (n = 187)Women (n = 219)
DesirabilityGenderDesirabilityGenderDesirabilityGender
n (%)n (%)n (%)n (%)n (%)n (%)
MAS+ a
  Analytical367 (91.3)313 (78.4)170 (91.8)150 (81.5)196 (90.7)162 (75.7)
  Logical387 (96.0)285 (72.2)176 (95.1)146 (80.2)210 (96.8)139 (65.6)
  Objective381 (94.8)275 (69.8)176 (95.1)134 (74.0)204 (94.4)140 (66.0)
  Practical399 (99.0)244 (61.5)182 (98.4)152 (83.1)216 (99.5)92 (43.2) **
  Rational386 (95.8)272 (68.2)178 (96.2)147 (79.9)207 (95.3)125 (58.4) *
  Solution-focused376 (93.3)341 (85.3)174 (94.1)166 (90.2)201 (92.6)174 (80.9)
MAS− b
  Arrogant381 (94.5)381 (96.5)174 (94.0)176 (96.7)206 (94.9)204 (96.2)
  Boastful384 (95.3)368 (93.2)175 (94.6)174 (95.6)208 (95.9)193 (91.0)
  Harsh357 (88.8)376 (94.5)166 (90.2)177 (96.7)190 (87.5)198 (92.5)
  Inconsiderate391 (97.0)388 (97.7)179 (96.8)179 (97.8)211 (97.2)208 (97.7)
  Ostentatious300 (75.4)242 (61.6)139 (75.9)121 (66.9)160 (74.7)120 (56.9) *
  Power-hungry385 (95.5)391 (98.2)179 (96.8)180 (98.4)205 (94.5)210 (98.1)
FEM+ c
  Emotional304 (75.8)381 (95.5)144 (77.8)174 (95.1)159 (73.9)206 (95.8)
  Empathic381 (94.5)387 (97.0)175 (94.5)173 (94.0)205 (94.4)213 (99.5)
  Loving386 (95.8)385 (97.0)177 (95.7)174 (94.6)208 (95.9)210 (99.1)
  Passionate330 (82.1)331 (83.4)155 (83.7)145 (79.2)174 (80.5)186 (87.3)
  Sensitive236 (58.6) *381 (95.7)117 (63.2)171 (93.4)118 (54.3) *209 (97.7)
  Tender381 (94.5)385 (96.7)177 (95.7)174 (94.6)203 (93.5)210 (98.6)
FEM− d
  Anxious369 (91.6)370 (93.2)163 (88.1)162 (89.0)206 (94.9)207 (96.7)
  Disoriented394 (97.8)328 (83.0)180 (97.3)141 (77.5)213 (98.2)186 (87.7)
  Naïve370 (92.0)317 (80.7)169 (91.3)136 (74.7)200 (92.5)180 (85.7)
  Overcautious359 (89.1)376 (94.2)159 (85.9)165 (90.2)199 (91.7)210 (97.7)
  Oversensitive380 (94.3)377 (95.0)171 (92.4)171 (93.4)209 (96.3)205 (96.2)
  Self-doubting378 (94.0)355 (89.2)173 (93.5)149 (81.4)205 (94.9)205 (95.8)
a Positive masculinity subscale; b Negative masculinity subscale; c Positive femininity subscale; d Negative femininity subscale; * <60% of the participants agreed with the original classification; ** <50% of the participants agreed with the original classification.
Table 5. Results from the Exploratory Factor Analysis (EFA), and the Confirmatory Factor Analyses (CFA) before and after adding constraints showing loadings of all items on their respective factors.
Model 1
EFA
Model 2
CFA without Constraints
Model 3
CFA with Constraint (≥0.4)
Model 4
CFA with Constraint (≥0.5)
Items = 24Items = 24Items = 21Items = 14
Factor LoadingsStandardized Factor LoadingsStandardized Factor LoadingsStandardized Factor Loadings
MAS+ a
 Analytical0.710.680.700.70
 Logical0.800.800.810.81
 Objective0.560.580.580.58
 Practical0.300.36XX
 Rational0.600.640.620.62
 Solution-focused0.570.610.610.61
MAS– b
 Arrogant0.570.600.600.57
 Boastful0.640.650.660.66
 Harsh0.490.530.53X
 Inconsiderate0.640.630.630.64
 Ostentatious0.460.460.46X
 Power-hungry0.680.670.670.69
FEM+ c
 Emotional0.470.620.57X
 Empathic0.470.610.58X
 Loving0.800.700.750.87
 Passionate0.530.560.550.47
 Sensitive0.410.540.47X
 Tender0.740.680.730.74
FEM– d
 Anxious0.670.660.700.59
 Disoriented0.370.49XX
 Naïve0.380.41XX
 Overcautious0.450.490.48X
 Oversensitive0.670.700.720.84
 Self-doubting0.480.490.47X
eModel fitModel fitModel fit
RMSEA 0.0680.0730.057
p-value (CI) <0.05 (0.065–0.071)<0.05 (0.069–0.077)<0.05 (0.051–0.063)
SRMR 0.070.080.06
CFI 0.820.830.91
a Positive masculinity subscale; b Negative masculinity subscale; c Positive femininity subscale; d Negative femininity subscale; e Chi Square Statistic p-value for four-factor solution = 692.71, df = 186 and p-value = 1.8 × 10−59. RMSEA, root-mean-square error of approximation; SRMR, standardized root-mean-square residual.

