Evolution of Morphology and Microstructure in Electrodeposited Nanocrystalline Al–Mg Alloy Dendrites

Abstract
: Nanocrystalline Al–Mg dendrites were fabricated through galvanostatic electrodeposition. Initially feather-like morphology was formed exhibiting morphological evolution to smooth globules at its tips. With eventual deposition, rough globules formed over the smooth ones. The feather-like and smooth globules possessed supersaturated face centered cubic (fcc)–Al(Mg) phase with ∼7 and ∼20 at.% Mg respectively. The rough globules contained hexagonal close packed (hcp)–Mg(Al) phase with ∼80 at.% Mg. Microstructural examinations revealed that the feather-like and rough globules possessed grain sizes of ∼42 ± 15 and ∼36 ± 12 nm respectively. The region, which exhibited morphological evolution from feather-like to smooth globules, possessed ∼16 ± 7 nm grain size. The observed microstructural and compositional features were attributed to the local current density values. The formation of the Al–Mg dendrites is discussed in this paper.1. Introduction
Several techniques have been employed in the production of nanocrystalline powders, for example solution based aggregation [1], hydrothermal method [2] and sol–gel technique [3]. Electrodeposition has been gaining importance as a promising technique for nanocrystalline powder fabrication in dendritic form with several other advantages to it such as the ability to produce materials in relatively pure form and with metastable phases [4,5].
Various parameters are involved in the electrodeposition process namely, overpotential, current density, temperature, electrolyte composition, substrate, agitation, etc., some of which have substantial effect on the morphology of the deposits. Among these parameters, the effect of potential (or current density) has been studied most extensively. For example, near equilibrium potentials (or low current densities) render faceted crystals [6] and induce epitaxial growth [7]. Under such conditions, because of the slow deposition rate, charge transfer mechanisms dominate the crystal growth and specific crystallographic facets evolve owing to the anisotropy in the interfacial energy and the growth rate. This process is usually controlled by the activated intermediate states. Employing high current densities has been shown to cause branching or dendritic growth in deposits [8]. Because of the high deposition rates, diffusion processes play significant roles in deciding the morphologies [9]. For example, in the galvanostatic deposition of Au–Ag alloys, dendritic precursors were observed in the initial stages of deposition under mixed activation–diffusion controlled conditions. At higher potentials produced in the later stages of deposition, due to the onset of the spherical diffusion condition, poorly defined crystallites and globular morphologies were found [10]. In the case of the electrodeposition of Cu it has been shown that at relatively low current densities, deposits formed with protruded tips which eventually grew in the form of carrot-like structures under activation–controlled mechanisms [11]. The development of this structure was suggested to be associated with the differences in the growth rates of the tips and the lateral sides of the growing entities. At higher deposition rates cauliflower-like structures were observed [12]. Under these conditions the deposition rate was controlled by diffusion mechanisms and the globular shape of these cauliflower-like structures was attributed to the spherical shape of the diffusion layer. In another investigation, the morphology of dendrites in the multicomponent polycrystalline Ni–Co system was investigated [5]. Depending on the composition, different morphologies such as cauliflower-like and fern-like were reported in this study. In general, although morphological characteristics in electerodeposited metallic powders have been investigated at length, there is very limited work on the various microstructural features (grain size, preferred orientation, etc.) and its evolution during dendritic growth. Investigation of the morphological, microstructural, compositional and phase changes is essential to understand the overall dendritic growth process.
We demonstrated the electrodeposition technique for producing Al–Mg alloy powders in dendritic form using an organometallic-based electrolyte [13] for hydrogen storage application. In this paper, we present the morphological and microstructural characteristics and their evolution during dendritic growth of electrodeposited Al–Mg powders. Although dendric growth is discussed in this paper, the similar approach of electrodeposition can be used for various applications such as thin films with nanocrystalline grain size for micromechanical applications, etc. For example, electrodeposition was used to produce nanocrystalline Ni–Fe thin films with enhanced mechanical properties [14]. The general impact of the present work on scientific community is the demonstration of the electrodeposition technique to producing nanocrystalline materials with desired characteristics.
2. Experimental Procedures
Electrodeposition of Al-Mg alloy powders was performed using an organometallic based electrolyte with composition 1 M Na[AlEt4] + 2 M Na[Et3Al–H–AlEt3] + 2.5 M AlEt3 + 6 M toluene in a glove box. The details of the electrolyte preparation were reported elsewhere [13]. A rotating cylinder cell setup with a Cu rod of diameter 6 mm as cathode rotating at 200 rpm and an annular Mg anode was used for deposition. The Cu cathode was electropolished outside the glove box using an electrolyte made of 82.5 vol.% ortho-H3PO4 and 17.5 vol.% deionized (DI) water. The polished rod was rinsed with DI water and dried before transferring into the glove box. Mg was introduced into the electrolyte by a process which we termed pre–electrodeposition [15]. The Mg enriched electrolyte was used for the actual powder production. A PAR 273 potentiostat/galvanostat interfaced with a computer was used for the deposition experiments.
Galvanostatic electrodeposition experiments were conducted at 60 °C and up to 15 min (900 s) using a freshly prepared polycrystalline Cu electrode. An apparent current density of japplied = 60 mA cm−2 based on the initial surface area of the Cu cathode was employed for deposition. The current density was above the limiting diffusion current density value, jL = 38 mA cm−2 rendering deposit growth in mass transfer regime [16].
The electrodeposited powders were characterized on the cathode as well as after being removed, depending on the characterization technique. The morphology of the electrodeposited powders was investigated using a JEOL 6400 scanning electron microscope (SEM). The composition of the powders was analyzed by energy dispersive spectroscopy (EDS) technique in SEM. The microstructural characterizations were conducted in JEOL 200CX transmission electron microscope (TEM). The TEM samples were prepared using an ultramicrotome system. Special techniques were developed to obtain TEM foils parallel to the longitudinal sections of the dendrites. Powders were embedded in a 3 part EPON based polymer and longitudinal slices were made at relatively high cutting speeds of ∼100 mm s−1 to minimize their pullout.
3. Results
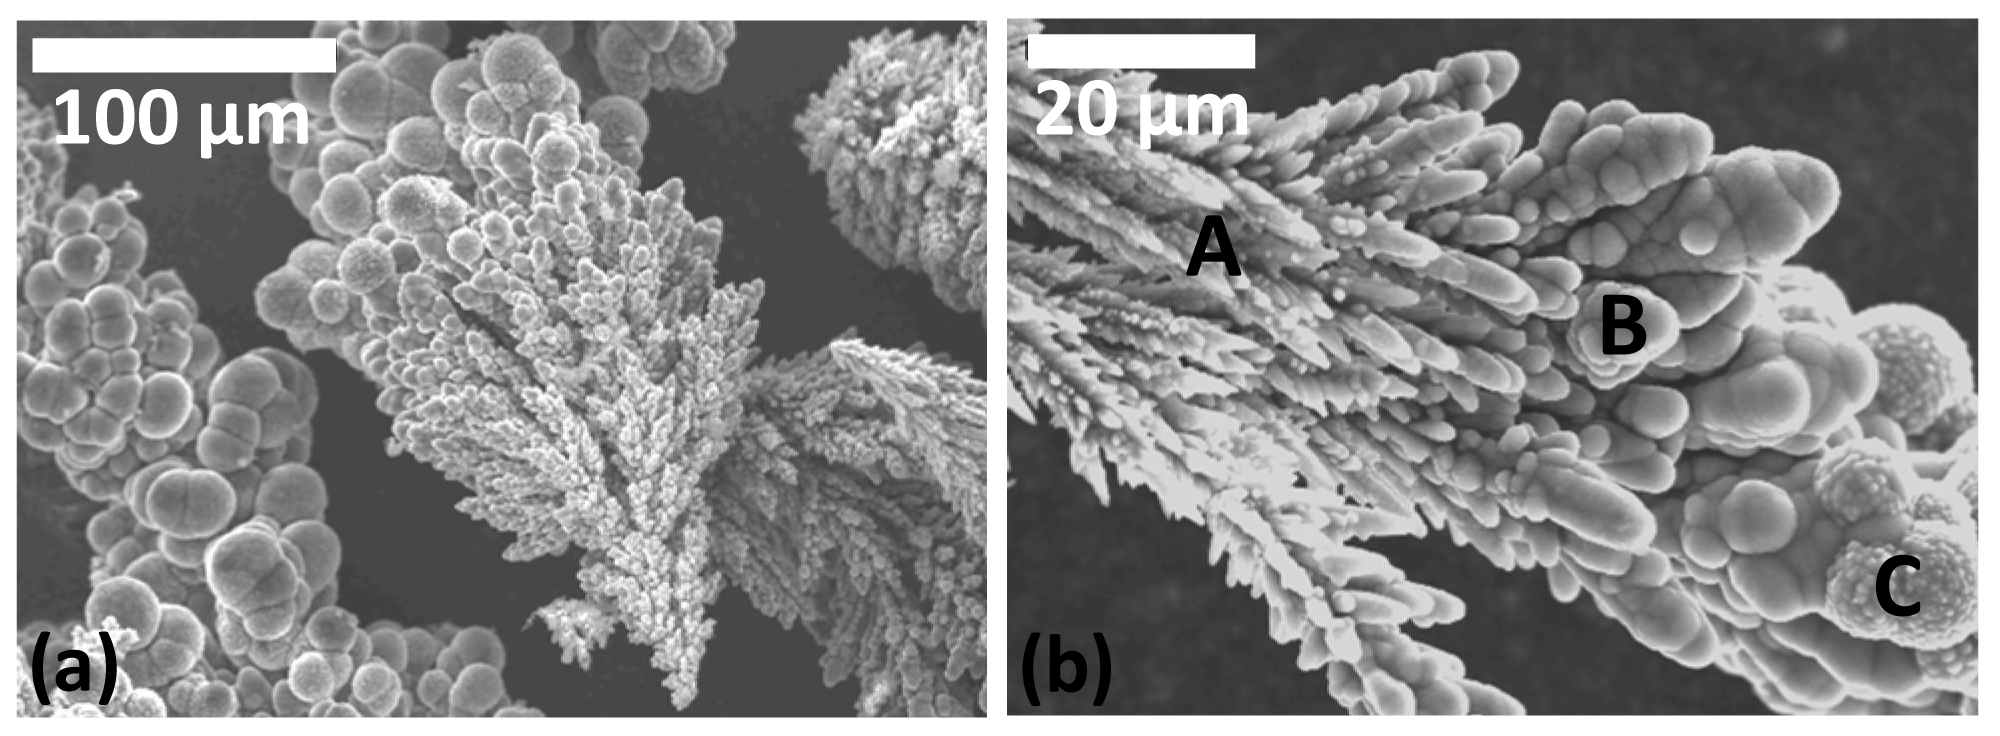
Figure 1(a) shows the SEM image of a typical Al–Mg deposit in as-deposited condition. Dendritic nature of the deposit is evident from the figure suggesting that the applied current density (japplied) is greater than the limiting current density (jL = 38 mA cm−2 [16]) and indicates the diffusion controlled nature of the deposition process. The global diffusion layer thickness was estimated for the rotating–cylinder–cell–setup using equation (1) [17]:
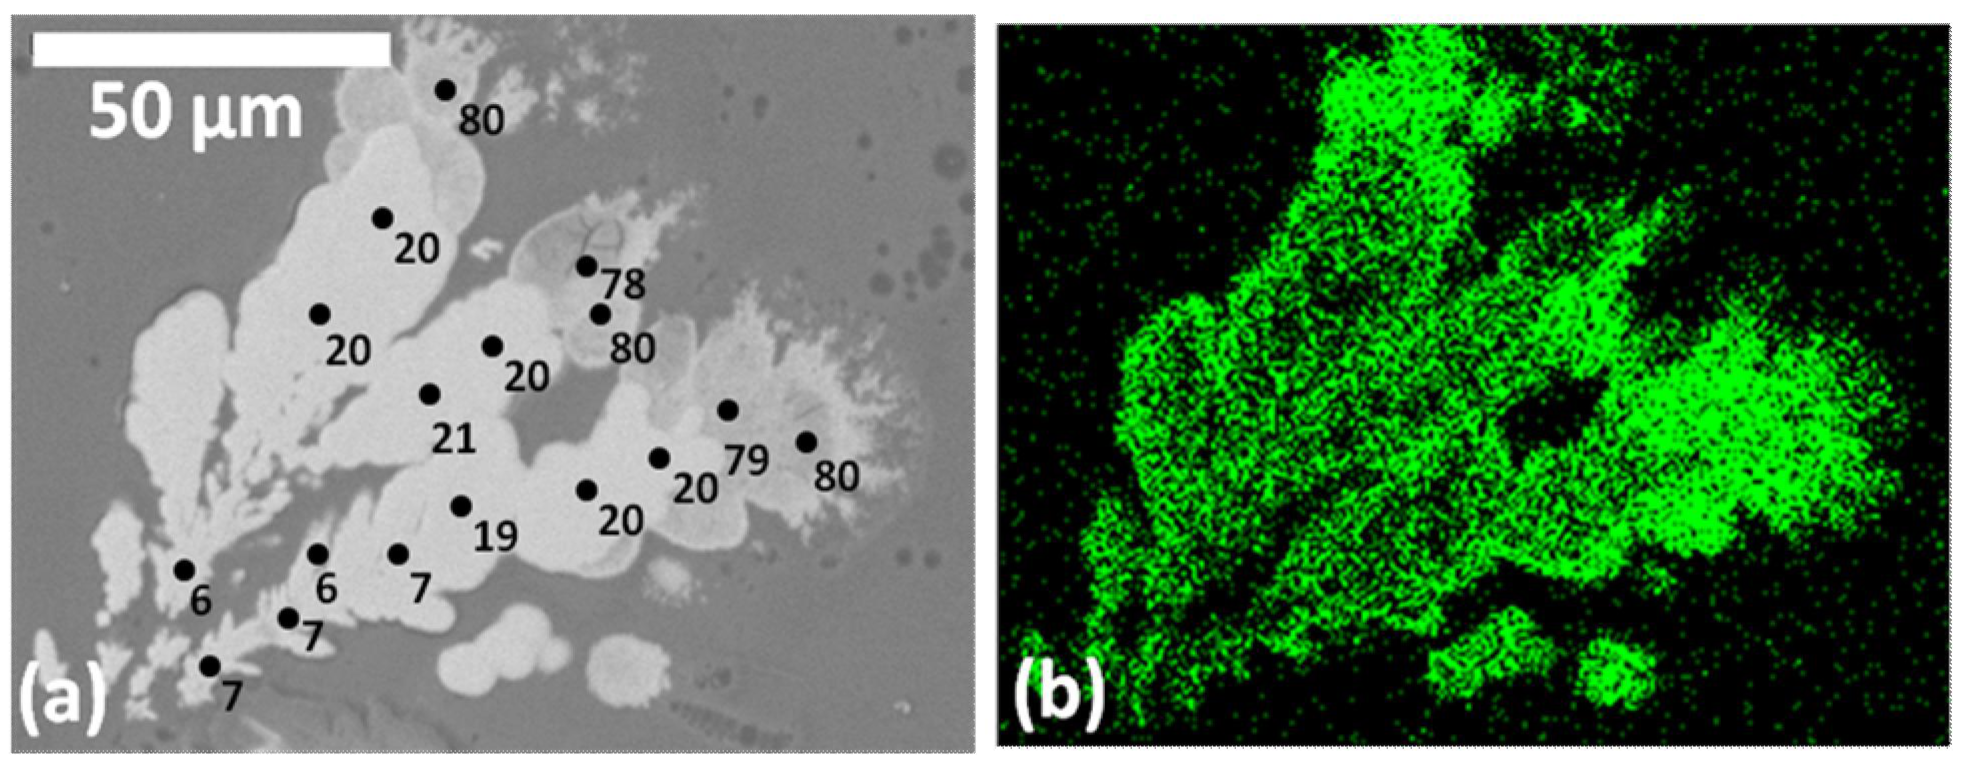
The compositional analysis of the dendrites is presented in Figure 2. The longitudinal sections of several dendrites were analyzed for compositional variation along the length of the dendrites. The back scattered electron (BSE) image of a typical longitudinal section of a dendrite is shown in Figure 2(a). As shown in the figure the root of the dendrite exhibited directional features and correspond to feather-like morphology. The composition along this feather-like region was about 7 at.% Mg. Over the feather-like morphology bulky entities possessing smooth periphery were present and correspond to smooth globules. The composition of the smooth globules was remained almost constant at ∼20 at.% Mg. Above these smooth globules, dark close-to-circular features can be seen in Figure 2(a) which correspond to the rough globules, as evidenced by the rough peripheries, and contained about ∼80 at.% Mg. The atomic number (Z) contrast is evident showing the compositional variation in different morphologies in the BSE image. The regions containing lower Mg (feather-like, smooth globular) showed up as bright in the image. Those regions with higher Mg appeared as dark in the BSE image due to Z contrast. Similarly, the qualitative variation of the Mg content can be seen in the EDS composition map of the dendrite in Figure 2(b). Feather-like and smooth globular morphology demonstrated lower Mg distribution and rough globules showed higher Mg distribution consistent with the composition values presented in Figure 2(a).
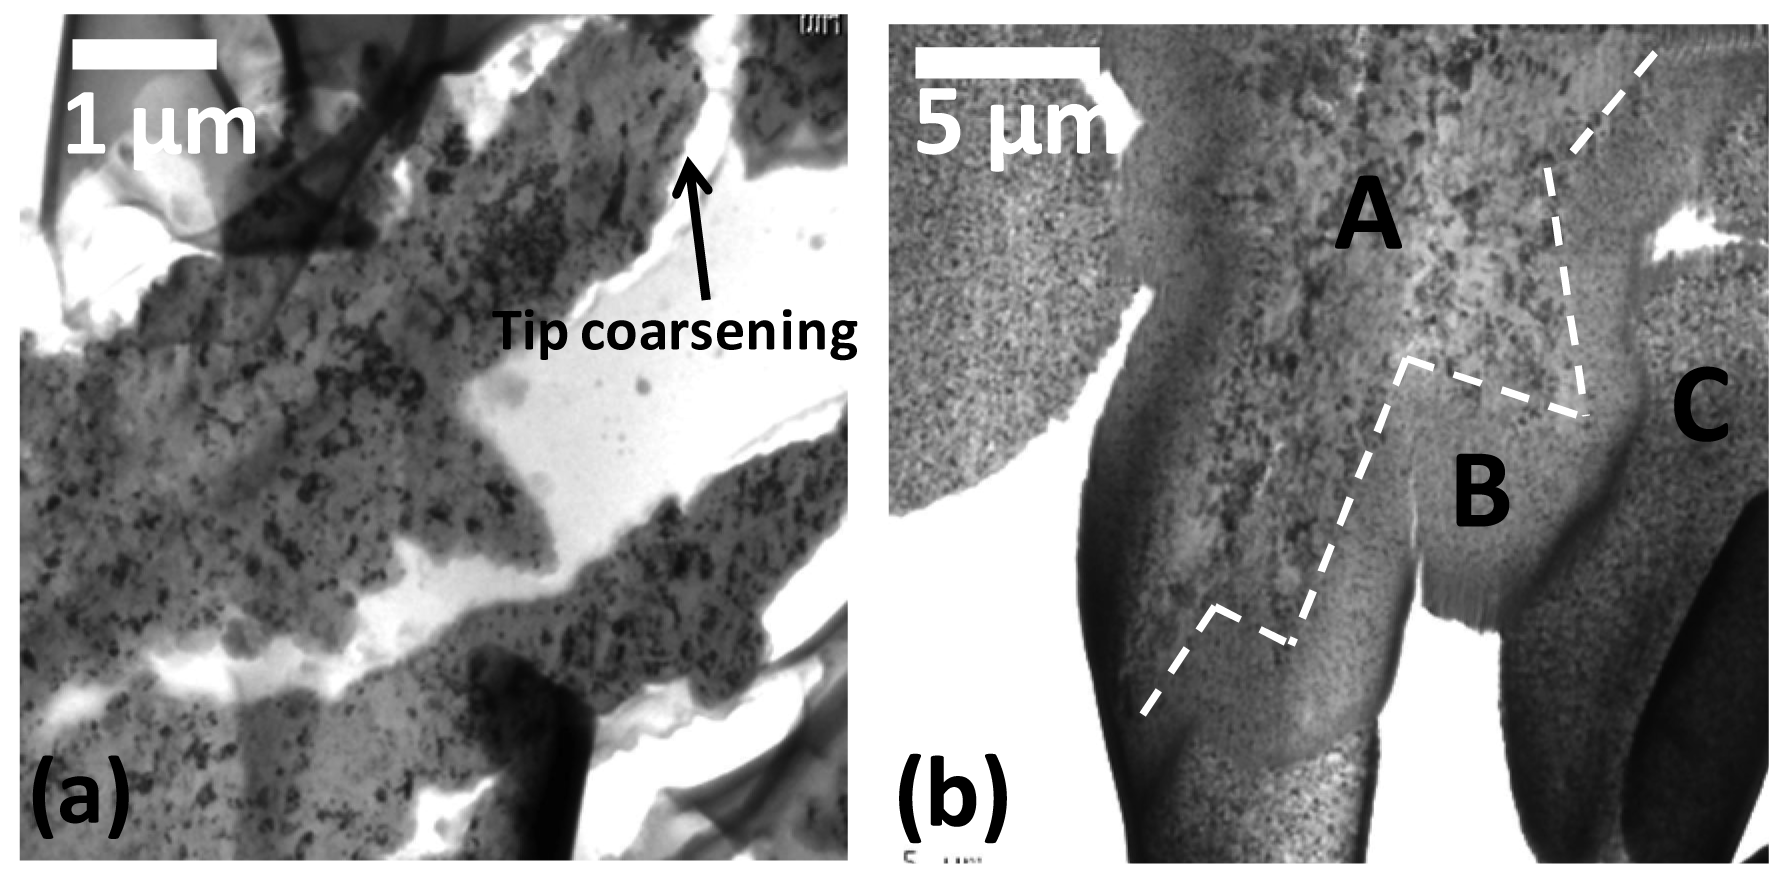
In order to view the microstructural features with morphological evolution, low magnification TEM images of the dendrites were examined. Figure 3(a) shows a TEM image of a longitudinal section of a dendrite with feather-like morphology in its early stage of growth. A few arms attached to the stem can be seen in this figure. The coarsening of the tip, which evolved from sharp to blunted, can be observed from Figure 3(a) for the feather-like morphology. The TEM image of the longitudinal section of a well–grown dendrite is shown in Figure 3(b). The inner region of the dendrite (marked as “A”) contained coarse grained structure enveloped by very fine grained structure with circular–looking periphery (marked as “B”). The boundary separating the coarse and fine grained structures was delineated with a dashed line (Figure 3(b)) and resembles the directional features of the feather-like morphology. Hence the inner coarse grained region corresponds to feather-like morphology and the enveloping fine grained structure corresponds to smooth globular morphology. The coarse microstructure of the rough globular morphology over the fine grained structure of smooth globules can be seen in Figure 3(b) (marked as “C”). As shown in Figure 3(b) different morphological features exhibited different microstructural features.
To understand the differences in microstructural features of the morphologies detailed studies were conducted on each of these morphologies and presented in the following sections.
3.1. Feather-like Morphology
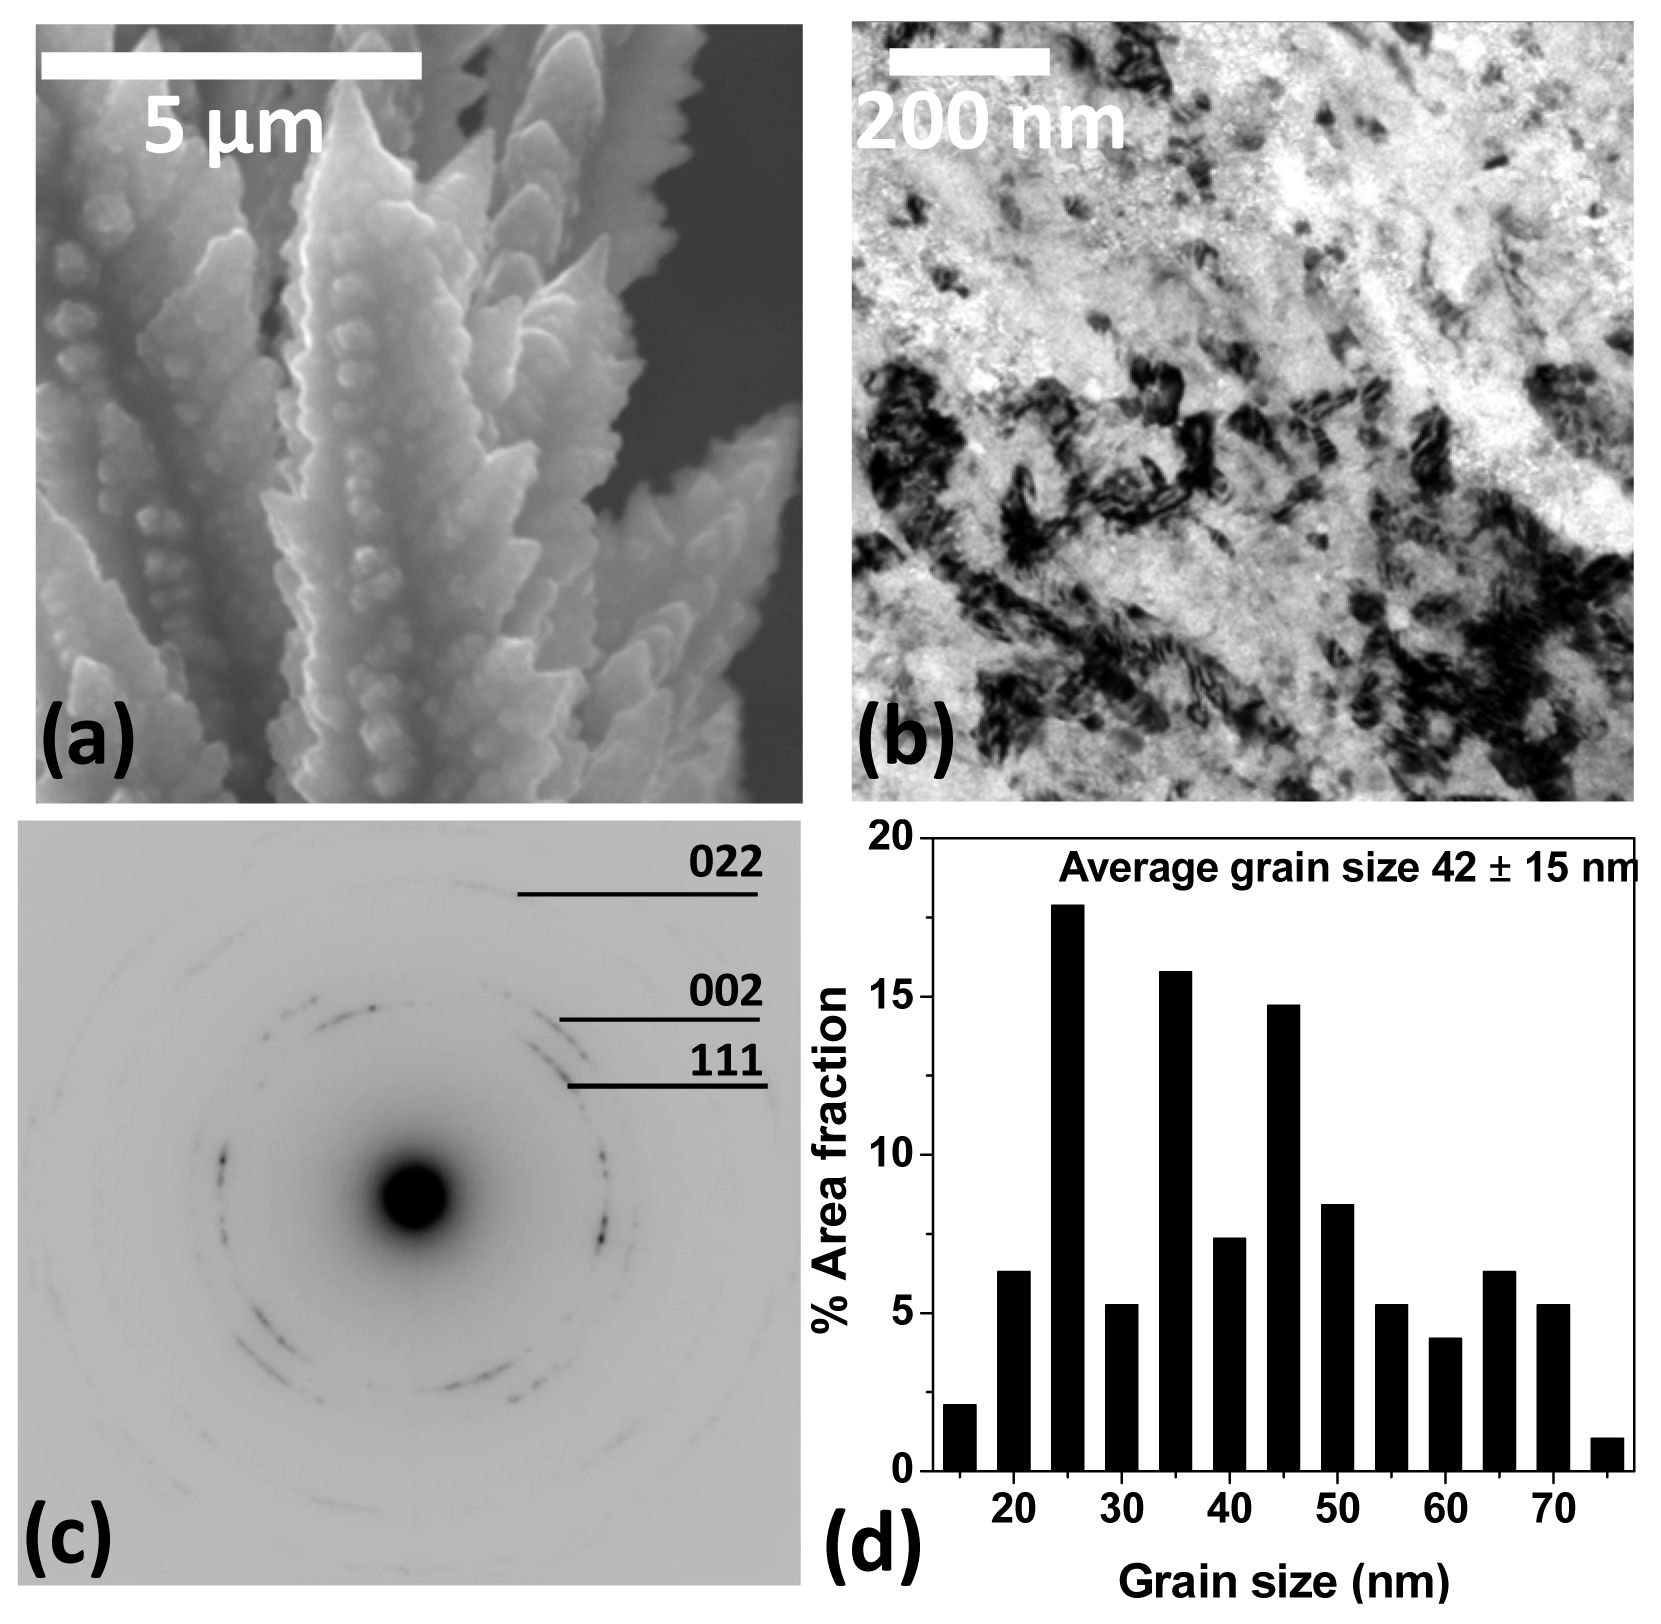
A close view of the feather-like morphology in its early stages of growth is presented in Figure 4(a). Detailed observations revealed that the feathers can be viewed as an assembly of small “arrow-shaped” structural units at specific directions appearing as several primary arms [16]. Furthermore, our earlier detailed morphological analysis on several dendrites showed that these dendrite arms made specific angles with each other and with the stem [21]. The tips of the stem of feather-like morphology were very sharp as shown in Figure 4(a) with tip radius of ∼84 nm. The stem and primary arms attached at specific angles render anisotropy to the feather-like morphology.
The bright field (BF) TEM image of a dendrite with feather-like morphology is shown in Figure 4(b). The corresponding selected area electron diffraction pattern (SAEDP) with rings is shown in Figure 4(c). The analysis on SAEDP showed that the feather-like morphology was composed of fcc–Al(Mg) phase and is consistent with the compositional analysis (7 at.% Mg) presented in Figure 2(a). The presence of fcc–Al(Mg) phase was confirmed by earlier XRD analysis [16]. An interesting observation on the SAEDP was the presence of strong microtexture which is evident from clustering of the spots in certain directions in the rings of SAEDP. Combined BF image and diffraction pattern analysis using rotation calibration technique indicated that the stem and the arms of the featherlike morphology grow along <011> and <001> directions respectively [21]. The BF TEM image and the corresponding ring pattern in SAEDP suggest the nanocrystalline nature of this morphology. The grain size distribution, performed over 300 grains, in feather-like morphology is presented in Figure 4(d) and reveals an average grain size of ∼42 ± 15 nm for this morphology.
3.2. Globular Morphology
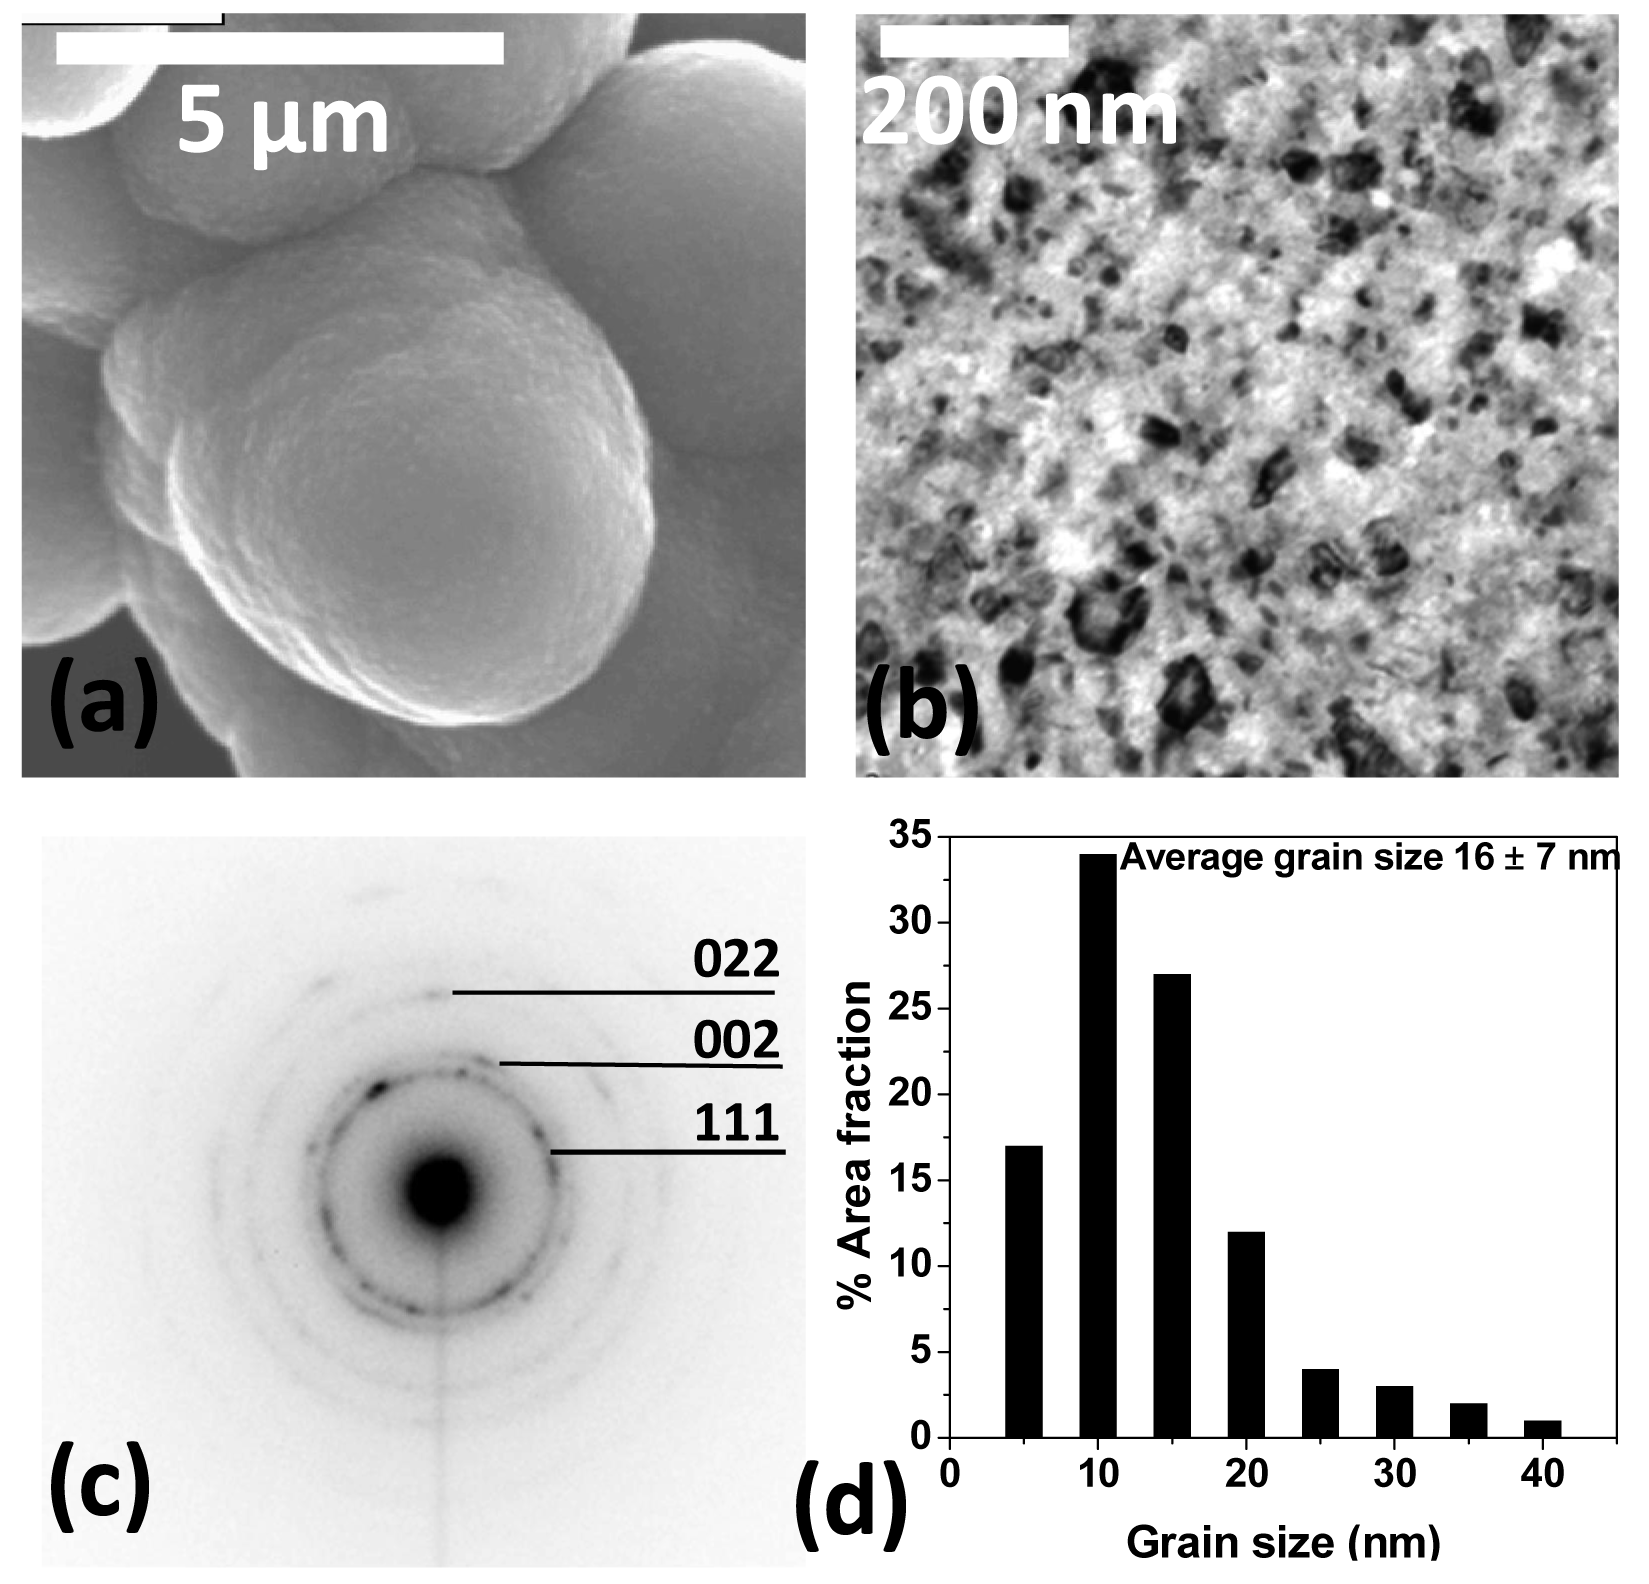
The morphological and microstructural details of the smooth globules are presented in Figure 5. The globular nature of this morphology (Figure 5(a)) shows the morphologically isotropic growth nature unlike in feather-like morphology. Fine undulations can be seen on the surface of the globules with average size of ∼85 nm. Figure 5(b) shows the BF TEM image of the smooth globules. The SAEDP containing ring pattern is shown in Figure 5(c). The SAEDP of smooth globular morphology did not show any strong crystallographic texture as was observed in the feather-like morphology. This indicates that the globular morphology exhibited crystallographic isotropy. The analysis SAEDP suggested that this morphology was made of fcc–Al(Mg) phase. The presence of fcc–Al(Mg) phase was consistent with the (Al–rich) composition of ∼20 at.% Mg presented in Figure 2(a) and was confirmed by the XRD results [16]. The grain size distribution of smooth globular morphology is shown in Figure 5(d) with average grain size of 16 ± 7 nm for this morphology. The fine grain size is responsible for the fine undulations on the surface of the smooth globular morphology.
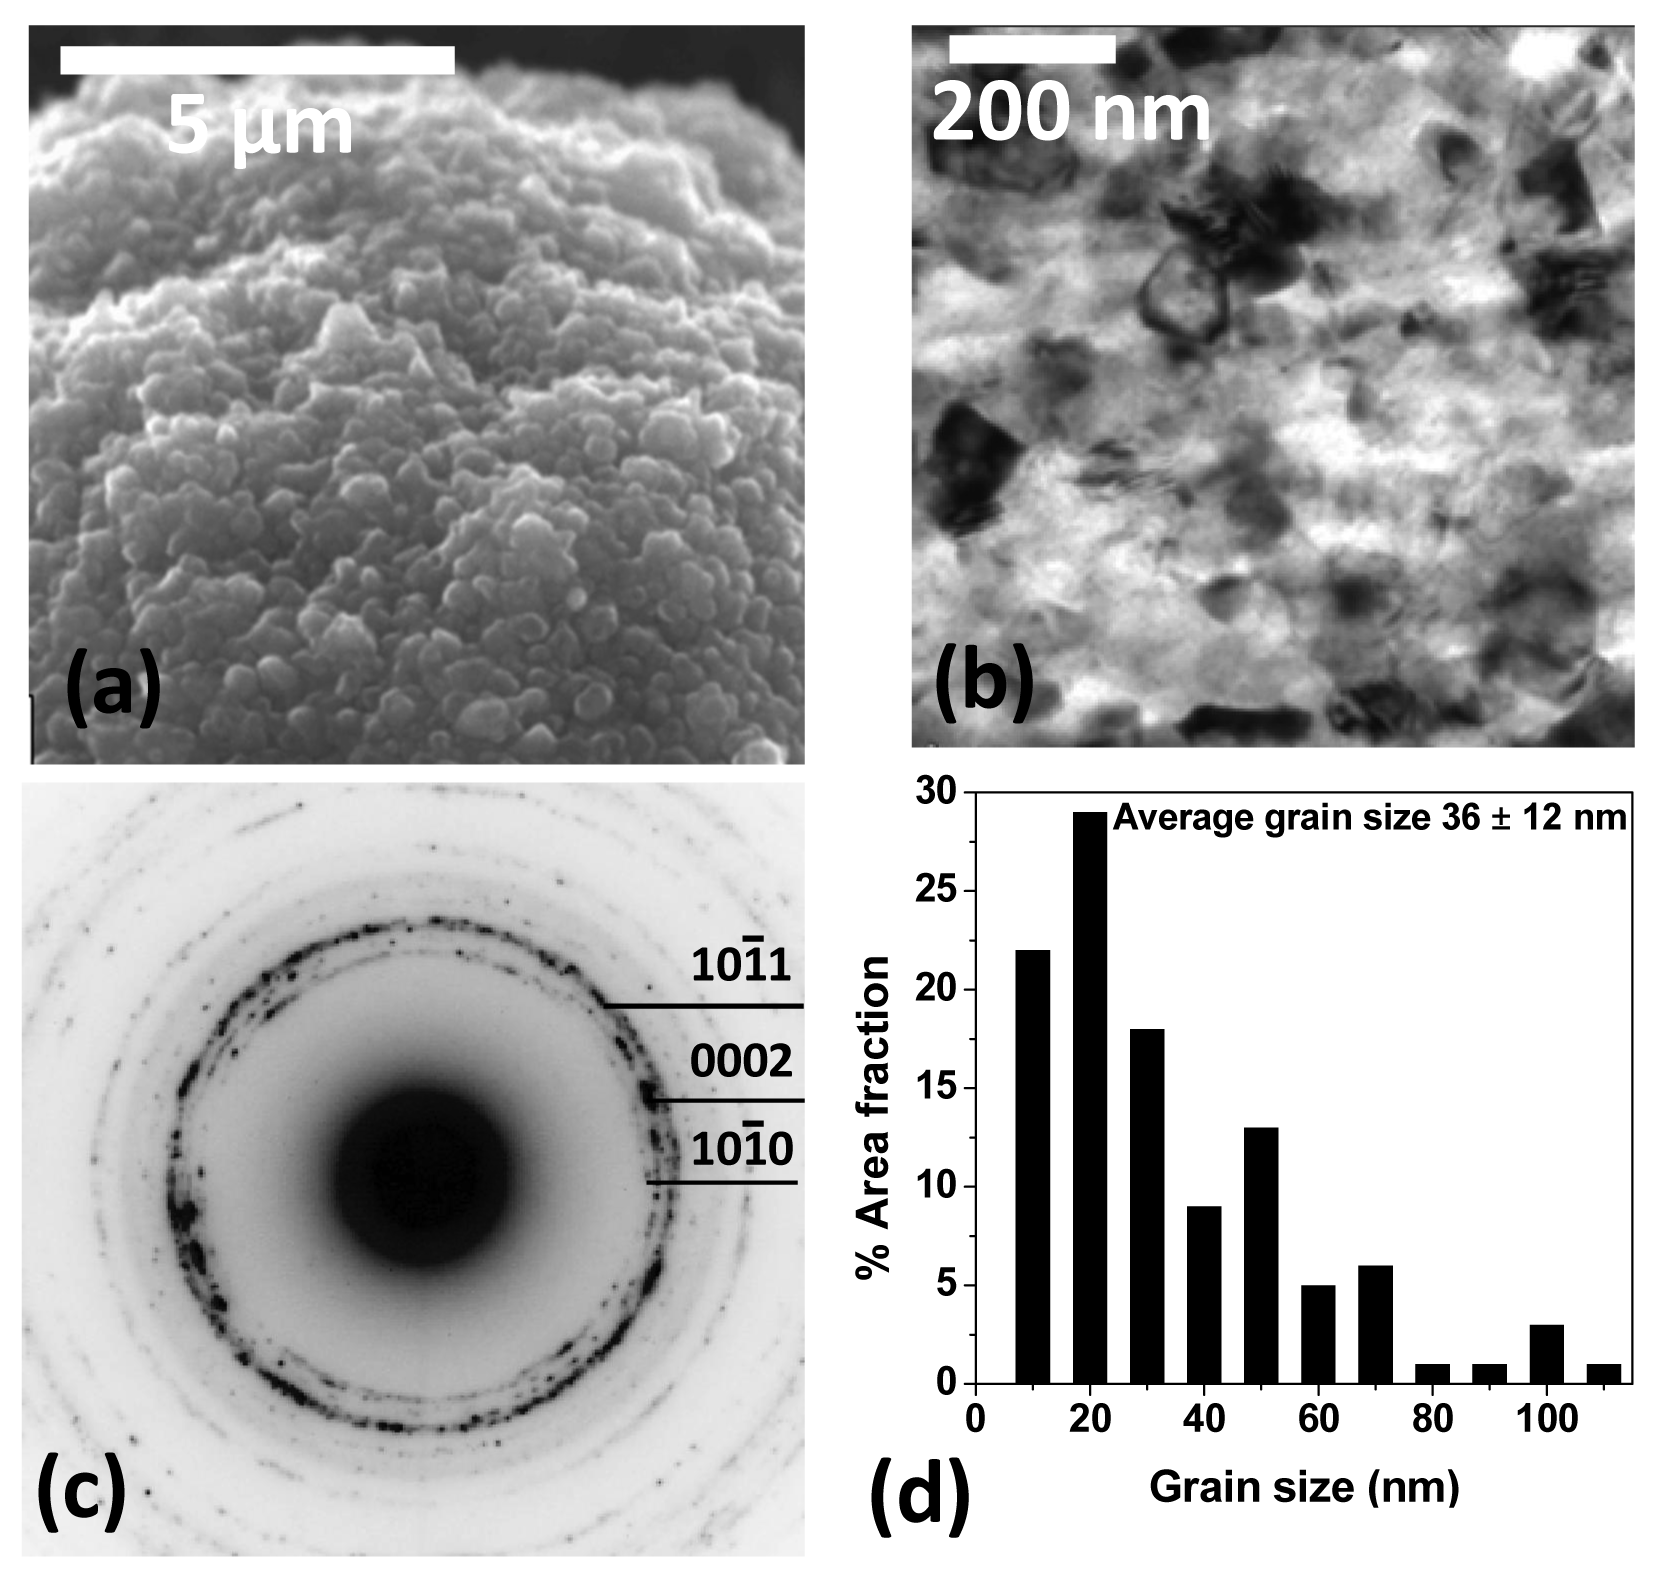
The various details of the rough globular morphology are shown in Figure 6. Rough globular morphology, unlike its smooth counterpart, exhibited larger undulations as shown in Figure 6(a). BF TEM image (Figure 6(b)) and the spotty ring shaped SAEDP (Figure 6(c)) of the rough globular morphology indicated nanocrystalline nature of this morphology. Similar to the smooth globules the rough globular morphology also did not show any preferred crystallographic texture. The analysis of SAEDP (indexed using Miller-Bravais index system) suggested that rough globules possessed hcp–Mg(Al) phase which was confirmed by our earlier XRD analysis [16]. Moreover, the compositional analysis (∼80 at.% Mg in Figure 2(a)) on this morphology was in line with the above observation. The roughness of this morphology can be attributed to the low symmetry of the hcp crystal structure, which may result in the preferential development of the low energy (0001) growth facets [16].
4. Discussion
The results of this study identified three types of morphologies namely feather-like, smooth and rough globules in the electrodeposited Al–Mg dendrites. The anisotropic feather-like dendrites exhibited morphological evolution through tip–coarsening to smooth globules grew in isotropic manner. Both the feather-like and smooth globules possessed fcc–Al(Mg) phase with ∼7 and ∼20 at.% Mg respectively. The rough globules nucleated over the smooth ones and contained hcp–Mg(Al) phase with ∼80 at.% Mg. According to the equilibrium phase diagram Al and Mg showed a mutual solubility of less than 1 at.% [22]. At higher compositions two intermetallics namely Al3Mg2 and Al12Mg17 are found in Al–Mg system. The absence of any intermetallics in the present deposits at such high composition values suggests that the deposition rates are so high that the deposition took place in non-equilibrium manner resulting in supersaturated and metastable phases [13].
In the initial stages of the galvanostatic deposition the ions are released to cathode to maintain constant apparent current density. No control is exercised over the potential on the cathode surface. So the ions released towards the cathode distribute themselves in a random fashion. This random distribution of the ions generates local potentials which are very difficult to measure. These local potentials contribute to the nucleation of morphologies with specific phases. Our detailed mechanistic investigations presented elsewhere [16] indicated that lower potentials, as a result of lower deposition rates (current density), are enough for formation of feather-like morphology. In the present case the nominal applied current density of japplied = 60 mA cm−2 can cause the nucleation of dendrites with feather-like morphology. As a result of the lower deposition rates the released ions have enough time for arranging themselves in lower energy configurations resulting in morphological and crystallographical anisotropy in the form of dendritic arms (Figure 4(a) and 4(c)) exhibiting specific crystallographic orientations [21]. The lower deposition rates were also responsible for the coarse microstructure of the feather-like morphology with ∼42 ± 15 nm grain size (Figure 4(d)). We found that the substrate material plays an important role in deciding the nucleating phase [23]. In the present study the employed fcc Cu substrate (Cu) supplied the critical energy necessary for nucleation of feather-like morphology with fcc–Al(Mg) phase containing 7 at.% Mg (Figures 4(c) and 2(a)). Further deposition led to the morphological evolution into smooth globular morphology (Figure 1(b)).
The morphological evolution is very interesting where the initially feather-like morphology eventually coarsened at tips (Figure 3(a)) and evolved into smooth globules. Coarsening basically means that the tips of the feather-like morphology experienced a higher concentration of locally accumulated ions which deposited at higher rates resulting in globular morphology formation. Although during the galvanostatic deposition the overall current densities decrease due to the increased surface area of the deposits, the local current density values could be very high e.g., on the tips of the feather-like morphology which possess very small surface area [9]. Similar to local potentials these local current densities are very difficult to measure. However, we could estimate the current density around the tips of the feather-like morphology [20]. The tips of the feather-like morphology experience current densities both at their tips and sides according to Equations (2) and (3) respectively [9]:
With further deposition following the formation of fcc–Al(Mg) phase, the electrolyte was still enriched with Mg [15]. The increased Mg encouraged the nucleation of hcp–Mg(Al) phase with composition ∼80 at.% Mg (Figure 6(b) and 2(a)). The increased local surface areas of the smooth globules, compared to the tips of the feather-like morphology, can decrease the local current density values. The lower current density values result in lower local potential values. These lower local potential values lead to only fewer nucleation events compared to in the case of smooth globules and result in the grain size of the ∼36 nm (>16 nm in smooth globules) in the rough globules. The co-existence of smooth and rough globules possessing supersaturated metastable phases with specific compositions of ∼20 at.% Mg and ∼80 at.% Mg respectively is very interesting. The metastable equilibrium between these two phases can be explained by constructing metastable phase diagram with extending fcc and hcp phases beyond their equilibrium values. We showed that using the technique of the “common-tangent construction” on the metastable fcc and hcp phases in ΔG−x curves the theoretical equilibrium compositions are 21 at.% Mg and ∼84 at.% Mg respectively [26]. These compositions are very close to the experimentally observed compositions in the present study.
The results of the present study show that the variations in the local current densities (deposition rates) with the progress of dendritic growth can result in the formation of the different morphologies and microstructures and their evolution leading to an understanding on the dendritic growth process. With an understanding on the morphological, microstructural and compositional changes with processing parameters, the technique of electrodeposition can be extended for preparing nanocrystalline materials with desired properties e.g., improved mechanical properties, high electroactivity in sensor applications, etc.
5. Conclusions
Galvanostatic deposition technique was employed to produce nanocrystalline Al–Mg deposits in dendritic form. The dendritic growth starts with feather-like morphology which eventually showed morphological evolution by forming smooth globules at their tips over which rough globules nucleated. The results of the present study led to the following conclusions:
The deposition conditions were far away from the equilibrium and consequently the formation of intermetallic phases was avoided. The dendrites possessed supersaturated fcc–Al(Mg) phase with the maximum solubility of ∼20 at.% Mg. The increased Mg in the deposits manifested as hcp–Mg(Al) phase with ∼80 at.% Mg;
The deposition rates decide the morphology of the nucleating phase. At nominal current density of 60 mA cm−2, feather-like morphology exhibiting morphological and crystallographic anisotropy was formed. At higher (local) current densities because of insufficient times for surface diffusion of ions for minimizing energy, isotropic growth in the form of globular morphology occurs;
Formation of the spherical diffusion zones at the tips of the feather-like morphology was attributed as the reason for the tip coarsening and morphological evolution into smooth globules;
An inverse relationship exists between current density and grain size of the depositing morphologies. The lower current densities (nominal 60 mA cm–2) resulted in grain size of ∼42 ± 15 nm in feather-like morphology. The increased local current densities realized at the tips of this morphology resulted in ∼16 ± 7 nm in smooth globules.


Acknowledgments
Support from National Science Foundation (grant number DMR–0605406) is greatly appreciated.
References
- Lu, L.; Kobayashi, A.; Kikkawa, Y.; Tawa, K.; Ozaki, Y. Oriented attachment–based assembly of dendritic silver nanostructures at room temperature. J. Phys. Chem. B 2006, 110, 23234–23241. [Google Scholar]
- Xi, L.; Lam, Y.M.; Xu, Y.P.; Li, L.J. Synthesis and characterization of one–dimensional CdSe by a novel reverse micelle assisted hydrothermal method. J. Colloid Interface Sci. 2008, 320, 491–500. [Google Scholar]
- Bakiz, B.; Guinneton, F.; Dallas, J.P.; Villain, S.; Gavarri, J.R. From cerium oxycarbonate to nanostructured ceria: Relations between synthesis, thermal process and morphologies. J. Cryst. Growth 2008, 310, 3055–3061. [Google Scholar]
- Jovic, V.D.; Maksimovic, V.; Pavlovic, M.G.; Popov, K.I. Morphology, internal structure and growth mechanism of electrodeposited Ni and Co powders. J. Solid State Electrochem. 2006, 10, 373–379. [Google Scholar]
- Jovic, V.D.; Jovic, B.M.; Pavlovic, M.G.; Maksimovic, V. Morphology and composition of Ni–Co alloy powders electrodeposited from ammoniacal electrolyte. J. Solid State Electrochem. 2006, 10, 959–966. [Google Scholar]
- Siegfried, M.J.; Choi, K.S. Directing the architecture of cuprous oxide crystals during electrochemical growth. Angew. Chem. 2005, 44, 3218–3223. [Google Scholar]
- Allongue, P.; Maroun, F. Metal electrodeposition on single crystal metal surfaces mechanisms, structure and applications. Curr. Opin. Solid State Mater. Sci. 2006, 10, 173–181. [Google Scholar]
- Kuroda, T.; Irisawa, T.; Ookawa, A. Growth of a polyhedral crystal from solution and its morphological stability. J.Cryst. Growth 1977, 42, 41–46. [Google Scholar]
- Popov, K.I.; Djokic, S.S.; Grgur, B.N. Fundamental Aspects of Electrometallurgy, 2nd ed.; Kluwer Academic Publishers: New York, NY, USA, 2002; pp. 29–100. [Google Scholar]
- Bozzini, B.; De Gaudenzi, G.P.; Mele, C. A SERS investigation of the electrodeposition of Ag–Au alloys from free–cyanide solutions. J. Electroanal. Chem. 2004, 563, 133–143. [Google Scholar]
- Popov, K.I.; Radmilovic, V.; Grgur, B.N.; Pavlovic, M.G. The morphology of copper electrodeposits: Part II. The mechanisms of carrot like electrodeposits formation. J. Serb. Chem. Soc. 1994, 59, 47–52. [Google Scholar]
- Popov, K.I.; Grgur, B.N.; Pavlovic, M.G.; Radmilovic, V. The morphology of copper electrodeposits. Part I. The mechanism of copper cauliflower like electrodeposits formation. J. Serb. Chem. Soc. 1993, 58, 1055–1062. [Google Scholar]
- Tatiparti, S.S.V.; Ebrahimi, F. Electrodeposition of Al–Mg alloy powders. J. Electrochem. Soc. 2008, 155, D363–D368. [Google Scholar]
- Li, H.; Ebrahimi, F. Tensile behavior of a nanocrystalline Ni–Fe alloy. Acta Mater. 2006, 54, 2877–2886. [Google Scholar]
- Tatiparti, S.S.V.; Ebrahimi, F. An understanding of the electrodeposition process of Al–Mg alloys using an organometallic–based electrolyte. J. Appl. Electrochem. 2010, 40, 2091–2098. [Google Scholar]
- Tatiparti, S.S.V.; Ebrahimi, F. The formation of morphologies and microstructures in electrodeposited nanocrystalline Al–Mg alloy powders. J. Electrochem. Soc. 2010, 157, E167–E171. [Google Scholar]
- Lee, J.; Talbot, J.B. A model of electrocodeposition on a rotating cylinder electrode. J. Electrochem. Soc. 2007, 154, D70–D77. [Google Scholar]
- Tatiparti, S.S.V.; Ebrahimi, F. Internal structure of the electrodeposited nanocrystalline Al–Mg alloy dendrites. Mater. Lett. 2011, 65, 2413–2415. [Google Scholar]
- Simanavicius, L.; Stakenas, A.; Sarkis, A. The initial stages of aluminum and zinc electrodeposition from an aluminum electrolyte containing quaternary aralkylammonium compound. Electrochim. Acta 1997, 42, 1581–1586. [Google Scholar]
- Tatiparti, S.S.V.; Ebrahimi, F. Potentiostatic versus galvanostatic electrodeposition of nanocrystalline Al–Mg alloy powders. J. Solid State Electrochem. 2011. in press. [Google Scholar]
- Tatiparti, S.S.V.; Ebrahimi, F. Preferred orientation and shape of electrodeposited nanocrystalline Al–Mg alloy dendrites. Mater. Lett. 2011, 65, 1915–1918. [Google Scholar]
- Murray, J.L. The Aluminum–Magnesium system. Bull. Alloy Phase Diagr. 1982, 3, 60–74. [Google Scholar]
- Tatiparti, S.S.V.; Ebrahimi, F. Substrate effect on electrodeposited nanocrystalline Al–Mg alloy powders. Mater. Lett. 2011, 65, 1859–1861. [Google Scholar]
- Barton, J.L.; Bockris, J.O.M. The electrolytic growth of dendrites from ionic solutions. Proc. R. Soc. London 1962, 268, 485–505. [Google Scholar]
- Walsh, F.C.; Herron, M.J. Electrocrystallization and electrochemical control of crystal growth: Fundamental considerations and electrodeposition of metals. J. Phys. D: Appl. Phys. 1991, 24, 217–225. [Google Scholar]
- Tatiparti, S.S.V. Extended solubility in the electrodeposited nanocrystalline Al–Mg alloy dendrites. Mater. Lett. 2011, 65, 3173–3175. [Google Scholar]
© 2011 by the authors; licensee MDPI, Basel, Switzerland. This article is an open access article distributed under the terms and conditions of the Creative Commons Attribution license (http://creativecommons.org/licenses/by/3.0/).
Share and Cite
Tatiparti, S.S.V.; Ebrahimi, F. Evolution of Morphology and Microstructure in Electrodeposited Nanocrystalline Al–Mg Alloy Dendrites. Metals 2011, 1, 3-15. https://doi.org/10.3390/met1010003
Tatiparti SSV, Ebrahimi F. Evolution of Morphology and Microstructure in Electrodeposited Nanocrystalline Al–Mg Alloy Dendrites. Metals. 2011; 1(1):3-15. https://doi.org/10.3390/met1010003
Chicago/Turabian StyleTatiparti, Sankara Sarma V., and Fereshteh Ebrahimi. 2011. "Evolution of Morphology and Microstructure in Electrodeposited Nanocrystalline Al–Mg Alloy Dendrites" Metals 1, no. 1: 3-15. https://doi.org/10.3390/met1010003