The Manufacture and Characterisation of Aluminium Foams Made by Investment Casting Using Dissolvable Spherical Sodium Chloride Bead Preforms

Abstract
: Open cell Al foams have been made by infiltrating molten Al into preforms made from porous salt spheres. Infiltration has been effected using simple pressure-assisted vacuum investment casting where the maximum infiltration pressure difference was less than 36 psi. The preform and resulting foam density decreased with increasing compaction pressure and the foam density increased with increasing infiltration pressure. For low pressure infiltration, and high density preforms, salt dissolution was rapid due to the porous nature of the salt spheres. Infiltration of molten Al occurred into the beads and, for high density preforms and higher infiltration pressures, the volume of metal in the beads exceeded that in the cell walls, drastically decreasing the NaCl dissolution rate. A simple approach is shown whereby the data from mercury porosimetry can be used to predict the resulting foam density, thereby aiding the design of preform and beads structures.1. Introduction
Infiltration processing offers a versatile and economical route to the production of open cell Al foams, where simple equipment is used and net shape can be obtained [1]. Achieving this involves four steps: preparation of the leachable preform (usually from NaCl); infiltration of molten metal into the preform; solidification of the molten metal; and dissolution of the preform in a solvent or water. The relative density of the foam can be controlled by varying the degree of densification of the NaCl preform, most commonly by a combination of mechanical pressing and sintering, where the resulting preform volume fraction is in the range of 0.64 to 0.9 [2]. The foam structure is then a negative of the structure of the preform.
It has been suggested that it is desirable to produce open cell foams using space holders that are spherical in shape and similar in size, due to the equi-axed cell shapes, smooth cell wall surfaces, isotropic foam structure and uniform distribution of the cell sizes that result [2,3]. Spherical salt beads have been made by melting and in-flight spheriodisation techniques [3] and coarse spheres have been made by forming a paste made from fine salt particles mixed with flour and water [4]. The latter process has the advantage that the large beads are porous and are more rapidly dissolved from the infiltrated preform than a solid crystal of the same size.
Infiltration requires the liquid metal to be driven into the spaces between the NaCl particles in order to overcome the capillary force arising from non-wetting conditions between Al and NaCl. Whilst this pressure can be applied mechanically, more commonly pressurised argon or nitrogen gas are used. Being able to predict the relationship between the infiltration pressure and the volume of liquid metal intruded and the relationship between the pressure required and the geometry and volume fraction of pores, is paramount to tailoring the density of the foam structure, designing porous preforms and the apparatus required to effect infiltration.
Recent studies have demonstrated that the application of models from soil science, that consider unsaturated flow of a liquid into a porous body, can be applied to model the infiltration of porous ceramics with liquid metals [5,6]. This approach describes the saturation, S (the extent of filling), of the preform with liquid as a function of the applied pressure, P, as:
Mercury porosimetry can be used to produce plots of the volume of Hg intruded into a porous preform as a function of the applied pressure. These curves are easily converted to saturation vs. pressure (or drainage) curves. It has been demonstrated that all that differs between this process and infiltration of the same preform with molten aluminium, is the different wetting behaviour in the two systems [5,6]. A scaling factor, φ, is then applied to multiply the pressure to translate the S vs. P curves in the Hg-preform system to the Al-preform system. The scaling factor is the ratio of the work of immersion in the two systems and is given by:
2. Results and Discussion
Figure 2 shows that the preforms decrease in height and increase in density as the compaction pressures increases and that they are self-supporting after compaction. Their respective densities after sintering at 730 °C are shown in Table 1 and were lower than before sintering (1.30 ± 0.02, 1.48 ± 0.02 and 1.63 ± 0.02 g/cm3 for compacts compacted at 32, 39 and 50 MPa respectively). This is initially surprising but is observed because, even though there is a linear shrinkage of roughly 3–5% after sintering, there is also an approximate 10–15% mass loss due to burning out of the flour binder. It is worth noting that the scatter in the density, given as one standard deviation, is low showing good reproducibility of the compaction and sintering processes.
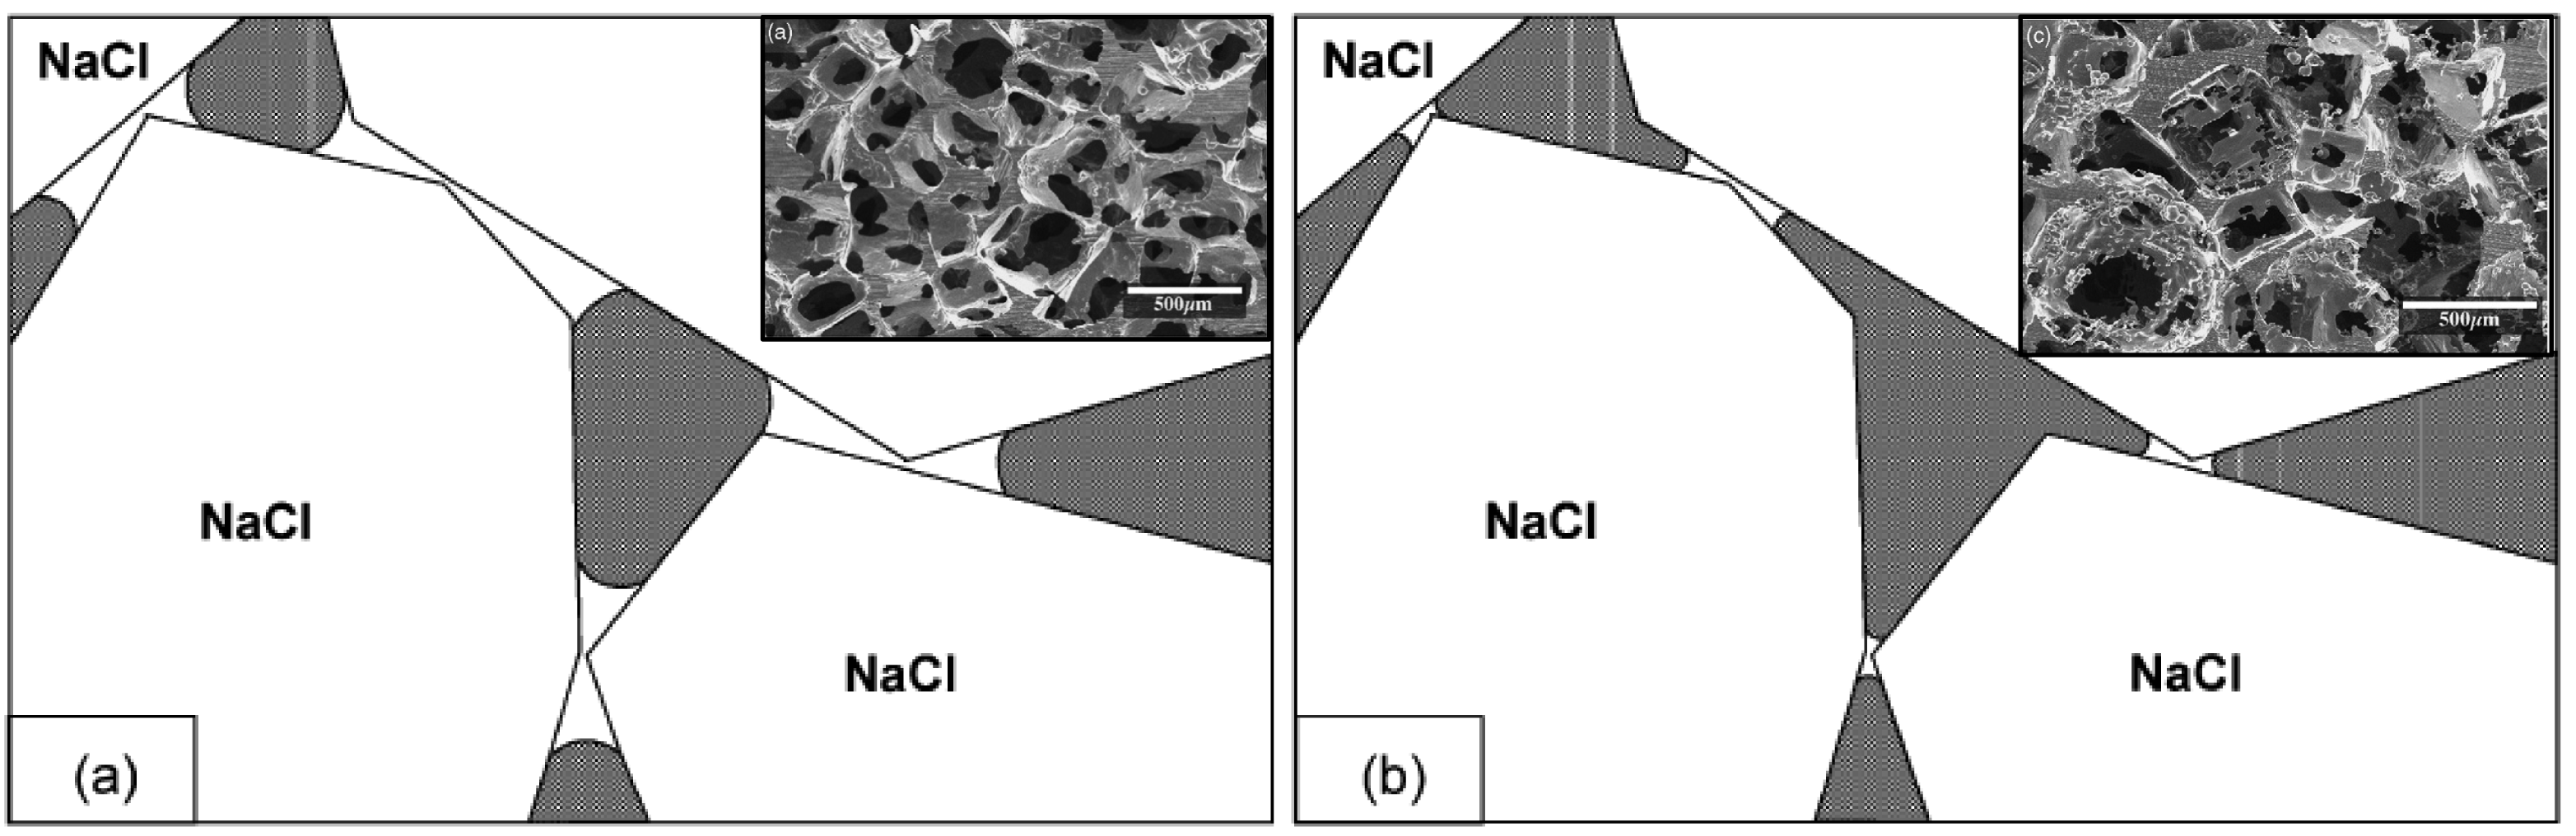
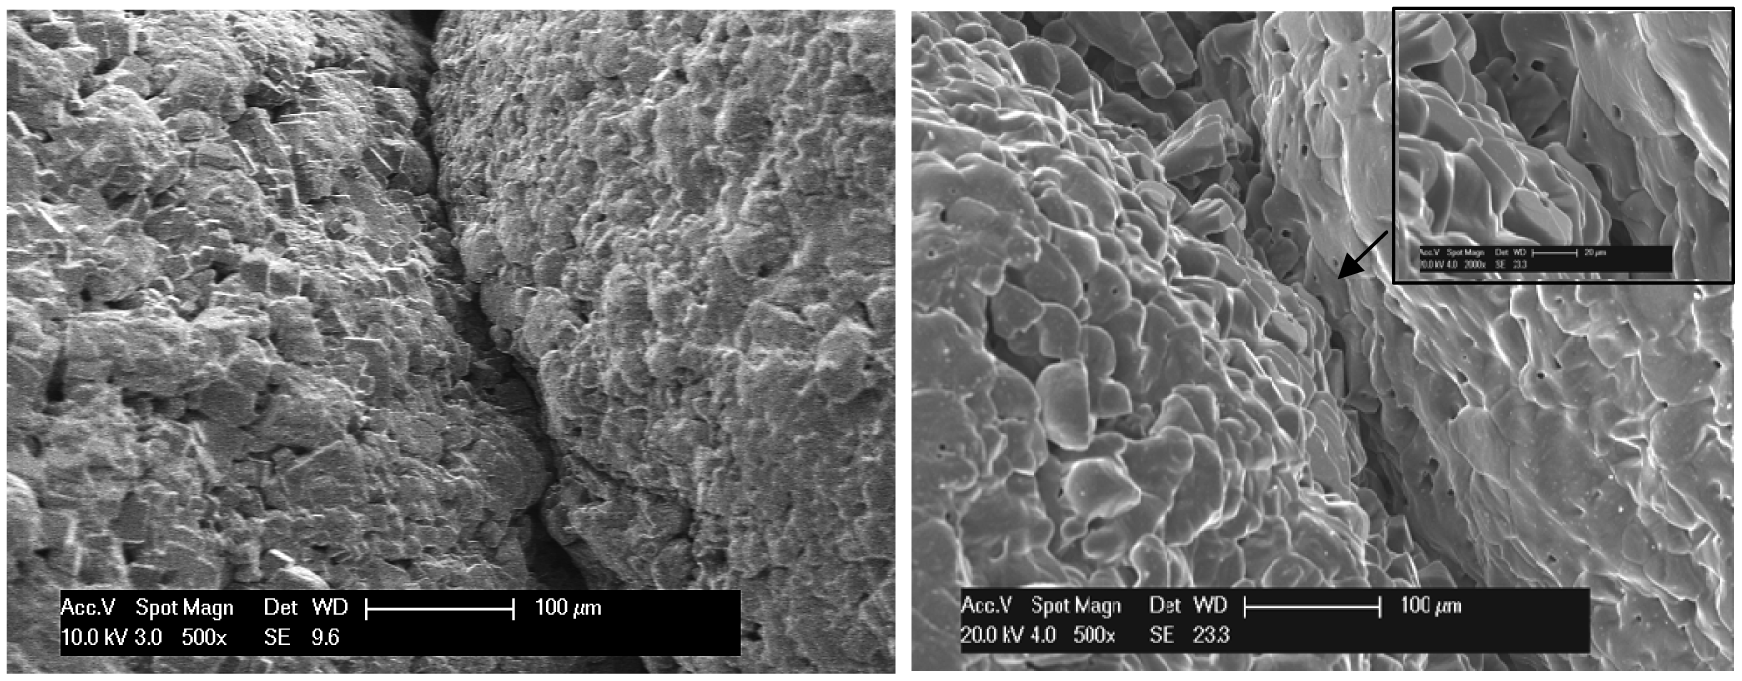
Figure 3 shows the microstructure and the different degree of connectivity achieved between the beads before and after sintering. Some local deformation between the NaCl beads is observed, imparting strength to the preform through mechanical interlocking. It is thought that additional strength is achieved through inter-bead adhesion due to the sticky nature of the flour binder.
After sintering, the flour paste is burnt out, leaving behind porosity in the beads, and the angular nature of the individual salt particles is evident in the right hand image in Figure 3. Sintered connections can now be observed between individual salt particles on the bead surface along the contact line, as indicated by the arrow in the right hand image. There was no evidence of significant neck formation between the beads and no connections could be seen, at any magnification, without sintering. It should be noted that the principle means by which the salt particles are held together within the bead is not by sintering, but by precipitation of NaCl from the liquid component in the paste, forming bridges between solid NaCl particles, during bead production.
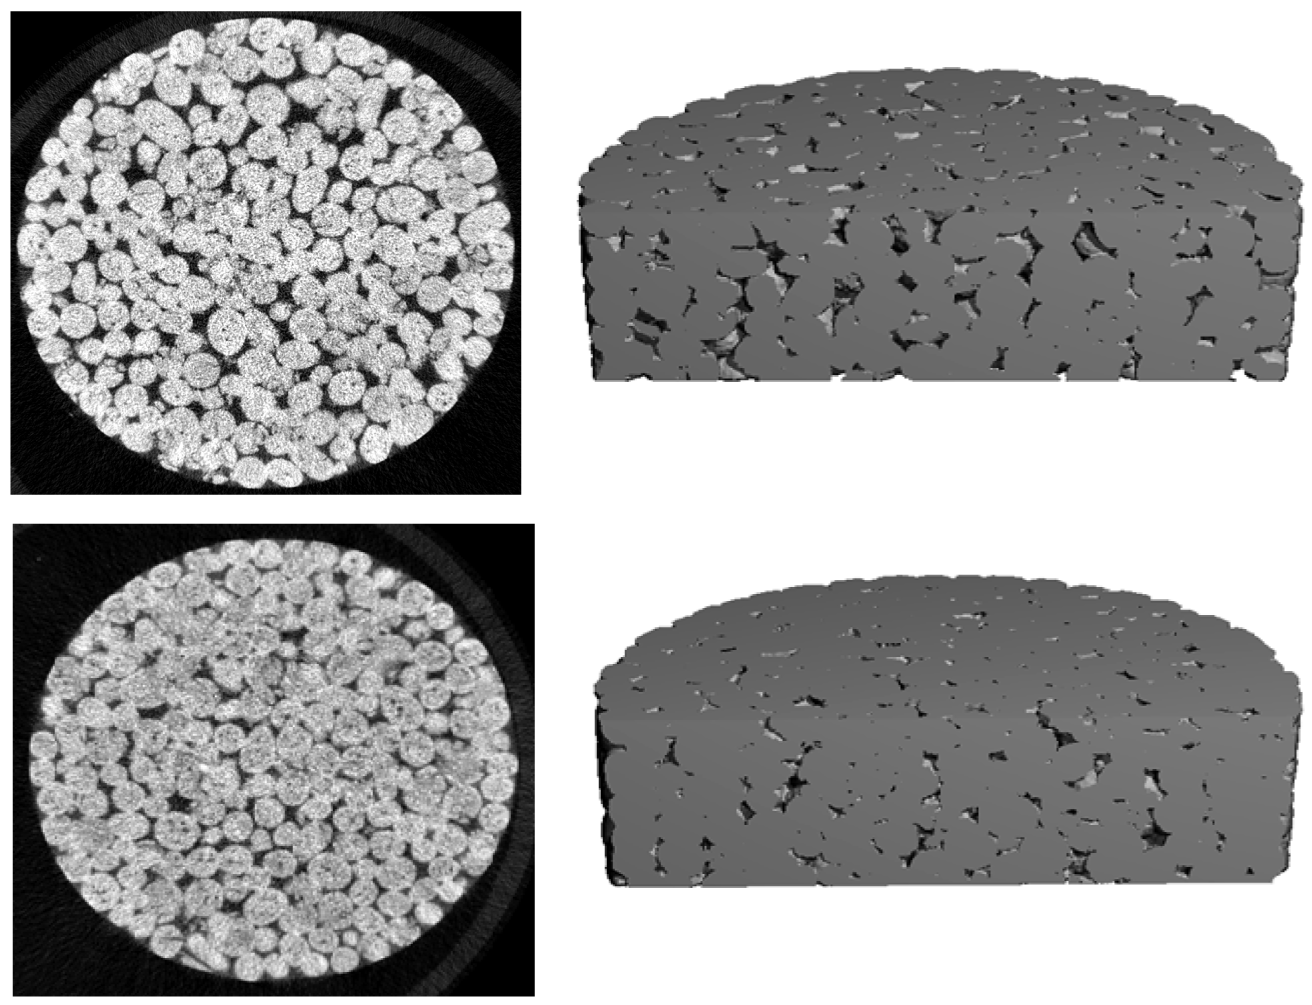
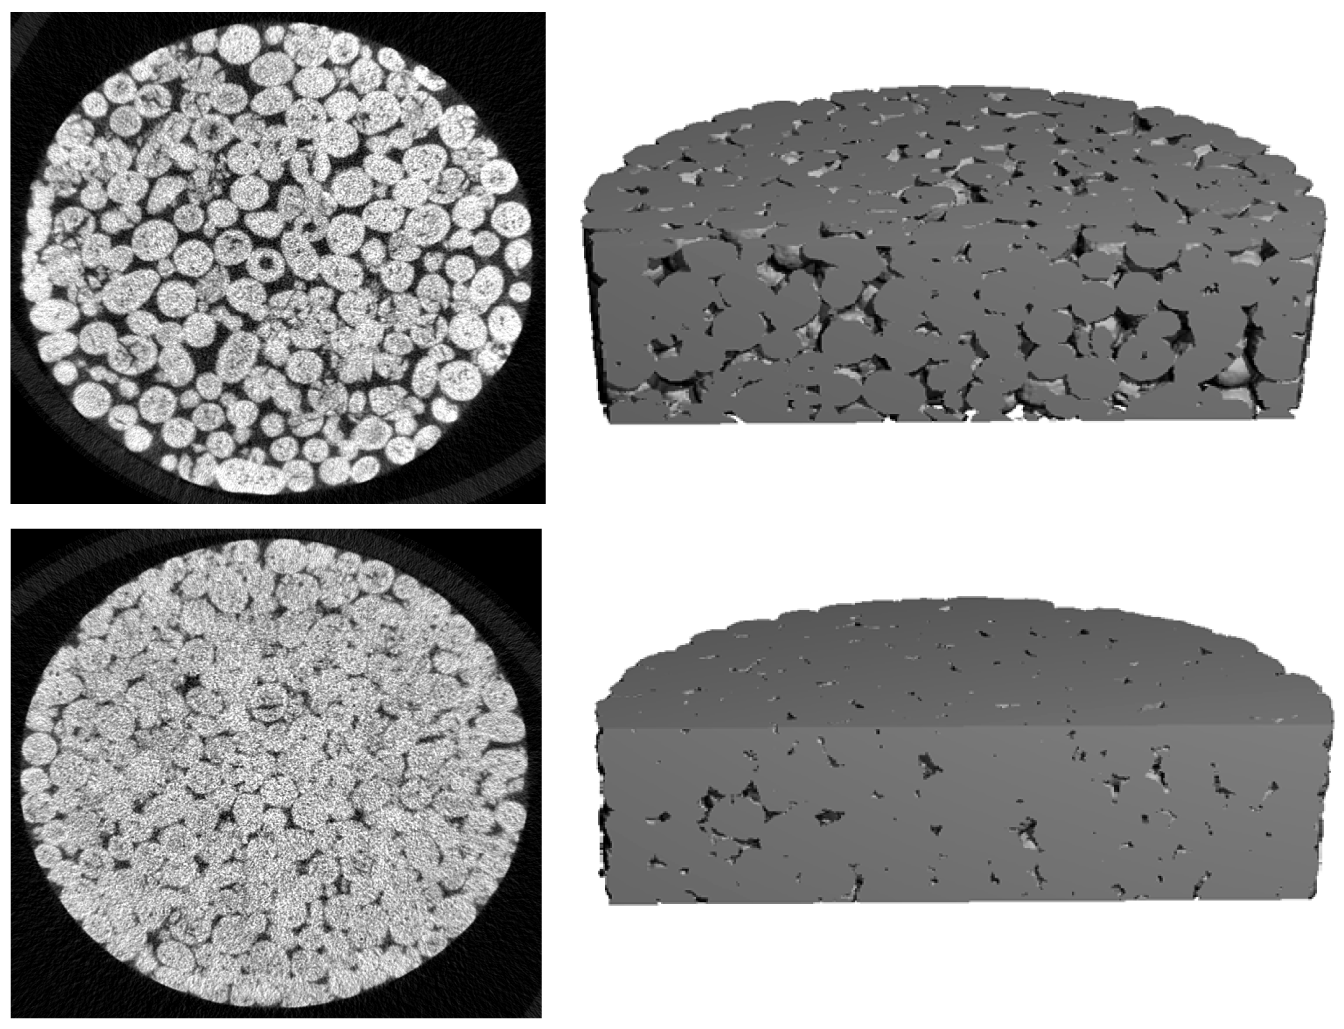
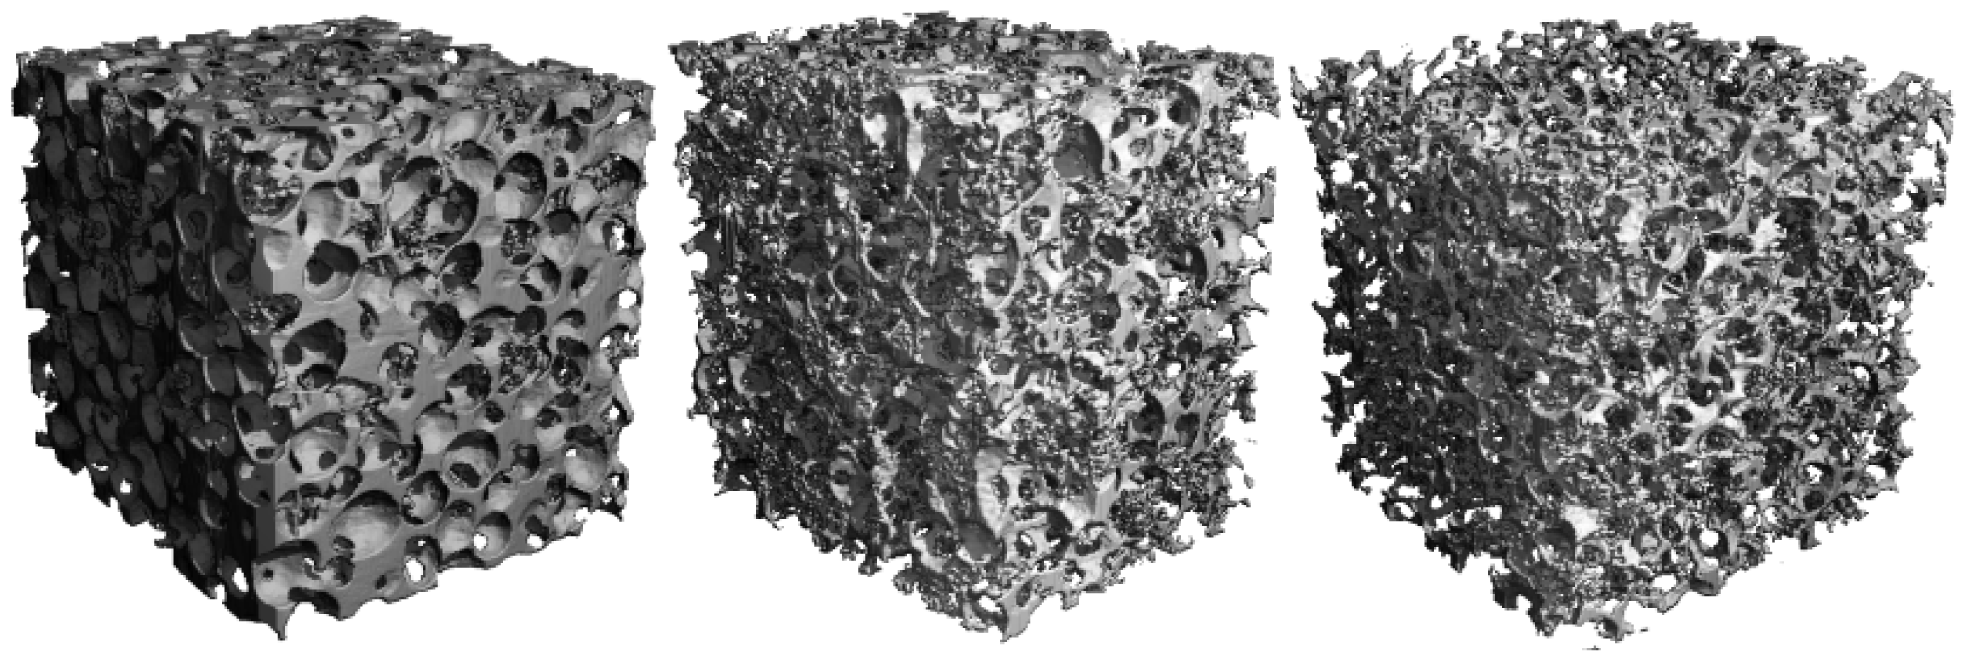
μCT was used to reveal the inter-bead pore structure. It should be noted that the resolution of the instrument used was insufficient to distinguish the fine porosity which is present within the beads. Figure 4 presents 2D and 3D images of preforms compacted at 39 MPa, showing the development of the pore structure with sintering at 730 °C for 4 h. The porosity and channels between the beads can clearly be observed to decrease in volume and size after sintering but remain triangular in cross section, rather than rounded, as would normally be expected if extensive neck formation between the beads had taken place. Figure 5 shows the difference in pore structures for sintered preforms compacted at different pressures. The size and fraction of porosity clearly decreases with increasing compaction pressure and the co-ordination number and contact area between particles is higher for beads in preforms compacted at higher pressures. It is worth noting that the beads still remain reasonably spherical even after compaction at the highest pressure.
Porosimetry data, summarised in Table 1, show that the beads are only 77% dense and that since the apparent density (measured at the maximum intrusion pressure of 60,000 psi, roughly 414 MPa) is below the theoretical density for salt (2.16 g/cm3), they contain closed porosity. Whilst there is good agreement between the bulk density measured by porosimetry and that measured manually for preforms compacted at 39 and 50 MPa, there is a significant discrepancy between those measured for the preform compacted at 32 MPa. This is due to appreciable infiltration of Hg into the large pores (>400 μm) in this low density preform at the lowest intrusion pressure (0.45 psi, 0.003 MPa) which is used to determine the sample volume. The manually measured value was taken as being representative of the true value for the density. The levels of total, open and closed porosities in these structures have been calculated from the bulk, apparent and theoretical densities. The total and open porosities in the compacted preforms decrease with increasing compaction pressure while the fraction of closed porosity is roughly constant at between 2 and 3 vol%.
The relative densities of the preforms have also been calculated and expressed in two forms, relative to the density of salt, from which the total porosity can be determined (given in brackets), and relative to the density of the beads, which enables the fraction of connected porosity in the preform to be estimated (also given in brackets). The porosities relative to salt are all in the range where a foam with a continuous structure might be expected (0.15 to 0.6 [8,9]). If the interconnected porosity between the beads is considered, for compaction pressures of 39 and 50 MPa, the porosity is below this lower limit.
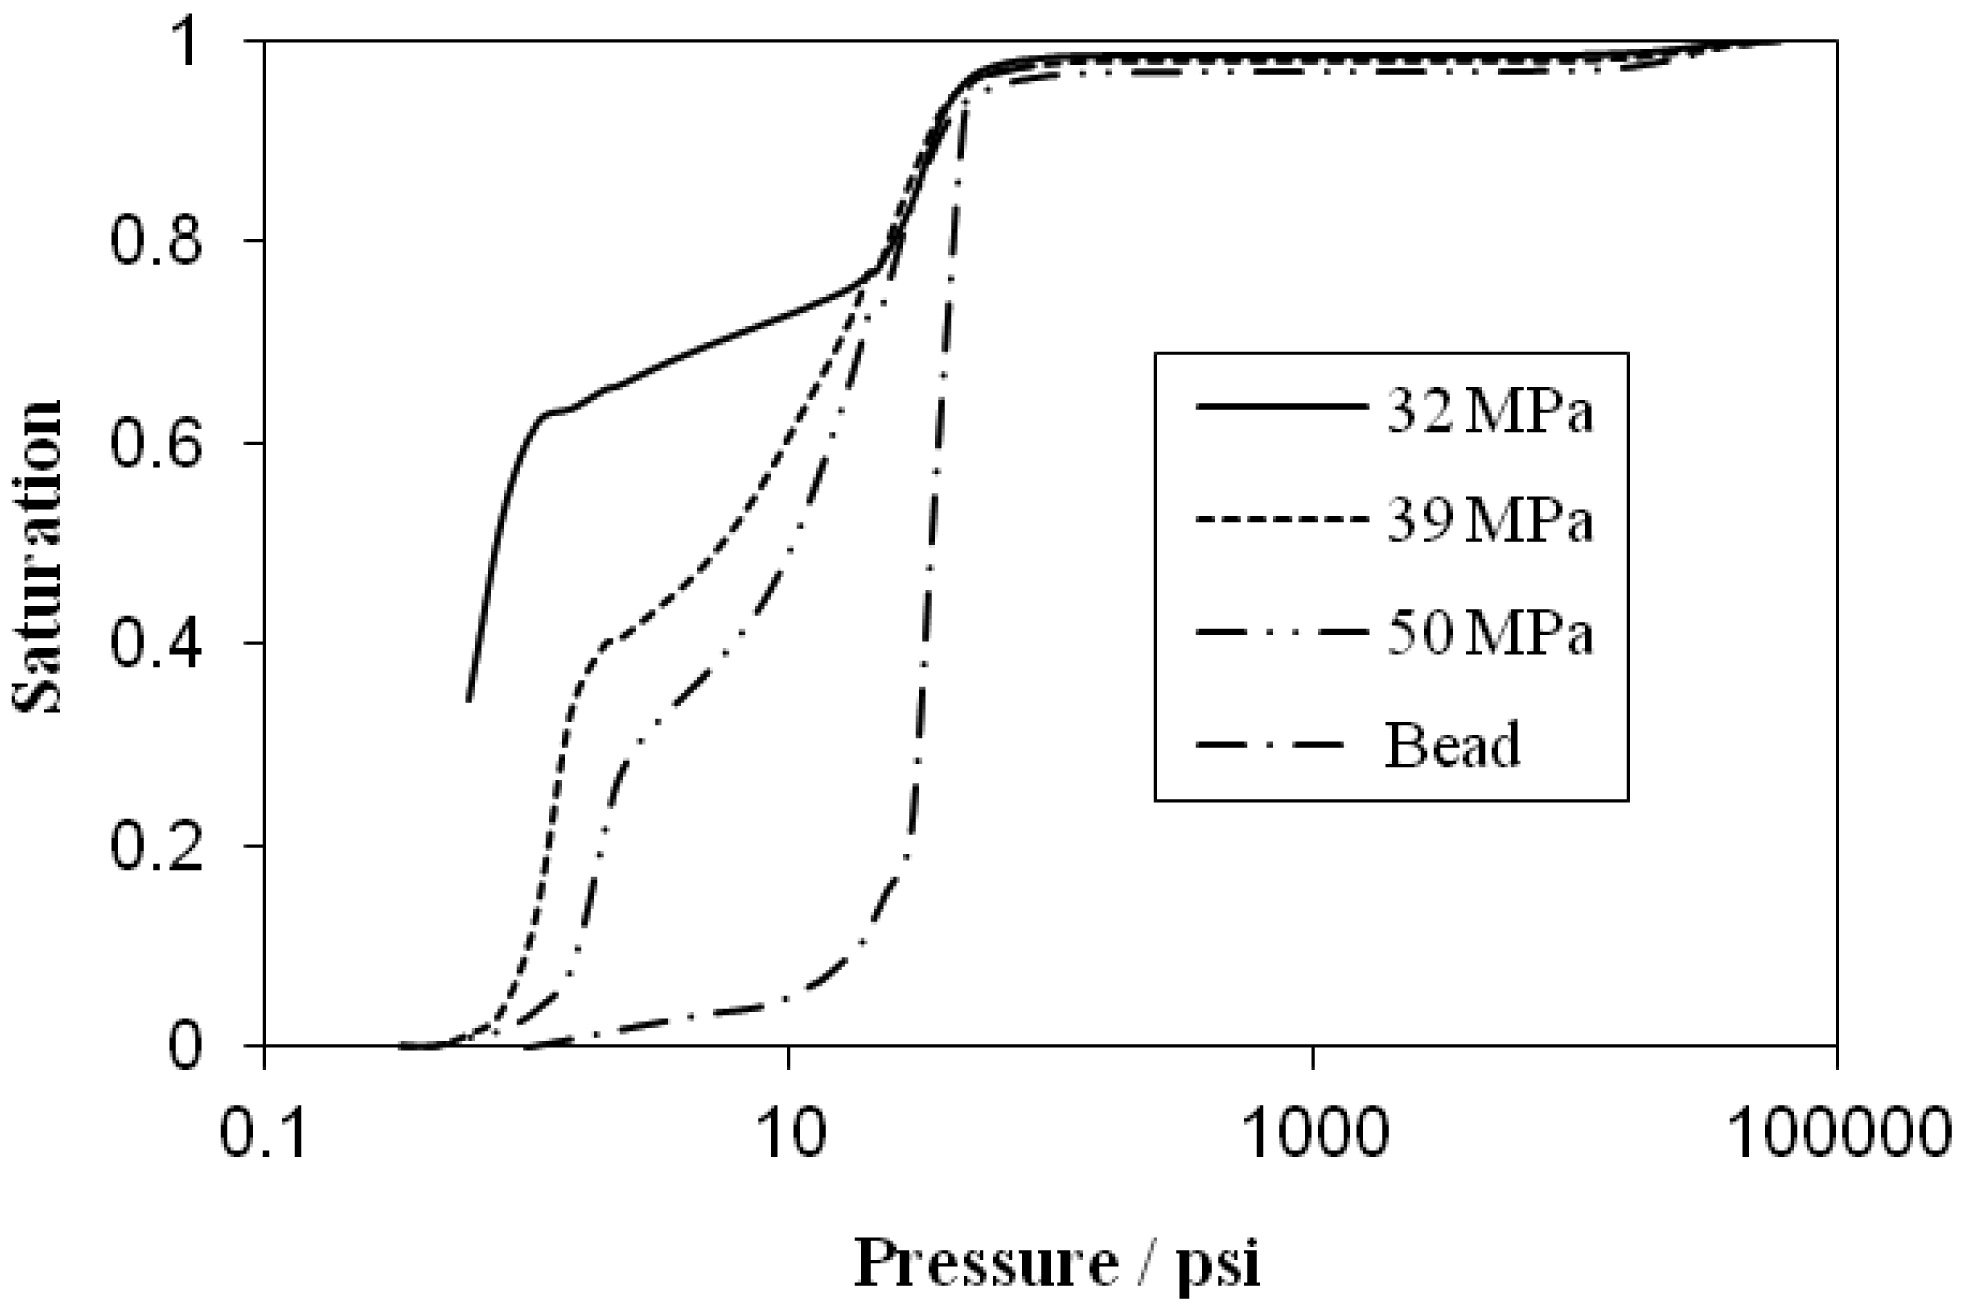
Figure 6 presents the data from Hg porosimetry where the saturation (the volume intruded at a given pressure divided by the maximum volume intruded) is plotted as a function of the infiltration pressure (on a logarithmic scale). Since the relationship between density and intruded volume is known, a correction has been made to account for the Hg pre-infiltrated into the preform compacted at 32 MPa. Through the Young-Laplace equation, the infiltration pressure can be related to the smallest capillary, d, filled at that pressure, via the surface tension of the liquid (0.485 Nm [10]) and the contact angle between the liquid and the preform material (139° [11]).
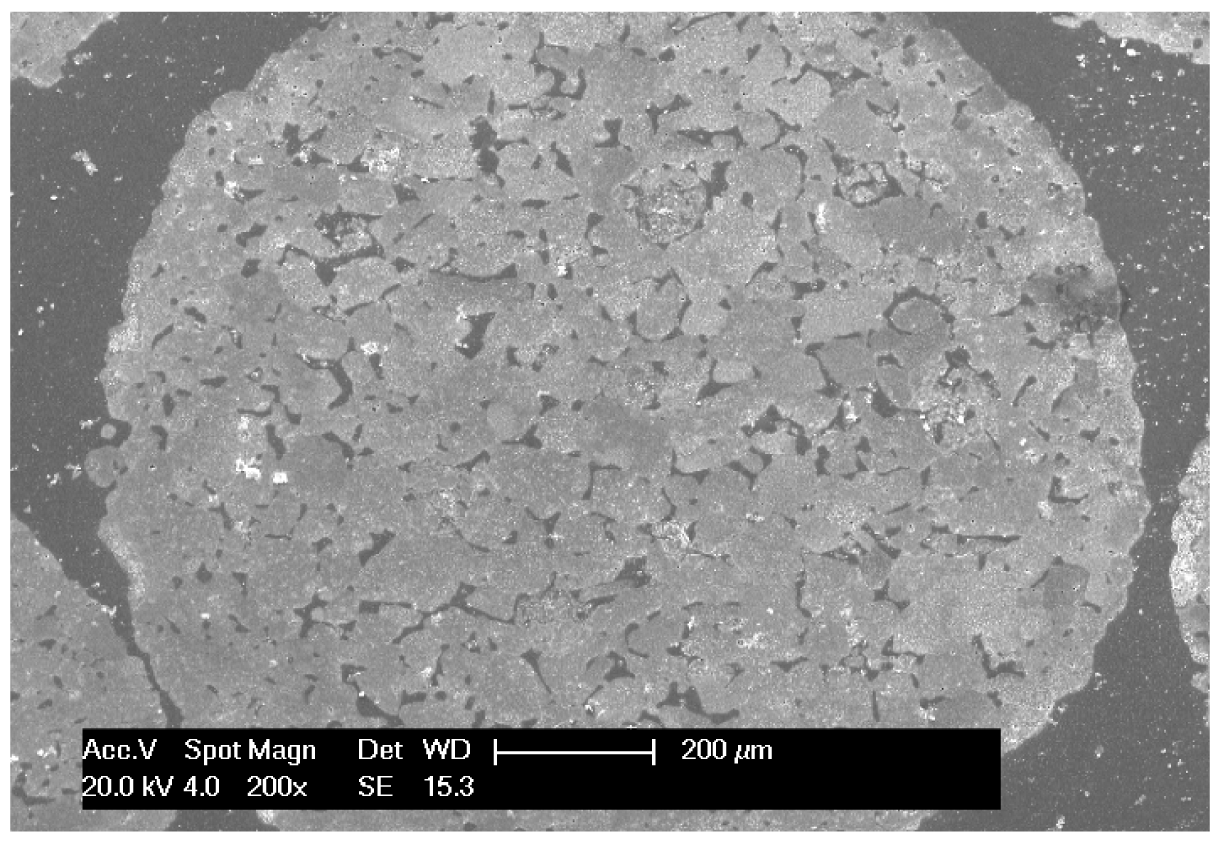
The saturation curve for the beads in Figure 6 shows the typical pressure dependence demonstrated for a simple porous structure made from polydisperse powders. Intrusion is initially slow but increases rapidly above a pressure of roughly 20 psi, equivalent to infiltrating pores with a diameter of roughly 10 μm. Figure 7 shows the porous structure in a cross section of a sintered bead, where an extensive network of pores and channels can be observed varying on the scale of a few to a few tens of microns.
The curves for the preforms are more complex, showing multi-stage infiltration. At a given infiltration pressure, the saturation decreases as the compaction pressure increases (and the preform density increases). In all cases, at low pressures the rate of change of saturation with pressure is high but then decreases, the transition occurring at higher pressure (and at lower saturations) as the preform density increases. This indicates the presence of larger volumes of larger pores as the preform compaction pressure decreases, supporting the μCT images in Figures 4 and 5. At pressures above roughly 25 psi, where all the preforms have achieved roughly 70–80% saturation, the compacted bead precursors exhibit an increase in the rate of change in saturation with pressure that is coincident with that observed for the beads. This strongly indicates that at and above this pressure, infiltration of Hg within the beads in the preform dominates the change in saturation.
Table 2 presents the densities for the foams made by infiltration, after dissolution of the NaCl, as a function of preform compaction pressure and infiltration pressure. It is clear that, as expected, the foam density decreases with increasing preform compaction pressure (and hence increasing preform density) but increases with increasing infiltration pressure. The low scatter in the densities indicates that infiltration, as well as compaction of the preform, is reproducible. The corresponding saturation is shown and has been calculated based on the foam density, density of aluminium (2.69 g/cm3) and the volume fraction of open pores.
Table 2 also presents the predicted foam densities based on complete infiltration of the porosity considering either the total volume of pores (including open and closed pores within the beads) or only the porosity between the beads. These predictions are made using data for the relative densities from Table 1 and the density of Al. It is clear that the densities achieved are below the maximum, as would be expected, as these low infiltration pressures will not fill all the porosity present (and obviously not the closed porosity) but, perhaps surprisingly, are above those for 100% filling of all the porosity between the beads. As there was no evidence for residual salt in the foam structure, and despite accepting there could be some small error in the value for the relative porosity, this suggests that infiltration of metal into the porosity within the beads must occur. Since the density for the preform compacted at 50 MPa and infiltrated at 36 psi is more than twice that predicted from the inter-bead porosity, the volume of metal within the beads is expected to be higher than that between the beads.
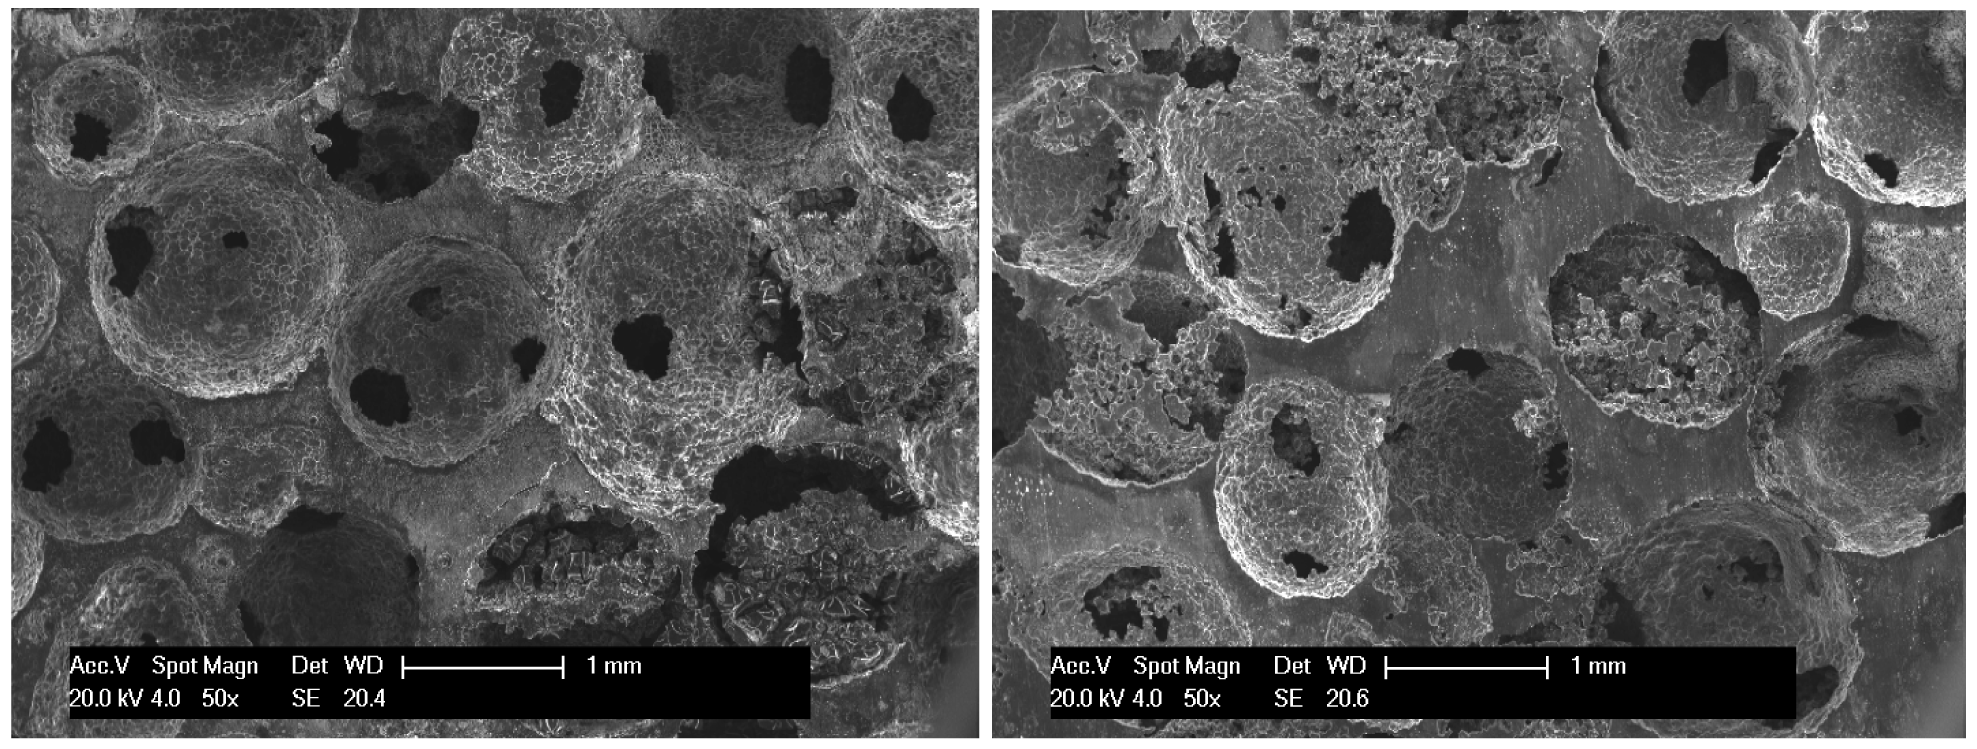
The macrostructures for foams infiltrated at 14 psi are shown in Figure 8. It is clear that the foam density decreases with increasing preform compaction pressure. The microstructures for foams made from preforms pressed at 32 MPa are shown in Figure 9 for infiltration at lower (14 psi) and higher (36 psi) pressure differences. Preforms pressed at 32 MPa contain a high fraction of porosity with large channels and this porosity is filled even at low infiltration pressures to give accurate replication of the round beads and an interconnected foam structure with thick cell walls. Close inspection of the cell walls (shown in Figure 10) reveals that the fine detail on the surfaces on the NaCl spheres is replicated in the cell wall surfaces. Small windows between neighbouring cells are observed, originating from the contact areas between salt spheres and magnified by the inability to fully infiltrate metal into the small gaps between these contacting particles. The window size decreases with increasing infiltration pressure, as the minimum capillary radius decreases (as the ability to fill smaller spaces improves). Figure 9 shows that there is infiltration of metal into the porosity in the salt beads, even at the lower infiltration pressure, evidenced by fine nodular clusters within the pores. This infiltration into the beads occurs to some degree in all the infiltrated preforms, but the frequency of these clusters, and their size, increase with increasing infiltration pressure. Figure 10 shows one of these clusters more clearly, along with the triangular cross section of the struts. It is unlikely that these nodular structures will contribute in an effective way to the strength of the foam, despite increasing the foam density.
As the preform compaction pressure increases, the preform porosity and the foam density decrease. For preforms compacted at 39 and 50 MPa, shown in Figures 11 and 12, many of the cell walls are incomplete, agreeing with the postulate for the formation of isolated struts for preforms with relative densities below 0.15 [8,9]. This is particularly evident at the highest compaction pressure, where internal voids of the order of several pore diameters in size were observed, presumably due to extensive or complete closure of the channels between beads. At the higher infiltration pressure, the foam density does increase, but there is little improvement in the continuity of the cell structure; rather the increase in density is affected by an increase in the fraction of metal infiltrated into the porosity within the beads. Both the window size and number increase with increasing compaction pressure, as both the co-ordination number and the contact area between beads increases (according to measurements for similar foams in [12], the co-ordination number might be expected to increase from 9 to 10.5 and the normalised contact area to double over the interval of preform density covered in this study).
The methodologies in [5,6] were implemented in order to see whether the infiltration behaviour could be predicted. Figure 13 shows the Hg saturation curve for the preform compacted at 32 MPa, along with the saturations determined from measurements of the foam densities for infiltration at 14 and 36 psi. It should be noted that the scatter in the saturation values is less than the size of the symbol used to represent the mean value and has been omitted for clarity. Only the low pressure range, which is of interest in relation to the experimental work, has been shown. The dashed line has been fitted to the experimental data by multiplication of the pressure values by a constant, in this case selected by trial and error. Good agreement was obtained for a multiplier of 2.2. If this scaling factor were to be calculated from the wetting data for Hg and Al on NaCl [11,13,14], it yields a value between 2.1 and 2.2, close to that determined experimentally.
As this multiplier, φ, defined earlier, is unique to the Al-NaCl system, it can be used to translate the Hg porosimetry data for preforms compacted at 39 and 50 MPa. Figure 14 shows the predicted saturations as a function of pressure and that the agreement is good between the predicted and measured values for these foams, despite the complex architectures of the preforms and the relative simplicity of the infiltration apparatus. Accurate prediction does, however, require that premature freezing of the metal does not occur before the saturation can achieve equilibrium. In this instance mould preheating and appropriate gate design ensure this is the case.
The value in being able to predict the change in saturation (from which the foam density can be simply calculated by multiplication by the open porosity and the density of aluminium) as a function of pressure, is that it enables the limited pressure available from the pressure-assisted vacuum investment casting equipment (<36 psi) to be considered in the design or selection of appropriate beads and preforms to achieve a target structure and density after infiltration (including the design of beads to reduce the pore size so that bead infiltration is eliminated). Given the uncertainty in the appropriateness of the wetting data taken from sessile drop measurements and the variability in the values for the surface tension of Al, the scaling factor is better determined by the method shown here where a series of infiltration experiments, over a range of pressures, is used to yield an appropriate value for φ by best fitting from the Hg porosimetry data. Once established for one preform type, this conversion can then be applied to any Hg porosimetry data, for any other NaCl bead or preform geometry, to predict the saturation or foam density, as a function of pressure.
Figure 15 compares the dissolution behaviour for the different precursors infiltrated at different pressures (with the same mass of salt). For those preforms infiltrated at low pressure, as the density of the preform increases, and the volume fraction of Al decreases, the dissolution time also decreases (80 min, 50 min and 30 min for preforms compacted at 32, 39 and 50 MPa respectively). Higher compaction pressures result in increased connectivity of the salt bead structure (both in terms of the co-ordination number and the contact area [12]) allowing easier ingress of water and egress of NaCl and increased rates of dissolution.
Infiltrating the preform at higher pressure results in a significant increase in the time required to remove the NaCl (140 min, 120 min and 200 min for preforms compacted at 32, 39 and 50 MPa respectively). As some of these foams have similar densities to those infiltrated at lower pressure, the large decreases in the rate of salt dissolution from the beads is most likely to be due to the extensive infiltration of metal within the salt beads, creating an additional network of interpenetrating fine channels of metal and salt. This accounts for the very slow dissolution behaviour for the preform compacted at 50 MPa, where infiltration of metal into the beads is more extensive than into the spaces between the beads. It should be remarked, however, that due to the porous nature of the beads, salt removal is still quite rapid compared due to the ability for the porous bead to collapse as well as dissolve. For example, for a similar sized sample containing NaCl with a mean size between 338 and 1500 μm, it took 240 min for the salt to be removed in hot water at 95 °C [15].
3. Experimental Section
Porous salt beads with sizes between 1.4 and 2.0 mm were made by a process detailed in [11,16] involving the disintegration of a paste containing pre-gelatinised flour, water and NaCl (in mass proportions of 1:10:50 respectively), in oil. The beads were poured into a 22 mm diameter steel die, tapped a few times to improve packing and then compacted at pressures of either 32, 39 or 50 MPa to make preforms. The densities of the resulting preforms and preforms that were subsequently sintered at 730 °C for 4 h, were measured from the geometry and their mass and their structure was characterised using optical microscopy, scanning electron microscopy (SEM), X-ray computed tomography (Scanco AG, μCT40) and mercury porosimetry (Micromeritics Autopore IV).
Foams were produced by a pressure-assisted vacuum investment casting process whereby many foams were produced at a time. The casting process requires the assembly of multiple preforms onto a tree and the production of a mould using investment powder and a flask system. In order to prevent the investment material from penetrating the porous preforms during manufacture of the mould, the compacted bead preforms were impregnated with molten investment wax. Up to 9 preforms were then attached via runners to a wax tree (shown in Figure 16). The wax tree was placed in a 4 inch diameter perforated steel mould with a rubber sleeve on the outside. Jewellery investment powder (Eurovest, SRS) was mixed with water and poured into the mould. It was then degassed and left to set at room temperature for a minimum of 2 h.
When ready for casting, the rubber base was removed and the mould was placed in furnace, upside-down, at 150 °C, in air, and held for 1 h, during which period the wax melted and was collected. The mould was then inverted, with the casting hole uppermost, and the temperature was increased to 230 °C (held for 3 h) and then to 730 °C (held for 4 h), heating at a rate of 1 °C/min. This stage of the heat treatment burns out the flour from the salt spheres and causes sintering and densification of the preform. The furnace temperature was then decreased to the casting temperature, of 600 °C, and held at this temperature for a minimum of 1 h. In order to understand the effect of this plaster curing process on the preform structure, preforms were sintered under the same conditions and then characterized.
The mass of pure (99.5%) Al required for infiltration was weighed out, charged into the crucible of the vacuum pressure casting machine (Indutherm VC 400, a schematic of which is shown in Figure 17 [17]) and heated under nitrogen to the pouring temperature (in all cases 760 °C). The charge was rapidly heated to this temperature, by induction, in less than 5 min. When the casting temperature was reached, the pre-heated mould was manually transferred from the furnace to the vacuum chamber, below the crucible. When the maximum vacuum of -14 psi was reached, the stopper-rod in the crucible in the top chamber was raised, dispensing liquid metal into the mould, at which point the pre-set nitrogen gas pressure (either atmospheric pressure or 22 psi gauge) was applied to the top chamber. Gas pressure and vacuum were maintained whilst cooling and solidification took place, a minimum of 5 min, after which the flask was removed from the casting unit. After cooling for a further 5 min, the mould was plunged into a bath of cold water to disintegrate the investment and release the casting (shown in Figure 16). A minimum of 9 preforms were infiltrated for each condition.
Since the as-cast parts have a continuous surface skin covering the salt beads, due to shrinkage of the preform whilst preheating the mould, samples were prepared for NaCl dissolution rate tests by machining 1–2 mm from the top and bottom faces of the infiltrated samples. The dissolution behaviour for the salt within the preforms was measured by immersion of the infiltrated preforms in static water, at 65 °C, and periodic removal, drying and weighing. After complete NaCl removal, judged when the mass of the sample no longer changed with immersion time, the samples were cut using electro-discharge machining into 18 × 18 × 18 mm (±0.05 mm) cubes and the foam density was determined by dividing the mass of the foam sample by its volume. The foam structure was examined on the cut faces.
4. Conclusions
Preforms made from porous salt beads have been infiltrated with molten Al using pressure-assisted vacuum investment casting, despite the maximum infiltration pressure difference being less than 36 psi. The resulting foam densities increased with decreasing preform compaction pressure and increased with increasing infiltration pressure. At both infiltration pressure differences, 14 and 36 bar, infiltration of molten Al occurred into the porous beads. Although for low pressure infiltration, and high density preforms, salt dissolution was rapid, due to the porous nature of the beads, for preforms infiltrated at high infiltration pressures, the higher volumes of metal in the beads decreased the NaCl dissolution rate significantly. Hg porosimetry, in conjunction with a simple modification to account for the different wetting in the Al system, has been used to accurately predict the infiltration behaviour for different preforms. This tool can be used to aid the design of bead and preform structures.


| Sample | Density | Porosimetry | Porosity | Relative density | |||
|---|---|---|---|---|---|---|---|
| bulk | app | Open | Closed | cf NaCl = 2.16 | cf Bead = 1.67 | ||
| Beads | - | 1.67 | 2.11 | 0.21 | 0.02 | 0.77 (0.23) | 1 |
| 32 MPa | 1.28 | 1.46 † | 2.09 | 0.39 | 0.02 | 0.59 (0.41) | 0.77 (0.23) |
| 39 MPa | 1.45 | 1.46 | 2.09 | 0.30 | 0.02 | 0.68 (0.32) | 0.87 (0.13) |
| 50 MPa | 1.55 | 1.56 | 2.09 | 0.25 | 0.03 | 0.72 (0.28) | 0.93 (0.07) |
†overestimate due to infiltration of Hg into the preform.
| Compaction pressure | 14 psi | 36 psi | Density (total porosity) | Density (inter-bead porosity) | ||
|---|---|---|---|---|---|---|
| Density | S | Density | S | |||
| 32 MPa | 0.71 ± 0.05 | 0.69 | 0.80 ± 0.01 | 0.77 | 1.11 | 0.62 |
| 39 MPa | 0.41 ± 0.04 | 0.51 | 0.57 ± 0.01 | 0.71 | 0.86 | 0.35 |
| 50 MPa | 0.26 ± 0.04 | 0.39 | 0.45 ± 0.02 | 0.67 | 0.76 | 0.19 |
Acknowledgments
Apichart Jinnapat would like to thank the Royal Thai Air Force for financial support.
References
- Sun, D.; Zhao, Y. Static and dynamic energy absorption of Al foams produced by the sintering and dissolution process. Metal. Mater. Trans. B 2003, 34, 69–74. [Google Scholar]
- Goodall, R.; Despois, J.F.; Marmottant, A.; Salvo, L.; Mortensen, A. The effect of preform processing on replicated aluminium foam structure and mechanical properties. Scripta Mater. 2006, 54, 2069–2073. [Google Scholar]
- Goodall, R.; Marmottant, A.; Salvo, L.; Mortensen, A. Spherical pore replicated microcellular aluminium: Processing and influence on properties. Mater. Sci. Eng. A 2007, 465, 124–135. [Google Scholar]
- Goodall, R.; Mortensen, A. Microcellular aluminium: Child's play. Adv. Eng. Mater. 2007, 9, 951–954. [Google Scholar]
- Bahraini, M.; Weber, L.; Narciso, J.; Mortensen, A. Wetting in infiltration of alumina particle preforms with molten copper. J. Mater. Sci. 2005, 40, 2487–2491. [Google Scholar]
- Molina, J.M.; Rodriguez-Guerrero, A.; Bahraini, M.; Weber, L.; Narciso, J.; Rodriguez-Reinoso, F.; Louis, E.; Mortensen, A. Infiltration of graphite preforms with Al-Si eutectic alloy and mercury. Scripta Materialia 2007, 56, 991–994. [Google Scholar]
- Despois, J.F.; Marmottant, A.; Salvo, L. Mortensen, influence of the infiltration pressure on the structure and properties of replicated aluminium foams. Mater. Sci. Eng. A 2007, 462, 68–75. [Google Scholar]
- Zhao, Y.Y.; Sun, D.X. A novel sintering-dissolution process for manufacturing Al foams. Scripta Mater. 2001, 44, 105–110. [Google Scholar]
- Hao, G.; Han, F.; Li, W. Processing and mechanical properties of magnesium foams. J. Porous Mater. 2009, 16, 251–256. [Google Scholar]
- Keene, B.J. Review of data for the surface tension of pure metals. Int. Mater. Rev. 1993, 38, 157–192. [Google Scholar]
- Jinnapat, A. The Manufacture and Characterisation of Aluminium Foams Made by Investment casting Using Dissolvable Spherical Sodium Chloride Bead Preforms. Ph.D. Thesis, University of Nottingham, Nottingham, UK, September 2011. [Google Scholar]
- Marmottant, A.; Salvo, L.; Martin, C.L.; Mortensen, A. Coordination measurements in compacted NaCl irregular powders using X-ray microtomography. J. Eur. Ceramic Soc. 2008, 28, 2441–2449. [Google Scholar]
- Eustathopoulos, N.; Sobczak, N.; Passerone, A.; Nogi, K. Measurement of contact angle and work of adhesion at high temperature. J. Mater. Sci. 2005, 40, 2271–2280. [Google Scholar]
- Laurent, V.; Chatain, D.; Chatillon, C.; Eustathopoulos, N. Wettability of monocrystalline alumina by aluminium between its melting point and 1273 K. Acta Mater. 1988, 36, 1797–1803. [Google Scholar]
- Zhao, Y.; Han, F.; Fung, T. Optimisation of compaction and liquid-state sintering in sintering and dissolution process for manufacturing Al foams. Mater. Sci. Eng. A 2004, 364, 117–125. [Google Scholar]
- Jinnapat, A.; Kennedy, A.R. The manufacture of spherical salt beads and their use as dissolvable templates for the production of cellular solids via a powder metallurgy route. J. Alloy. Compd. 2010, 499, 43–47. [Google Scholar]
- The VC Series Vacuum Pressure Casting Machines; Indutherm GmbH: Walzbachtal-Wössingen, Germany, 2011. Available online: http://www.indutherm.de/en/products/VC-series_start.php?thisID=178 (accessed on 30 July 2011).
© 2011 by the authors; licensee MDPI, Basel, Switzerland. This article is an open access article distributed under the terms and conditions of the Creative Commons Attribution license (http://creativecommons.org/licenses/by/3.0/).
Share and Cite
Jinnapat, A.; Kennedy, A. The Manufacture and Characterisation of Aluminium Foams Made by Investment Casting Using Dissolvable Spherical Sodium Chloride Bead Preforms. Metals 2011, 1, 49-64. https://doi.org/10.3390/met1010049
Jinnapat A, Kennedy A. The Manufacture and Characterisation of Aluminium Foams Made by Investment Casting Using Dissolvable Spherical Sodium Chloride Bead Preforms. Metals. 2011; 1(1):49-64. https://doi.org/10.3390/met1010049
Chicago/Turabian StyleJinnapat, Apichart, and Andrew Kennedy. 2011. "The Manufacture and Characterisation of Aluminium Foams Made by Investment Casting Using Dissolvable Spherical Sodium Chloride Bead Preforms" Metals 1, no. 1: 49-64. https://doi.org/10.3390/met1010049