Ti-Al Composite Wires with High Specific Strength

 ,
,
Abstract
: An alternative deformation technique was applied to a composite made of titanium and an aluminium alloy in order to achieve severe plastic deformation. This involves accumulative swaging and bundling. Furthermore, it allows uniform deformation of a composite material while producing a wire which can be further used easily. Detailed analysis concerning the control of the deformation process, mesostructural and microstructural features and tensile testing was carried out on the as produced wires. A strong grain refinement to a grain size of 250–500 nm accompanied by a decrease in 〈111〉 fibre texture component and a change from low angle to high angle grain boundary characteristics is observed in the Al alloy. A strong increase in the mechanical properties in terms of ultimate tensile strength ranging from 600 to 930 MPa being equivalent to a specific strength of up to 223 MPa/g/cm3 was achieved.1. Introduction
Ultra-fine grained (ufg) or even nano crystalline (nc) materials have attracted much attention in recent years. Since Gleiter found the properties of nc materials to be much different from those of their coarse grained counterparts [1], many researchers are aiming at (i) contriving possibilities to obtain nc microstructures as well as (ii) investigating the microstructure-properties relationship of these materials. Bottom-up techniques have been established, where materials are assembled by compacting powder or made by electrodeposition (see, e.g., [2–4]). Usually, a nanocrystalline microstructure is obtained showing mean grain sizes in the range of below 100 nm. Top-down techniques have been developed to refine the microstructure of bulk coarse grained materials (see, e.g., [4]). The grain or sub-grain size of these materials is typically within the ultra fine grained regime, ranging from 100 nm to 1 μm. Independent on the path the nc microstructure has been achieved, some mechanical properties of nc materials as yield stress (YS) or ultimate tensile strength (UTS) are still superior to their coarse grained counterparts. The loss in ductility, which usually goes along with increasing YS and UTS by cold working, can in some cases be overcome by setting up a bimodal microstructure [5,6]. Sometimes even superplasticity is observed [7] or ductility is comparable to coarse grained counterparts of nc materials [8].
However, these outstanding properties are at the cost of thermal stability [9] or fatigue life time, as shown for a couple of UFG materials by Höppel et al. [10]. Nevertheless, the advantageous combination of materials properties which is related to the ufg and nc microstructure has stimulated research. In consequence the widespread research on these materials which has been conducted during the past decades [1,6,11,12] yield to an improved understanding of their nature [12,13]. Up to now, nc materials with mean grain sizes well below 100 nm are made from bottom-up processing [11,13,14]. The accompanying size of as-prepared samples is still rather small, but is sufficient for fundamental research providing much of what is known on nc materials today. A major problem with nc materials is the negligible availability of semi-finished products. This, however, is less problematic when the mean grain size is allowed to be within the ufg range. Associated materials can be obtained from well-established top-down processes of severe plastic deformation (SPD). These processes include equal channel angular pressing (ECAP) [15–19], high pressure torsion (HPT) [20,21] and accumulative roll bonding (ARB) [22–25]. Their striking feature is that porosity, contamination as well as limitations of the sample size are avoided as the microstructure of a bulk specimen is refined. The most promising process of SPD to achieve ufg or even nc microstructures within a large scaled semi-finished product is the process of ARB. However, further work needs to be done in order to implement this process into industrial standard. In an earlier work, an alternative technology has been introduced [26]. By its help the aforementioned issue of fabricating semi-finished products can be overcome. In this special case a wire with an entire ufg microstructure is obtained from a composite made of Ti, Al and Nb. This composite is obtained from a process consisting of accumulated swaging and bundling (ASB). Herein a rod from one material is stacked into a tube from another one and cold deformed. At a certain degree of deformation the obtained wire is cut and stacked into another tube. This process can be repeated arbitrarily.
The present work deals with the characterisation of such wires made of Ti and an Al alloy (AA5049). In the case of sheet materials, it has been shown that such a material composition is processable by ARB [27]. Furthermore, a reaction annealing allows the fabrication of a γ-TiAl sheet. In the present study the processing of wires is presented with a more detailed view at mechanical properties and the evolution of the microstructure at larger deformation strains. Composite wires with an ufg microstructure are produced and their microstructure-properties relationship is investigated by means of electron backscatter diffraction (EBSD) analysis and tensile testings.
2. Experimental Procedures
The aforementioned process of accumulated swaging and bundling (ASB) was adopted to obtain a composite material of an entirely ufg microstructure [26]. By this means a wire is formed whose dimensions can be adjusted in a wide range. The latter, however, depends on the facilities that are to hand as well as on the size of the initial composite.
2.1. Wire Processing
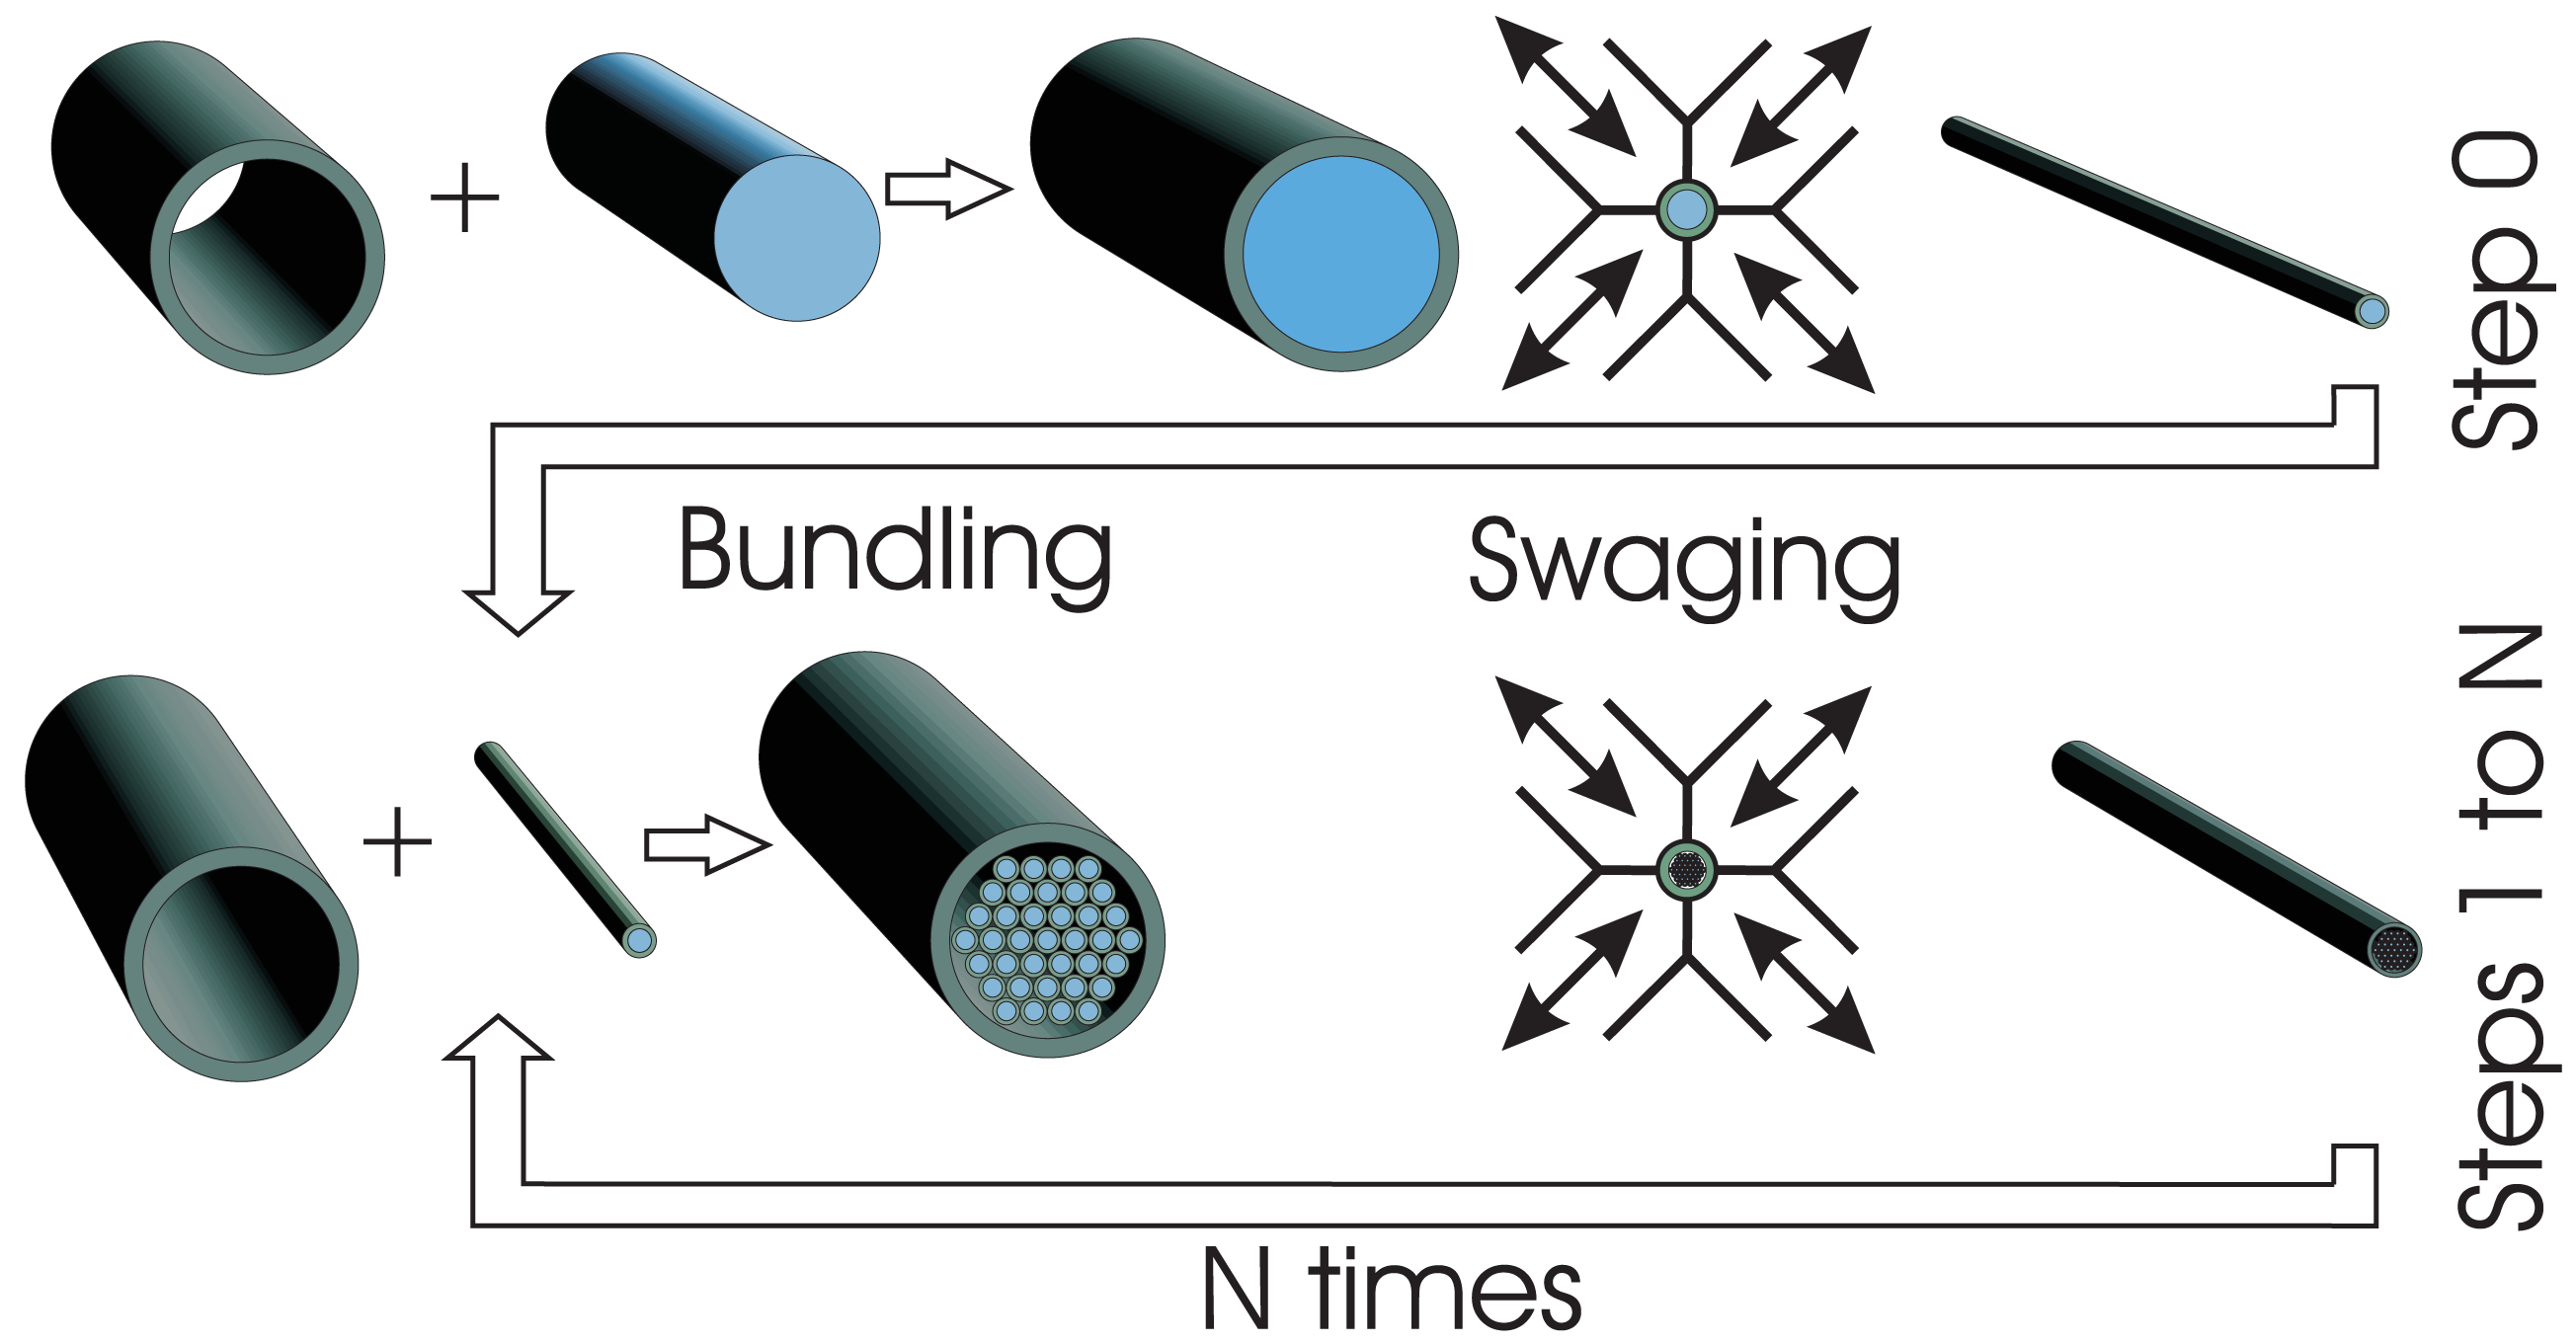
ASB uses accumulative swaging and bundling of a macro composite, similar to the already established drawing and bundling technique [28]. During deformation, a symmetric stress state is present that mainly consists of pressure stress components. Swaging, in contrast to drawing, is accompanied by a more homogeneous stress state within the deformation zone and, thus, deformation is more homogeneously distributed across the whole cross sectional area. This is also a major advantage when dealing with composite materials. Composite materials consist of two (or more) materials with usually different mechanical properties. Therefore, the critical resolved shear stress is also different. Large shear stresses within the deformation zone intensify an inhomogeneous deformation. Under disadvantageous conditions this causes failure during cold work. In contrast, when compressive stresses are dominant within the deformation zone, this materials behaviour can be suppressed to some extent. Figure 1 shows a scheme of the used processing route. Deformation starts on a macro composite which is built from an aluminium AA5049 rod inserted into a titanium tube (grade 1).
For detailed dimensions and compositions please refer to Table 1. The outer and inner surfaces of the Ti tube were etched by a solution containing 75 vol.% water, 23 vol.% HNO3 and 2 vol.% HF. The composite, measuring 24 mm in diameter, is reduced in several passes of 20% reduction in area each to 2.8 mm in diameter by the use of a four jaw swaging machine. Up to this dimensions (step 0) a logarithmic deformation strain of has been applied, where Ai and Af are the initial and final cross sectional areas, respectively. After this step, the swaged wire was cut into 37 pieces. A hexagonal stack was formed from these wires and inserted into another Ti tube of the same dimensions as before. For the reason, of fitting the swaged wires into another Ti tube, the diameter at the end of step 0 was chosen. The Ti tube and the 37 wires were etched. For this purpose the same solution as mentioned before was used. Etching was performed to reduce impurity effects and to clean the surfaces. After stacking these 37 wires into the new tube this composite is again swaged to diameter of 2.8 mm (step 0). In this condition the starting materials has already been deformed up to η = 8.4. It is worth mentioning that the deformation strain after performing step 0 is not simply doubled, since the hexagonal stack does not fill as much of the cross section of the whole composite as the starting AA5049 rod.
This process is theoretically arbitrarily repeatable. However, the present work deals with up to three stacking and bundling cycles. After being re-stacked three times the starting macro composite has been deformed up to η = 16.6.
The same process was also conducted on a composite made from a Ti rod and a Ti tube for reference purposes (both made from Ti grade 1; for detailed information please refer to Table 1).
According to the processing route, specimens are labelled as follows: Ti-Al for composites with the starting composite made from a Ti tube and an Al rod, and Ti-Ti for composites made from a Ti tube and a Ti rod. The adherent number corresponds to the number of re-stacking cycles, i.e., step 0, 1, 2 or 3. The last number refers to the the diameter of the specimen under investigation.
2.2. Metallographic Sample Preparation
For investigations of the microstructure by scanning electron microscopy (SEM), the wires were prepared in cross section by using conventional SiC grinding techniques up to P4000. Afterwards, the samples were polished by utilising a lubricant containing 0.02 μm colloidal silicon oxide particles. To further reduce Beilby- and oxidised layers, argon ion polishing was conducted using low incident beam angles of 3–5°, an acceleration voltage of 4.2 kV and a rotation of the specimen. For that reason, some small grooves can be seen in the SEM pictures. However, they influence neither the picture quality nor the EBSD analyses.
2.3. Mechanical Testing of Wires
The stress-strain response was performed at room temperature on swaged wire pieces. For this purpose, an Instron 8502 tensile testing machine was used in strain controlled mode at a constant strain rate of 3.3 × 10⁻⁴ s−1. Due to the confinement of the components of the composite, testing cannot be performed on standard dog-bone shaped samples. Machining would alter the nature of the samples and, thus, their overall properties. Therefore, testing was performed on as-deformed wires with a total length of 150 mm. The strain response was measured by a mechanical extensometer with a gauge length of 25 mm. Within the present analysis 0.2% plastic strain has been used as the criterion for yield.
2.4. Scanning Electron Microscopy
The microstructure of the samples was investigated on polished specimen. The corresponding cross section of the deformed wire pieces were analysed by means of scanning electron microscopy (SEM). For this purpose a Zeiss Gemini 3500 LEO SEM was utilised operating at 20 and 10 kV mostly in back scattered electron mode (BSE). EBSD analysis with a step size of 20–80 nm was carried out while the SEM was operating at 10 kV acceleration voltage. The demand for high quality EBSD maps even in highly deformed material requiring high indexing rates was fulfilled with a two step indexing procedure. In a first step, four to five Kikuchi bands were used for indexing, at the same time pattern images corresponding to zero solutions (i.e., data points without being indexed under these conditions) were saved. Afterwards, these patterns of usually poor quality were re-analysed using three to four Kikuchi bands for indexing. The indexing rate was improved by this process from 60%–70% to 85%–90%. Orientations that had been misindexed by this procedure were excluded from the maps using a software filter implemented in the HKL CHANNEL5 software. In a final step, these maps were extended using the option: if a zero solution is surrounded by at least five indexed points in a map, this zero solution is regarded as the mean orientation of these 5 points.
3. Results and Discussion
3.1. Mesostructure of the Wires
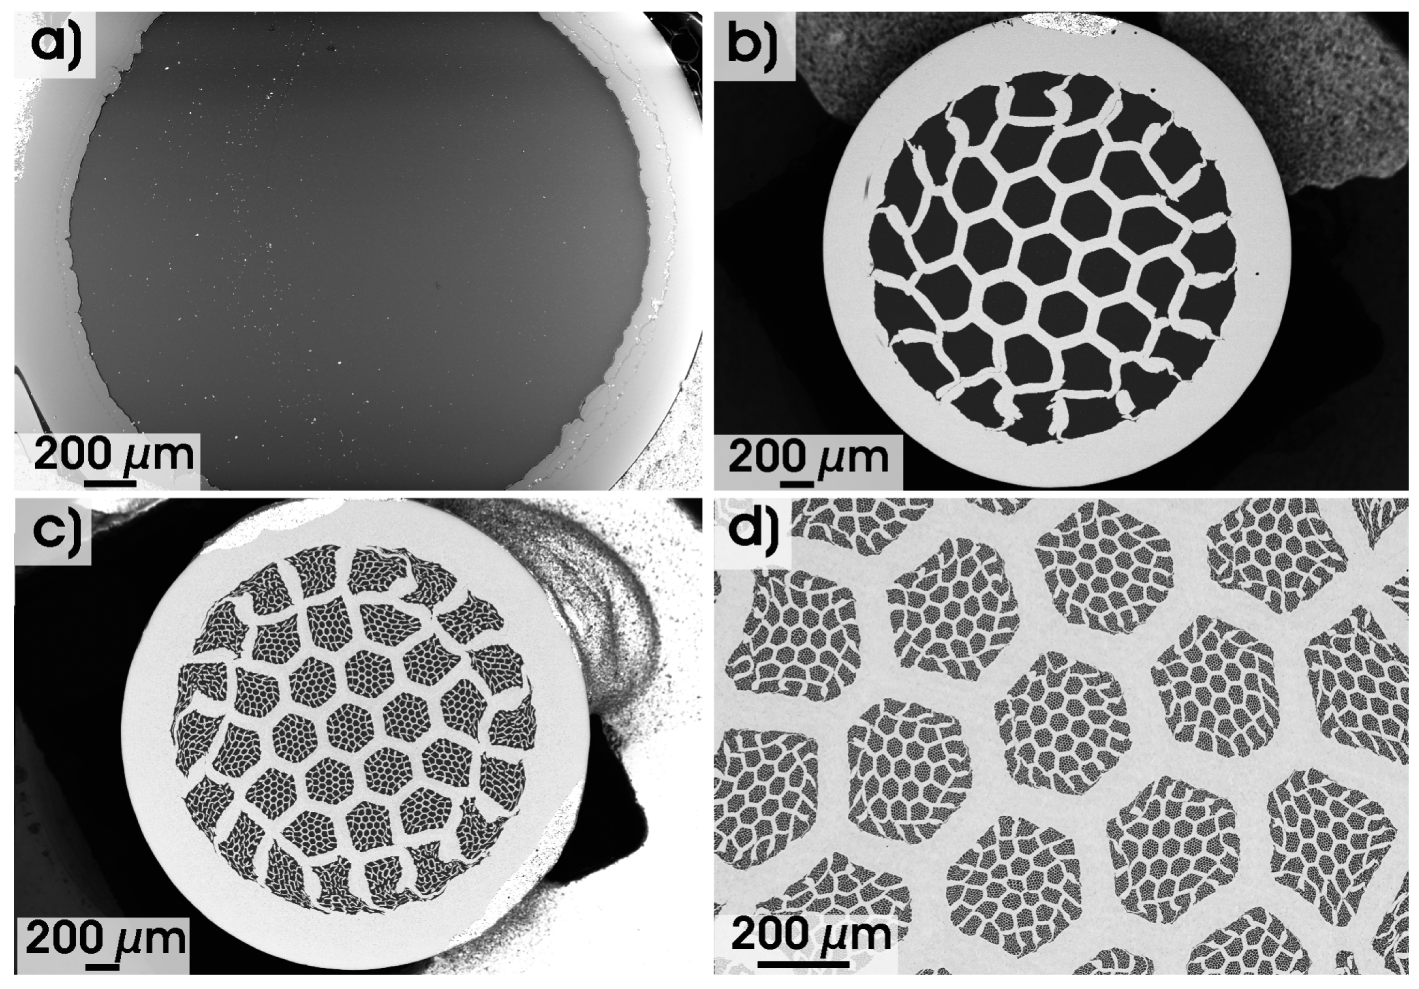
Cross sectional areas of wires made from Ti and AA5049 are shown in Figure 2(a–d) for various deformation stages, i.e., after completing step 0, 1, 2 and 3, respectively. In these conditions the total diameter of the wires is 2.8 mm. The images were taken by SEM in BSE mode. Hence, bright areas in the micrographs image titanium, whereas the dark areas correspond to the aluminium alloy.
After performing step 0, both phases are equally deformed with a slightly wavy phase boundary. This irregular inner surface is regarded as one possible indication for a tough bonding of the two phases. Cold bonding is not directly evident at this stage. No cracks, delaminations or differences in deformation strain of the two phases can be detected. Table 2 shows some general data including the calculated and measured mass densities. The latter one was obtained by the Archimedes principle in C4H9I with a gauge accuracy of 0.1 mg at 25 °C. Table 2 further includes the cross sectional area fraction of the Al phase measured by an area analysis of the wires. The comparison of these calculated and measured values assume that the deformation is homogeneous and equivalent for both phases. Within this analysis it is assumed that there is no porosity left within the composites after swaging. This appears reasonable, since no obvious porosity can be observed from Figure 2.
The measured mass density values are in good agreement with the calculations. The slightly higher measured mass density after performing step 0 is due to the maximum difference in deformation behaviour of the outer and inner part of the composite at this stage of the process. The softer Al phase is subjected to a somewhat higher deformation strain than the harder Ti tube. Therefore, the Ti wall thickness is higher than expected after step 0 (see Table 3) and causes the measured mass density to be higher when compared to the calculated one. The calculated deformation strain for both phases is 4.3 at the end of step 0. However, this does not reflect the experiment. Based on measurements of the width of the Ti tube the deformation strain can be determined. While the outer Ti tube should have a width of 243 μm when the composite has been deformed to a diameter of 2.8 mm (end of step 0, 1, 2 and 3) another value was measured. These values are smaller than the theoretical one as shown in Table 3. Hence, after step 0, the Ti tube was deformed up to η = 4.09, while the Al rod was deformed up to η = 4.39. This difference is much less compared to what could be expected from the strongly different deformation behaviour of the two phases. This deviation is interpreted in terms of the applied deformation technique, i.e., swaging. As mentioned in section 2.1, the stress state during deformation introduced by swaging mainly causes radial and circumferential pressure stress components which are homogeneously distributed within the whole cross section. Although being rather unexpected, this holds for both phases. The softer Al phase—in normal conditions—should flow more easily in the direction of the wire axis than the Ti tube. Due to the encapsulation of the Al in the Ti tube, this does not happen. As long as the Ti tube is deformable, the urge of the Al rod for a stronger material flow in direction of the wire axis consequently leads to an increase in tensile stress of the Ti tube and, therefore, in material flow. Hence, within the composite titanium can be deformed up to higher deformation strains than expected. A proof of this conception can be taken from Figure 2, since the interconnection between Ti and the AA5049 appears rigid and no delaminations or cracks between the phases are observed.
Figure 2(b) shows the mesostructure of a Ti-Al-1-2.8 composite. The hexagonal stacking of the wires as being incorporated at the beginning of step 1 is still intact. However, the wires that were stacked at the very outside are deformed inhomogeneously. In addition, some of them are broken. This would have been expected, since the outer shell of the stacked wires has to compensate the geometrical misfit between the hexagonal shape of the stack and the circular shape of the tube. After performing step 2 (Figure 2(c)), the same features can be identified in the outer region, while the central filaments remain intact and well arranged. Even the filaments that represent the starting macro composite are still visible and deform uniformly. The microstructure of a Ti-Al-3-2.8 composite, as shown in Figure 2(d), contains similar features. However, the filaments that belong to the starting composite can hardly be seen. The diameter corresponding to the area of these hexagons is reduced to 5.3 μm which corresponds to a logarithmic deformation strain of 16.8. This value is in good agreement with the calculated value of 16.6 (compare Table 2 or 3), meaning deformation continues homogeneously up to the very end of the conducted processing route.
It is remarkable that the deformation is homogeneous within both phases, even though the mechanical properties like the YS or UTS and the hardening behaviour are very different. Even if the core of each stack becomes harder for each cycle because of its already well established work hardening, little difference to the calculated values in deformation strain is observed.
3.2. Wire Microstructure
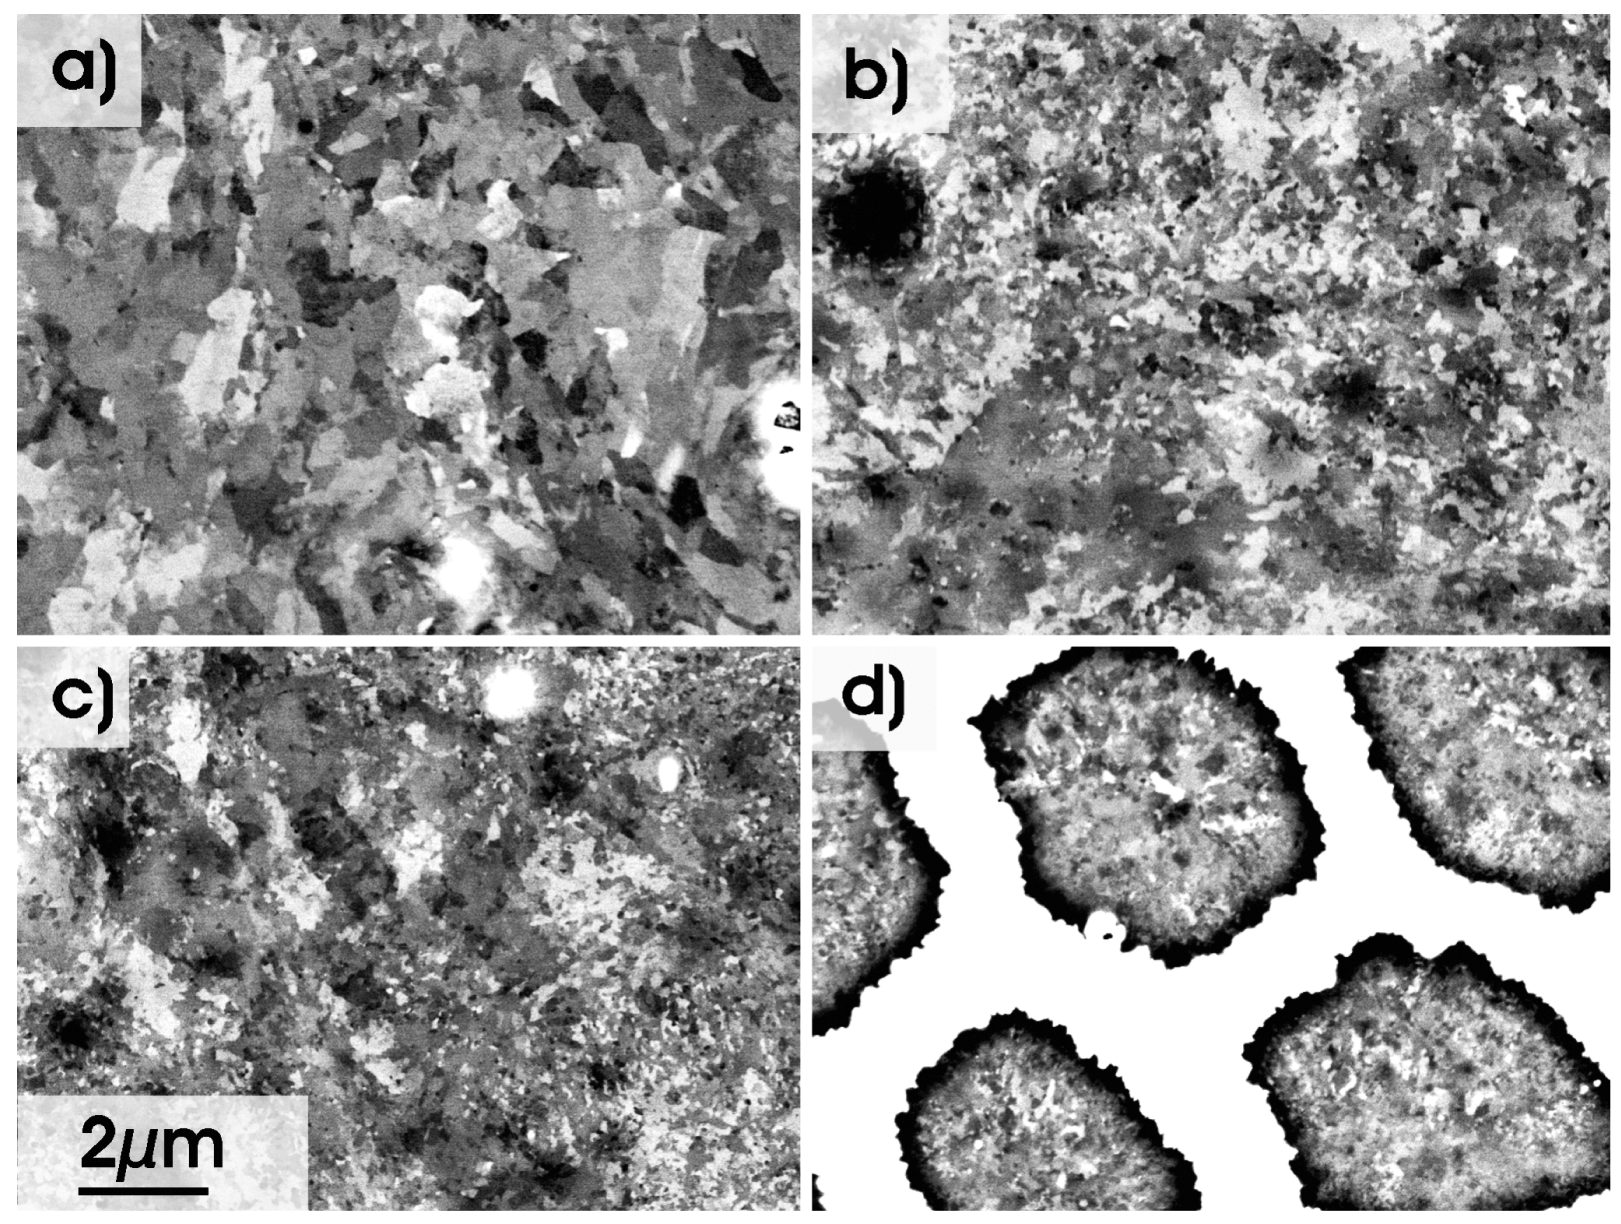
The present analysis is made for the evolution of the microstructure of the Al phase only, whereas a basic analysis of the evolution of the microstructure of the titanium is published elsewhere [26]. A more detailed analysis of the microstructure of Ti by means of EBSD similar to the present investigation of the analysis of the Al alloy is not feasible up to now. This is caused by the metallographic sample preparation which does not allow proper EBSD analysis with a high indexing rate. The microstructure of the AA5049 is shown in Figure 3 for the different processing steps. These images are taken from the centre of the wires in order to exclude influences by local microstructure changes. For example, the grain size is reduced and the grain shape is slightly changed when comparing the central part of a Al filament to the region next to the Al-Ti phase boundary. Superimposed local tangential shear stresses are active in this region during deformation by rotary swaging. This might be another reason for the inhomogeneous deformation of the outer filaments.
Taking this effect into account, the present SEM images show the most coarse microstructure of each wire, since grain fragmentation is stronger in regions being sheared in varying directions and less strong in the centre of the filaments, i.e., with no tangential shear component.
Nevertheless, Figure 3 qualitatively shows strong grain fragmentation in the Al phase with increasing deformation strain. White and overexposed areas (Figure 3(a–c)) show Fe and Mn rich precipitates, respectively, that are not considered further. After step 0, the grain size of AA5049 is in the range of 1–2 μm with grains being equiaxed in cross section. With further cold deformation these grains refine further to a grain size of 0.3–1 μm in Ti-Al-1-2.8 condition (Figure 3(b)). A closer look at the image reveals a grain size distribution of many small grains and a few larger ones. The processes of grain refinement and grain fragmentation go on with further deformation, i.e., Ti-Al-2-2.8 and Ti-Al-3-2.8, respectively (Figure 3(c,d)). However, the scaling of the microstructure still tends to be widely ranged. Larger regions of the same contrast are visible as well as very small grains in the range of 200–300 nm. Figure 3(d) also shows the Ti shells (white regions). The Al filaments are still within their well defined hexagonal structure in Ti-Al-3-2.8 condition. Nevertheless, the Al microstructure is still visible within these shells and the Al grain sizes is reduced to about 300 nm with a finally homogeneous grain size distribution. The shape of the grains within AA5049 is approximately the same in all filaments. The cross section analysis reveals equiaxed grains.
EBSD measurements taken on similar areas as shown in Figure 3 are shown in Figure 4. Due to the low band contrast in this highly deformed material, non-indexed data points within these maps are extrapolated, as described in Section 2.3. This is applicable, since lowest band contrast most likely occurs at grain boundaries [29]. A low band contrast reduces the softwares ability to detect Kikuchi lines in the EBSD pattern, which leads to non-indexed data points. The related non-indexed areas are regarded to belonging to the surrounding indexed areas to equal parts. For extracting a parameter like grain size, this procedure works fine. Grain boundaries are shown in Figure 4 as thin lines (≥3°, <15°) and as bold lines (≥5°).
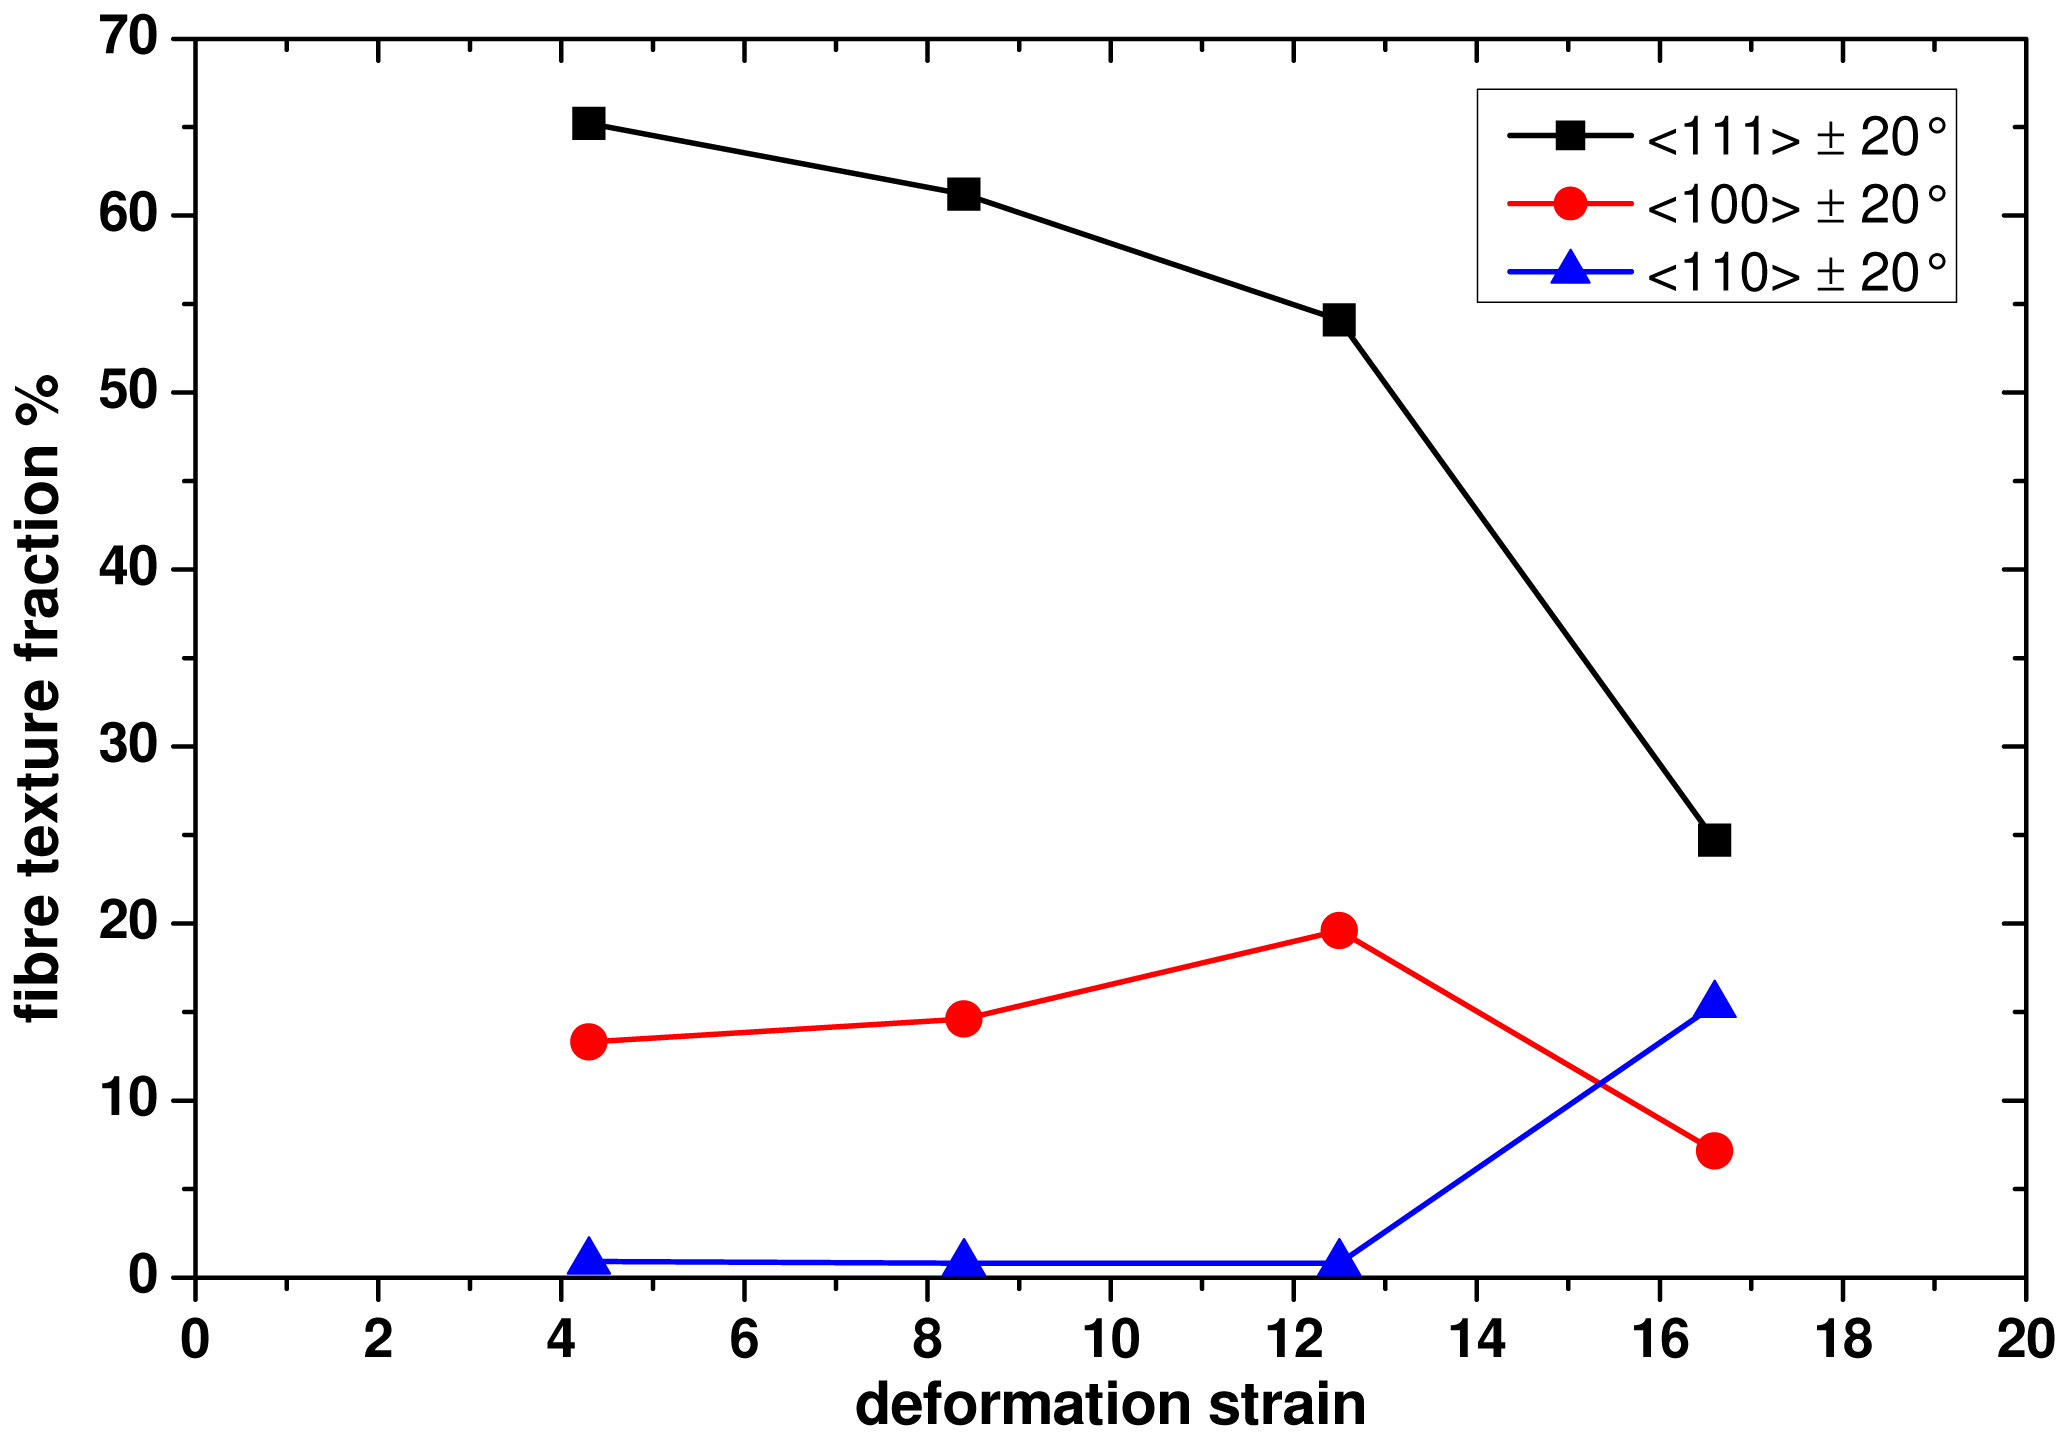
The EBSD measurements show a similar trend as the already discussed BSE SEM images. Therefore, they provide further proof for the assumptions being made for the grain size mentioned before. Interestingly, the original fibre texture of the Al component is changed during deformation according to Figure 5. The texture of the starting material is mainly composed of a mixed 〈111〉 and 〈100〉 fibre texture. This is commonly observed for extruded Al alloys like the presently used starting material. During deformation, the fraction of the 〈111〉 fibre texture component is decreasing. Up to η = 12.4, the fraction of 〈100〉 oriented grains increases at the expense of 〈111〉 oriented grains. Afterwards, both texture components decrease, giving rise to a 〈110〉 fibre texture component. This texture component is usually not observed in bulk fcc metals as a deformation texture, but rather as a texture that arises due to recrystallisation. The latter process, however, can not be found from the SEM micrographs. These 〈110〉 oriented grains can be found in Figure 4(d) (marked in green). This texture component is likely to be found in the region of the Ti-Al phase boundary. The EBSD measurements up to η = 12.4 were taken from the very centre of each filament, far away from this phase boundary. In consequence of the highest applied degree of deformation the filament size decreased dramatically. Mandatorily, the areas next to the Ti-Al phase boundaries are also covered by the present EBSD analysis. Potential 〈110〉 oriented regions are, therefore, not investigated by Figure 4(a–c) and are likely to be underestimated in Figure 5. As already mentioned, there are superimposed shear stresses active near the Ti-Al phase boundary at least during deformation to step 0. These stresses might cause a change of the texture in this region as well. Furthermore, shear stresses in general are regarded as the key determining factor for grain fragmentation [23]. A stronger grain fragmentation can be observed in these regions in Ti-Al-0-2.8 to Ti-Al-2-2.8 condition but is not further discussed here.
For grain size calculations, very small grains (less than 6 data points in the EBSD maps) were excluded. Due to the high dislocation density in the material and the poor band contrast, a defined threshold angle of 3° defining a grain (or small angle grain boundary) can be reached even within the used step size of 50–80 nm. Under these conditions a huge amount of very small grains—usually ranging from 1–5 data points—is detected by the software. However, these grains are unlikely to be real grains and are, therefore, excluded from the analysis.
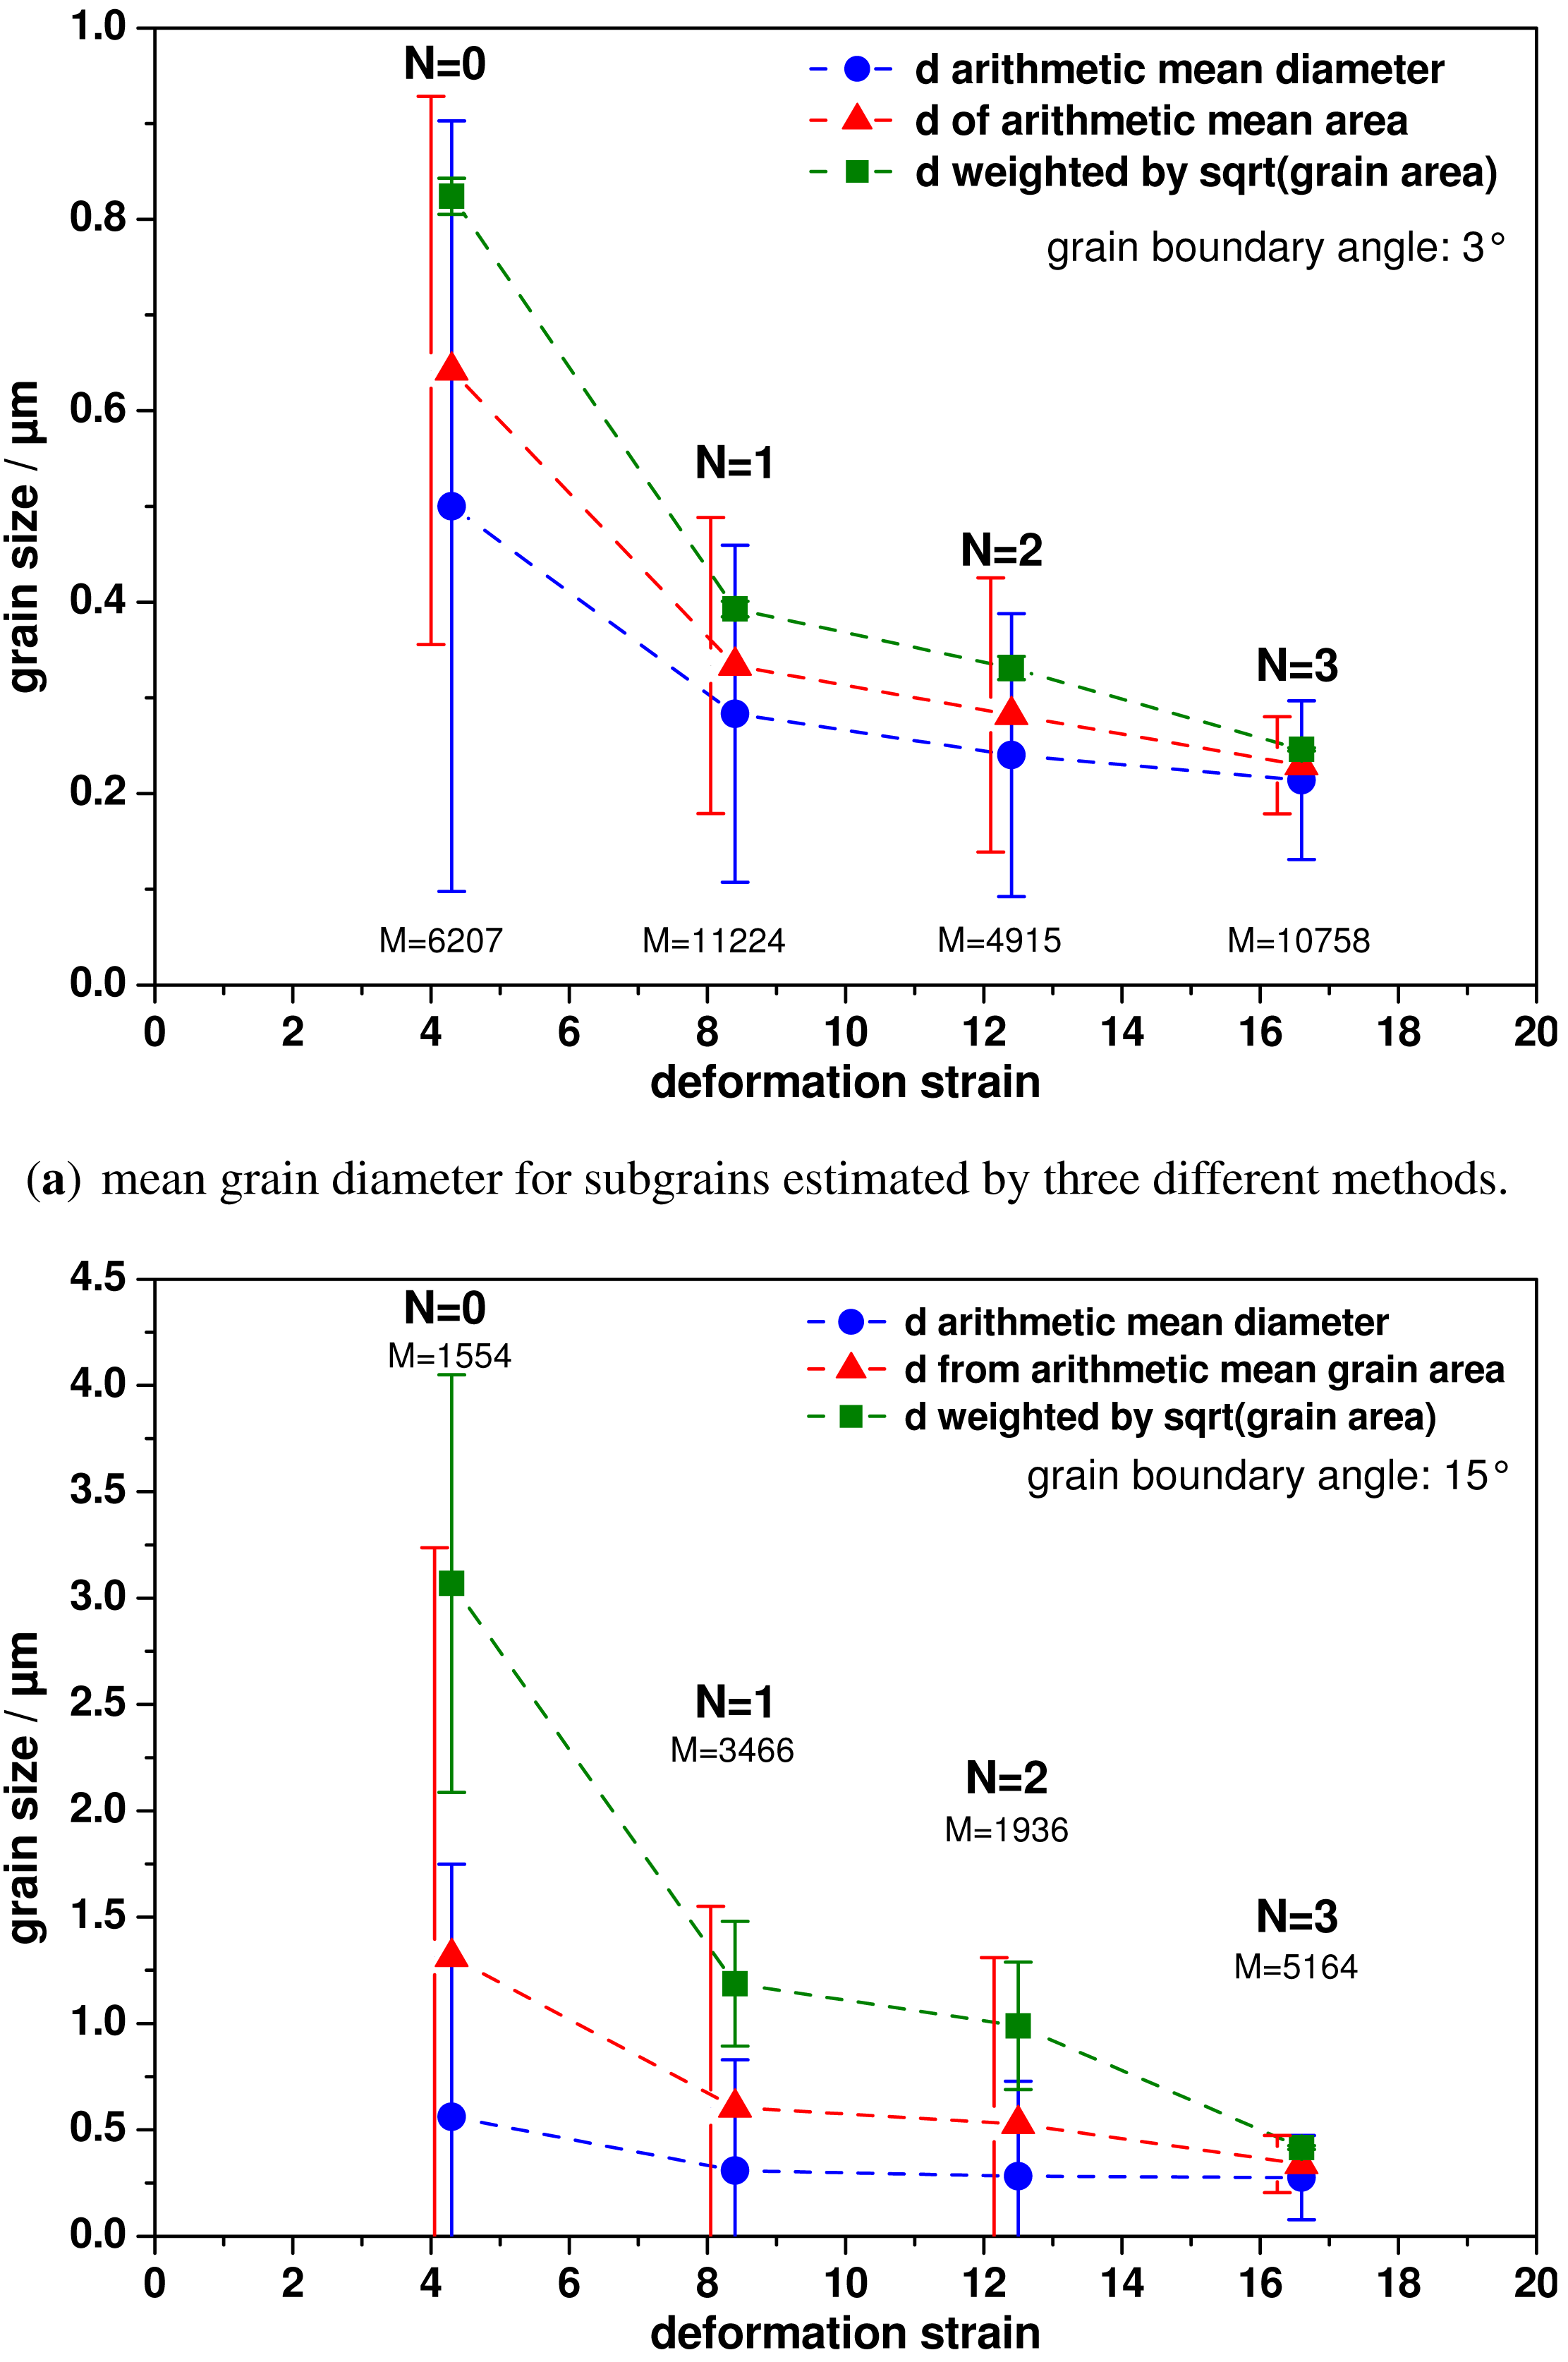
Figure 6 shows the calculated grain sizes for the Al parts of the Ti-Al composites in dependence on the deformation strain. Strong differences are observed when different mathematical procedures were used for determining the grain size. A simple arithmetic mean of the grain size is what the EBSD software delivers. It is useful for Gaussian distributions. This mean value of all grain diameters taken from an EBSD map will, however, strongly overestimate small grains in the present grain size distributions. This can also be seen from the huge error bars in comparison to the absolute value. By weighting grains by the square root of their corresponding grain area, a more realistic grain size is observed for this kind of distribution when comparing these values to the microstructure in Figures 3 and 4. In the following, we will refer to this weighted value when discussing grain sizes (green curve).
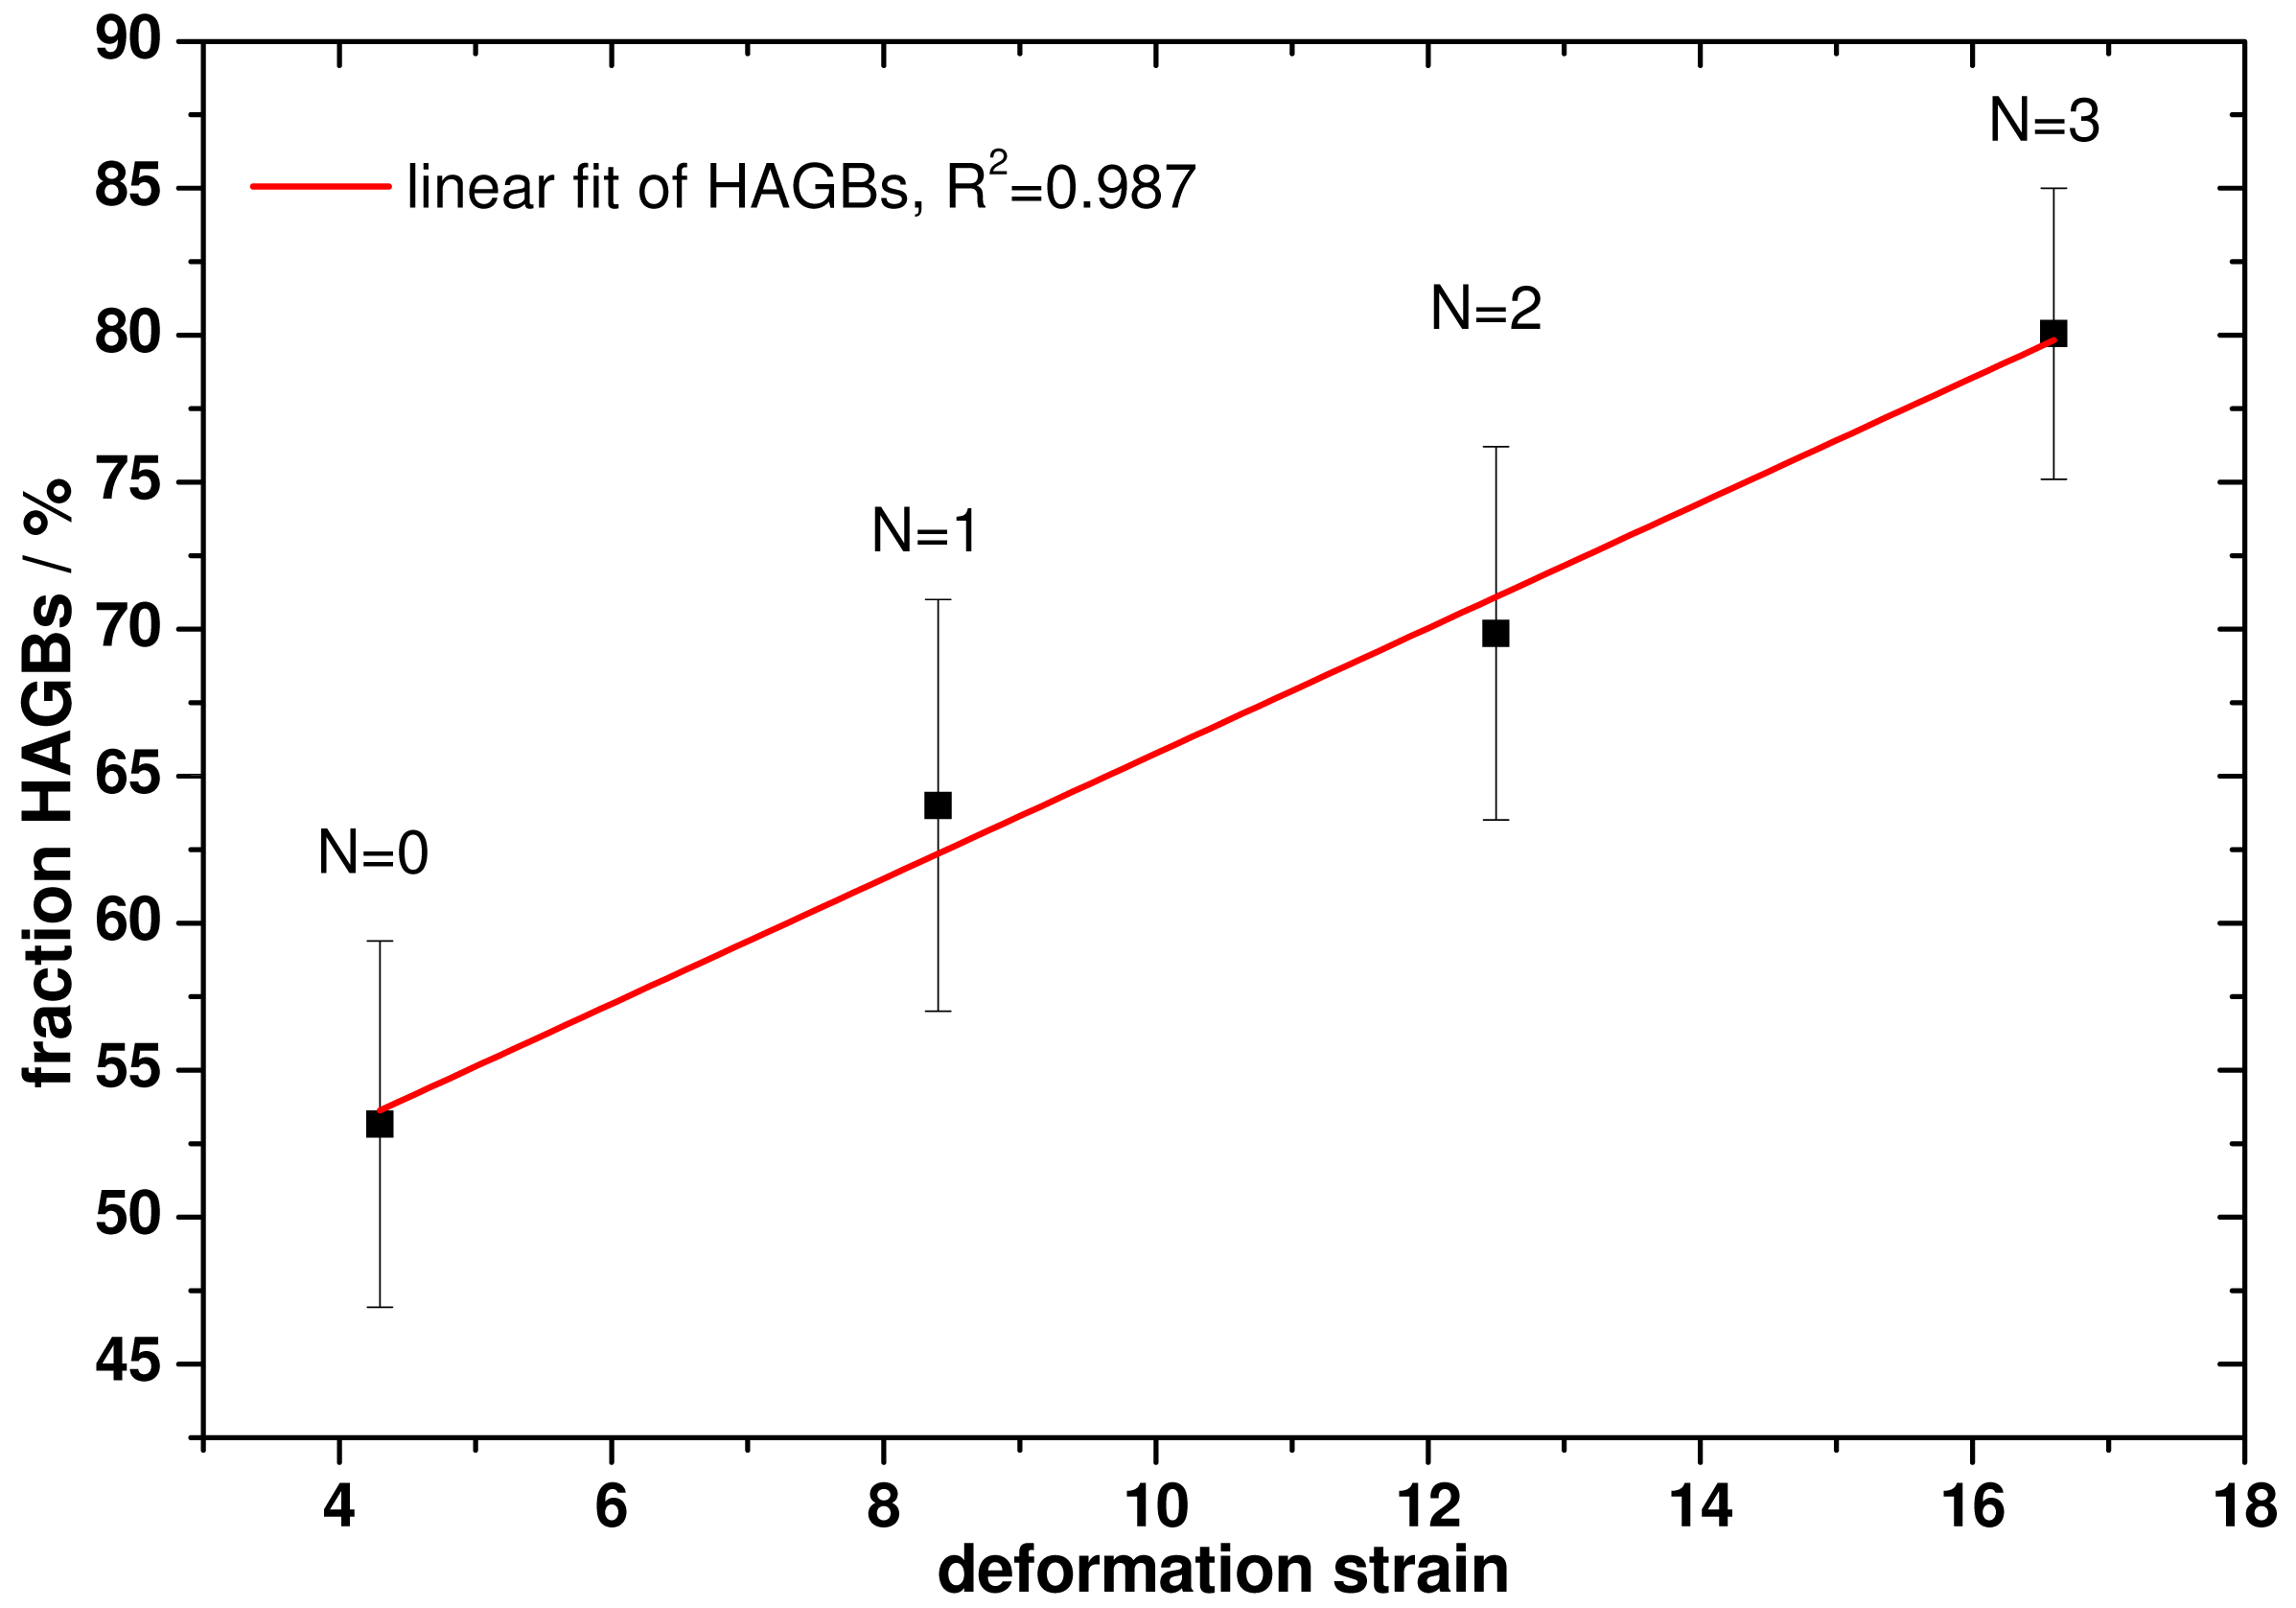
Anyhow, the grain size as determined for the case of high-angle grain boundaries (HAGBs) separating the grains is in the order of 3 μm for the Ti-Al-0-2.8 condition. With further increasing deformation strain, this value decreases as shown in Figure 6(b). In parallel the variation of the grain size as a function of the deformation strain is shown for the valuation of grains being separated by low-angle grain boundaries (LAGBs) in Figure 6(a). The corresponding size of the subgrains amounts to 830 nm for the Ti-Al-0-2.8 condition. These subgrains show a more uniform distribution, which is seen from the smaller error bars in Figure 6(a). For high deformation strains (η = 12.4 and 16.6) former subgrains seem to be transformed into HAGBs due to the ongoing deformation. This is further emphasised by the mean grain size for grains with HAGBs being about 400 nm, while grains being separated by LAGBs are in the order of 240 nm. Although further deformation was not applied, the grain size seems to saturate in the order of 200–400 nm as grain sizes being defined upon HAGBs or LAGBs are converging at the same value. Further grain fragmentation would not be the case. Since grain fragmentation is discussed in literature as a process induced by dislocation motion and tangling, dislocations might not be able to move anymore due a high dislocation density within the subgrains. Further evidence of this conception, namely that grain fragmentation takes place unless LAGBs vanish from the microstructure, is seen from the amount of LAGBs and HAGBs as a function of the deformation strain. Figure 7 shows this dependence for the HAGBs. Within the investigated deformation range, the fraction of HAGBs increases almost linearly up to a fraction of 75% for the Ti-Al-3-2.8 condition.
An almost linear correlation between the fraction of HAGBs and deformation strain was also found by Chen et al. [30] for a similar Al alloy. This correlation proves that LAGBs belonging to subgrains at low deformation strains are continuously transformed to HAGBs during further deformation since their fraction is continuously increasing. The results are in good agreement with the grain size dependencies for low and high angle grain boundaries shown in Figure 6. With increasing amount of HAGBs, the difference between the grain size for subgrains (Figure 6(a)) and grains (Figure 6(b)) is diminishing. As already mentioned this comes along with subgrains divided by LAGBs gradually transform into grains divided by HAGBs. As discussed in detail by Hansen [31], LAGBs contribute to hardening in a different way than HAGBs do. Hall-Petch like contributions to hardening were found for both types of boundaries, but with a different slope. This slope is dependent on the spacing of the according microstructural features. Furthermore, the hardening by LAGBs has been proposed to be proportional to the square root of their mean misorientation . By straining a material to medium and high strains, not only spacings between LAGBs and HAGBs are changed but also their mean misorientation angles alters (as shown indirectly in Figure 7). As both parameters as well as the dislocation density vary simultaneously, a simple Hall-Petch relationship can not be applied. To overcome this issue, a detailed characterisation of the microstructure would be required. However, the effects mentioned before as well as their synergetic effects are not fully understood. It has been shown [32,33] that the yield stress of highly deformed Al alloys can be calculated by using the extended Hall-Petch model introduced by Hansen. This model includes the texture, the dislocation density as well as the grain and subgrain size. The data that is required for modelling according to the mentioned model can be determined by high resolution EBSD measurements to a certain degree. It turns out that the model seems to be well suitable for highly deformed materials. In the present study a composite material has been investigated. This makes the prediction of yield strength even more complicated, since comparable EBSD data is required for both phases. Unfortunately, Ti deformed to a high strain at room temperature is hard to investigate by EBSD [34,35].
Furthermore it should not be neglected that cutting off the smallest grains in the distribution with less than 6 data points in the EBSD maps (with a step size of 50 nm; this value corresponds to a grain diameter of 136 nm) could also be the origin of the limitations observed (Figure 6). More reliable EBSD data is required to overcome this issue, which requires improved detectors, spatial resolution and surface quality as well as less surface oxidation. One has to take into account that in terms of spatial resolution, the physical limit for the EBSD method has already been approached while measuring with step sizes in the range of 50 nm and below [29,36].
Although a quantitative evaluation of the strength upon the mentioned microstructural features is not yet feasible, the introduced process of accumulative swaging and bundling can be adopted to significantly enhance the mechanical properties.
3.3. Mechanical Properties
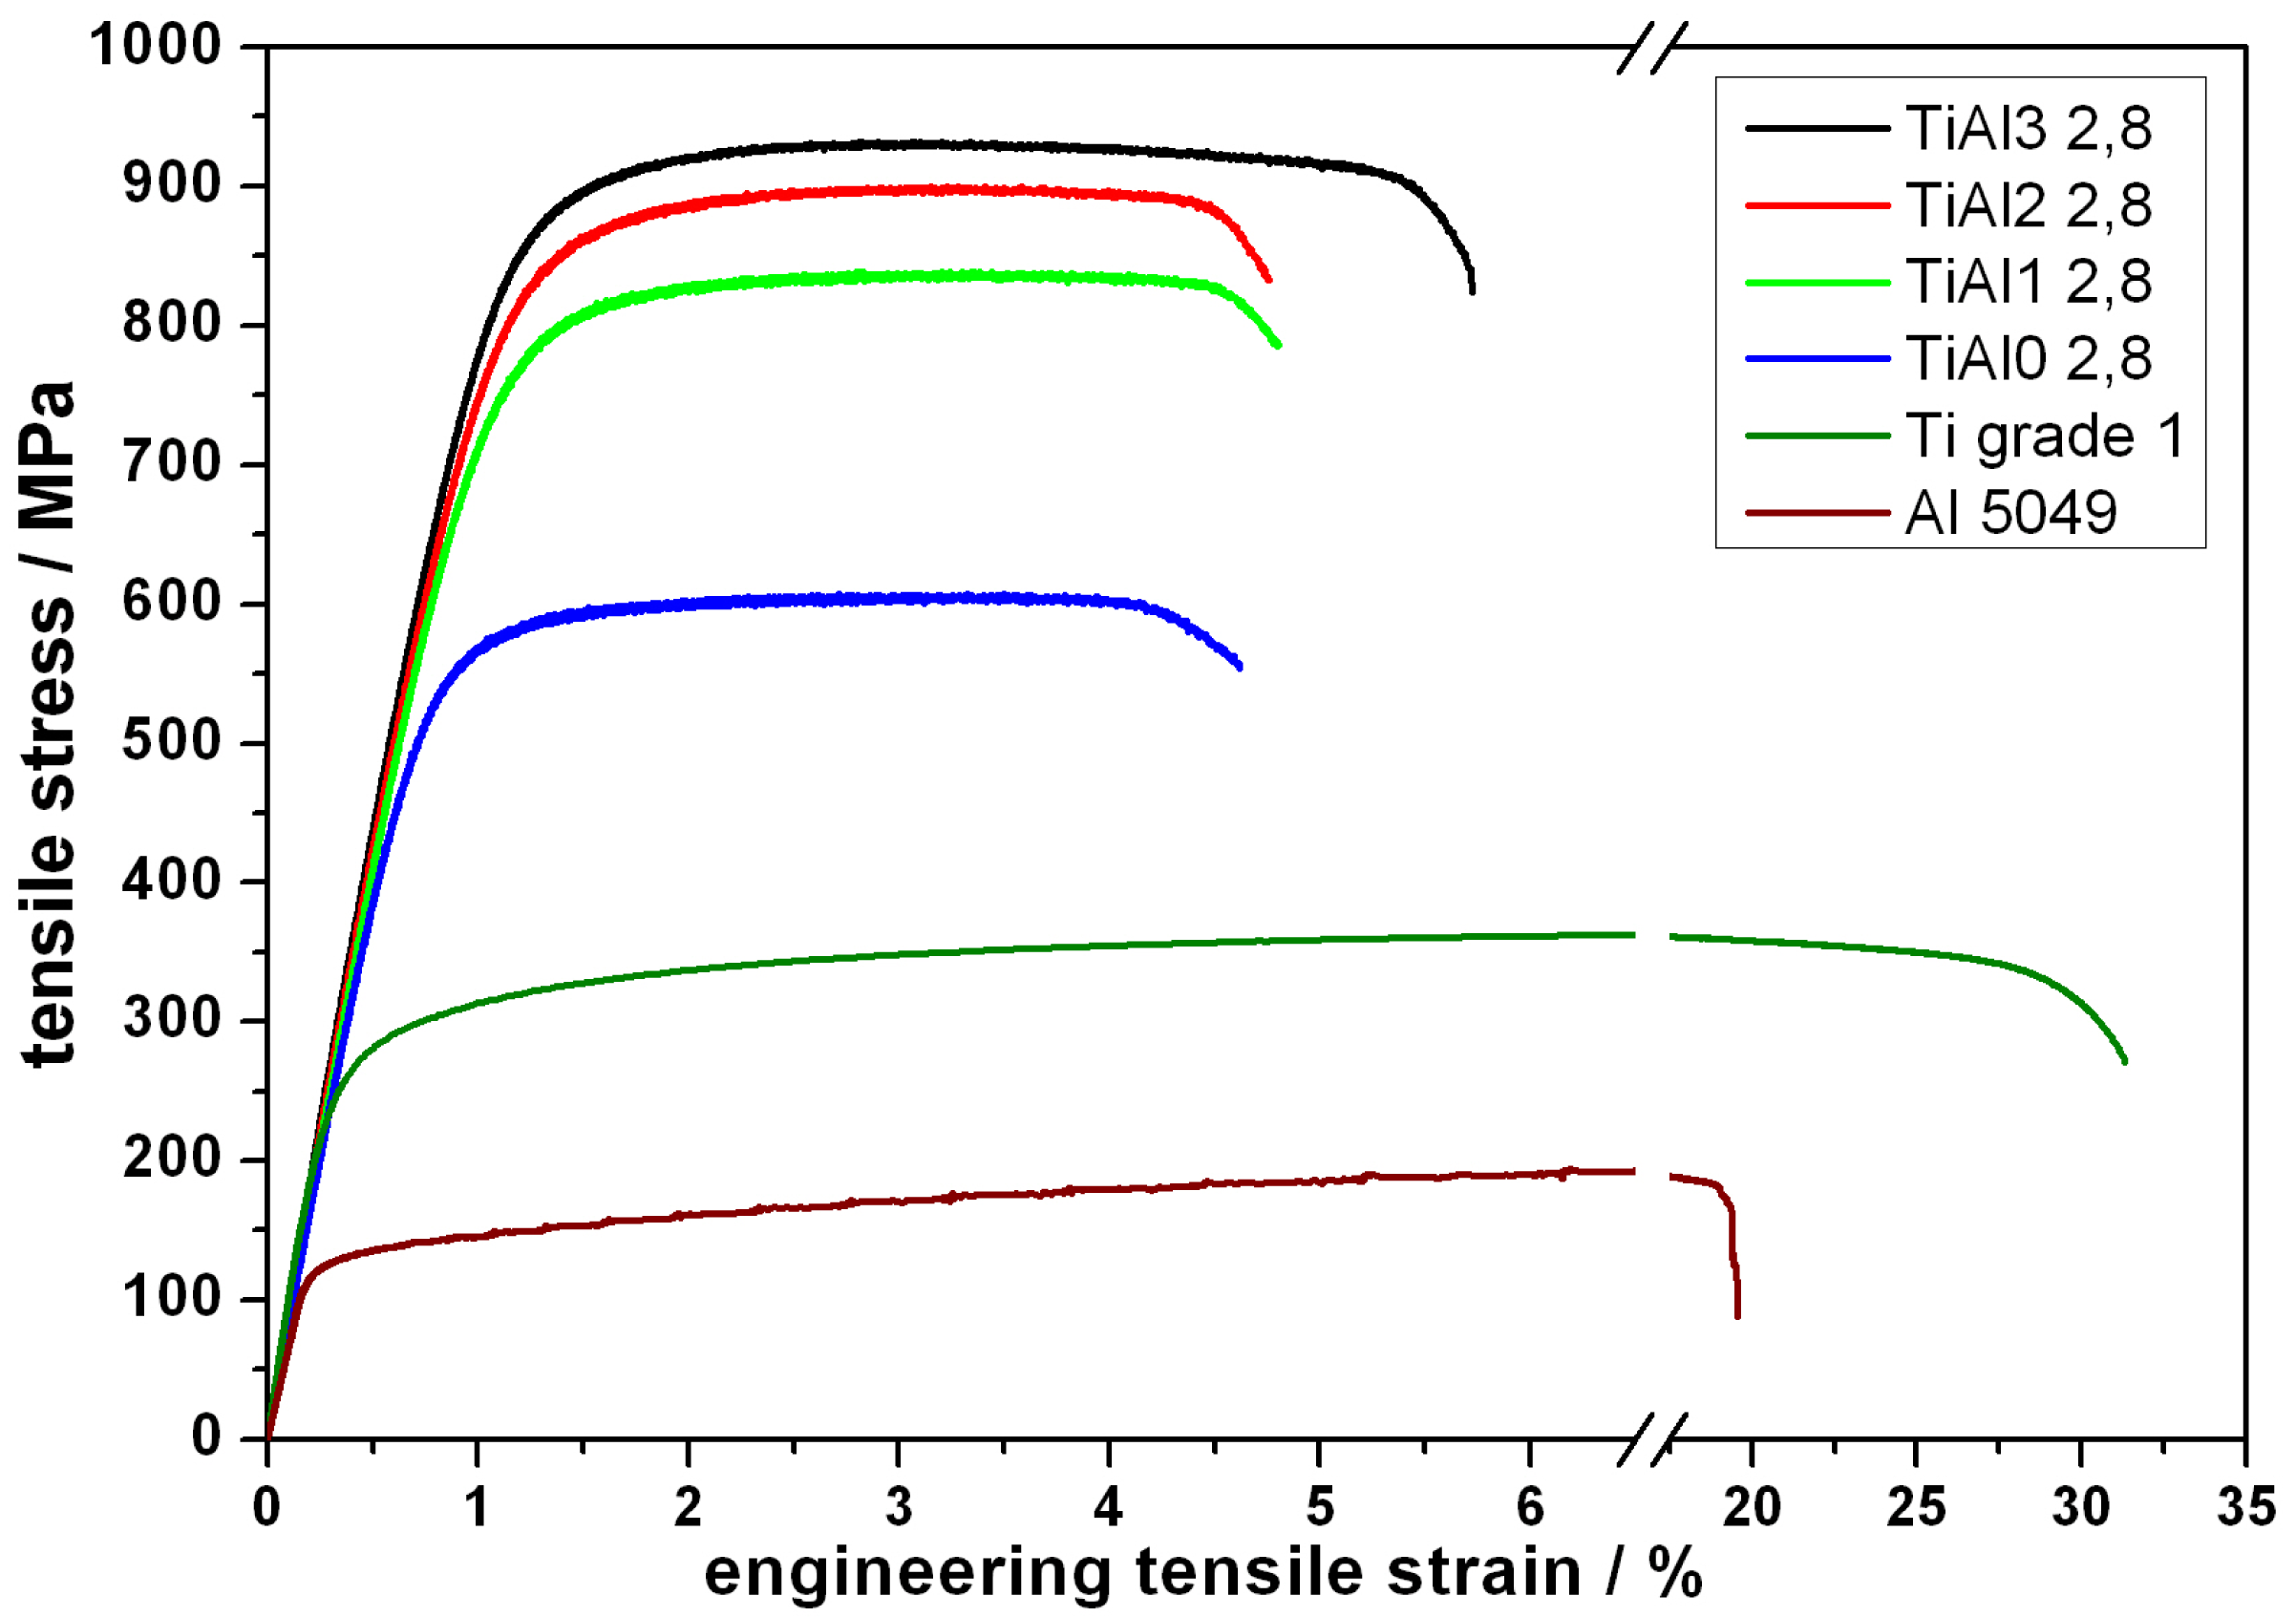
The stress-strain response of the as deformed Ti-Al composites at various degrees of deformation as well as the response of the individual Ti and AA5049 materials in the as delivered condition is shown in Figure 8.
A common behaviour is observed in the case of the Ti and AA5049 materials, i.e., an UTS level of 200 MPa for AA5049 and 366 MPa in the case of Ti as well as an uniform elongation in the range of 10% (see Table 4). The composite in the Ti-Al-0-2.8 condition shows a much higher UTS and YS, respectively. This is quite obvious for several reasons. First of all, strength increases unavoidably with cold work. As the composite in Ti-Al-0-2.8 condition has been deformed up to η = 4.3 work hardening strengthens the composite by (i) generation of dislocations; and (ii) grain refinement. The latter has been shown before and is accompanied by a change from LAGB to HAGB character.
With ongoing deformation, the ultimate tensile strength of the composite wires increases from 607 MPa to 933 MPa. Yield stress also increases from 543 MPa to 806 MPa. The deformation to steps 1 to 3 causes a further increase in strength. This, however, is less pronounced with increasing η. In addition to work hardening, grain refinement and the change from LAGBs to HAGBs as discussed before the texture is more pronounced with increasing deformation strain [26]. Due to the stacking of a 37 pieces bundle into an undeformed Ti tube, further interfaces are incorporated into the composites. Hence, with increasing N phase boundary strengthening also contributes to the total strength.
According to Figure 8 and Table 4, UTS and YS increase by a factor of 2 to 3 compared to the starting materials by applying the accumulative swaging and bundling technique. The uniform elongation is decreased by deformation but remains at a constant level in the range of 2%.
The outer titanium tube, which is introduced by each stacking cycle is deformed up to the same deformation strain for each step. As this is similar for any of the Ti-Al composites at the end of the individual steps, plastic behaviour (especially the uniform elongation) of the composite might be dominated by the Ti shell. However, there is no sound explanation for this correlation.
In contrast to this, the elastic behaviour of the composite strictly depends on its composition. With increasing N the volume fraction of Ti increases and so does the Young's modulus (E). Due to the dependencies of UTS, YS and E it can be concluded that the whole composite including any individual embedded filament or tube is loaded during tensile testing.
The volume fraction of Ti also has a strong influence on the density of the composite. Therefore, it is quite conclusive to draw specific strength of the composite. This has been done in dependence of the deformation strain, as shown in Figure 9.
It can be seen that the Ti-Al wires are superior to Ti-Ti wires that have identically been deformed.
An expected explanation of these findings would be a more pronounced altering in the microstructure of the AA5049 in comparison to Ti. This would mean, e.g., a lower grain size at which a transition from a LAGB to a HAGB dominated microstructure appears and, in consequence, a larger contribution to the total strength. However, this remains speculatively unless the microstructure would have been investigated on a smaller scale which involves, e.g., (high resolution) transmission electron microscopy.
Finally, the establishment of a model compatible description of the mechanical properties of such a composite materials remains a challenging task for the future. Based on the model proposed by Hansen [31] a prediction of the YS of a composite should be feasible if the YS of each phase can be predicted upon microstructural findings and if the interaction between the two phases, i.e., Ti and AA5049, will have been understood.
4. Conclusions
A novel process of severe plastic deformation, i.e., accumulative swaging and bundling, was utilised to bound a composite made from grade 1 Ti and the Al alloy 5049. This process also allows also a homogeneous formation of the constituents and its completion causes a refinement of the microstructure into the ufg range. After a logarithmic deformation strain of η = 16.6 being applied, high values for the specific mechanical properties were observed. These are dominated by work hardening but also by grain fragmentation and the transformation of LAGBs into HAGBs which finally approach a concerted value. In addition the texture, this shows a lowering 〈111〉 component during deformation also causes an enhancement of the tensile strength of the as deformed wires. A specific strength of 220 MPa/g/cm3 makes the Ti-Al composites suitable for industrial applications, especially since it has been processed into a semi-finished product in the shape of a wire.


| Ti grade 1 tube | Ti grade 1 rod | AA5049 | |
|---|---|---|---|
| outer diameter/mm | 24.0 | 19.8 | 19.5 |
| inner diameter/mm | 20.0 | - | - |
| length/mm | 400 | 300 | 300 |
| alloying elements/w.% | none | none | Mg: 2, Mn: 0.8, Fe: 0.2, Si: 0.1 |
| impurities/weight ppm | Fe: 283, O: 688, C: 174, N: 122, H: 142 | Fe: 330, O: 900, C: 100, N: 180, H: 10 | |
| residual | Ti | Ti | Al |
| specimen | η | calc. density in g/cm3 | meas. density in g/cm3 | Al-fraction in cross section in % | ||
|---|---|---|---|---|---|---|
| calc. | meas. by area | meas. by density | ||||
| Ti-Al-0-2.8 | 4.3 | 3.27 | 3.32 | 68.4 | 62.5 | 65.9 |
| Ti-Al-1-2.8 | 8.4 | 3.74 | 3.77 | 42.6 | 40.3 | 40.7 |
| Ti-Al-2-2.8 | 12.5 | 4.03 | 4.05 | 26.5 | 25.4 | 25.0 |
| Ti-Al-3-2.8 | 16.6 | 4.21 | 4.22 | 16.5 | 13.1 | 15.5 |
| specimen | η | tube thickness in μm | theor. thickness in μm |
|---|---|---|---|
| Ti-Al-0-2.8 | 4.3 | 308 ± 17 | 243 |
| Ti-Al-1-2.8 | 8.4 | 297 ± 42 | |
| Ti-Al-2-2.8 | 12.5 | 296 ± 20 | |
| Ti-Al-3-2.8 | 16.6 | 283 ± 24 |
| specimen | η | E | YS | UTS | ∊u | Al vol. fraction |
|---|---|---|---|---|---|---|
| 1 | GPa | MPa | MPa | % | % | |
| Ti grade 1 | 0 | 108 | 276 | 366 | 10.4 | 0 |
| AA5049 | 0 | 65 | 135 | 200 | 9.7 | 100 |
| Ti-Al-0-2.8 | 4.3 | 85 ± 2.6 | 544 | 608 | 2.2 | 65.9 |
| Ti-Al-1-2.8 | 8.4 | 86 ± 2.2 | 729 | 841 | 2.1 | 40.7 |
| Ti-Al-2-2.8 | 12.5 | 89 ± 0.9 | 773 | 900 | 2.2 | 25.0 |
| Ti-Al-3-2.8 | 16.6 | 93 ± 2.0 | 807 | 934 | 2.1 | 15.5 |
Acknowledgments
Experimental support from M. Frey and T. Wolf is gratefully acknowledged. This work has been supported by the European Union and the Free State of Saxonia in the framework of the European Centre for Emerging Materials and Processes (ECEMP), contract no. 13795/2379.
References
- Gleiter, H. Nanocrystalline materials. Prog. Mater. Sci. 1989, 33, 223–315. [Google Scholar]
- Koch, C.C.; Youssef, K.M.; Scattergood, R.O. Mechanical properties of nanocrystalline materials produced by in situ consolidation ball milling. Mater. Sci. Forum 2008, 579, 15–28. [Google Scholar]
- Thiele, E.; Klemm, R.; Hollang, L.; Holste, C.; Schell, N.; Natter, H.; Hempelmann, R. An approach to cyclic plasticity and deformation-induced structure changes of electrodeposited nickel. Mater. Sci. Eng. A 2005, 390, 42–51. [Google Scholar]
- Koch, C.C. Bulk Nanostructured Materials; Zehetbauer, M.J., Zhu, Y.T., Eds.; WILEY-VCH: Weinheim, Germany, 2009. [Google Scholar]
- Wang, Y.; Chen, M.; Zhou, F.; Ma, E. High tensile ductility in a nanostructured metal. Nature 2002, 419, 912–915. [Google Scholar]
- Valiev, R. Nanostructuring of metals by severe plastic deformation for advanced properties. Nature Mater. 2004, 3, 511–516. [Google Scholar]
- Mayo, M. High and low temperature superplasticity in nanocrystalline materials. Nanostruct. Mater. 1997, 9, 717–726. [Google Scholar]
- Karimpoor, A.; Erb, U.; Aust, K.; Palumbo, G. High strength nanocrystalline cobalt with high tensile ductility. Scr. Mater. 2003, 49, 651–656. [Google Scholar]
- Gubicza, J.; Dobatkin, S.; Khosravi, E.; Kuznetsov, A.; Lbr, J. Microstructural stability of Cu processed by different routes of severe plastic deformation. Mater. Sci. Eng. A 2011, 528, 1828–1832. [Google Scholar]
- Hoeppel, H.; Kautz, M.; Xu, C.; Murashkin, M.; Langdon, T.; Valiev, R.; Mughrabi, H. An overview: Fatigue behaviour of ultrafine-grained metals and alloys. Int. J. Fatigue 2006, 28, 1001–1010. [Google Scholar]
- Zhou, F.; Liao, X.; Zhu, Y.; Dallek, S.; Lavernia, E. Microstructural evolution during recovery and recrystallization of a nanocrystalline Al-Mg alloy prepared by cryogenic ball milling. Acta Mater. 2003, 51, 2777–2791. [Google Scholar]
- Meyers, M.; Mishra, A.; Benson, D. Mechanical properties of nanocrystalline materials. Prog. Mater. Sci. 2006, 51, 427–556. [Google Scholar]
- Suryanarayana, C. Mechanical alloying and milling. Prog. Mater. Sci. 2001, 46, 1–184. [Google Scholar]
- Youssef, K.; Scattergood, R.; Murty, K.; Koch, C. Nanocrystalline Al-Mg alloy with ultrahigh strength and good ductility. Scr. Mater. 2006, 54, 251–256. [Google Scholar]
- Valiev, R.; Islamgaliev, R.; Alexandrov, I. Bulk nanostructured materials from severe plastic deformation. Prog. Mater. Sci. 2000, 45, 103–189. [Google Scholar]
- Langdon, T.G. The principles of grain refinement in equal-channel angular pressing. Mater. Sci. Eng. A 2007, 462, 3–11. [Google Scholar]
- Hockauf, M.; Meyer, L.W.; Nickel, D.; Alisch, G.; Lampke, T.; Wielage, B.; Krueger, L. Mechanical properties and corrosion behaviour of ultrafine-grained AA6082 produced by equal-channel angular pressing. In J. Mater. Sci., Proceedings of 5th International Symposium on Ultrafine-Grained Materials, New Orleans, LA, USA, 9–13 March 2008; 2008; 43, pp. 7409–7417. [Google Scholar]
- Frint, P.; Hockauf, M.; Dietrich, D.; Halle, T.; Wagner, M.F.X.; Lampke, T. Influence of strain gradients on the grain refinement during industrial scale ECAP. Materialwiss. Werkst. 2011, 42, 680–685. [Google Scholar]
- Zhu, Y.; Huang, J.; Gubicza, J.; Ungar, T.; Wang, Y.; Ma, E.; Valiev, R.Z. Nanostructures in Ti processed by severe plastic deformation. J. Mater. Res. 2003, 18, 1908–1917. [Google Scholar]
- Vorhauer, A.; Pippan, R. On the homogeneity of deformation by high pressure torsion. Scr. Mater. 2004, 51, 921–925. [Google Scholar]
- Zehetbauer, M.; Kohout, J.; Schafler, E.; Sachslehner, F.; Dubravina, A. Plastic deformation of nickel under high hydrostatic pressure. J. Alloy. Compd. 2004, 378, 329–334. [Google Scholar]
- Saito, Y.; Tsuji, N.; Utsunomiya, H.; Sakai, T.; Hong, R.G. Ultra-fine grained bulk aluminum produced by accumulative roll-bonding (ARB) process. Scr. Mater. 1998, 39, 1221–1227. [Google Scholar]
- Watanabe, H.; Mukai, T.; Ishikawa, K. Differential speed rolling of an AZ31 magnesium alloy and the resulting mechanical properties. J. Mater. Sci. 2004, 39, 1477–1480. [Google Scholar]
- Hausoel, T.; Hoeppel, H.W.; Goeken, M. Microstructure and Mechanical Properties of Accumulative Roll Bonded Aluminium Alloy AA5754, Proceedings of 15th International Conference on the Strength of Materials (ICSMA 15), Dresden, Germany, 16–21 August 2009; Skrotzki, W., Oertel, C., Biermann, H., Heilmaier, M., Eds.; IOP Publishing: Bristol, UK, 2010; 20.
- Scharnweber, J.; Skrotzki, W.; Oertel, C.G.; Brokmeier, H.G.; Hoeppel, H.; Topic, I.; Jaschinski, J. Texture, microstructure, mechanical properties of ultrafine-grained Aluminum produced by accumulative roll bonding. Adv Eng. Mater. 2010, 12, 989–994. [Google Scholar]
- Marr, T.; Freudenberger, J.; Kauffmann, A.; Scharnweber, J.; Oertel, C.G.; Skrotzki, W.; Siegel, U.; Kuehn, U.; Eckert, J.; Martin, U.; Schultz, L. Damascene light-weight metals. Adv. Eng. Mater. 2010, 12, 1191–1197. [Google Scholar]
- Luo, J.G.; Acoff, V.L. Using cold roll bonding and annealing to process Ti/Al multi-layered composites from elemental foils. Mater. Sci. Eng. A 2004, 379, 164–172. [Google Scholar]
- Levi, F.P. Permanent magnets obtained by drawing compacts of parallel iron wires. J. Appl. Phys. 1960, 31, 1469–1471. [Google Scholar]
- Humphreys, F.J. Review grain and subgrain characterisation by electron backscatter diffraction. J. Mater. Sci. 2001, 36, 3833–3854. [Google Scholar]
- Chen, Y.; Roven, H.; Gireesh, S.; Skaret, P.; Hjelen, J. Quantitative study of grain refinement in Al-Mg alloy processed by equal channel angular pressing at cryogenic temperature. Mater. Lett. 2011, 65, 3472–3475. [Google Scholar]
- Hansen, N. Boundary strengthening in undeformed and deformed polycrystals. Mater. Sci. Eng. A 2005, 409, 39–45. [Google Scholar]
- Bowen, J.R.; Prangnell, P.B.; Jensen, D.J.; Hansen, N. Microstructural parameters and flow stress in Al-0.13% Mg deformed by ECAE processing. Mater. Sci. Eng. A 2004, 387–389, 235–239. [Google Scholar]
- Kamikawa, N.; Huang, X.; Tsuji, N.; Hansen, N. Strengthening mechanisms in nanostructured high-purity aluminium deformed to high strain and annealed. Acta Mater. 2009, 57, 4198–4208. [Google Scholar]
- Zherebtsov, S.; Dyakonov, G.; Salem, A.; Malysheva, S.; Salishchev, G.; Semiatin, S. Evolution of grain and subgrain structure during cold rolling of commercial-purity titanium. Mater. Sci. Eng. A 2011, 528, 3474–3479. [Google Scholar]
- Chun, Y.; Yu, S.; Semiatin, S.; Hwang, S. Effect of deformation twinning on microstructure and texture evolution during cold rolling of CP-titanium. Mater. Sci. Eng. A 2005, 398, 209–219. [Google Scholar]
- Humphreys, F.J. Characterisation of fine-scale microstructures by electron backscatter diffraction (EBSD). Scr. Mater. 2004, 51, 771–776. [Google Scholar]
© 2011 by the authors; licensee MDPI, Basel, Switzerland. This article is an open access article distributed under the terms and conditions of the Creative Commons Attribution license (http://creativecommons.org/licenses/by/3.0/).
Share and Cite
Marr, T.; Freudenberger, J.; Seifert, D.; Klauß, H.; Romberg, J.; Okulov, I.; Scharnweber, J.; Eschke, A.; Oertel, C.-G.; Skrotzki, W.; et al. Ti-Al Composite Wires with High Specific Strength. Metals 2011, 1, 79-97. https://doi.org/10.3390/met1010079
Marr T, Freudenberger J, Seifert D, Klauß H, Romberg J, Okulov I, Scharnweber J, Eschke A, Oertel C-G, Skrotzki W, et al. Ti-Al Composite Wires with High Specific Strength. Metals. 2011; 1(1):79-97. https://doi.org/10.3390/met1010079
Chicago/Turabian StyleMarr, Tom, Jens Freudenberger, Dirk Seifert, Hansjörg Klauß, Jan Romberg, Ilya Okulov, Juliane Scharnweber, Andy Eschke, Carl-Georg Oertel, Werner Skrotzki, and et al. 2011. "Ti-Al Composite Wires with High Specific Strength" Metals 1, no. 1: 79-97. https://doi.org/10.3390/met1010079