Mechanical Properties of Metallic Glasses


1
Joint Institute for Neutron Sciences, P. O. Box 2008, MS-6453, Oak Ridge, TN 37831-6453, USA
2
Department of Materials Science and Engineering, University of Tennessee, Knoxville, TN 36996, USA
3
Department of Physics and Astronomy, University of Tennessee, Knoxville, TN 36996, USA
4
Oak Ridge National Laboratory, Oak Ridge, TN 37831, USA
*
Author to whom correspondence should be addressed.
Metals 2013, 3(1), 77-113; https://doi.org/10.3390/met3010077
Submission received: 27 November 2012
/
Revised: 17 January 2013
/
Accepted: 28 January 2013
/
Published: 31 January 2013
Abstract
:Metallic glasses are known for their outstanding mechanical strength. However, the microscopic mechanism of failure in metallic glasses is not well-understood. In this article we discuss elastic, anelastic and plastic behaviors of metallic glasses from the atomistic point of view, based upon recent results by simulations and experiments. Strong structural disorder affects all properties of metallic glasses, but the effects are more profound and intricate for the mechanical properties. In particular we suggest that mechanical failure is an intrinsic behavior of metallic glasses, a consequence of stress-induced glass transition, unlike crystalline solids which fail through the motion of extrinsic lattice defects such as dislocations.
1. Introduction
Metallic glasses show high mechanical strength with the yield strain as high as 2%, comparable to those of the strongest crystalline materials [1,2,3,4]. For this exceptional strength bulk metallic glasses are widely known as promising new structural materials, although there are serious problems related to the absence of work-hardening and limited ductility. However, the basic understanding of the structure and mechanical properties of metallic glasses is very much underdeveloped. In general the science of glasses and liquids is much less advanced than the science of crystalline materials. In fact understanding the nature of glass and the glass transition is considered to be one of the greatest challenges in condensed matter theory [5]. Our theoretical tools are sufficiently developed to elucidate the properties of gases, in which atoms interact only weakly, and crystals, in which atoms form a periodic structure. However, glasses and liquids are very different from either of them. They are condensed matter with high physical density comparable to those in crystals. Atoms are strongly correlated in position and momentum, and attempts to provide theoretical explanation of the structure and dynamics of glasses and liquids face a formidable barrier of the many-body problem. An effective approach to overcome this barrier to some extent is to use numerical simulation, which became feasible by the recent rapid progress in computing power. However, numerical approaches tend to leave us in a deluge of numbers without giving us key concepts to unfold the mystery.
In this article we discuss the nature and mechanisms of elastic, anelastic and plastic deformation of bulk metallic glasses mainly from the atomistic point of view, covering simulation as well as diffraction experiments, but excluding macroscopic tensile or compression mechanical testing. The subjects treated here are not new problems. For elastic behavior the effect of structural disorder was first discussed in the seminal work by Weaire, et al. [6]. The basic concepts necessary to understand the formation of shear bands in plastic deformation were developed in the equally seminal work by Spaepen [7]. But the development of bulk metallic glasses [8,9] and recent advances in computing and diffraction methods are making it possible to achieve deeper understanding of the subject down to the atomic level. We focus on several topics which are still controversial, such as the role and definition of structural defects, and propose some solutions.
2. Elastic Properties
2.1. Simulation of Elastic Deformation
2.1.1. Effect of Heterogeneity in Local Elasticity
The elasticity theory used in mechanical or civil engineering is the elasticity theory of a continuum body, developed before the existence of an atom was confirmed. For instance elastic deformation is defined by
![Metals 03 00077 i001]() where r and r' are the positions before and after deformation, and
where r and r' are the positions before and after deformation, and ![Metals 03 00077 i035]() is the strain tensor and follows the Hook’s law. However, at the atomic level a solid is not a continuum body. As an approximation we may use the von Kármán model of spheres connected by springs [10]. Then Equation (1) could be extended to describe the deformation of the atomic system as
is the strain tensor and follows the Hook’s law. However, at the atomic level a solid is not a continuum body. As an approximation we may use the von Kármán model of spheres connected by springs [10]. Then Equation (1) could be extended to describe the deformation of the atomic system as
![Metals 03 00077 i002]() where the suffix i refers to each atom. However, the strain tensor
where the suffix i refers to each atom. However, the strain tensor ![Metals 03 00077 i035]() is uniform, or affine, only for homogeneous deformation of a Bravais lattice with only one atom in the unit cell. If the unit cell contains more than one atom, even for macroscopically uniform strain the local strain is not necessarily the same for each non-equivalent atom,
is uniform, or affine, only for homogeneous deformation of a Bravais lattice with only one atom in the unit cell. If the unit cell contains more than one atom, even for macroscopically uniform strain the local strain is not necessarily the same for each non-equivalent atom,
![Metals 03 00077 i003]() where the index ν refers to the non-equivalent lattice sites within the unit cell and n refers to the unit cell. Now a glass can be considered as a crystal with an infinitely large unit cell. Thus in a glass the strain tensor is different for each atom;
where the index ν refers to the non-equivalent lattice sites within the unit cell and n refers to the unit cell. Now a glass can be considered as a crystal with an infinitely large unit cell. Thus in a glass the strain tensor is different for each atom;
![Metals 03 00077 i004]()

 is the strain tensor and follows the Hook’s law. However, at the atomic level a solid is not a continuum body. As an approximation we may use the von Kármán model of spheres connected by springs [10]. Then Equation (1) could be extended to describe the deformation of the atomic system as
 is uniform, or affine, only for homogeneous deformation of a Bravais lattice with only one atom in the unit cell. If the unit cell contains more than one atom, even for macroscopically uniform strain the local strain is not necessarily the same for each non-equivalent atom,


Therefore we do not expect affine deformation in a glass at the atomic level, even though a metallic glass deforms just as a crystalline solid, following the Hook’s law at the macroscopic level.
This point was recognized early in the simulation of deformation in metallic glasses by Weaire et al. [6] in which they pointed out that the atomic displacements, ∆i = ri' − ri, are not collinear to each other. They also related the non-collinear nature of displacements to the shear modulus softening in the amorphous state. If one compares the elastic moduli of a material in the crystalline state and in the amorphous state, the bulk modulus is comparable for the two states, but the shear modulus of the amorphous state is considerably (20%–30%) lower than that of the corresponding crystalline state [11]. This is because deformation in response to isostatic pressure is nearly affine, but in the case of shear stress deformation is highly non-affine [6]. Indeed the simulated stress-strain curve (Figure 1) shows that the apparent shear modulus is significantly smaller than that expected for affine deformation.
Figure 1.
Stress-strain curve of glassy iron by simulation for uniaxial tension. Compared to the curve expected for affine deformation the apparent shear modulus is significantly lower.
Figure 1.
Stress-strain curve of glassy iron by simulation for uniaxial tension. Compared to the curve expected for affine deformation the apparent shear modulus is significantly lower.

A part of this softening originates from spatial variation in the elastic moduli. It is known that if the local shear elastic constant, G, has spatial variation, the total elastic response to the shear stress, τ is larger than expected from the average,
![Metals 03 00077 i005]() where <τ> is the external shear stress. Therefore elastic heterogeneity results in softening. This result was first obtained half a century ago, in the seminal work by Z. Hashin and S. Shtrikman [12] who opened up a large field of composite mechanics.
where <τ> is the external shear stress. Therefore elastic heterogeneity results in softening. This result was first obtained half a century ago, in the seminal work by Z. Hashin and S. Shtrikman [12] who opened up a large field of composite mechanics.

Indeed the atomic-level elastic moduli have a wide distribution. The atomic-level stresses and elastic moduli are defined as the local response of energy to affine deformation [10,13,14]. First, we express the total energy of the system as the sum of the atomic-level energies;
![Metals 03 00077 i006]()

It is easy to do so for a pair-wise potential V(r);
![Metals 03 00077 i007]() where rij is the distance between i-th and j-th atoms. We then impose uniform affine deformation and expand the total energy in terms of the affine strain, εαβ, where α and β are Cartesian coordinates. The energy response defines the atomic level stress, σiαβ, and the atomic level elastic modulus, Ciαβγδ;
where rij is the distance between i-th and j-th atoms. We then impose uniform affine deformation and expand the total energy in terms of the affine strain, εαβ, where α and β are Cartesian coordinates. The energy response defines the atomic level stress, σiαβ, and the atomic level elastic modulus, Ciαβγδ;
![Metals 03 00077 i008]() where Ωi is the atomic volume which was included for the dimensional reason [13,14]. Recently this was extended to ab initio calculations using the density functional theory (DFT) so that the stresses can be calculated from the first-principles [15]. It was found that the shear modulus, G, has a much wider distribution than the bulk modulus, B [14]. Thus it is immediately obvious that the softening due to distribution is more serious for G than for B. However, when an external stress σαβ is applied the local strain εiγδ cannot be given simply by σiαβ/Ciαβγδ, because atoms are connected to each other and each atom cannot be displaced independently. In continuum mechanics this interdependence is expressed as the elastic compatibility condition. For this reason calculating the local strain in an inhomogeneous body is a very difficult theoretical problem. Analytically it is difficult to go beyond the variational calculation as was done first by Hashin and Shtrikman. Formally the Green’s function method by Kröner [16] is a more advanced approach, but it is very difficult to solve the actual problem with this technique. Instead numerical solution, including the finite element analysis, is usually sought in obtaining the answer. This elastic heterogeneity has been considered to be the reason for softening of shear modulus, G, by Weaire et al. [6], and in a number of simulation results [17,18].
where Ωi is the atomic volume which was included for the dimensional reason [13,14]. Recently this was extended to ab initio calculations using the density functional theory (DFT) so that the stresses can be calculated from the first-principles [15]. It was found that the shear modulus, G, has a much wider distribution than the bulk modulus, B [14]. Thus it is immediately obvious that the softening due to distribution is more serious for G than for B. However, when an external stress σαβ is applied the local strain εiγδ cannot be given simply by σiαβ/Ciαβγδ, because atoms are connected to each other and each atom cannot be displaced independently. In continuum mechanics this interdependence is expressed as the elastic compatibility condition. For this reason calculating the local strain in an inhomogeneous body is a very difficult theoretical problem. Analytically it is difficult to go beyond the variational calculation as was done first by Hashin and Shtrikman. Formally the Green’s function method by Kröner [16] is a more advanced approach, but it is very difficult to solve the actual problem with this technique. Instead numerical solution, including the finite element analysis, is usually sought in obtaining the answer. This elastic heterogeneity has been considered to be the reason for softening of shear modulus, G, by Weaire et al. [6], and in a number of simulation results [17,18].


2.1.2. Local plastic deformation
On the other hand Suzuki et al. [19] found that the nominally elastic deformation contains a significant component of anelastic, or local plastic, deformation in which the atomic structure is locally changed. Similar observations were made for the simulation of deformation of polymer chains [20]. The plastic deformation event is strongly localized, and consists of one atomic bond being broken, while a new bond in a perpendicular direction is formed in close vicinity, resulting in bond exchange, or reorientation. This is what happens during creep [21,22,23] or flow under high shear stress [24]. Interestingly the number of bond reorientation for a given strain is constant, making the deformation appearing as macroscopically elastic [19].
In order to evaluate the relative contributions from these two effects, elastic heterogeneity and local plasticity, we computed the apparent shear modulus of a model amorphous iron with the modified Johnson (mJ) potential [25] used in [19] as a function of the magnitude of the shear strain, εs. Softening due to elastic heterogeneity occurs no matter how small the strain is, so the stress is linear with strain for small strain. But local plastic deformation is like a transition in the double-well potential, and deformation occurs in a step-wise fashion. If macroscopic strain is increased linearly with time, the macroscopic stress is reduced every time local deformation occurs. The strain at which the first reduction happens, εred, depends on the sample size, and should be proportional to 1/N, where N is the number of atoms in the model. The magnitude of εred can be estimated as below. In [19] it was found that a single action of bond reorientation produces overall strain of ε1 = α/N, where α = 0.078 (~1/NC, NC is the coordination number) and N is the number of atoms in the model system. So if εs is smaller than ε1 bond reorientation will not occur because of the model size effect; εred~ε1. Figure 2 shows this effect for the system with N = 500 (ε1 = 1.6 × 10⁻⁴) at 100 K. The shear modulus calculated for affine deformation (Born modulus) is 69 GPa. The initial value of the macroscopic shear modulus, 57 GPa, is reduced from the Born modulus due only to the softening by the inhomogeneous local shear modulus, amounting to 18% softening. When εs exceeds ε1, however, additional softening due to bond reorientation is activated, which further reduces the shear modulus to 49 GPa, representing another 11% softening. Thus for the system with the mJ potential the two mechanisms of softening contribute by comparable amounts.
Figure 2.
Apparent shear modulus, G = τ/ε, normalized by the modulus for affine deformation, Gaffine, as a function of the shear strain, simulated for models with 500 atoms. Glassy Fe with the modified Johnson potential ( ![Metals 03 00077 i036]() ), Lennard-Jones glass (
), Lennard-Jones glass ( ![Metals 03 00077 i037]() ), and glass with the Dzugutov potential (
), and glass with the Dzugutov potential ( ![Metals 03 00077 i038]() ).
).
 ), Lennard-Jones glass (
  ), and glass with the Dzugutov potential (
  ).
).
Figure 2.
Apparent shear modulus, G = τ/ε, normalized by the modulus for affine deformation, Gaffine, as a function of the shear strain, simulated for models with 500 atoms. Glassy Fe with the modified Johnson potential ( ![Metals 03 00077 i036]() ), Lennard-Jones glass (
), Lennard-Jones glass ( ![Metals 03 00077 i037]() ), and glass with the Dzugutov potential (
), and glass with the Dzugutov potential ( ![Metals 03 00077 i038]() ).
).
), Lennard-Jones glass ( ), and glass with the Dzugutov potential ( ).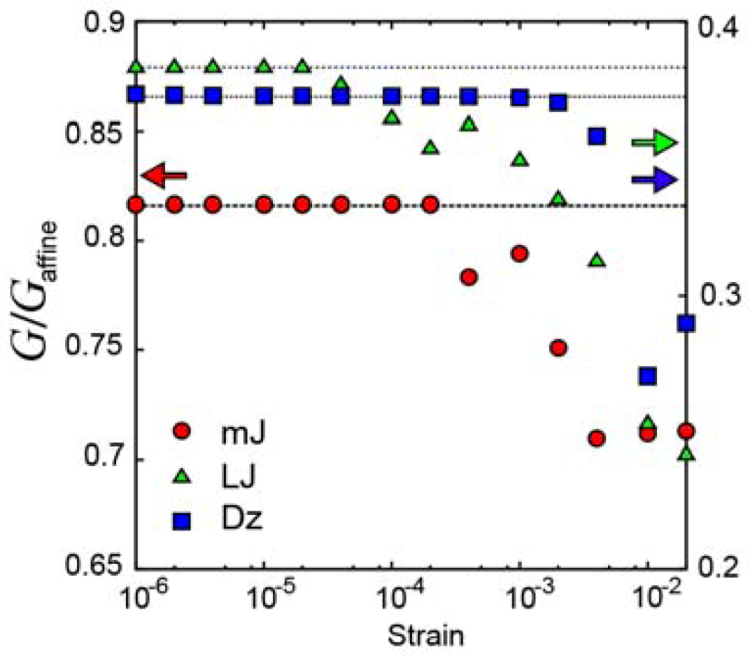
Then, why some authors [6,17,18] do not observe the second, bond reorientational effect? To answer this question we repeated the same simulation for the Lennard-Jones (LJ) glass and the glass with the Dzugutov (Dz) potential [26]. As shown in Figure 2, we found that the Dz glass also shows stepwise softening similar to the mJ glass, with the second softening starting at an even higher level of strain (10−3). On the other hand the LJ glass shows almost continuous softening with a very small critical strain (εred ~ 2 × 10⁻⁵ << ε1). Thus in the LJ glass the two softening processes are not distinct and bond-cutting is not a discrete jump process, in agreement with other reports on this system [17,18]. The three potentials used in the simulation are compared in Figure 3. Both the mJ and Dz potentials have either a maximum (Dz) or a region of strong negative second derivative (mJ and Dz) in the region between the first peak and the second peak of the pair-density function (PDF) which helps to separate the first and the second peaks. In contrast, the LJ potential extends to the second neighbor, and does not strongly drive separation of the first two PDF peaks. Consequently the atomic connectivity is well-defined for the mJ and Dz potentials, whereas it is less clearly defined for the LJ potential, because the transition from the first to the second neighbor is continuous for the LJ potential, resulting in a very small value of εred.
Figure 3.
The Lennard-Jones potential compared with the Modified Johnson potential for iron and the Dzugutov potential.
Figure 3.
The Lennard-Jones potential compared with the Modified Johnson potential for iron and the Dzugutov potential.
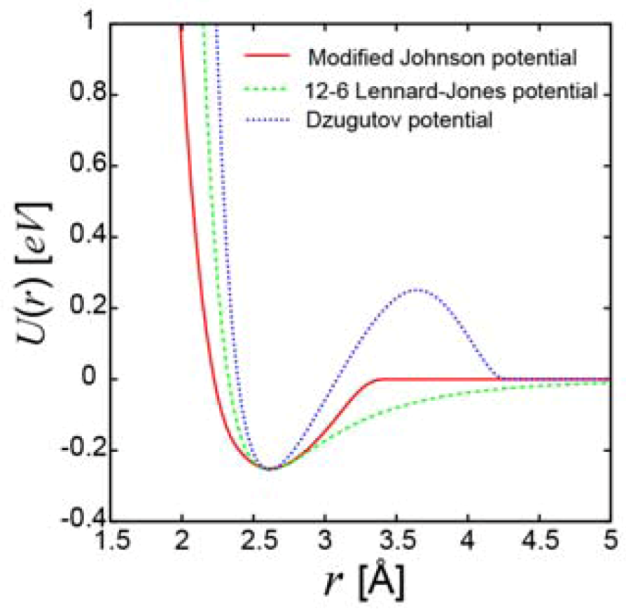
It should be noted that in metals the interatomic potentials are dominated by the Friedel oscillation [27], and tend to have a maximum between the first and the second peaks of the PDF. Thus the mJ and Dz potentials are better suited for modeling metallic glasses. Also both LJ and Dz glasses show very strong softening, by more than 60% compared to the affine (Born) value, whereas experimentally the extent of softening is only 30%. Thus the mJ potential is the most realistic among the three even on this account alone.
As shown above metallic glasses are inherently inhomogeneous at the atomic level when it comes to elastic deformation. The atomic-level elastic moduli have wide distributions reflecting significant distribution in local atomic environment. Surprisingly details of the interatomic potential influence the nature of deformation. The potentials which distinguish the first neighbors from the second neighbors, such as the mJ and Dz potentials, result in the intrinsic anelasticity even at small strains, whereas this effect is not clearly seen for the LJ potential.
2.2. Diffraction Experiments
2.2.1. Anisotropic PDF
Elastic strains in crystalline solids can be readily observed through the shifts in the position of the Bragg peaks. In glasses as well strain can be related to the shifts in the structure function, S(Q), (Q = 4πsinθ/λ, θ is the diffraction angle and λ is the wavelength of the diffraction probe) determined by diffraction measurement, or the pair-density function (PDF),
![Metals 03 00077 i009]() where ρ0 is the atomic density. Paulsen et al. [28] were the first to attempt such a measurement using X-ray diffraction, and quickly noted that the deformation is heterogeneous and the peaks in g(r) do not shift with the same ratio. Hufnagel et al. [29] followed this work with more accurate measurements. By examining the shifts in the peak position in S(Q) and the point of zero-crossing in the corresponding pair-distribution function (PDF), g(r), measured with Q either parallel or perpendicular to the direction of the applied stress, they concluded that the glasses are elastically inhomogeneous. In particular they found that the strains at short distances are smaller than those at large distances. Similar results were obtained by several groups [30,31,32,33,34,35,36,37,38,39], and it is clear that such inhomogeneous response is a common feature of elasticity in metallic glasses, distinct from those of crystalline solids.
where ρ0 is the atomic density. Paulsen et al. [28] were the first to attempt such a measurement using X-ray diffraction, and quickly noted that the deformation is heterogeneous and the peaks in g(r) do not shift with the same ratio. Hufnagel et al. [29] followed this work with more accurate measurements. By examining the shifts in the peak position in S(Q) and the point of zero-crossing in the corresponding pair-distribution function (PDF), g(r), measured with Q either parallel or perpendicular to the direction of the applied stress, they concluded that the glasses are elastically inhomogeneous. In particular they found that the strains at short distances are smaller than those at large distances. Similar results were obtained by several groups [30,31,32,33,34,35,36,37,38,39], and it is clear that such inhomogeneous response is a common feature of elasticity in metallic glasses, distinct from those of crystalline solids.

There is, however, a minor problem before we discuss the implications of these results. In all of these measurements, with the exception of [34,38], g(r) was obtained by the standard Fourier-transformation, Equation (9). But this equation applies only to an isotropic body [40]. For an anisotropic system we should use the anisotropic PDF method [21,41] based on the expansion by the spherical harmonics;
![Metals 03 00077 i010]() where Yℓm(u) are the spherical harmonics. Anisotropic gℓm(r) and Sℓm(Q) are connected through
where Yℓm(u) are the spherical harmonics. Anisotropic gℓm(r) and Sℓm(Q) are connected through
![Metals 03 00077 i011]() where Jℓ(z) is the spherical Bessel function. For ℓ = 0 (the isotropic term) J0(z) = sinz/z, and we recover Equation (9). Elastic deformation induces mainly the ℓ = 2 term [21]. For ℓ = 2,
where Jℓ(z) is the spherical Bessel function. For ℓ = 0 (the isotropic term) J0(z) = sinz/z, and we recover Equation (9). Elastic deformation induces mainly the ℓ = 2 term [21]. For ℓ = 2,
![Metals 03 00077 i012]() which is similar to J0(z) but is sufficiently different, as shown in Figure 4. This results in small but significant differences in the anisotropic PDF particularly at short distances [23,38].
which is similar to J0(z) but is sufficiently different, as shown in Figure 4. This results in small but significant differences in the anisotropic PDF particularly at short distances [23,38].


Figure 4.
Spherical Bessel function, Jℓ(z), for ℓ = 0 and 2.

For affine deformation it can be readily shown that ![Metals 03 00077 i039]() is proportional to the derivative of the isotropic term,
is proportional to the derivative of the isotropic term, ![Metals 03 00077 i040]() [21]. For uniaxial compression or tension [42],
[21]. For uniaxial compression or tension [42],
![Metals 03 00077 i013]() where ν is the Poisson’s ratio. Indeed the experimentally observed
where ν is the Poisson’s ratio. Indeed the experimentally observed ![Metals 03 00077 i041]() is close to the derivative as shown in Figure 5 [42], particularly at large distances, and the magnitude of the strain thus determined agrees with the macroscopic strain. However, there are small but significant deviations at short distances. The interpretation of these deviations is still an open question as discussed below. It should also be noted that in order to discuss such small deviations it becomes important to use the Bessel transformation, Equation (11), rather than the Fourier-transformation, Equation (9).
is close to the derivative as shown in Figure 5 [42], particularly at large distances, and the magnitude of the strain thus determined agrees with the macroscopic strain. However, there are small but significant deviations at short distances. The interpretation of these deviations is still an open question as discussed below. It should also be noted that in order to discuss such small deviations it becomes important to use the Bessel transformation, Equation (11), rather than the Fourier-transformation, Equation (9).
 is proportional to the derivative of the isotropic term,
  [21]. For uniaxial compression or tension [42],

 is close to the derivative as shown in Figure 5 [42], particularly at large distances, and the magnitude of the strain thus determined agrees with the macroscopic strain. However, there are small but significant deviations at short distances. The interpretation of these deviations is still an open question as discussed below. It should also be noted that in order to discuss such small deviations it becomes important to use the Bessel transformation, Equation (11), rather than the Fourier-transformation, Equation (9).
Figure 5.
Anisotropic pair-density function (PDF) of glassy Zr52.5Cu17.9Ni14.6Al10Ti5 under compressive stress of 1.2 GPa (red solid line) compared to the derivative of the isotropic PDF (dashed line) [42].
Figure 5.
Anisotropic pair-density function (PDF) of glassy Zr52.5Cu17.9Ni14.6Al10Ti5 under compressive stress of 1.2 GPa (red solid line) compared to the derivative of the isotropic PDF (dashed line) [42].

2.2.2. Interpretation of the Results
A majority of researchers interpret these results in terms of distance-dependent strain [28,29,30,31,32,33,35,36,37,38,39] or chemical inhomogeneity [34]. The strain is small at short distances, and increases as r is increased. Indeed if we fit Equation (13) to the data by using an r-dependent strain, εzz,aff(r), the strain is smaller at r below 6 Å. Some argue that this r-dependent strain is an evidence of hard clusters interfaced by soft media, and elastic heterogeneity produces non-affine behavior [28,39]. However, there is a major jump in logic in this argument. If the local elastic modulus is heterogeneous local displacements will be heterogeneous as well, some large and some small, ending up with the average displacement not much different from what is expected for the average modulus. Explicit models or simulations are needed to link the observed r-dependent strain with the picture of hard clusters interfaced with soft media.
Reference [39] goes further to argue that S(Q) is influenced by deformation only up to qc = 6 Å−1, and thus the core of the clusters are not deformed. The basis of their argument is their observation that the strain-induced anisotropy in S(Q), ∆S(Q), is zero beyond qc. But this observation differs from other studies, and is simply incorrect; the problem is poor statistics in the measurement. As we discussed above ∆S(Q) is nearly proportional to dS(Q)/dQ [21,42]. If we actually compare Q∆S(Q) with QdS(Q)/dQ (Figure 6) they are nearly proportional to each other, and the cut-off of 6 Å−1 does not exist, in clear disagreement with the assertion in [39].
Figure 6.
Q ![Metals 03 00077 i042]() (~∆S(Q)) compared to Q
(~∆S(Q)) compared to Q ![Metals 03 00077 i043]() . The measurement was made for Zr52.5Cu17.9Ni14.6Al10Ti5 glass under tension at 1.2 GPa. Note that they do not decay even beyond 6 Å−1, and Q
. The measurement was made for Zr52.5Cu17.9Ni14.6Al10Ti5 glass under tension at 1.2 GPa. Note that they do not decay even beyond 6 Å−1, and Q ![Metals 03 00077 i042]() is proportional to Q
is proportional to Q ![Metals 03 00077 i043]() as expected.
as expected.
 (~∆S(Q)) compared to Q
  . The measurement was made for Zr52.5Cu17.9Ni14.6Al10Ti5 glass under tension at 1.2 GPa. Note that they do not decay even beyond 6 Å−1, and Q is proportional to Q as expected.
Figure 6.
Q ![Metals 03 00077 i042]() (~∆S(Q)) compared to Q
(~∆S(Q)) compared to Q ![Metals 03 00077 i043]() . The measurement was made for Zr52.5Cu17.9Ni14.6Al10Ti5 glass under tension at 1.2 GPa. Note that they do not decay even beyond 6 Å−1, and Q
. The measurement was made for Zr52.5Cu17.9Ni14.6Al10Ti5 glass under tension at 1.2 GPa. Note that they do not decay even beyond 6 Å−1, and Q ![Metals 03 00077 i042]() is proportional to Q
is proportional to Q ![Metals 03 00077 i043]() as expected.
as expected.
(~∆S(Q)) compared to Q . The measurement was made for Zr52.5Cu17.9Ni14.6Al10Ti5 glass under tension at 1.2 GPa. Note that they do not decay even beyond 6 Å−1, and Q is proportional to Q as expected. 
On the other hand the difference between the observed ![Metals 03 00077 i044]() and what is expected for affine deformation, Equation (13), is very similar to that for anelastic (creep) deformation discussed below. For this reason [42] assigns the shear softening to anelastic deformation. They found that the observed
and what is expected for affine deformation, Equation (13), is very similar to that for anelastic (creep) deformation discussed below. For this reason [42] assigns the shear softening to anelastic deformation. They found that the observed ![Metals 03 00077 i044]() can be fit nicely with
can be fit nicely with
![Metals 03 00077 i014]() where εzz,anel is the anelastic strain, εzz,aff = εapp − εzz,anel is the affine (elastic) strain, and
where εzz,anel is the anelastic strain, εzz,aff = εapp − εzz,anel is the affine (elastic) strain, and ![Metals 03 00077 i045]() is the anisotropic PDF for anelastic deformation shown below in Figure 7. The fraction of the affine strain to the total strain, z = εzz,aff/εapp, was found to be about 0.76, implying as much as 24% of the strain originates from the anelastic effect. As it turns out this fraction is exactly what has been assumed in the theory of glass transition [43] to be the fraction of the liquid-like atomic sites at the glass transition.
is the anisotropic PDF for anelastic deformation shown below in Figure 7. The fraction of the affine strain to the total strain, z = εzz,aff/εapp, was found to be about 0.76, implying as much as 24% of the strain originates from the anelastic effect. As it turns out this fraction is exactly what has been assumed in the theory of glass transition [43] to be the fraction of the liquid-like atomic sites at the glass transition.
 and what is expected for affine deformation, Equation (13), is very similar to that for anelastic (creep) deformation discussed below. For this reason [42] assigns the shear softening to anelastic deformation. They found that the observed can be fit nicely with

 is the anisotropic PDF for anelastic deformation shown below in Figure 7. The fraction of the affine strain to the total strain, z = εzz,aff/εapp, was found to be about 0.76, implying as much as 24% of the strain originates from the anelastic effect. As it turns out this fraction is exactly what has been assumed in the theory of glass transition [43] to be the fraction of the liquid-like atomic sites at the glass transition.
Figure 7.
![Metals 03 00077 i044]() of glassy Zr52.5Cu17.9Ni14.6Al10Ti5 after creep deformation at 300 °C for 30 min. under the stress of 1.2 GPa, compared to
of glassy Zr52.5Cu17.9Ni14.6Al10Ti5 after creep deformation at 300 °C for 30 min. under the stress of 1.2 GPa, compared to ![Metals 03 00077 i040]() [42].
[42].
of glassy Zr52.5Cu17.9Ni14.6Al10Ti5 after creep deformation at 300 °C for 30 min. under the stress of 1.2 GPa, compared to [42].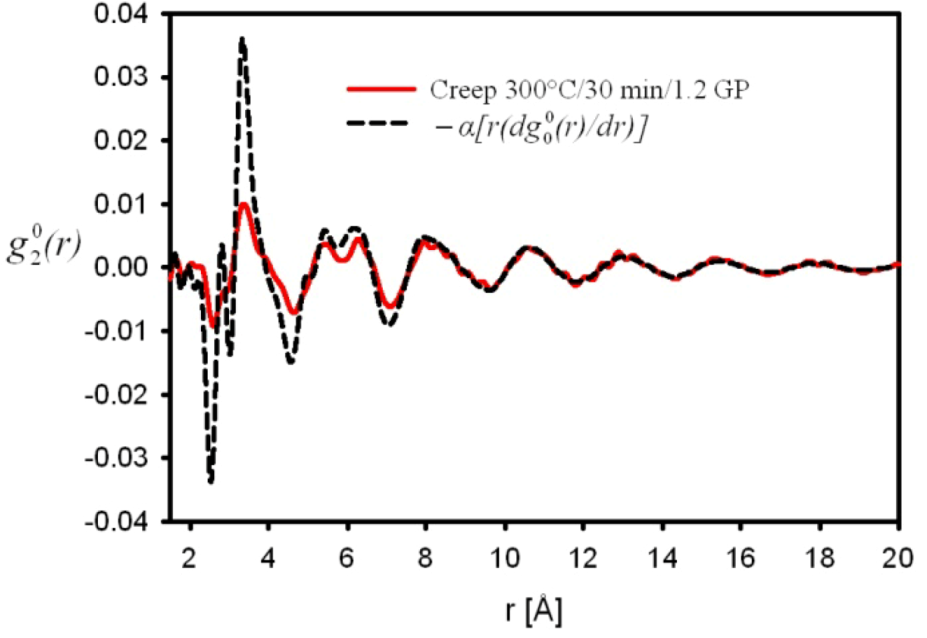
3. Creep and Anelastic Deformation
When a solid is heated to a temperature below the glass transition temperature and is subjected to a stress below the elastic limit, slow deformation (creep) is induced and the sample changes its shape. If the sample is later annealed without a stress the sample recovers a part of the deformation. So creep deformation is composed of recoverable anelastic deformation as well as unrecoverable plastic flow. Such a behavior is observed in many crystalline as well as glassy materials, including metallic glasses [3,44,45]. In the case of crystalline materials both anelasticity and flow are caused by lattice defects, dislocations and vacancies. Anelastic behavior is caused by localized defects in a double-well potential, whereas plastic flow is caused by unbound flow of defects. For glasses, however, the mechanism is not clear because defects cannot be easily identified. Because anelastic deformation is characterized by the memory effect, and the memory has to be stored somehow in the structure, the structure of a glass after anelastic deformation should be anisotropic.
Indeed the structure after creep has the anisotropy mainly with the ℓ = 2 symmetry [21], and the next term with ℓ = 6 is much smaller [46]. The observed anisotropic PDF is again similar at large distances to the derivative of the isotropic term expected for affine deformation (Figure 7), and the strain determined by Equation (13) agrees with the macroscopic recoverable strain. However, at short distances there are very appreciable deviations. These deviations were explained in terms of the bond-orientational anisotropy [21,22,23]. Right after the stress is applied the solid has elastic deformation, and the anisotropic PDF resembles Equation (13). Then while the sample is held under stress at an elevated temperature, the structure tries to recover the isotropic state, by cutting bonds parallel to the uniaxial stress, and creating new bonds perpendicular to the stress, resulting in bond-exchange or bond reorientation (Figure 8). When the temperature is reduced and stress is removed, the sample ends up with more bonds in the perpendicular direction than in the parallel direction. Thus,
![Metals 03 00077 i015]() shown in Figure 9 (red line) represents the local structural rearrangement to induce bond-orientational anisotropy. Now in Figure 9 we also show
shown in Figure 9 (red line) represents the local structural rearrangement to induce bond-orientational anisotropy. Now in Figure 9 we also show ![Metals 03 00077 i046]() for elastic deformation (blue line). The two curves in Figure 9 are similar, suggesting that the apparent elastic deformation contains significant anelastic component [42]. However, there are some differences in detail, which deserve further studies.
for elastic deformation (blue line). The two curves in Figure 9 are similar, suggesting that the apparent elastic deformation contains significant anelastic component [42]. However, there are some differences in detail, which deserve further studies.

 for elastic deformation (blue line). The two curves in Figure 9 are similar, suggesting that the apparent elastic deformation contains significant anelastic component [42]. However, there are some differences in detail, which deserve further studies.
Figure 8.
Formation of bond-orientational anisotropy under stress [21].
Figure 8.
Formation of bond-orientational anisotropy under stress [21].

Figure 9.
Anisotropic PDF, ![Metals 03 00077 i015]() , reflecting structural re-arrangement, for anelastic deformation (red) and for elastic deformation (blue) [42].
, reflecting structural re-arrangement, for anelastic deformation (red) and for elastic deformation (blue) [42].
, reflecting structural re-arrangement, for anelastic deformation (red) and for elastic deformation (blue) [42].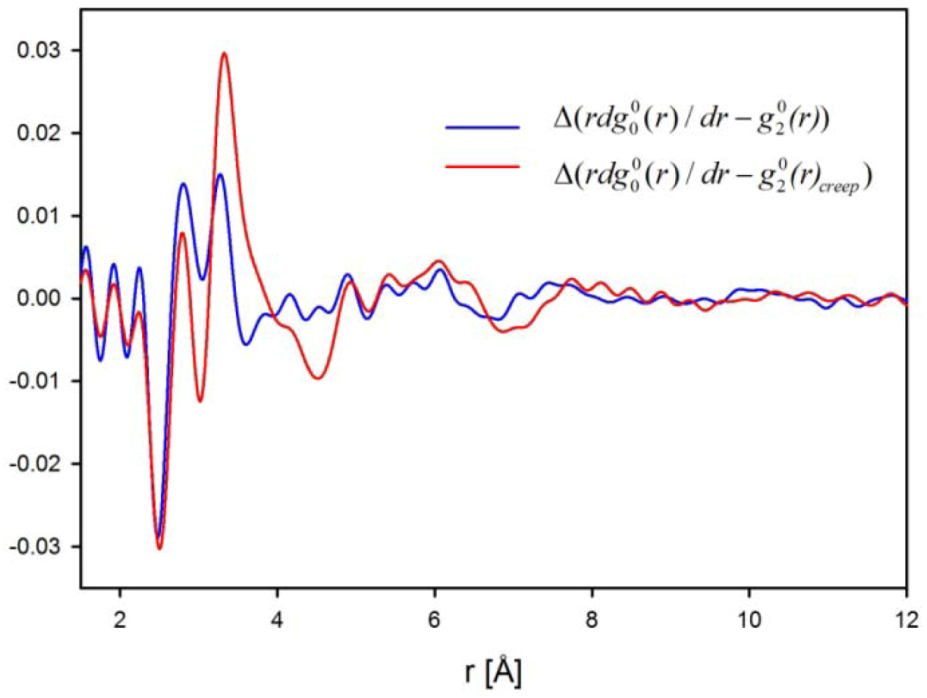
Incidentally, microscopically the glass never recovers the same atomic arrangement after anelastic recovery. The glassy state is characterized by extremely high degree of structural degeneracy. Once the atomic structure is deformed it never comes back to the exactly same atomic connectivity network when the stress is removed. Thus strictly speaking there is no true anelasticity in glasses. This situation is the same as the case of apparently elastic deformation discussed above. In that sense every deformation in metallic glasses has a plastic component. However, when the plastically deformed region is localized and surrounded by the matrix which is only elastically deformed, the matrix applies back-stress to recover the original state. When the sample is heated without a stress the original state may be recovered. Thus operationally we can say that the system exhibits anelasticity.
4. Plastic Deformation
4.1. Macroscopic Behavior
4.1.1. Shear Band Formation and Non-Linear Viscosity
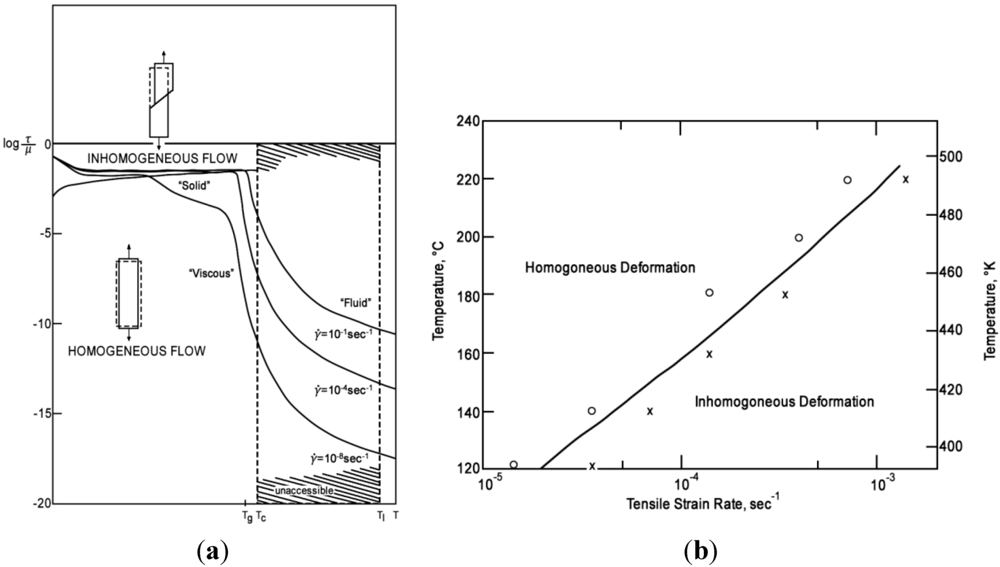
At room temperature metallic glasses fail by forming shear bands, where plastic strains are strongly localized. Failure behavior is controlled by nucleation of shear bands and interaction among multiple shear bands [2,3,7,47,48,49]. At higher temperatures, however, metallic glasses deform homogeneously through creep and fails after macroscopic necking. Such a behavior is common to all materials, as discussed by Ashby for crystalline materials [50] and by Spaepen for metallic glasses (Figure 10a [7] and shown by experimental data in Figure 10b [51]). The key quantity in an attempt to understand the behavior is the constitutive law for steady state flow;
![Metals 03 00077 i016]() where γ is the strain rate, σ is the applied stress, and ϕ is some structural parameter to be discussed below. In the liquid state above Tg the system shows the Newtonian behavior, in which γ is linearly dependent on σ;
where γ is the strain rate, σ is the applied stress, and ϕ is some structural parameter to be discussed below. In the liquid state above Tg the system shows the Newtonian behavior, in which γ is linearly dependent on σ;
![Metals 03 00077 i017]() where G∞ is the instantaneous shear modulus and τM is the Maxwell relaxation time. Thus the flow is homogeneous. However, if the stress exponent, n = dlog γ/dσ, becomes large, any accidental stress concentration, for instance due to macroscopic extrinsic defects such as inclusion, will lead to locally accelerated flow, and deformation becomes inhomogeneous, usually resulting in formation of shear bands. So the non-linearity of the constitutive law for steady state flow, Equation (16), is the first requirement for inhomogeneous flow.
where G∞ is the instantaneous shear modulus and τM is the Maxwell relaxation time. Thus the flow is homogeneous. However, if the stress exponent, n = dlog γ/dσ, becomes large, any accidental stress concentration, for instance due to macroscopic extrinsic defects such as inclusion, will lead to locally accelerated flow, and deformation becomes inhomogeneous, usually resulting in formation of shear bands. So the non-linearity of the constitutive law for steady state flow, Equation (16), is the first requirement for inhomogeneous flow.


4.1.2. Size Effect and Extrinsic Defects
The initial report that the transition from homogeneous to inhomogeneous flow depends on the sample size [52] caused much excitement, and was thought to have broken a new ground. However, it seems that experimental details, such as the surface condition and the tapered shape, both due to the focused-ion-beam (FIB) fabrication, adversely affected the result [53], and unfortunately this transition does not appear to be real.
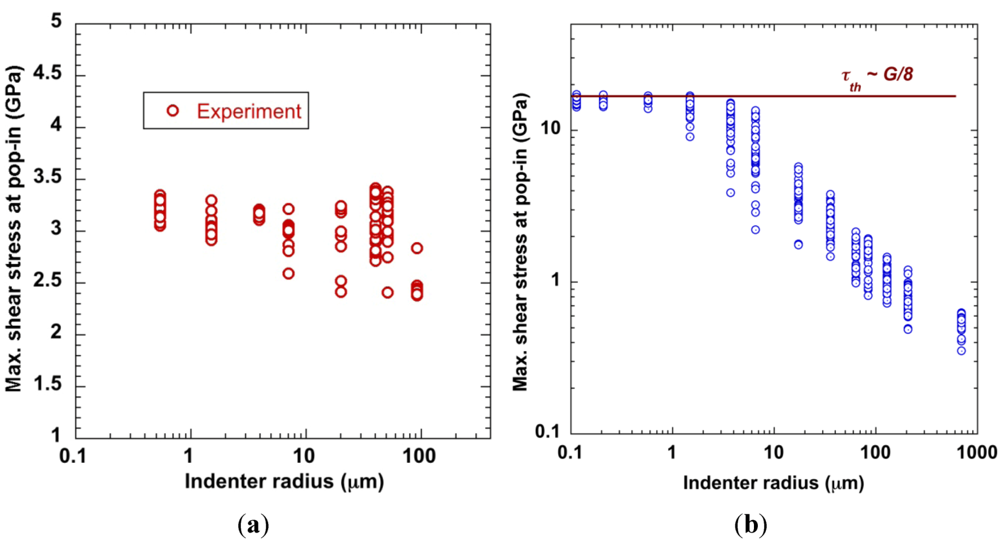
On the other hand the results by the nano-indentation measurements appear to be real, and relevant to the discussion on the mechanism of deformation. It was found that in the nano-indentation measurement the pop-in stress is much higher than the yield stress for macroscopic samples (Figure 11 [54]). The microscopic yield strain from the nano-indentation experiment is 8% to 9%, significantly larger than the yield strain by a macroscopic mechanical testing, which is about 2%. A similar effect was found for crystalline materials, and can be understood in terms of the effect of extrinsic defects, such as inclusions and voids [55]. When the size of the indentor is sufficiently small it can avoid defects which could initiate shear bands, whereas if it is large enough it always hits a defect which initiates shear bands. It is clear that in macroscopic mechanical testing shear bands are initiated by extrinsic defects. As we discuss below for this reason the strength of a macroscopic sample is determined largely by the flow stress, not by the microscopic yield stress.
Figure 11.
(a) Maximum shear stress at first pop-in for Zr52.5Cu17.9Ni14.6Al10Ti5 as a function of indenter radius [54]. The shear modulus is 35 GPa, so the pop-in strain is about 8% to 9%, whereas the macroscopic yield strain is 2%. (b) The pop-in stress against the indentor radius for crystalline Mo [55].
The same argument was advanced by Tian et al. [56]. By studying the elastic limit of sub-micron size metallic glass (Cu49Zr51) with a dog-bone shape prepared by FIB, they found that the elastic limit was about 4%, twice as much as that for bulk metallic glass (2%). They argue that the surface imperfections, such as oxide inclusions, initiate the shear bands, and thus the mechanical strength is controlled by the flow stress. In sub-micron samples, however, imperfections can be avoided, resulting in a higher elastic limit. This explains why metallic glasses all show more or less the same strength, 2% in strain [4]. In crystalline materials strength is controlled by defects, and thus varies wildly from sample to sample. In metallic glasses strength is controlled by the flow stress, an intrinsic property. That is why all metallic glasses show similar elastic limit of 2%.
4.1.3. Feedback Effect of Structural Parameter
An equally important role is played by the structural parameter ϕ. In crystalline materials deformation leads to multiplication of dislocations which accelerates deformation, until dislocations start to become entangled resulting in work-hardening. Thus we may use the dislocation density as ϕ. In glasses, however, the nature of the structural parameter ϕ is not obvious, as discussed in detail later. Here, it is sufficient to note that the effective temperature, Teff, or the fictive temperature, Tf, is usually used to fulfill this role. The atomic structure of a crystal is independent of temperature, except for thermal expansion. However, there are many evidences that suggest that the atomic structure of a liquid depends upon temperature. For instance if we define the effective activation energy for viscosity by
![Metals 03 00077 i018]() where η∞ is the viscosity extrapolated to T→∞, Eeff is constant at high temperatures, but quickly increases as T approaches the glass transition [57]. So Teff can be defined by Ea = Eeff(Teff), where Ea is the activation energy for viscosity, for a given structure. In glass science Teff is traditionally called the fictive temperature, Tf. Another way to define ϕ is to consider the inherent structure [58]. The inherent structure is the atomic structure obtained by equilibriating the system at temperature T and quenching it extremely fast, which is possible only with computer simulation. The energy of the inherent structure describes the structure at the temperature T from which the system was quenched [59]. When temperature is changed the structure, thus Teff, changes to a new equilibrium. Except at very high temperatures this change is slow, and is characterized by the structural relaxation time τα.
where η∞ is the viscosity extrapolated to T→∞, Eeff is constant at high temperatures, but quickly increases as T approaches the glass transition [57]. So Teff can be defined by Ea = Eeff(Teff), where Ea is the activation energy for viscosity, for a given structure. In glass science Teff is traditionally called the fictive temperature, Tf. Another way to define ϕ is to consider the inherent structure [58]. The inherent structure is the atomic structure obtained by equilibriating the system at temperature T and quenching it extremely fast, which is possible only with computer simulation. The energy of the inherent structure describes the structure at the temperature T from which the system was quenched [59]. When temperature is changed the structure, thus Teff, changes to a new equilibrium. Except at very high temperatures this change is slow, and is characterized by the structural relaxation time τα.

Teff has a critical role in the stress-strain curve. To see this effect clearly we have to suppress formation of shear bands and study the stress-strain curve for homogeneous deformation. This can be done, in principle, with a very small sample, or more easily with computer simulation. In computer simulation the sample size is usually small, and by using specific boundary conditions deformation can be kept homogeneous. The system is deformed with a constant strain rate, not by a constant stress. In such a case, the yield stress, σY, the stress needed to start plastic deformation, is much higher than the flow stress, σf; the stress necessary to maintain the flow at low temperatures (Figure 12 [60]). This is because up to σY deformation is basically elastic, and the structure, defined by the topology of atomic connectivity, remains unchanged. This means that the effective temperature, Teff, remains unchanged up to yielding. But as soon as yielding starts the energy is transferred to the system through mechanical work, and Teff starts to rise. The rise in Teff results in the reduction in viscosity, and faster flow. If the local flow rate becomes higher than the externally imposed strain rate the stress is relaxed and goes down, until the steady state flow is achieved. In the particular case shown in Figure 12 σY is twice as much as σf.
Figure 12.
Simulated stress-strain curve of glassy Zr50Cu40Al10 at a low temperature, showing stress over-shoot for yielding before attaining the steady-state flow [60].
Figure 12.
Simulated stress-strain curve of glassy Zr50Cu40Al10 at a low temperature, showing stress over-shoot for yielding before attaining the steady-state flow [60].

However, experimentally observed stress-strain curves [2,3,47,48,49] show the stress overshoot which is much smaller than those in Figure 12. Whereas the simulation shown in Figure 12 was done for a relatively small system of a few nano-meters with homogeneous strain, the real materials form shear bands where strains are concentrated. This suggests that in macroscopic stress-strain measurements shear bands are initiated from some defects, such as inclusions, almost as soon as the stress level exceeds the flow stress, and it leads to a failure. That is why the flow stress, not the microscopic yield stress, determines the macroscopic yield stress. On the other hand as discussed above in nano-indentation experiments require a much higher level of stress to initiate the flow, equivalent to the microscopic yield stress, because a small indentor can hit the surface without a defect.
4.1.4. Effect of Structural Relaxation
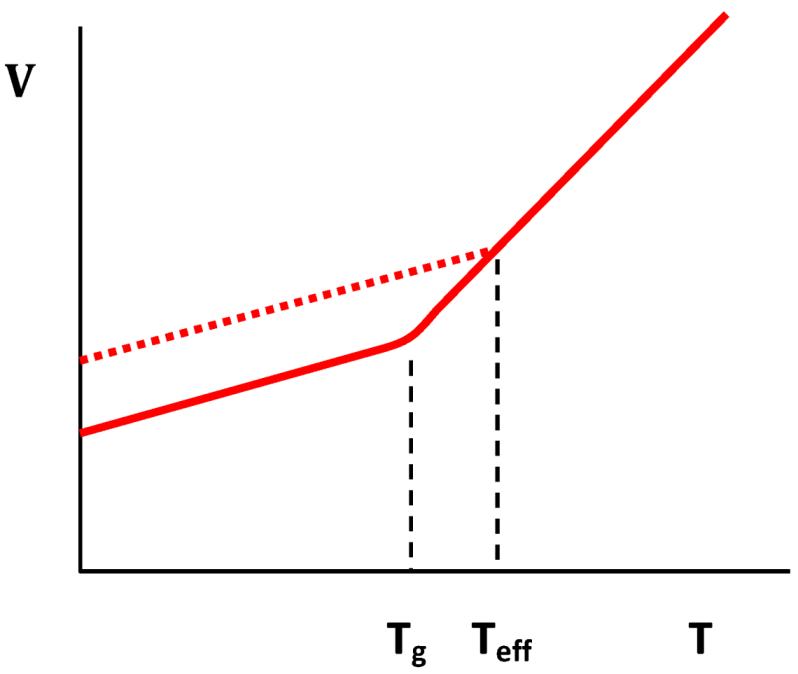
Because a glass is obtained usually by cooling the liquid, the structure of the glass, which can be described by the fictive or effective temperature, Teff, depends on the temperature of the system when the structure froze, thus depends on cooling rate. The higher the cooling rate the higher the Teff is (Figure 13). Annealing afterward causes structural relaxation and Teff is reduced, which results in changes in many properties including mechanical properties [3,61]. Some properties, such as volume and brittleness, are irreversible if annealing is performed below Tg. However, they can be restored by annealing above Tg. Also during heavy mechanical deformation parts of the sample in or near the shear bands become liquid, so Teff is raised back above Tg, and the sample becomes “rejuvenated” [62]. On the other hand, other properties, such as magnetic transition temperature [63] and internal friction [64], can be reversibly changed even when annealing is performed below Tg. Some structural features, such as compositional short-range order, can be brought to equilibrium even below Tg [63]. Obviously Teff can be different for different properties.
Figure 13.
Temperature dependence of the volume of a liquid through the glass transition at Tg, for slow cooling (solid line) and fast cooling (dotted line). Teff is the effective (fictive) temperature for fast cooling.
Figure 13.
Temperature dependence of the volume of a liquid through the glass transition at Tg, for slow cooling (solid line) and fast cooling (dotted line). Teff is the effective (fictive) temperature for fast cooling.
The volume is reduced by structural relaxation, and is usually explained by removal of excess free-volume which was quenched-in during fast cooling. However, the amount of reduction in volume is small, just a fraction of a percent [3,61], whereas the actual structural change observed by the change in the PDF is more extensive, and amounts to a few percent [65]. A better explanation is that as Teff is reduced by relaxation the amplitude of fluctuation in local volume or density is reduced, and both free-volume (region of low density) as well as anti-free-volume (region of high density) are eliminated by annealing [66]. This reduces the peak-widths of the PDF. Consequently the change in the PDF is proportional to the second derivative of the PDF [67]. As we discuss below the free-volume model [68] was conceived for a hard-sphere systems, and do not apply very well for metallic systems. For metals elimination of free-volume reduces volume, but elimination of anti-free-volume increases volume. The total volume change is a consequence of partial cancellation of these two effects. For instance for Pt60Ni15P25 the total volume reduction when annealed at 15K below Tg is 0.57%. But the reduction due to free-volume is 2.05%, which is offset by the increase due to anti-free-volume by 1.47% [69]. This explains why the actual changes in the local structure are much more significant than suggested by the total volume change.
4.1.5. Ductility
Most metallic glasses show no or limited ductility [3,4,11,47,48], particularly in tensile experiment, which represents a major drawback in application. A very interesting observation relates ductility to the Poisson’s ratio [70]. According to [70] ductility is determined solely by the Poisson’s ratio ν. If ν is greater than 0.31 the material is tough, whereas if ν is less than 0.31 it is brittle. The results are confirmed at least by one report [71]. Because low values of Poisson’s ratio is related to increased covalency this trend is reasonable. Indeed highly ductile glasses made of noble metals [72,73], rare earth [74], or Zirconium [75] show high values of Poisson’s ratio. However, the assertion that the Poisson’s ratio is the only relevant parameter and no other parameter has an effect is perplexing, and probably not entirely correct.
Ductility is a complex property, and relates to the ability of the material to enumerate shear bands and absorb the energy of deformation, which goes back to the constitutive law, Equation (16). Because the parameters in Equation (16) depend on temperature, ductility also depends on the measurement temperature. Indeed as in crystalline materials the presence of the ductile-to-brittle transition (dbt) is reported [76]. It is possible that the critical value of the Poisson’s ratio depends upon temperature, most probably on T/Tg. This subject requires further research, in light of the importance of ductility for applications. On the other hand various attempts have been made to improve ductility primarily by mixing with soft and ductile crystalline materials [48,77,78].
4.2. Computer Simulation
4.2.1. Earlier Simulations
The first realistic computer simulation of plastic deformation was done by Kobayashi et al. for a model of Cu57Zr43 composed of 1533 atoms [79]. They found that the yield strain was about 9%, similar to the pop-in strain for nano-indentation measurement shown in Figure 11. This high value of yield strain is partly because of the high strain rates of the simulation and a small sample size. They noted very inhomogeneous atomic displacement during the flow. Later simulations [80,81,82] confirmed these points. The size of the models in early simulations was of the order of 2–3 nm, comparable to the width of the shear bands, not large enough to simulate the formation of shear bands. As the computer power was improved simulations with models of large sizes were carried out and showed how shear bands develop out of fluctuations in stress or stress concentration (Figure 14) [81,82]. A large number of papers using computer simulation focused on the atomistic mechanism of deformation, which will be addressed later.
Figure 14.
Simulation of deformation in Cu64Zr36 glass (288,000 atom model) at 300 K showing the formation of a shear band [82].
Figure 14.
Simulation of deformation in Cu64Zr36 glass (288,000 atom model) at 300 K showing the formation of a shear band [82].

4.2.2. Equivalence of Stress and Temperature
It is well-known that the applied stress can accelerate local atomic rearrangement leading to deformation. For instance in the Eyring’s rate theory [83],
![Metals 03 00077 i019]() where Ω is the activation volume of the mobile defect and σ is the applied stress. Now, we can define viscosity by η = σ/γ. Then,
where Ω is the activation volume of the mobile defect and σ is the applied stress. Now, we can define viscosity by η = σ/γ. Then,
![Metals 03 00077 i020]() where
where ![Metals 03 00077 i047]() . Thus viscosity decreases with stress, a phenomenon known as shear-thinning. In general applying the stress has a similar effect as increasing the temperature. In that sense stress and temperature are equivalent [84].
. Thus viscosity decreases with stress, a phenomenon known as shear-thinning. In general applying the stress has a similar effect as increasing the temperature. In that sense stress and temperature are equivalent [84].


 . Thus viscosity decreases with stress, a phenomenon known as shear-thinning. In general applying the stress has a similar effect as increasing the temperature. In that sense stress and temperature are equivalent [84].
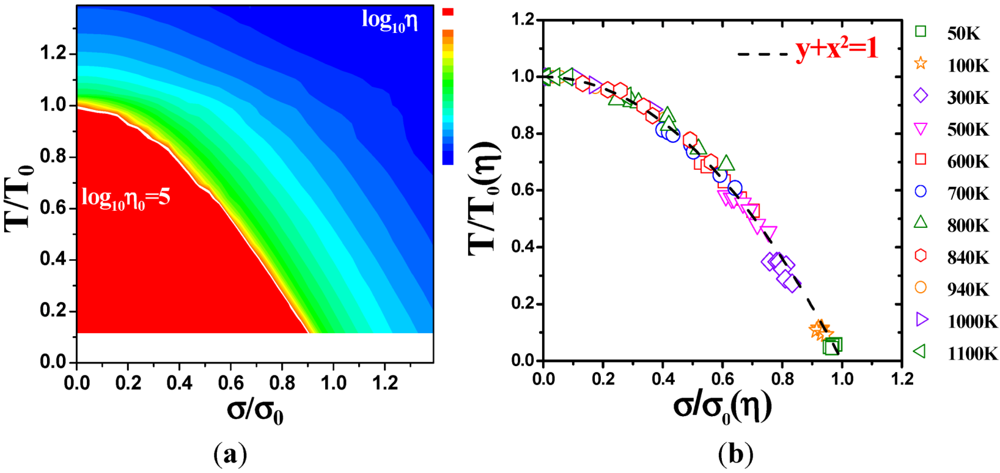
 Now for the steady-state flow it is informative to plot the equal-viscosity lines for the T-σ plane [60,85]. As shown in Figure 15a these lines are self-similar, and can be collapsed into a universal curve as in Figure 15b,
![Metals 03 00077 i021]() where T0(η) is the temperature where viscosity is η at σ = 0, and σ 0 is the stress where viscosity is η at T = 0. Interestingly this implies
where T0(η) is the temperature where viscosity is η at σ = 0, and σ 0 is the stress where viscosity is η at T = 0. Interestingly this implies
![Metals 03 00077 i022]() rather than Equation (20). So the stress affects the activation energy not through the activation volume but through the elastic self-energy. This result is inconsistent with the idea of activation volume. Actually it is inconsistent with the idea that a well-defined defect creates viscoelastic flow.
rather than Equation (20). So the stress affects the activation energy not through the activation volume but through the elastic self-energy. This result is inconsistent with the idea of activation volume. Actually it is inconsistent with the idea that a well-defined defect creates viscoelastic flow.
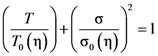

Figure 15.
(a) The equal-viscosity lines for the T-σ plane simulated for Zr50Cu40Al10. (b) The scaled and collapsed equal-viscosity lines [60].
Figure 15.
(a) The equal-viscosity lines for the T-σ plane simulated for Zr50Cu40Al10. (b) The scaled and collapsed equal-viscosity lines [60].
More importantly, this result directly connects the glass transition and mechanical failure, and suggests that mechanical failure is caused by the stress-induced glass transition. Therefore it is an intrinsic property of a glass, not involving defects. It is well-known that crystals deform through the motion of defects, such as dislocations. Naturally there have been numerous attempts to define defects which are responsible for the mechanical failure of metallic glasses, such as the free-volume [7] and distributed free-volume [51,86], with the hope that manipulating these defects may lead to improvement of the properties, such as ductility. Unfortunately the results above show that the flow behavior of metallic glasses is intrinsic, and is not controlled by defects.
Actually if defects are controlling failure, the fracture strength should vary depending on the preparation of the sample. That is exactly what is observed for crystalline materials where the yield stress can vary by more than two orders of magnitude, and various metallurgical processes were invented to strengthen the materials. In comparison the fracture strengths of metallic glasses are remarkably uniform, always around 2% in strain [4], and is controlled by the flow stress. This also supports the idea that the failure is an intrinsic process for metallic glasses.
However, the defects are important in initiating failure through yielding as discussed above. Just before yielding, when the applied stress is already higher than the flow stress (see Figure 12), a surface defects, such as oxide inclusion, can create stress localization and nucleate a shear band. Thus, failure is initiated by microscopic, but not atomistic, defects. Ironically this results in the flow stress, an intrinsic property, controlling the strength.
4.2.3. Non-Linear Constitutive Law and Scaling Behavior
The constitutive law of flow, Equation (16), is a strong function of temperature as shown in Figure 16a [60]. It is interesting that the log-log plot of stress-strain rate is linear, indicating a power law, at Tg. It is concave below Tg, with stress saturating at a constant value for slow strain rates, as expected for a solid. In the liquid state the plot is convex, and at high temperatures σ is proportional to ![Metals 03 00077 i048]() , a Newtonian liquid behavior. Because viscosity is given by
, a Newtonian liquid behavior. Because viscosity is given by ![Metals 03 00077 i049]() , the result can be re-plotted as η against σ, as in Figure 16b. In high-temperature liquids η is only weakly dependent on σ, whereas it is very strongly dependent on σ in glasses, becoming almost vertical at low temperatures.
, the result can be re-plotted as η against σ, as in Figure 16b. In high-temperature liquids η is only weakly dependent on σ, whereas it is very strongly dependent on σ in glasses, becoming almost vertical at low temperatures.
 , a Newtonian liquid behavior. Because viscosity is given by
  , the result can be re-plotted as η against σ, as in Figure 16b. In high-temperature liquids η is only weakly dependent on σ, whereas it is very strongly dependent on σ in glasses, becoming almost vertical at low temperatures.
Figure 16.
(a) Flow stress σ, as a function of strain rate, ![Metals 03 00077 i048]() , simulated for Zr50Cu40Al10 at various temperatures [60]. Tg = 860 K for this system. (b) The same data plotted as viscosity, η, against σ.
, simulated for Zr50Cu40Al10 at various temperatures [60]. Tg = 860 K for this system. (b) The same data plotted as viscosity, η, against σ.
, simulated for Zr50Cu40Al10 at various temperatures [60]. Tg = 860 K for this system. (b) The same data plotted as viscosity, η, against σ.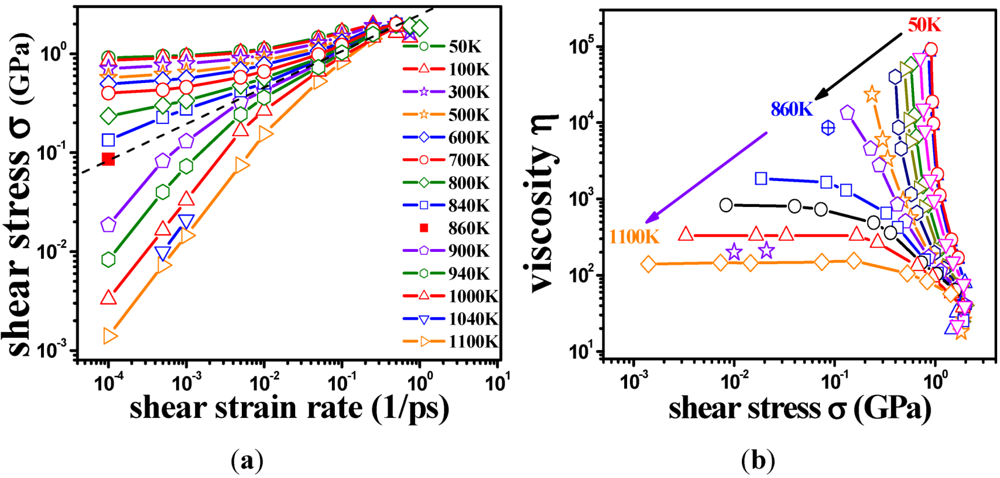
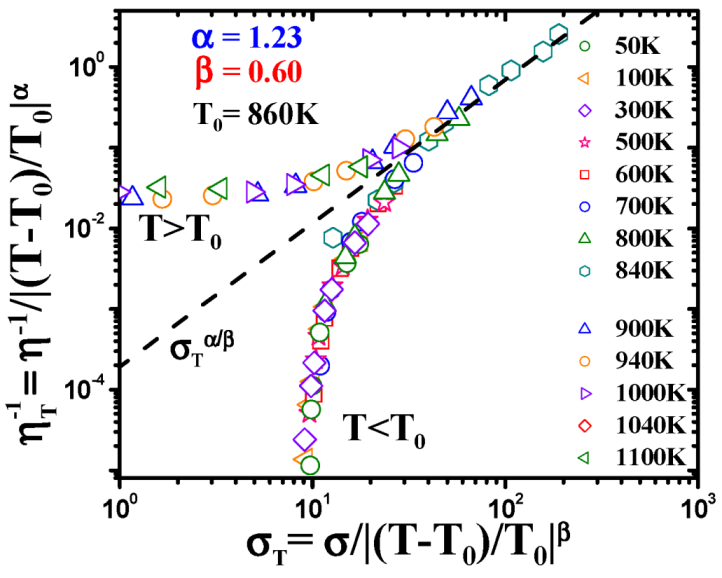
Interestingly the η-σ data can be collapsed into a universal curves by scaling;
![Metals 03 00077 i023]() with α = 1.23, β = 0.60, as plotted in Figure 17, resembling the critical behavior at the phase transition [60]. A similar behavior was found for a hard-sphere model, in this case using the particle density ϕ as the variable, instead of temperature [87]. Of course the glass transition is not a phase transition, because a glass is just a slow liquid. Also Tg depends on the time-scale of the measurement. However, the data in Figure 16, Figure 17 are all in the steady-state, not in the non-equilibrium state. So they are not affected by the time-scale problem. In addition the critical behavior in crystalline systems is observed only in close vicinity of the critical temperature, whereas this scaling shown in Figure 17 is observed over a surprisingly wide temperature range. In spite of these differences the similarity of the scaling behavior of a liquid near the glass transition to the critical behavior near the second-order transition is remarkable. It is not clear if it means that there is a hidden second-order transition behind the glass transition, as suggested by many [88]. But it appears to imply these two phenomena share the same physics somewhere very deep.
with α = 1.23, β = 0.60, as plotted in Figure 17, resembling the critical behavior at the phase transition [60]. A similar behavior was found for a hard-sphere model, in this case using the particle density ϕ as the variable, instead of temperature [87]. Of course the glass transition is not a phase transition, because a glass is just a slow liquid. Also Tg depends on the time-scale of the measurement. However, the data in Figure 16, Figure 17 are all in the steady-state, not in the non-equilibrium state. So they are not affected by the time-scale problem. In addition the critical behavior in crystalline systems is observed only in close vicinity of the critical temperature, whereas this scaling shown in Figure 17 is observed over a surprisingly wide temperature range. In spite of these differences the similarity of the scaling behavior of a liquid near the glass transition to the critical behavior near the second-order transition is remarkable. It is not clear if it means that there is a hidden second-order transition behind the glass transition, as suggested by many [88]. But it appears to imply these two phenomena share the same physics somewhere very deep.

Figure 17.
The scaling behavior of viscosity η, and flow stress σ, simulated for Zr50Cu40Al10 [60]. Tg = 860 K for this system.
Figure 17.
The scaling behavior of viscosity η, and flow stress σ, simulated for Zr50Cu40Al10 [60]. Tg = 860 K for this system.
Now in the glassy state s does not depend strongly on ![Metals 03 00077 i048]() (Figure 16a), thus η is a very strong function of σ, as shown in Figure 16b. Because G∞ does not depend strongly on temperature τM (η/G∞) is also a strong function of σ, and diverges at small σ, which makes sense in the glassy state. τM becomes quickly reduced with increasing σ. Yielding occurs when
(Figure 16a), thus η is a very strong function of σ, as shown in Figure 16b. Because G∞ does not depend strongly on temperature τM (η/G∞) is also a strong function of σ, and diverges at small σ, which makes sense in the glassy state. τM becomes quickly reduced with increasing σ. Yielding occurs when ![Metals 03 00077 i050]() . But τM is not necessarily the same as τα. Of interest here is the competition between the strain rate
. But τM is not necessarily the same as τα. Of interest here is the competition between the strain rate ![Metals 03 00077 i048]() , thus τM, and the structural relaxation rate τα. At low temperatures τα is longer than τM, so that the structure cannot follow the stress, and overshooting becomes necessary. At high temperatures τα is comparable to τM, so that the “structure” can follow the stress without overshooting. In fact the same happens if the temperature is kept constant and the strain rate is varied. Strain localization and stress overshoot happens when
, thus τM, and the structural relaxation rate τα. At low temperatures τα is longer than τM, so that the structure cannot follow the stress, and overshooting becomes necessary. At high temperatures τα is comparable to τM, so that the “structure” can follow the stress without overshooting. In fact the same happens if the temperature is kept constant and the strain rate is varied. Strain localization and stress overshoot happens when ![Metals 03 00077 i048]() is high enough. So the strain localization and the formation of shear band, even though it has a huge impact on the performance of a metallic glass as a structural material, is not an essential feature of deformation of metallic glasses. It simply depends on the experimental condition.
is high enough. So the strain localization and the formation of shear band, even though it has a huge impact on the performance of a metallic glass as a structural material, is not an essential feature of deformation of metallic glasses. It simply depends on the experimental condition.
(Figure 16a), thus η is a very strong function of σ, as shown in Figure 16b. Because G∞ does not depend strongly on temperature τM (η/G∞) is also a strong function of σ, and diverges at small σ, which makes sense in the glassy state. τM becomes quickly reduced with increasing σ. Yielding occurs when  . But τM is not necessarily the same as τα. Of interest here is the competition between the strain rate , thus τM, and the structural relaxation rate τα. At low temperatures τα is longer than τM, so that the structure cannot follow the stress, and overshooting becomes necessary. At high temperatures τα is comparable to τM, so that the “structure” can follow the stress without overshooting. In fact the same happens if the temperature is kept constant and the strain rate is varied. Strain localization and stress overshoot happens when is high enough. So the strain localization and the formation of shear band, even though it has a huge impact on the performance of a metallic glass as a structural material, is not an essential feature of deformation of metallic glasses. It simply depends on the experimental condition.
 The flow stress is a weak function of the strain rate (Figure 12a). But the strain rates achieved in computer simulation are extremely high in real units, so we need strong extrapolations. Even so, it appears that at a low rate the flow strain appears to extrapolate around 2%, close to the experimentally observed yield strain. This again confirms that in a macroscopic sample the yield stress is close to the flow stress, because the flow is always initiated by defects, and stress overshoot (Figure 12) never happens.
5. Atomistic Mechanism of Deformation
5.1. Theories of Mechanical Deformation
A number of theories have been proposed to explain the deformation behavior of metallic glasses. For instance the most widely used theory is the free-volume theory of Spaepen [7], whereas the shear-transformation-zone (STZ) theory of Langer and Falk [89,90] is most detailed and mathematically advanced. They assume different microscopic mechanisms, free-volume and STZ, for deformation. However, both theories are actually very similar in the logical construct, and similar in underlying physics at a phenomenological level. These and all other theories propose a specific form of the constitutive law, Equation (16), and the definition of the structural parameter ϕ, based upon the specific model.
In the free-volume theory a strong case is made for expressing the effective temperature, Teff, in terms of the free-volume νf, by
![Metals 03 00077 i024]() where α is excess thermal expansion (αliq − αglass, Figure 13) and νg is the volume per atom at Tg [68]. Here νf is determined from the macroscopic volume of the system, not the microscopic free-volume element which provides mobility. The ratio, νf/νg, is of the order of 10−2. So the ratio, ν*/νf, where ν* is the minimum free-volume to accept an atom (ν*~νg), is large, about 40. Diffusivity is given by
where α is excess thermal expansion (αliq − αglass, Figure 13) and νg is the volume per atom at Tg [68]. Here νf is determined from the macroscopic volume of the system, not the microscopic free-volume element which provides mobility. The ratio, νf/νg, is of the order of 10−2. So the ratio, ν*/νf, where ν* is the minimum free-volume to accept an atom (ν*~νg), is large, about 40. Diffusivity is given by
![Metals 03 00077 i025]() where ζ~1 [68]. Thus the free-volume theory nicely explains why a small change in νf gives rise to a large change in diffusivity. The change in νf due to the structural relaxation is less than one percent [3], but has profound effects on the properties.
where ζ~1 [68]. Thus the free-volume theory nicely explains why a small change in νf gives rise to a large change in diffusivity. The change in νf due to the structural relaxation is less than one percent [3], but has profound effects on the properties.


In the STZ theory Teff is defined by
![Metals 03 00077 i026]() where n∞(χ) is the equilibrium STZ density, v0 is the atomic (molecular) volume, χ = kBTeff/eZ, and eZ is the STZ formation energy. Because increasing n(χ) results in the increase in volume through lattice anharmonicity, vf and n(χ) may be describing the same physical state of the system, in spite of the differences in the model. For instance free-volume could well be just a parameter to describe the STZ density, not necessarily the physical free-volume. It appears that the connection between ϕ and the microscopic state of the system is a separate subject which needs more work through experiment and simulation. It is most likely that the relationship among different structural parameters depend also on details of the material. For instance the relevance of free-volume in the deformation mechanism depends upon the lattice anharmonicity of the interatomic potential as discussed below.
where n∞(χ) is the equilibrium STZ density, v0 is the atomic (molecular) volume, χ = kBTeff/eZ, and eZ is the STZ formation energy. Because increasing n(χ) results in the increase in volume through lattice anharmonicity, vf and n(χ) may be describing the same physical state of the system, in spite of the differences in the model. For instance free-volume could well be just a parameter to describe the STZ density, not necessarily the physical free-volume. It appears that the connection between ϕ and the microscopic state of the system is a separate subject which needs more work through experiment and simulation. It is most likely that the relationship among different structural parameters depend also on details of the material. For instance the relevance of free-volume in the deformation mechanism depends upon the lattice anharmonicity of the interatomic potential as discussed below.

In general the constitutive law may be written as
![Metals 03 00077 i027]() where 1/τ0 is the attempt frequency, γ0 is the strain unit which is of the order of unity, R± is the jump probability for forward (+) and backward (−) jump, and n± is the density of defects at forward or backward position. In the free-volume theory [7],
where 1/τ0 is the attempt frequency, γ0 is the strain unit which is of the order of unity, R± is the jump probability for forward (+) and backward (−) jump, and n± is the density of defects at forward or backward position. In the free-volume theory [7],
![Metals 03 00077 i028]() where ΔGm is the height of the potential barrier for motion. Thus,
where ΔGm is the height of the potential barrier for motion. Thus,
![Metals 03 00077 i029]() For small σ Equation (29) becomes linear in σ, and the Newtonian behavior is recovered.
For small σ Equation (29) becomes linear in σ, and the Newtonian behavior is recovered.


Now a non-linear behavior is caused by the feedback from strain to ϕ. In the free-volume theory the rate of increase for free-volume is given by
![Metals 03 00077 i030]() where S = 2G(1 + ν)/(1 −ν), and ν is the Poisson’s ratio. In the STZ theory [89,90] the feedback equation is
where S = 2G(1 + ν)/(1 −ν), and ν is the Poisson’s ratio. In the STZ theory [89,90] the feedback equation is
![Metals 03 00077 i031]() where
where ![Metals 03 00077 i051]() is the attempt frequency, and is given by
is the attempt frequency, and is given by
![Metals 03 00077 i032]() where ρ (z) is of the order of unity in the liquid state, and decreases quickly below Tg, and σ0 was found to be the yield stress at low temperatures. In either theory the constitutive law and the feedback equation have to be solved self-consistently to produce the answer.
where ρ (z) is of the order of unity in the liquid state, and decreases quickly below Tg, and σ0 was found to be the yield stress at low temperatures. In either theory the constitutive law and the feedback equation have to be solved self-consistently to produce the answer.


 is the attempt frequency, and is given by

These theories have been successful in reproducing the deformation behavior. Figure 18 shows the stress-strain curve predicted by the shear-transformation-zone (STZ) theory [90], which nicely explains the stress overshoot and its temperature dependence. The key here is the competition between the strain rate ![Metals 03 00077 i048]() , and the structural relaxation rate, 1/τα., to change ϕ, in this case the STZ density n(χ). At low temperatures 1/τα is slower than
, and the structural relaxation rate, 1/τα., to change ϕ, in this case the STZ density n(χ). At low temperatures 1/τα is slower than ![Metals 03 00077 i048]() , so that ϕ cannot follow the stress, and overshooting occurs. After the yield stress is reached, however, n(χ) quickly increases and softening takes place. The steady-state flow is achieved with a newly stabilized effective temperature χ, which is much higher than the initial real temperature. At high temperatures 1/τα is faster than
, so that ϕ cannot follow the stress, and overshooting occurs. After the yield stress is reached, however, n(χ) quickly increases and softening takes place. The steady-state flow is achieved with a newly stabilized effective temperature χ, which is much higher than the initial real temperature. At high temperatures 1/τα is faster than ![Metals 03 00077 i048]() , so that n(χ) can follow the stress without overshooting. In fact the same happens if the temperature is kept constant and the strain rate is varied. Strain localization and stress overshoot happens when
, so that n(χ) can follow the stress without overshooting. In fact the same happens if the temperature is kept constant and the strain rate is varied. Strain localization and stress overshoot happens when ![Metals 03 00077 i048]() is high enough [90]. In this sense the strain localization and the formation of shear band depends on the experimental condition.
is high enough [90]. In this sense the strain localization and the formation of shear band depends on the experimental condition.
, and the structural relaxation rate, 1/τα., to change ϕ, in this case the STZ density n(χ). At low temperatures 1/τα is slower than , so that ϕ cannot follow the stress, and overshooting occurs. After the yield stress is reached, however, n(χ) quickly increases and softening takes place. The steady-state flow is achieved with a newly stabilized effective temperature χ, which is much higher than the initial real temperature. At high temperatures 1/τα is faster than , so that n(χ) can follow the stress without overshooting. In fact the same happens if the temperature is kept constant and the strain rate is varied. Strain localization and stress overshoot happens when is high enough [90]. In this sense the strain localization and the formation of shear band depends on the experimental condition.
Figure 18.
Theoretical stress-strain curves by the shear-transformation-zone (STZ) theory [90]. At low temperatures and high strain rates stress overshooting occurs.
Figure 18.
Theoretical stress-strain curves by the shear-transformation-zone (STZ) theory [90]. At low temperatures and high strain rates stress overshooting occurs.

The mode-coupling theory (MCT) was formulated in order to explain the rapid rise in the relaxation time as the glass transition is approached from high temperatures [91]. But it can be extended to describe the mechanical response through the constitutive law,
![Metals 03 00077 i033]() where G(τ,
where G(τ, ![Metals 03 00077 i048]() ) is the time-dependent transient dynamical shear modulus, and vσ is a coupling constant [91,92]. G(τ,
) is the time-dependent transient dynamical shear modulus, and vσ is a coupling constant [91,92]. G(τ, ![Metals 03 00077 i048]() ) is approximated by ψ2(t), where ψ(t) is the density correlation function,
) is approximated by ψ2(t), where ψ(t) is the density correlation function,
![Metals 03 00077 i034]() where ρq(t) is the q component of the density function. As the value of q usually the position of the maximum in the structure function, S(Q), is used. The function ψ(t) can be calculated using the MCT. This extension allows the shear viscosity of a liquid to be calculated with the MCT [92,93].
where ρq(t) is the q component of the density function. As the value of q usually the position of the maximum in the structure function, S(Q), is used. The function ψ(t) can be calculated using the MCT. This extension allows the shear viscosity of a liquid to be calculated with the MCT [92,93].
 ) is the time-dependent transient dynamical shear modulus, and vσ is a coupling constant [91,92]. G(τ, ) is approximated by ψ2(t), where ψ(t) is the density correlation function,

In the free-volume theory the value of vf is determined by experiment. Similarly S(Q) is usually imported from experimental results. In the STZ theory n(χ) is determined through fitting of the theory to experimental data on mechanical properties. In principle it is possible to compare them in the same sample. For instance the effective temperature can be determined for each value of other structural parameters, such as S(Q). The effective temperatures thus determined for the same sample may not be the same. It will be an interesting project of research.
5.2. Atomistic Models of Mechanical Deformation
5.2.1. Nature of “Structural Defects” in Glasses
Crystalline solids mechanically fail through motion of lattice defects, such as dislocations at low temperatures and vacancies and grain boundaries at high temperatures. Naturally various defect models were proposed as the deformation mechanism in metallic glasses. Free-volume [7] and distributed free-volume [86] are the most widely used defect models. However, there are important distinctions between the defects in crystalline materials and “defects” in glasses. The crystalline lattice has a long-range order, and is fundamentally unyielding. In order to create a flow in a crystalline solid the topological long-range order has to be broken by defects. In terms of the topology of atomic connectivity the defect is clearly distinct from the lattice.
A glass, on the other hand, is just an extremely slow liquid. The glass transition is not a phase transition, but merely a crossover point where the relaxation time of the system exceeds the experimental time-scale. Therefore flow can be induced simply by reducing the relaxation time by increasing the effective temperature. A liquid state is characterized by distributed local topology of atomic connectivity, such as the local coordination number, as discussed below. The distribution can be changed continuously, which corresponds to varying the effective temperature continuously.
Because the local structure varies from an atom to another the local response to external stress is heterogeneous; some atoms are more easily moved than others. In that sense it is reasonable to call more mobile atoms as “defects”. However, these “defects” are not separated from “non-defects” in a clearly distinguishable way. We have to define some cut-off in the continuous distribution of some structural parameter to define them. For instance in the free-volume model the minimum size of the space where an atom can move in, ν*, is the cut-off to define the free-volume [68]. In general we can think of a local effective temperature which corresponds to the specific local structure, and define the area with the local Teff higher than the cut-off value, Teff(defect), as defects. Defect is a useful concept even in glasses, but we have to be careful about the arbitrary nature of definition and judicious about the use of this concept. Below we review some of the most widely used concepts of defects, namely the free-volume and shear-transformation-zone, and introduce a more recent concept of defects based upon the atomic-level stresses.
5.2.2. Free-Volume Mechanism
Volume is one of the physical properties easier to measure, and is the most intuitive structural parameter to express the effective temperature. It has long been recognized that volume increases more rapidly with temperature in liquids compared to glasses (Figure 13), and the excess volume due to the extra thermal expansion, free-volume, in the liquid is directly related to diffusivity, through the works of Batschinski [94], Doolittle [95], and Williams, Landel and Ferry [96]. But the series of papers by Cohen and Turnbull [68,97,98] established this idea as the free-volume theory of diffusion in the liquid state. Free-volume is similar to vacancy in the lattice, and only when the local free-volume exceeds the critical value mentioned above, ν*, atom can move into the local free-volume.
Spaepen [7] extended this idea to the description of plastic deformation, noting that any atomic transport, including shear deformation, requires local free-volume. Even though in a homogeneous system volume responds directly only to pressure and not to shear stress, in an inhomogeneous system volume can locally couple to the shear stress. However, the free-volume theory was developed for the hard-sphere systems, such as organic liquids. Metallic solids are not hard-sphere-like, because the interatomic potential for metals are dominated by the Friedel oscillation [27], and is thus more harmonic [99]. This point was already recognized by Cohen and Turnbull in the original paper who noted that in metallic systems atoms are compressive, so the ν*/ν0 ratio is ~0.1, smaller by an order of magnitude compared to the hard-sphere systems [68]. Thus the microscopic picture of the free-volume theory needs modifications when it is applied to metallic system.
For instance, the effect of the externally applied pressure on the strength is very small, so the strengths in compression and tensile tests are practically the same [100], even though a strong dependence is expected for the standard free-volume mechanism. As Cohen and Turnbull already noted [68] the pressure dependence of diffusivity in metallic liquids is much weaker than predicted by the free-volume theory [101,102]. An argument in defense of the free-volume theory for this pressure effect is that the pressure applied externally to the glass does not change the amount of free-volume in the glass, because the glass is already frozen and does not reach the equilibrium state under pressure. However, this argument is incorrect. As we discussed above, the mechanical strength is determined by the flow stress, because the flow is initiated always by extrinsic defects such as inclusions. During the flow the shear deformation rate is equal to the inverse of the relaxation time, so the system has time to respond to pressure to increase the free-volume in the flowing liquid. Thus the flow stress, therefore the strength, should depend on external pressure in the free-volume theory. The fact that the strength does not depend on pressure [100] implies weak sensitivity of the flow mechanism to pressure, a signature not consistent with the original free-volume picture.
The small value of the ν*/ν0 ratio is consistent with the observation that a vacancy is unstable in metallic glasses, and breaks up into smaller volumes [103]. The idea of “distributed free-volume” was first proposed by Argon along this line [86]. However, once the free-volume is distributed into small pieces there is no need of preserving the concept of original free-volume. It becomes the same as the modified free-volume theory with a small value of the ν*/ν0 ratio. Now when the ν*/ν0 ratio is small the original idea that an atom can move into this space becomes unrealistic, because such an action will require a large amount of energy. So in the “distributed free-volume” picture the volume aspect is not important any more. It is just a region which is easier to shear. So the concept evolved into the idea of shear-transformation-zone, STZ [104], the region where shear transformation occurs.
Another problem is that the fraction of the free-volume, νf/ν0, is small, and amounts only to a few percent. Free-volume is reminiscent of a vacancy in the lattice. In crystalline solids, the density of lattice defects is very low, but because they are topologically very different from the matrix and highly mobile they totally control the mechanical deformation. In glasses, however, defects are different from the matrix only quantitatively, but not qualitatively. Thus it is unlikely that a small number of defects can carry the entire load of deformation. The density of “defects” estimated by the topological fluctuation theory [43] and the elastic deformation as discussed above (Equation (14)) [42] is about ρdef = 24%, larger by an order of magnitude compared to the free-volume. This is because in the topological fluctuation theory both negative and positive density fluctuations (free-volume and anti-free-volume) are considered [13,14,43]. On the other hand if we use ν*/ν0 = 0.1 [68] and define the defect density by νf/ν*, then it is the same order of magnitude as ρdef above. In the topological fluctuation theory the defects are defined by the volume strain larger than 0.11 [43]. This value is close to the ν*/ν0 ratio for metallic liquids [68].
In spite of various problems in practice the free-volume theory works well, because, as we pointed out above, the theoretical structure of the free-volume theory is similar to other theories, such as the STZ theory, even when different microscopic mechanisms are assumed. When parameters are chosen appropriately it can describe the experimental results quite well. In converse, however, the success of the free-volume theory in reproducing experimental results does not justify the physical reality of the model.
5.2.3. Shear-Transformation-Zones (STZ) Theory
For the STZ concept the “volume” character is less important, but weakness of resistance to shear, or low local shear modulus, is the main characteristics. Johnson and Samwer [105] used the STZ theory in the framework of the energy landscape theory [106] to explain the magnitude and temperature dependence of the yielding strain in a number of metallic glasses. They made a number of assumptions to develop the theory, but came to the conclusion that the STZ is made of about 100 atoms or more, a rather large number of atoms. From what we know today, however, this number is a gross overestimate and the actual size of the STZ is much smaller as we discuss below. As we found in Equation (22) the stress dependence of the potential barrier cannot be described by the activation volume model as they did in [105]. The activation volume concept is valid when the defect is clearly distinct from the matrix and has a well-defined volume. But STZ is buried in the matrix, and the concept of activation volume probably is a poor approximation. Also a simple sinusoidal model of the local potential landscape which is directly related to the yield strain cannot be justified. This model needs to be reassessed with the aid of realistic simulation.
The STZ theory by Langer and Falk [89,90] does not even refer to free-volume. It is not specific about the detailed physical state of STZ, except that it is the site where atomic rearrangements, such as bond-switching as in Figure 8, take place. As the structural parameter the effective temperature, Equation (25), is used instead of free-volume. The STZ theory is successful not only in reproducing the macroscopic deformation behavior but also the internal friction, as shown in Figure 19a [107], as well as the stress-driven viscous behavior of a liquid (Figure 16a) [108,109] as shown in Figure 19b. Note that the results shown in Figure 16a and reproduced in Figure 19b include data for liquids at temperatures much above Tg. A liquid behaves like a solid up to the time-scale of the Maxwell relaxation time, τM. On the other hand the time-scale of the STZ, the time it takes for the system to make a jump over the STZ barrier, is of the order of ps. Therefore the STZ theory should be valid down to the time-scale of ps. For this reason even though the STZ theory was created for glass the STZ apparently works for supercooled liquids as well.
Figure 19.
(a) G'(ω)/G∞ (red) and G''(ω)/G∞ (blue) for a metallic glass. Experimental values ( ![Metals 03 00077 i057]() ) [107], and theoretical fit by the STZ theory (lines) [105]. (b) Flow stress s, plotted against the strain rate, q, at various temperatures. Circles are by simulation (Figure 16a [60]), and lines are by the STZ theory [108].
) [107], and theoretical fit by the STZ theory (lines) [105]. (b) Flow stress s, plotted against the strain rate, q, at various temperatures. Circles are by simulation (Figure 16a [60]), and lines are by the STZ theory [108].
 ) [107], and theoretical fit by the STZ theory (lines) [105]. (b) Flow stress s, plotted against the strain rate, q, at various temperatures. Circles are by simulation (Figure 16a [60]), and lines are by the STZ theory [108].
Figure 19.
(a) G'(ω)/G∞ (red) and G''(ω)/G∞ (blue) for a metallic glass. Experimental values ( ![Metals 03 00077 i057]() ) [107], and theoretical fit by the STZ theory (lines) [105]. (b) Flow stress s, plotted against the strain rate, q, at various temperatures. Circles are by simulation (Figure 16a [60]), and lines are by the STZ theory [108].
) [107], and theoretical fit by the STZ theory (lines) [105]. (b) Flow stress s, plotted against the strain rate, q, at various temperatures. Circles are by simulation (Figure 16a [60]), and lines are by the STZ theory [108].
) [107], and theoretical fit by the STZ theory (lines) [105]. (b) Flow stress s, plotted against the strain rate, q, at various temperatures. Circles are by simulation (Figure 16a [60]), and lines are by the STZ theory [108].
5.2.4. Mode-Coupling Theory
As mentioned above the mode-coupling theory can be extended to account for the flow behavior of a liquid under shear stress. Indeed the results shown in Figure 16a, Figure 19b were nicely reproduced by the MCT [93]. In the MCT the structural parameter is S(Q), the structure function, which can be measured by experiment [40,41], computed by simulation, or calculated by theory [110]. In the case of hard-sphere systems which do not have an energy-scale, thus temperature, the physical density plays the role of ϕ. Because the MCT is a phenomenological theory its atomistic base is unclear. The physical details of the “slow mode” coupling to which produces increase in viscosity remain unspecified. It is interesting to see how other atomistic theories or simulation will provide the basis for the MCT.
5.2.5. Local Configurational Excitations
It is very difficult to characterize the structure of liquids and glasses because of the absence of symmetry and their strong disorder. The most common method is to consider the topology of atomic connectivity, by defining the nearest neighbors [111,112,113]. Even in metallic systems, where chemical bonds are usually weak, the nearest neighbors are reasonably well-separated from the second nearest neighbors in the PDF. During the simulation of flow under shear stress [24] we found that the process of the nearest neighbor becoming the second neighbor (bond-cutting) and that of the second nearest neighbor becoming the nearest neighbor (bond-creation) were always characterized by sharp jump in the interatomic distance as shown in Figure 20. The jump is even sharper if the inherent structure [59] was calculated at every step of the way. Thus bond cutting/creation is a well-defined process of change in atomic connectivity.
Figure 20.
Typical changes in the interatomic distance as a bond between i and j is broken (red symbol) and a bond is formed among the common neighbors of i and j (green symbol). The horizontal line is the cut-off line between the first and the second nearest neighbors [24].
Figure 20.
Typical changes in the interatomic distance as a bond between i and j is broken (red symbol) and a bond is formed among the common neighbors of i and j (green symbol). The horizontal line is the cut-off line between the first and the second nearest neighbors [24].

The nearest neighbors are usually defined by the Voronoi construction [111,112]. A drawback of this method is that often a small face in the Voronoi polyhedron is counted as the basis for the additional nearest neighbor, even when the atom is actually far way. Because the PDF shows a deep minimum between the first and second peaks, most of the time we use a simpler procedure of defining the nearest neighbor by the position of the PDF minimum.
In covalent glasses, such as amorphous silicon or silicate, chemistry places strong restriction on local topology. In such a case it is natural to define defects as deviations from dominant topology, for instance from the ring statistics [114,115]. In metallic systems, however, the local topology has wide distribution without a dominant one. In this case it is much more difficult, or less meaningful, to define defects from the topology alone, and the physical properties have to be taken into consideration. A direct relation is known to exist between the local topology of atomic connectivity and the atomic-level stresses [13]. For instance the coordination number, NC, is linearly related to the atomic-level pressure [14]. If one places an atom A with radius rA in a glass of atom B with radius rB, the average coordination number of A depends on the ratio, x = rA/rB [116]. In converse, if a B atom is placed in the site where A atom is happy, the B atom will be under pressure. This is the origin of the atomic-level pressure. When the atomic-level stresses were defined the purpose was to define the defect in terms of the excessive stress level [13]. However, the correlation between the stress and the magnitude of local displacement under shear is not strong. It is possible that not the stress itself but its gradient, which is related to the elastic incompatibility [16], is more important in triggering the local deformation event.
Nevertheless, local topology of atomic connectivity was found to be the key in defining the local deformation event. It was found that during the shear flow right after a bond oriented in the compressive direction (~45° away from the direction of the shear flow) is cut, a new bond is formed in the perpendicular direction (inset of Figure 21a [24]), resulting in the bond exchange as in Figure 8. The time delay between the two actions, cutting and forming, is of the order of 10−13 s, much shorter than the Maxwell relaxation time, and is comparable to the time for a sound wave to travel from one atom to the nearest neighbor (Figure 21a). Therefore this action to produce bond exchange is a coupled action through the elastic field, and should be considered as one local configurational excitation (LCE). We now define the lifetime of local topology, tLT, as the time to lose or gain ONE nearest neighbor atom, because by losing or gaining one neighbor the local topology of that atom is changed. The simulation result in Figure 21b [24] shows that ![Metals 03 00077 i052]() . Because
. Because ![Metals 03 00077 i053]() , this means connected to the lifetime of local topology, a microscopic quantity. The factor of 1/2 reflects the fact that two topology actions, bond cutting and bond creation, are coupled. This shows that the bond exchange shown in Figure 8 is indeed the elementary atomistic mechanism of deformation.
, this means connected to the lifetime of local topology, a microscopic quantity. The factor of 1/2 reflects the fact that two topology actions, bond cutting and bond creation, are coupled. This shows that the bond exchange shown in Figure 8 is indeed the elementary atomistic mechanism of deformation.
 . Because
  , this means connected to the lifetime of local topology, a microscopic quantity. The factor of 1/2 reflects the fact that two topology actions, bond cutting and bond creation, are coupled. This shows that the bond exchange shown in Figure 8 is indeed the elementary atomistic mechanism of deformation.
 Figure 21.
(a) Distribution of the delay time between cutting the bond A–B and forming the bond C–D. τ0 = 0.761 × 10⁻¹³ s [24]. (b) Instantaneous strain, σ/G∞, compared to the atomic level strains, ![Metals 03 00077 i054]() (nearest neighbor strain) and
(nearest neighbor strain) and ![Metals 03 00077 i055]() (strain due to local topology) [24]. See [24] and text for the meaning.
(strain due to local topology) [24]. See [24] and text for the meaning.
 (nearest neighbor strain) and
  (strain due to local topology) [24]. See [24] and text for the meaning.
Such local configurational excitations are the elementary unit of STZ. However, LCE distorts the glass locally, resulting in strong stress field. This stress field triggers another LCE in the immediate neighborhood, and produces cascade of LCE actions as shown in Figure 22. The time-scale for the cascade is a few 100 fs shorter than the time-scale for each LCE (~100 fs). There are many reports of chain-like action for diffusion [117], but in our view they are cascade action, and are not dynamic collective mode. Indeed the time-scale of dynamic heterogeneity [117,118,119] is much longer than τLT.
Figure 22.
Location where atomic bonds are cut during the shear flow for ![Metals 03 00077 i048]() = 0.001 τ0−1 at 300 K, within two intervals of 250 fs (= 3.29 τ0, τ0 = 0.761 × 10⁻¹³ s). The progress in time is shown by color. The cut bonds are clustered suggesting cascade chain reactions. Here the bond lifetime is 81 τ0. The size of the box is 59.34 × 10 × 59.34 Å3. This figure was generated from the model used in [24].
= 0.001 τ0−1 at 300 K, within two intervals of 250 fs (= 3.29 τ0, τ0 = 0.761 × 10⁻¹³ s). The progress in time is shown by color. The cut bonds are clustered suggesting cascade chain reactions. Here the bond lifetime is 81 τ0. The size of the box is 59.34 × 10 × 59.34 Å3. This figure was generated from the model used in [24].
= 0.001 τ0−1 at 300 K, within two intervals of 250 fs (= 3.29 τ0, τ0 = 0.761 × 10⁻¹³ s). The progress in time is shown by color. The cut bonds are clustered suggesting cascade chain reactions. Here the bond lifetime is 81 τ0. The size of the box is 59.34 × 10 × 59.34 Å3. This figure was generated from the model used in [24].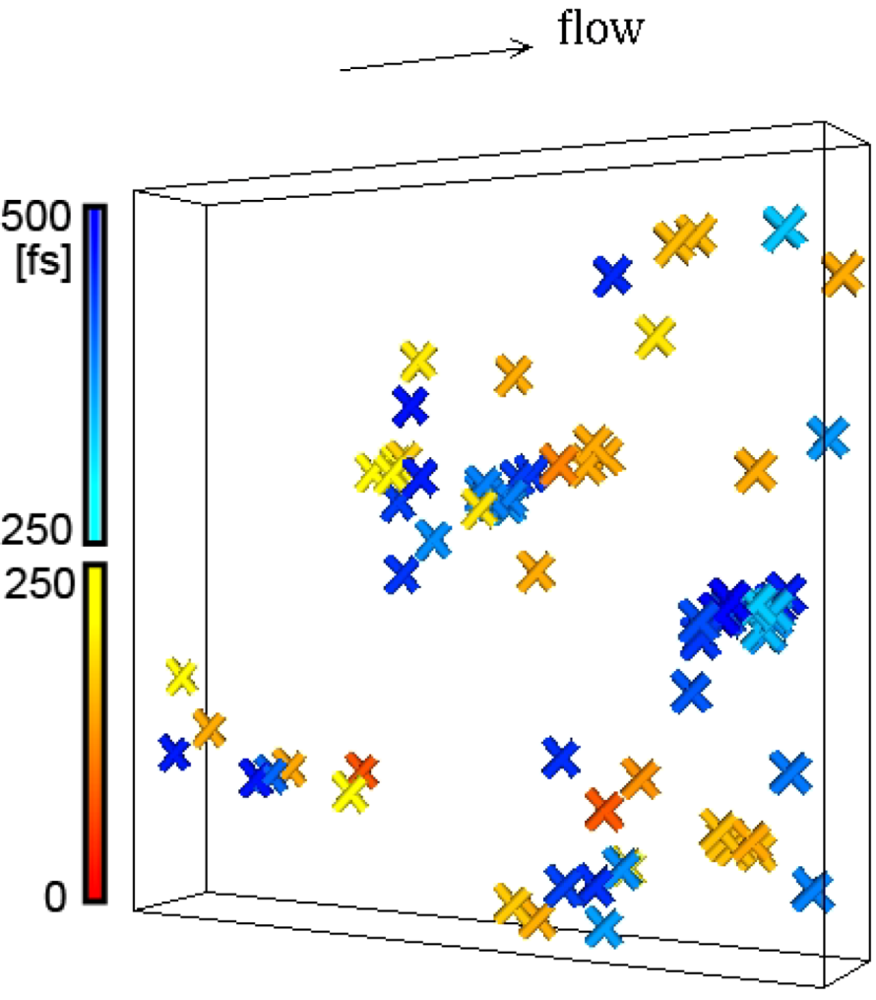
5.2.6. Atomic Structure during the Flow
Because a liquid under shear flow can sustain a shear stress, its structure cannot be isotropic, but should resemble that of a solid under stress. This is indeed the case, and as shown in Figure 23 the anisotropic PDF of the liquid under shear is nearly proportional to ![Metals 03 00077 i040]() , as is the case for elastic deformation. A liquid, however, respond elastically only within the time-scale of τM. Accordingly the elastic structural change cannot be long-range, but is limited to a finite lengthscale [24]. The spatial extension of the elastically deformed region ζ, depends on both temperature and shear rate. The temperature dependence is weak; ζT = 10.56 Å at 300 K, 10.85 Å at 500 K, 11.06 Å at 700 K, and 11.12 Å at 900 K. But ζ, depends significantly on the shear rate at high rates, and ζ extrapolates to zero at a critical shear rate,
, as is the case for elastic deformation. A liquid, however, respond elastically only within the time-scale of τM. Accordingly the elastic structural change cannot be long-range, but is limited to a finite lengthscale [24]. The spatial extension of the elastically deformed region ζ, depends on both temperature and shear rate. The temperature dependence is weak; ζT = 10.56 Å at 300 K, 10.85 Å at 500 K, 11.06 Å at 700 K, and 11.12 Å at 900 K. But ζ, depends significantly on the shear rate at high rates, and ζ extrapolates to zero at a critical shear rate, ![Metals 03 00077 i056]() . This is also related to the communication via the sound waves. At very high shear rates the local structure changes faster than the time for a sound wave to travel from one atom to another, so communication cannot be achieved, and elastic correlation does not have time to develop.
. This is also related to the communication via the sound waves. At very high shear rates the local structure changes faster than the time for a sound wave to travel from one atom to another, so communication cannot be achieved, and elastic correlation does not have time to develop.
, as is the case for elastic deformation. A liquid, however, respond elastically only within the time-scale of τM. Accordingly the elastic structural change cannot be long-range, but is limited to a finite lengthscale [24]. The spatial extension of the elastically deformed region ζ, depends on both temperature and shear rate. The temperature dependence is weak; ζT = 10.56 Å at 300 K, 10.85 Å at 500 K, 11.06 Å at 700 K, and 11.12 Å at 900 K. But ζ, depends significantly on the shear rate at high rates, and ζ extrapolates to zero at a critical shear rate,  . This is also related to the communication via the sound waves. At very high shear rates the local structure changes faster than the time for a sound wave to travel from one atom to another, so communication cannot be achieved, and elastic correlation does not have time to develop.
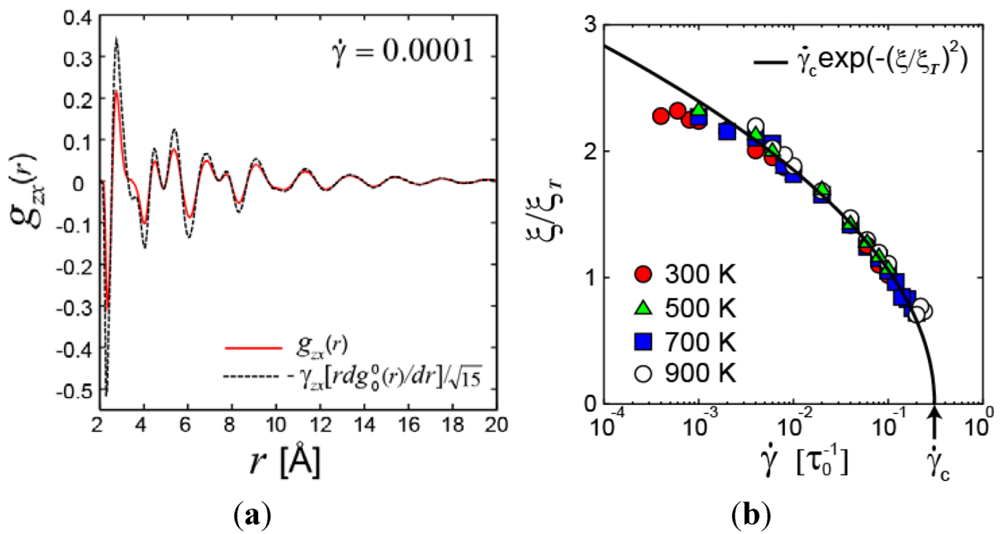
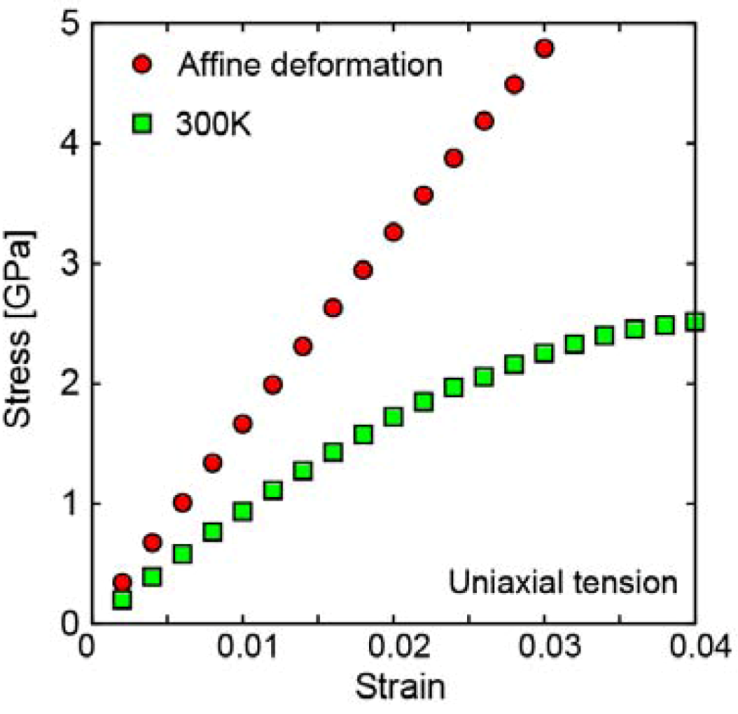
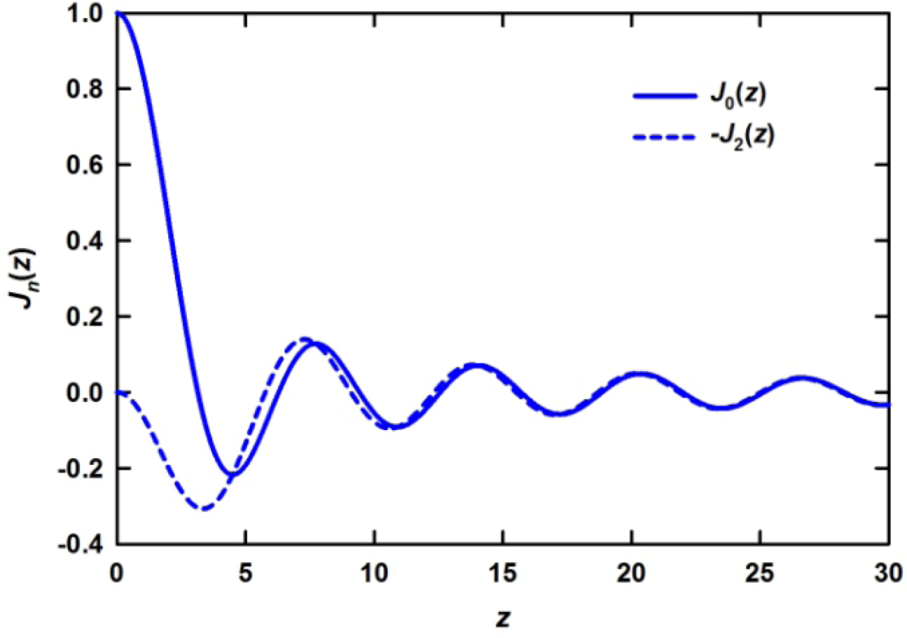
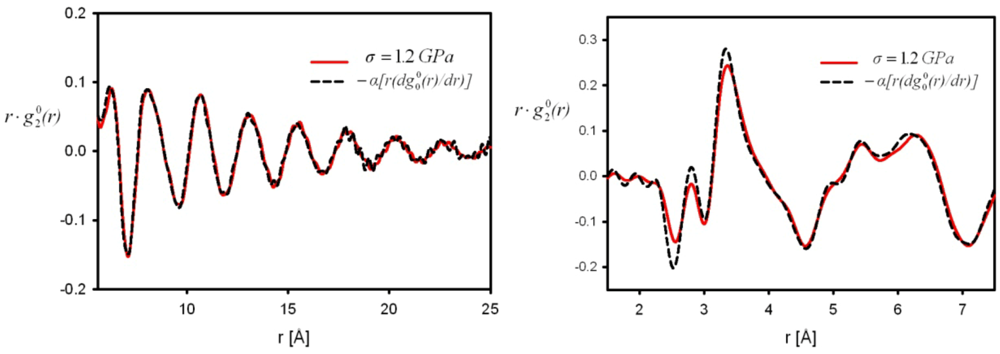
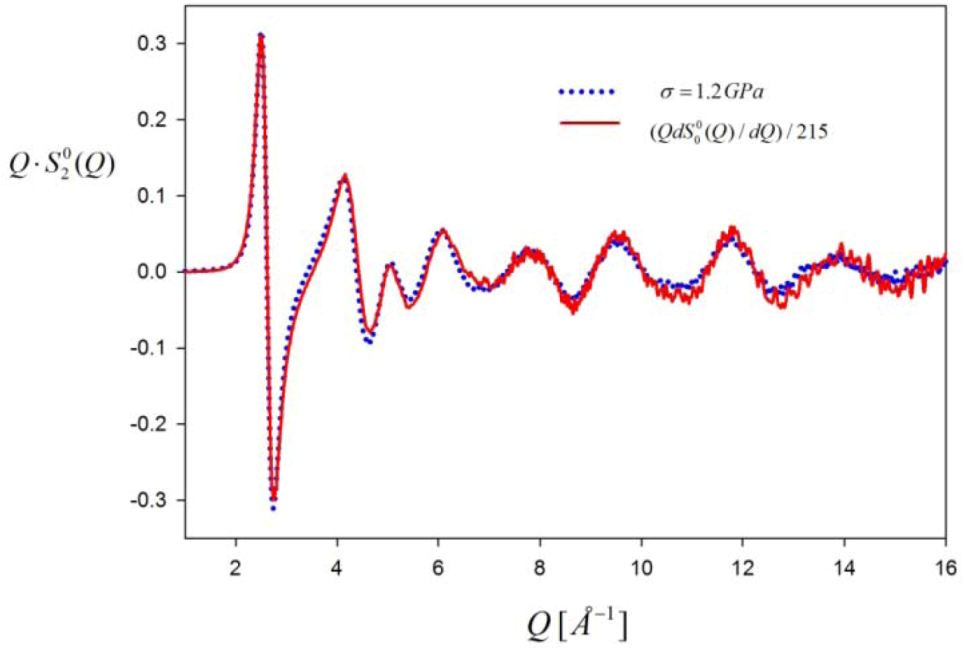
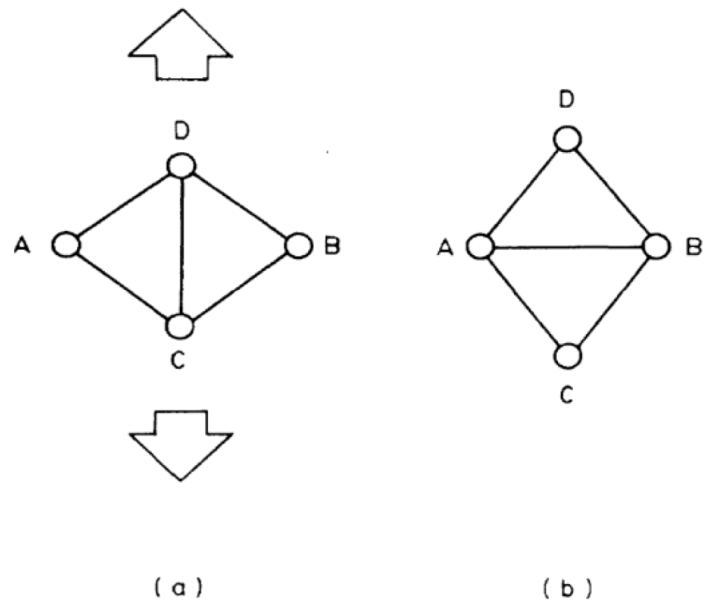
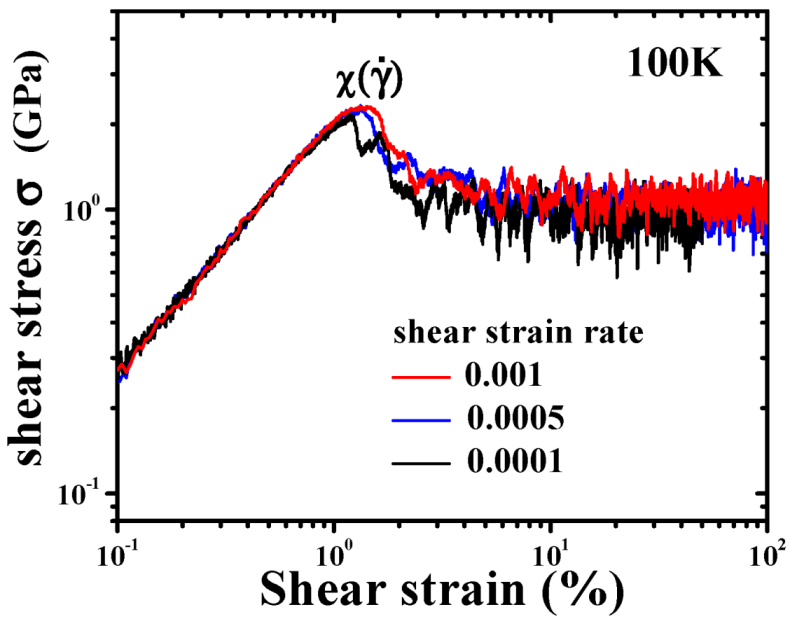
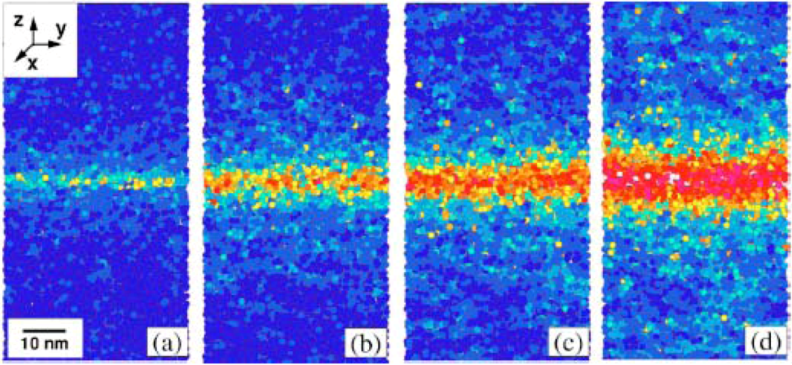
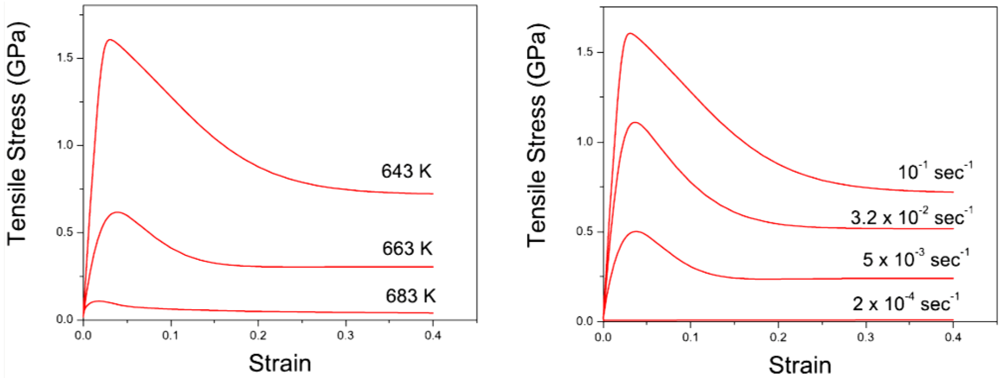
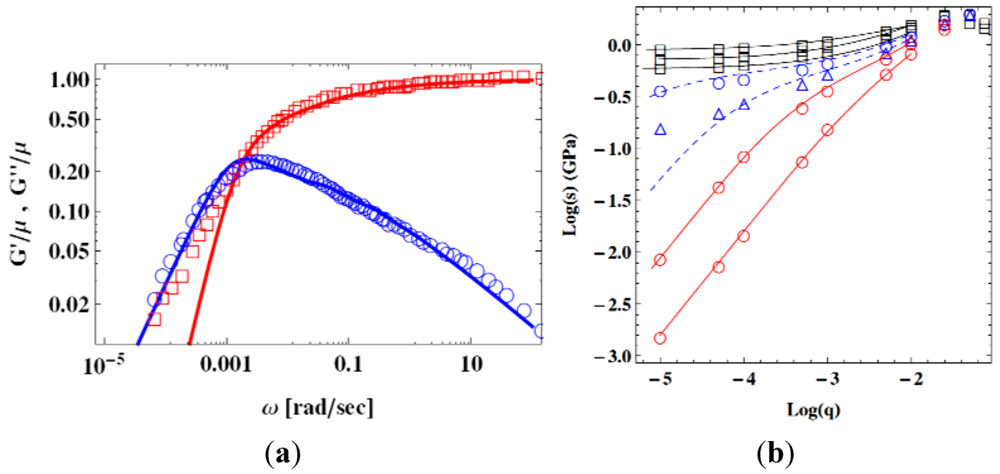
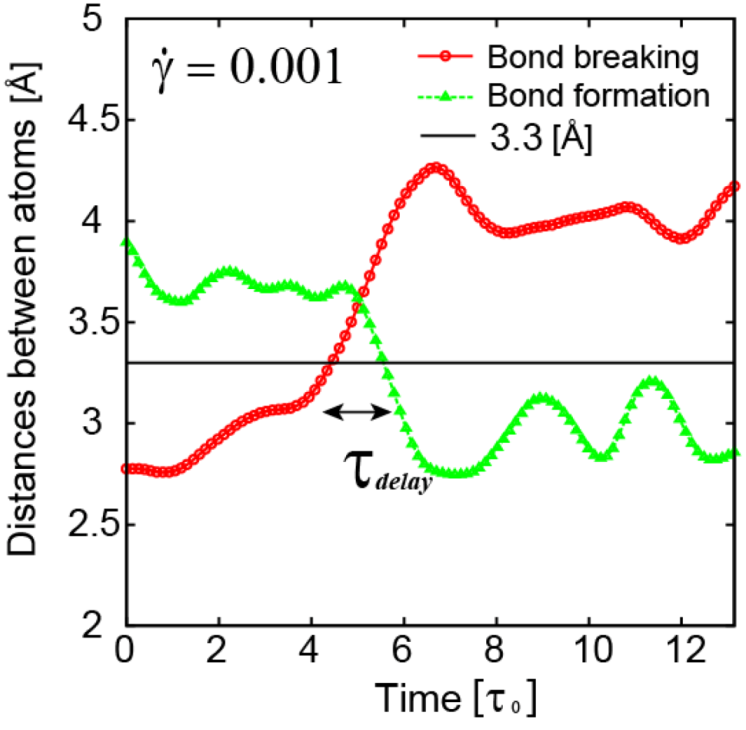
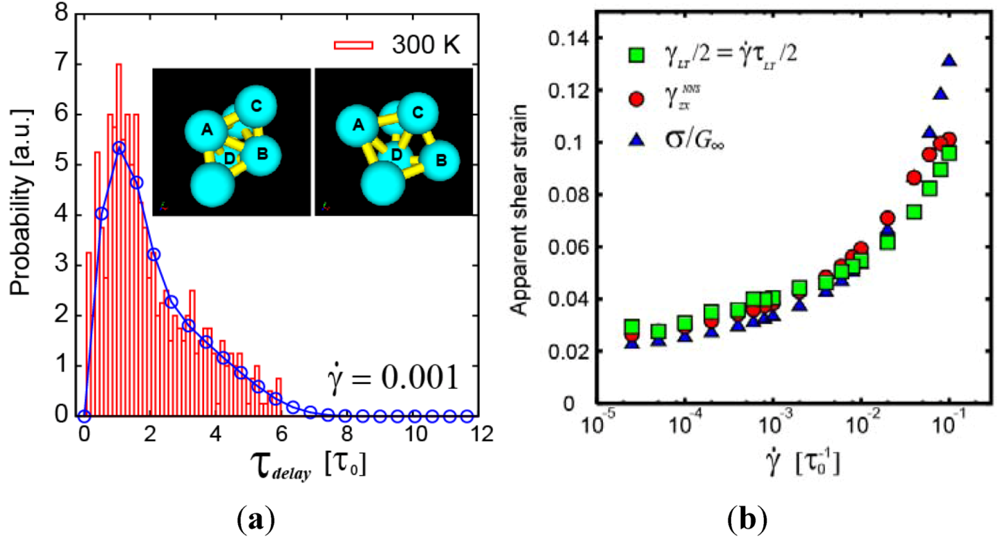
6. Conclusions
At a first look the mechanical properties of metallic glasses do not appear to reflect the disordered nature of the atomic structure, because they seem to be superficially similar to those of crystalline metals. Upon a closer look, however, we recognize that the structure has profound and intricate effects on the mechanical properties. This is because at the atomic level the local response of a metallic glass to the external stress field is strongly heterogeneous. Even in the case of elastic response to a uniform stress the local compliance is not uniform. And yet each local portion of the system cannot independently respond to the stress, because they are connected to each other, and thus have to satisfy the elastic compatibility condition. Similarly in plastic deformation local structural changes create long-range stress fields and affect each other, as a consequence of satisfying the elastic compatibility condition. In addition local structural changes alter the effective, or fictive, temperature. Here we reviewed recent advances in our understanding of such unique features of elastic, anelastic and plastic deformation of metallic glasses, focusing on the atomic-level phenomena. A large amount of researches on the mesoscopic behavior, such as the effect of shear bands, are not included in this review, even though they are important in understanding the actual behavior of a macroscopic sample.
Many issues remain poorly understood, and several competing theories are used by different researchers. Different theories define the effective temperature in its own way. In the free-volume theory it is expressed as free-volume (Equation (24)), whereas in the STZ theory it represents the STZ density (Equation (26)). In the MCT the structure factor, S(Q), plays that role. They are nearly linearly related to each other, thus they are practically equivalent. In each case it is a phenomenological parameter in the equation, and the connection to the microscopic details is not obvious. This point has to be clarified by further simulations and experiments.
One issue we particularly emphasized in this article is the role and nature of the defects. Because crystalline solids fail due to the motion of lattice defects much effort has been directed to define the defects in metallic glasses. In glasses, however, defects are not topologically distinct. They are those at the edges of wide distribution of the local states, with the cut-off in some parameter which is chosen by taking the properties into account. They are a part of the structure which is in equilibrium at the effective temperature. Therefore the critical parameter is the effective temperature, and the physical reality of the defects is of secondary importance to the success of the theory in reproducing the data. That is why various theories, such as the free-volume theory and the STZ theory, are equally successful, even though they are based on quite different microscopic mechanisms. Conversely, successful reproduction of the data for macroscopic experiments does not guarantee the correctness of the microscopic picture in the theory. After all microscopic details can be determined only either by microscopic experiments or by atomic-level simulation. Because of the complex nature of the atomic structure a truly microscopic theory of deformation in metallic glasses is yet to be developed.
On the other hand macroscopic defects, such as inclusions, play an important role in initiating the local plastic flow and formation of shear bands. That is why the flow stress, not the local yield stress, determines the strength of a bulk metallic glass. Ironically because the flow stress is an intrinsic property, not affected by extrinsic defects, mechanical failure of a metallic glass is an intrinsic behavior, a consequence of the stress-induced glass transition.
Acknowledgments
The authors are grateful for useful discussions with J. S. Langer, M. L. Falk, J.-L. Barrat, S. Yip, E. George, H. Bei, J. R. Morris, E. Ma, M. W. Chen and K. Kelton. This research was supported by the U.S. Department of Energy, Basic Energy Sciences, Materials Sciences and Engineering Division. X-ray diffraction experiments were carried out at the 1-ID beamline of the APS which is funded by the U.S. Department of Energy (DOE), Office of Science, under Contract No. DE-AC02-06CH11357.
Conflict of Interest
The authors declare no conflict of interest.
References
- Chen, H.S.; Wang, T.T. Mechanical properties of metallic glasses of PdSi based alloys. J. Appl. Phys. 1970, 41, 5338–5339. [Google Scholar]
- Masumoto, T.; Maddin, R. The mechanical properties of palladium 20 a/o silicon alloy quenched from the liquid state. Acta Metall. 1971, 19, 725–741. [Google Scholar] [CrossRef]
- Chen, H.H. Glassy metals. Rep. Prog. Phys. 1980, 43, 353–432. [Google Scholar] [CrossRef]
- Ashby, M.F.; Greer, A.L. Metallic glasses as structural materials. Scr. Mater. 2006, 54, 321–326. [Google Scholar] [CrossRef]
- Anderson, P.W. Through the glass lightly. Science 1995, 267, 1615. [Google Scholar]
- Weaire, D.; Ashby, M.F.; Logan, J.; Weins, M.J. On the use of pair potentials to calculate the properties of amorphous metals. Acta Metall. 1971, 19, 779–788. [Google Scholar]
- Spaepen, F. A microscopic mechanism for steady state inhomogeneous flow in metallic glasses. Acta Metall. 1977, 25, 407–415. [Google Scholar] [CrossRef]
- Inoue, A.; Zhang, T.; Masumoto, T. Al-La-Ni amorphous alloys with a wide supercooled liquid region. Mater. Trans. JIM 1989, 30, 965–972. [Google Scholar]
- Peker, A.; Johnson, W.L. A highly processable metallic glass: Zr41.2Ti13.8Cu12.5Ni10.0Be22.5. Appl. Phys. Lett. 1993, 63, 2342–2344. [Google Scholar] [CrossRef]
- Born, M.; Huang, K. Dynamical Theory of Crystal Lattices; Clarendon Press: Oxford, UK, 1954. [Google Scholar]
- Davis, L.A. Mechanics of Metallic Glasses. In Rapidly Quenched Metals; Giessen, G., Ed.; MIT: Cambridge, MA, USA, 1976; pp. 369–391. [Google Scholar]
- Hashin, Z.; Shtrikman, S. A variational approach to the theory of the elastic behavior of multiphase materials. J. Mech. Phys. Solids 1963, 11, 127–140. [Google Scholar] [CrossRef]
- Egami, T.; Maeda, K.; Vitek, V. Structural defects in amorphous solids: A computer simulation study. Philos. Mag. A 1980, 41, 883–901. [Google Scholar] [CrossRef]
- Egami, T.; Srolovitz, D. Local fluctuations in amorphous and liquid metals: A simple theory of glass transition. J. Phys. F 1982, 12, 2141–2163. [Google Scholar] [CrossRef]
- Egami, T.; Ojha, M.; Nicholson, D.M.; Louzguine-Luzgin, D.; Chen, N.; Inoue, A. Glass formability and Al-Au system. Philos. Mag. A 2012, 92, 655–665. [Google Scholar] [CrossRef]
- Kröner, E. Continuum Theory of Defects. In Les Houches, Session XXXV, 1980—Physics of Defects; Balian, R., Kléman, M., Poirier, J.-P., Eds.; North-Holland: Dordrecht, The Netherland, 1981; pp. 215–315. [Google Scholar]
- Maloney, C.E.; Robbins, M.O. Evolution of displacements and strains in sheared amorphous solids. J. Phys. Cond. Mat. 2008, 20, 244128. [Google Scholar] [CrossRef]
- Tsamados, M.; Tanguy, A.; Goldenberg, C.; Barrat, J.-L. Local elasticity map and plasticity in a model Lennard-Jones glass. Phys. Rev. E 2009, 80, 026112. [Google Scholar] [CrossRef]
- Suzuki, Y.; Egami, T. Shear deformation of glassy metals: Breakdown of cauchy relationship and anelasticity. J. Non-Cryst. Solids 1985, 75, 361–366. [Google Scholar]
- Papakonstantopoulos, G.J.; Riggleman, R.A.; Barrat, J.-L.; de Pablo, J.J. Molecular plasticity of polymeric glasses in the elastic regime. Phys. Rev. E 2008, 77, 041502. [Google Scholar] [CrossRef]
- Suzuki, Y.; Haimovich, J.; Egami, T. Bond-orientational anisotropy in metallic glasses observed by X-ray diffraction. Phys. Rev. B 1987, 35, 2162–2168. [Google Scholar] [CrossRef]
- Tomida, T.; Egami, T. Molecular-dynamics study of structural anisotropy and anelasticity in metallic glasses. Phys. Rev. B 1993, 48, 3048–3057. [Google Scholar] [CrossRef]
- Dmowski, W.; Egami, T. Observation of structural anisotropy in metallic glasses induced by mechanical deformation. J. Mater. Res. 2007, 22, 412–418. [Google Scholar] [CrossRef]
- Iwashita, T.; Egami, T. Atomic mechanism of flow in simple liquids under shear. Phys. Rev. Lett. 2012, 108, 196001. [Google Scholar] [CrossRef]
- Srolovitz, D.; Maeda, K.; Vitek, V.; Egami, T. Structural defects in amorphous solids; Statistical analysis of a computer model. Phil. Mag. A 1981, 44, 847–866. [Google Scholar] [CrossRef]
- Dzugutov, M. Glass-formation in a simple monoatomic liquid with icosahedral inherent local order. Phys. Rev. A 1992, 46, R2984–R2987. [Google Scholar] [CrossRef]
- Hafner, J. From Hamiltonian to Phase Diagrams; Springer-Verlag: Berlin, Germany, 1987. [Google Scholar]
- Poulsen, H.F.; Wert, J.A.; Neuefeind, J.; Honkimäki, V. Measuring strain distributions in amorphous materials. Nat. Mater. 2004, 4, 33–36. [Google Scholar]
- Hufnagel, T.C.; Ott, R.T.; Almer, J. Structural aspects of elastic deformation of a metallic glass. Phys. Rev. B 2006, 73, 064204. [Google Scholar]
- Wang, X.D.; Bednarcik, J.; Saksl, K.; Franz, H.; Cao, Q.P.; Jiang, J.Z. Tensile behavior of bulk metallic glasses by in situ Z-ray diffraction. Appl. Phys. Lett. 2007, 91, 081913. [Google Scholar]
- Das, J.; Bostrom, M.; Mattern, N.; Kvick, A.; Yavari, A.R.; Greer, A.L.; Eckert, J. Plasticity in bulk metallic glasses investigated via the strain distribution. Phys. Rev. B 2007, 76, 092203. [Google Scholar]
- Stoica, M.; Das, J.; Bednarcik, J.; Franz, H.; Mattern, N.; Wang, W.H.; Eckert, J. Strain distribution in Zr64.13Cu15.75Ni10.12Al10 bulk metallic glass investigated by in situ tensile tests under synchrotron radiation. J. Appl. Phys. 2008, 104, 013522. [Google Scholar]
- Wilson, T.; Clausen, B.; Proffen, T.; Elle, J.; Brown, D. In situ neutron scattering measurement of stress-strain behavior of a bulk metallic glass. Metall. Mater. Trans. A 2008, 39A, 1942–1946. [Google Scholar]
- Mattern, N.; Bednarcik, J.; Pauly, S.; Wang, G.; Das, J.; Eckert, J. Structural evolution of Cu–Zr metallic glasses under tension. Acta Mater. 2009, 57, 4133–4139. [Google Scholar] [CrossRef]
- Wang, D.; Bednarcik, J.; Franz, H.; Lou, H.B.; He, Z.H.; Cao, Q.P.; Jiang, J.Z. Local strain behavior of bulk metallic glasses under tension studied by in situ x-ray diffraction. Appl. Phys. Lett. 2009, 94, 011911. [Google Scholar]
- Sato, S.; Suzuki, H.; Shobu, T.; Imafuku, M.; Tsuchiya, Y.; Wagatsuma, K.; Kato, H.; Setyawan, A.D.; Saida, J. Atomic-scale characterization of elastic deformation of Zr-based metallic glass under tensile stress. Mater. Trans. 2010, 51, 1381–1385. [Google Scholar] [CrossRef]
- Stoica, M.; Das, J.; Bednarcik, J.; Wang, G.; Vaughan, G.; Wang, W.H.; Eckert, J. Mechanical response of metallic glasses: Insights from in situ high energy X-ray diffraction. JOM 2010, 62, 76–82. [Google Scholar]
- Vempati, U.K.; Valavala, P.K.; Falk, M.L.; Almer, J.; Hufnagel, T.C. Length-scale dependence of elastic strain from scattering measurements in metallic glasses. Phys. Rev. B 2012, 85, 214201. [Google Scholar]
- Ma, D.; Stoica, A.D.; Wang, X.-L.; Lu, Z.P.; Clausen, B.; Brown, D.W. Elastic moduli inheritance and the weakest link in bulk metallic glasses. Phys. Rev. Lett. 2012, 108, 085501. [Google Scholar] [CrossRef]
- Warren, B.E. X-Ray Diffraction; Dover: New York, NY, USA, 1969. [Google Scholar]
- Egami, T.; Billinge, S.J.L. Underneath the Bragg Peaks: Structural Analysis of Complex Materials; Elsevier Ltd.: Oxford, UK, 2003. [Google Scholar]
- Dmowski, W.; Iwashita, T.; Chuang, C.-P.; Almer, J.; Egami, T. Elastic heterogeneity in metallic glasses. Phys. Rev. Lett. 2010, 105, 205502. [Google Scholar] [CrossRef]
- Egami, T.; Poon, S.J.; Zhang, Z.; Keppens, V. Glass transition in metallic glasses: A microscopic model of topological fluctuations in the bonding network. Phys. Rev. B 2007, 76, 024203. [Google Scholar]
- Maddin, R.; Masumoto, T. The deformation of amorphous palladium-20 at % silicon. Mater. Sci. Eng. 1972, 9, 153–162. [Google Scholar] [CrossRef]
- Berry, B.S.; Pritchet, W.C. Magnetic annealing and directional ordering of an amorphous ferromagnetic alloy. Phys. Rev. Lett. 1975, 34, 1022–1025. [Google Scholar] [CrossRef]
- Egami, T.; Dmowski, W.; Kosmetatos, P.; Boord, M.; Tomida, T.; Oikawa, E.; Inoue, A. Deformation induced bond orientational order in metallic glasses. J. Non-Cryst. Solids 1995, 192–193, 591–594. [Google Scholar]
- Schuh, C.A.; Huffnagel, T.C.; Ramamurty, U. Mechanical behavior of amorphous alloys. Acta Matall. 2007, 55, 4067–4109. [Google Scholar] [CrossRef]
- Trexler, M.M.; Thadhani, N.N. Mechanical properties of bulk metallic glasses. Prog. Mater. Sci. 2010, 55, 759–839. [Google Scholar] [CrossRef]
- Suryanarayana, C.; Inoue, A. Bulk Metallic Glasses; CRC Press: Boca Raton, FL, USA, 2011. [Google Scholar]
- Ashby, M.F. A first report on deformation-mechanism maps. Acta Metall. 1972, 20, 887–897. [Google Scholar] [CrossRef]
- Argon, A.S. Mechanisms of inelastic deformation in metallic glasses. J. Phys. Chem. Solids 1982, 43, 945–961. [Google Scholar] [CrossRef]
- Volkert, C.A.; Donohue, A.; Spaepen, F. Effect of sample size on deformation in amorphous metals. J. Appl. Phys. 2008, 103, 083539. [Google Scholar] [CrossRef]
- Schuster, B.E.; Wei, Q.; Hufnagel, T.C.; Ramesh, K.T. Size-independent strength and deformation mode in compression of a Pd-based metallic glass. Acta Matall. 2008, 56, 5091–5100. [Google Scholar] [CrossRef]
- Bei, H.; Lu, Z.P.; Shim, S.; Chen, G.; George, E.P. Specimen size effects on Zr-based bulk metallic glasses investigated by uniaxial compression and spherical nanoindentation. Met. Matall. Trans. A 2010, 41, 1735–1742. [Google Scholar] [CrossRef]
- Morris, J.R.; Bei, H.; Pharr, G.M.; George, E.P. Size effects and stochastic behavior of nanoindentation pop in. Phys. Rev. Lett. 2011, 106, 165502. [Google Scholar] [CrossRef]
- Tian, L.; Cheng, Y.-Q.; Shan, Z.-W.; Li, J.; Wang, C.-C.; Han, X.-D.; Sun, J.; Ma, E. Approaching the ideal elastic limit of metallic glasses. Nat. Commun. 2011, 3. [Google Scholar] [CrossRef] [Green Version]
- Kivelson, D.; Kivelson, S.A.; Zhao, X.; Nussinov, Z.; Torjus, G. A thermodynamic theory of supercooled liquids. Physica A 1995, 219, 27–38. [Google Scholar] [CrossRef]
- Debenedetti, P.; Stillinger, F.H. Supercooled liquids and the glass transition. Nature 2001, 410, 259–267. [Google Scholar]
- Sastry, S.; Debenedetti, P.; Stillinger, F.H. Signatures of distinct dynamical regimes in the energy landscape of a glass-forming liquid. Nature 1998, 393, 554–557. [Google Scholar]
- Guan, P.; Chen, M.W.; Egami, T. On the stress-temperature scaling for steady-state flow in metallic glasses. Phys. Rev. Lett. 2010, 104, 187002. [Google Scholar]
- Egami, T. Structural relaxation in metallic glasses. Ann. N. Y. Acad. Sci. 1981, 37, 238–251. [Google Scholar]
- Dmowski, D.; Yokoyama, Y.; Chuang, A.; Ren, Y.; Umemoto, M.; Tuchiya, K.; Inoue, A.; Egami, T. Structural rejuvenation in a bulk metallic glass induced by severe plastic deformation. Acta Mater. 2010, 58, 429–438. [Google Scholar]
- Egami, T. Structural relaxation in amorphous alloys—Compositional short range ordering. Mat. Res. Bull. 1978, 13, 557–562. [Google Scholar] [CrossRef]
- Morito, N.; Egami, T. Internal friction and reversible structural relaxation in metallic glass Fe32Ni36Cr14P12B6. Acta Metall. 1984, 32, 603–613. [Google Scholar]
- Egami, T. Structural relaxation in amorphous Fe40Ni40P14B6 studied by energy-dispersive X-ray diffraction. J. Mater. Sci. 1978, 13, 2587–2599. [Google Scholar] [CrossRef]
- Egami, T.; Maeda, K.; Srolovitz, D.; Vitek, V. Local atomic structure of amorphous metals. J. de Phys. (Paris) 41, C8-272–C8-274.
- Srolovitz, D.; Egami, T.; Vitek, V. Radial distribution function and structural relaxation in amorphous solids. Phys. Rev. B 1981, 24, 6936–6944. [Google Scholar] [CrossRef]
- Cohen, M.H.; Turnbull, D. Molecular transport in liquids and glasses. J. Chem. Phys. 1959, 31, 1164–1169. [Google Scholar] [CrossRef]
- Kohda, M.; Haruyama, O.; Egami, T. Kinetics of volume and enthalpy relaxation in Pt60Ni15P25 bulk metallic glass. Phys. Rev. B 2010, 81, 092203. [Google Scholar]
- Lewandowski, J.J.; Wnag, W.H.; Greer, A.L. Intrinsic plasticity or brittleness of metallic glasses. Philos. Mag. Lett. 2005, 85, 77–87. [Google Scholar] [CrossRef]
- Gu, X.J.; McDermott, A.G.; Poon, J.; Shiflet, G.J. Critical Poisson’s ratio for plasticity in Fe-Mo-C-B-Ln bulk amorphous steel. Appl. Phys. Lett. 2006, 88, 211905. [Google Scholar]
- Schroers, J.; Johnson, W.L. Ductile bulk metallic glass. Phys. Rev. Lett. 2004, 93, 255506. [Google Scholar] [CrossRef]
- Demetriou, M.D.; Launey, M.E.; Garrett, G.; Schramm, J.P.; Hofmann, D.C.; Johnson, W.L.; Ritchie, R.O. A damage-tolerant glass. Nat. Mater. 2011, 10, 123–128. [Google Scholar]
- Zhang, B.; Zhao, D.Q.; Pan, M.X.; Wnag, W.H.; Greer, A.L. Amorphous metallic plastic. Phys. Rev. Lett. 2005, 94, 205502. [Google Scholar] [CrossRef]
- Yokoyama, Y.; Fujita, K.; Yavari, A.R.; Inoue, A. Malleable hypoeutectic Zr-Ni-Cu-Al bulk glassy alloys with tensile plastic elongation at room temperature. Philos. Mag. Lett. 2009, 89, 322–334. [Google Scholar] [CrossRef]
- Williams, R.S.; Egami, T. Temper Embrittlement of Amorphous Alloys. In Rapidly Quenched Metals III; Cantor, B., Ed.; The Metals Society: London, UK, 1978; Volume 1, pp. 214–220. [Google Scholar]
- Inoue, A.; Fan, C.; Saida, J.; Zhang, T. High-strength Zr-based bulk amorphous alloys containing nanocrystalline and quasicrystalline particles. Sci. Technol. Adv. Mater. 2000, 1, 73–86. [Google Scholar] [CrossRef]
- Pauly, S.; Gorantla, S.; Wang, G.; Kühn, U.; Eckert, J. Transformatio-mediated ductility in CuZr-based bulk metallic glass. Nat. Mater. 2010, 9, 473–477. [Google Scholar]
- Kobayashi, S.; Maeda, K.; Takeuchi, S. Computer simulation of deformation of amorphous Cu57Zr43. Acta Metall. 1980, 28, 1641–1652. [Google Scholar] [CrossRef]
- Srolovitz, D.; Vitek, V.; Egami, T. An atomist study of deformation in amorphous metals. Acta Metall. 1983, 31, 335–352. [Google Scholar] [CrossRef]
- Shi, Y.; Falk, M.L. Stress-induced structural transformation and shear banding during simulated nanoindentation of a metallic glass. Acta Matall. 2007, 55, 4317–4324. [Google Scholar] [CrossRef]
- Li, Q.-K.; Li, M. Atomistic simulations of correlations between volumetric change and shear softening in amorphous metals. Phys. Rev. B 2007, 75, 094101. [Google Scholar] [CrossRef]
- Eyring, H. Viscosity, plasticity, and diffusion as examples of absolute reaction rates. J. Chem. Phys. 1936, 4, 283–291. [Google Scholar] [CrossRef]
- Barrat, J.-L.; Berthier, L. Fluctuation-dissipation relation in a sheared fluid. Phys. Rev. E 2000, 63, 012503. [Google Scholar]
- Berthier, L.; Barrat, J.-L. Shearing a glassy material: Numerical test of nonequilibrium mode-coupling approaches and experimental proposals. Phys. Rev. Lett. 2002, 89, 095702. [Google Scholar] [CrossRef]
- Argon, A.S. Plastic deformation in metallic glasses. Acta Metall. 1979, 27, 47–58. [Google Scholar] [CrossRef]
- Olsson, P.; Teitel, S. Critical scaling of shear viscosity at the jamming transition. Phys. Rev. Lett. 2007, 99, 178001. [Google Scholar] [CrossRef]
- Adam, G.; Gibbs, J.H. On the temperature dependence of cooperative relaxation properties in glass-forming liquids. J. Chem. Phys. 1965, 43, 139–146. [Google Scholar] [CrossRef]
- Falk, M.L.; Langer, J.S. Dynamics of viscoplastic deformation in amorphous solids. Phys. Rev. E 1998, 57, 7192–7205. [Google Scholar] [CrossRef]
- Langer, J.S. Shear-transformation-zone theory of plastic deformation near the glass transition. Phys. Rev. E 2008, 77, 021502. [Google Scholar] [CrossRef]
- Götze, W. Complex Dynamics of Glass-Forming Liquids: Mode-Coupling Theory; Oxford University Press: Oxford, UK, 2009. [Google Scholar]
- Fuchs, M.; Cates, M.E. Theory of nonlinear rheology and yielding of dense colloidal suspensions. Phys. Rev. Lett. 2002, 89, 248304. [Google Scholar] [CrossRef]
- Voigtmann, Th. Yield stresses and flow curves in metallic glass formers and granular systems. Eur. Phys. J. 2011, 34, 106. [Google Scholar]
- Batschinski, A.J. Examination of the inner friction of liquids. I. Z. Physik. Chem. 1913, 84, 643–706. [Google Scholar]
- Doolittle, A.K. Studies of newtonian flow. II. The dependence of the viscosity of liquids on free space. J. Appl. Phys. 1951, 22, 1471–1415. [Google Scholar] [CrossRef]
- Williams, M.L.; Landel, R.F.; Ferry, J.D. Mechanical properties of substances of high molecular weight. 19. The temperature dependence of relaxation mechanisms in amorphous polymers and other glass-forming liquids. J. Am. Chem. Soc. 1955, 77, 3701–3707. [Google Scholar]
- Turnbull, D.; Cohen, M.H. Free-volume model of the amorphous phase: Glass transition. J. Chem. Phys. 1961, 34, 120–125. [Google Scholar] [CrossRef]
- Turnbull, D.; Cohen, M.H. On the free-volume model of the liquid-glass transition. J. Chem. Phys. 1970, 52, 3038–3041. [Google Scholar] [CrossRef]
- Egami, T. Understanding the properties and structure of metallic glasses at the atomic level. J. Metals 2010, 62, 70–75. [Google Scholar]
- Caris, J.; Lewandowski, J.J. Pressure effects on metallic glasses. Acta Matall. 2010, 58, 1026–1036. [Google Scholar] [CrossRef]
- Nachtrieb, N.H.; Petit, J. Self-diffusion in liquid mercury. J. Chem. Phys. 1956, 24, 746–750. [Google Scholar] [CrossRef]
- Klugkist, P.; Rätzke, K.; Rehders, S.; Troche, P.; Faupel, F. Activation volume of Co-57 diffusion in amorphous Co81Zr19. Phys. Rev. Lett. 1998, 80, 3288–3291. [Google Scholar] [CrossRef]
- Bennett, C.H.; Chaudhari, P.; Moruzzi, P.; Steinhardt, P. Stability of vacancy and vacancy clusters in amorphous solids. Philos. Mag. A 1979, 40, 485–495. [Google Scholar] [CrossRef]
- Argon, A.S.; Shi, L.T. Development of visco-plastic deformation in metallic glasses. Acta Metall. 1983, 31, 499–507. [Google Scholar] [CrossRef]
- Johnson, W.L.; Samwer, K. A universal criterion for plastic yielding of metallic glasses with a (T/Tg)2/3 temperature dependence. Phys. Rev. Lett. 2005, 95, 195501. [Google Scholar] [CrossRef]
- Stillinger, F.H. Topographic view of supercooled liquids and glass-formation. Science 1995, 267, 1935–1939. [Google Scholar]
- Bouchbinder, E.; Langer, J.S. Linear response theory for hard and soft glassy materials. Phys. Rev. Lett. 2011, 106, 148301. [Google Scholar] [CrossRef]
- Langer, J.S.; Egami, T. Glass dynamics at high strain rates. Phys. Rev. E 2012, 86, 011502. [Google Scholar] [CrossRef]
- Gauthier, C.; Pelletier, J.M.; Wang, Q.; Blandin, J.J. Viscoelastic and viscoplastic properties of bulk metallic glasses: Comparison with oxide glasses and amorphous polymers. J. Non-Cryst. Solids 2004, 345–346, 469–472. [Google Scholar]
- Percus, J.K.; Yevick, G.J. Analysis of classical statistical mechanics by means of collective coordinates. Phys. Rev. 1958, 110, 1–13. [Google Scholar] [CrossRef]
- Bernal, J.D. A geometrical approach to the structure of liquids. Nature 1959, 183, 141–147. [Google Scholar]
- Finney, J.L. Random packings and the structure of simple liquids. I. The geometry of random close packing. Proc. Roy. Soc. Lond. A 1970, 319, 479–493. [Google Scholar] [CrossRef]
- Honeycutt, J.D.; Andersen, H.C. Molecular dynamics study of melting and freezing of small Lennard-Jones clusters. J. Phys. Chem. 1987, 91, 4950–4963. [Google Scholar] [CrossRef]
- Steinhardt, P.; Alben, R.; Weaire, D. Relaxed continuous random network models. I. Structural characteristics. J. Non-Cryst. Solids 1974, 15, 199–214. [Google Scholar]
- Rivier, N. Disclination lines in glasses. Philos. Mag. A 1979, 40, 859–868. [Google Scholar] [CrossRef]
- Egami, T.; Aur, S. Local atomic structure of amorphous and crystalline alloys: Computer simulation. J. Non-Cryst. Solids 1987, 89, 60–74. [Google Scholar]
- Donati, C.; Douglas, J.F.; Kob, W.; Plimpton, S.J.; Poole, P.H.; Glotzer, S.C. Stringlike cooperative motion in a supercooled liquid. Phys. Rev. Lett. 1998, 80, 2338–2341. [Google Scholar] [CrossRef]
- Yamamoto, R.; Onuki, A. Dynamics of highly supercooled liquids: Heterogeneity, rheology, and diffusion. Phys. Rev. E 1998, 58, 3515–3529. [Google Scholar] [CrossRef]
- Widmer-Cooper, A.; Harrowell, P. Predicting the long-time dynamic heterogeneity in a supercooled liquid on the basis of short-time heterogeneities. Phys. Rev. Lett. 2006, 96, 185701. [Google Scholar] [CrossRef]
© 2013 by the authors; licensee MDPI, Basel, Switzerland. This article is an open access article distributed under the terms and conditions of the Creative Commons Attribution license (http://creativecommons.org/licenses/by/3.0/).
Share and Cite
MDPI and ACS Style
Egami, T.; Iwashita, T.; Dmowski, W. Mechanical Properties of Metallic Glasses. Metals 2013, 3, 77-113. https://doi.org/10.3390/met3010077
AMA Style
Egami T, Iwashita T, Dmowski W. Mechanical Properties of Metallic Glasses. Metals. 2013; 3(1):77-113. https://doi.org/10.3390/met3010077
Chicago/Turabian StyleEgami, Takeshi, Takuya Iwashita, and Wojciech Dmowski. 2013. "Mechanical Properties of Metallic Glasses" Metals 3, no. 1: 77-113. https://doi.org/10.3390/met3010077