Crystallization of Supercooled Liquid Elements Induced by Superclusters Containing Magic Atom Numbers

Abstract
:
1. Introduction
- 2.
- The supercluster formation equations leading to crystallization.
- 2.1.
- Gibbs free energy change associated with growth nucleus formation.
- 2.2.
- Thermal dependence of the energy saving coefficient εnm of an n-atom condensed supercluster.
- 2.3.
- Crystal homogeneous nucleation temperature and effective nucleation temperature.
- 3.
- The model of quantification of the energy saving of superclusters.
- 4.
- Prediction of crystallization temperatures of 38 supercooled liquid elements at constant molar volume.
- 5.
- Homogeneous nucleation of 13-atom superclusters and undercooling rate predictions.
- 6.
- Maximum overheating temperature applied to melt superclusters at constant molar volume.
- 7.
- Electronic properties of Cu, Ag and Au superclusters.
- 8.
- Silver supercluster formation into and out of undercooled liquid.
- 9.
- Melting of Cu, Ag and Au superclusters, varying the overheating temperatures and times.
- 9.1.
- Superheating of Cu, Ag and Au superclusters.
- 9.2.
- Analysis of the influence of Cu superheating time on the undercooling rate.
- 10.
- Conclusions.
2. Supercluster Formation Equations Leading to Crystallization
2.1. Gibbs Free Energy Change Associated with Growth Nucleus Formation
2.2. Thermal Dependence of the Energy Saving Coefficient εnm of an n-Atom Condensed Cluster
2.3. Crystal Homogeneous Nucleation Temperature and Effective Nucleation Temperature
3. Quantification of Energy Saving Associated with Supercluster Formation
4. Prediction of Crystallization Temperatures Tc of 38 Undercooled Liquid Samples of Various Diameters

- Column 1, the liquid elements are classified as a function of their molar fusion entropy ΔSm;
- Column 2, the molar volume of solid elements at Tm in m3;
- Column 3, their fusion entropy ΔSm in J/K/mole, n;
- Column 4, their melting temperature Tm in Kelvin;
- Column 5, the atom magic number n of the supercluster inducing crystallization of the supercooled liquid at the closest temperature to the experimental crystallization temperature;
- Column 6, the supercluster radius Rnm in nanometers deduced from the molar volume Vm using the relation Equation (29):
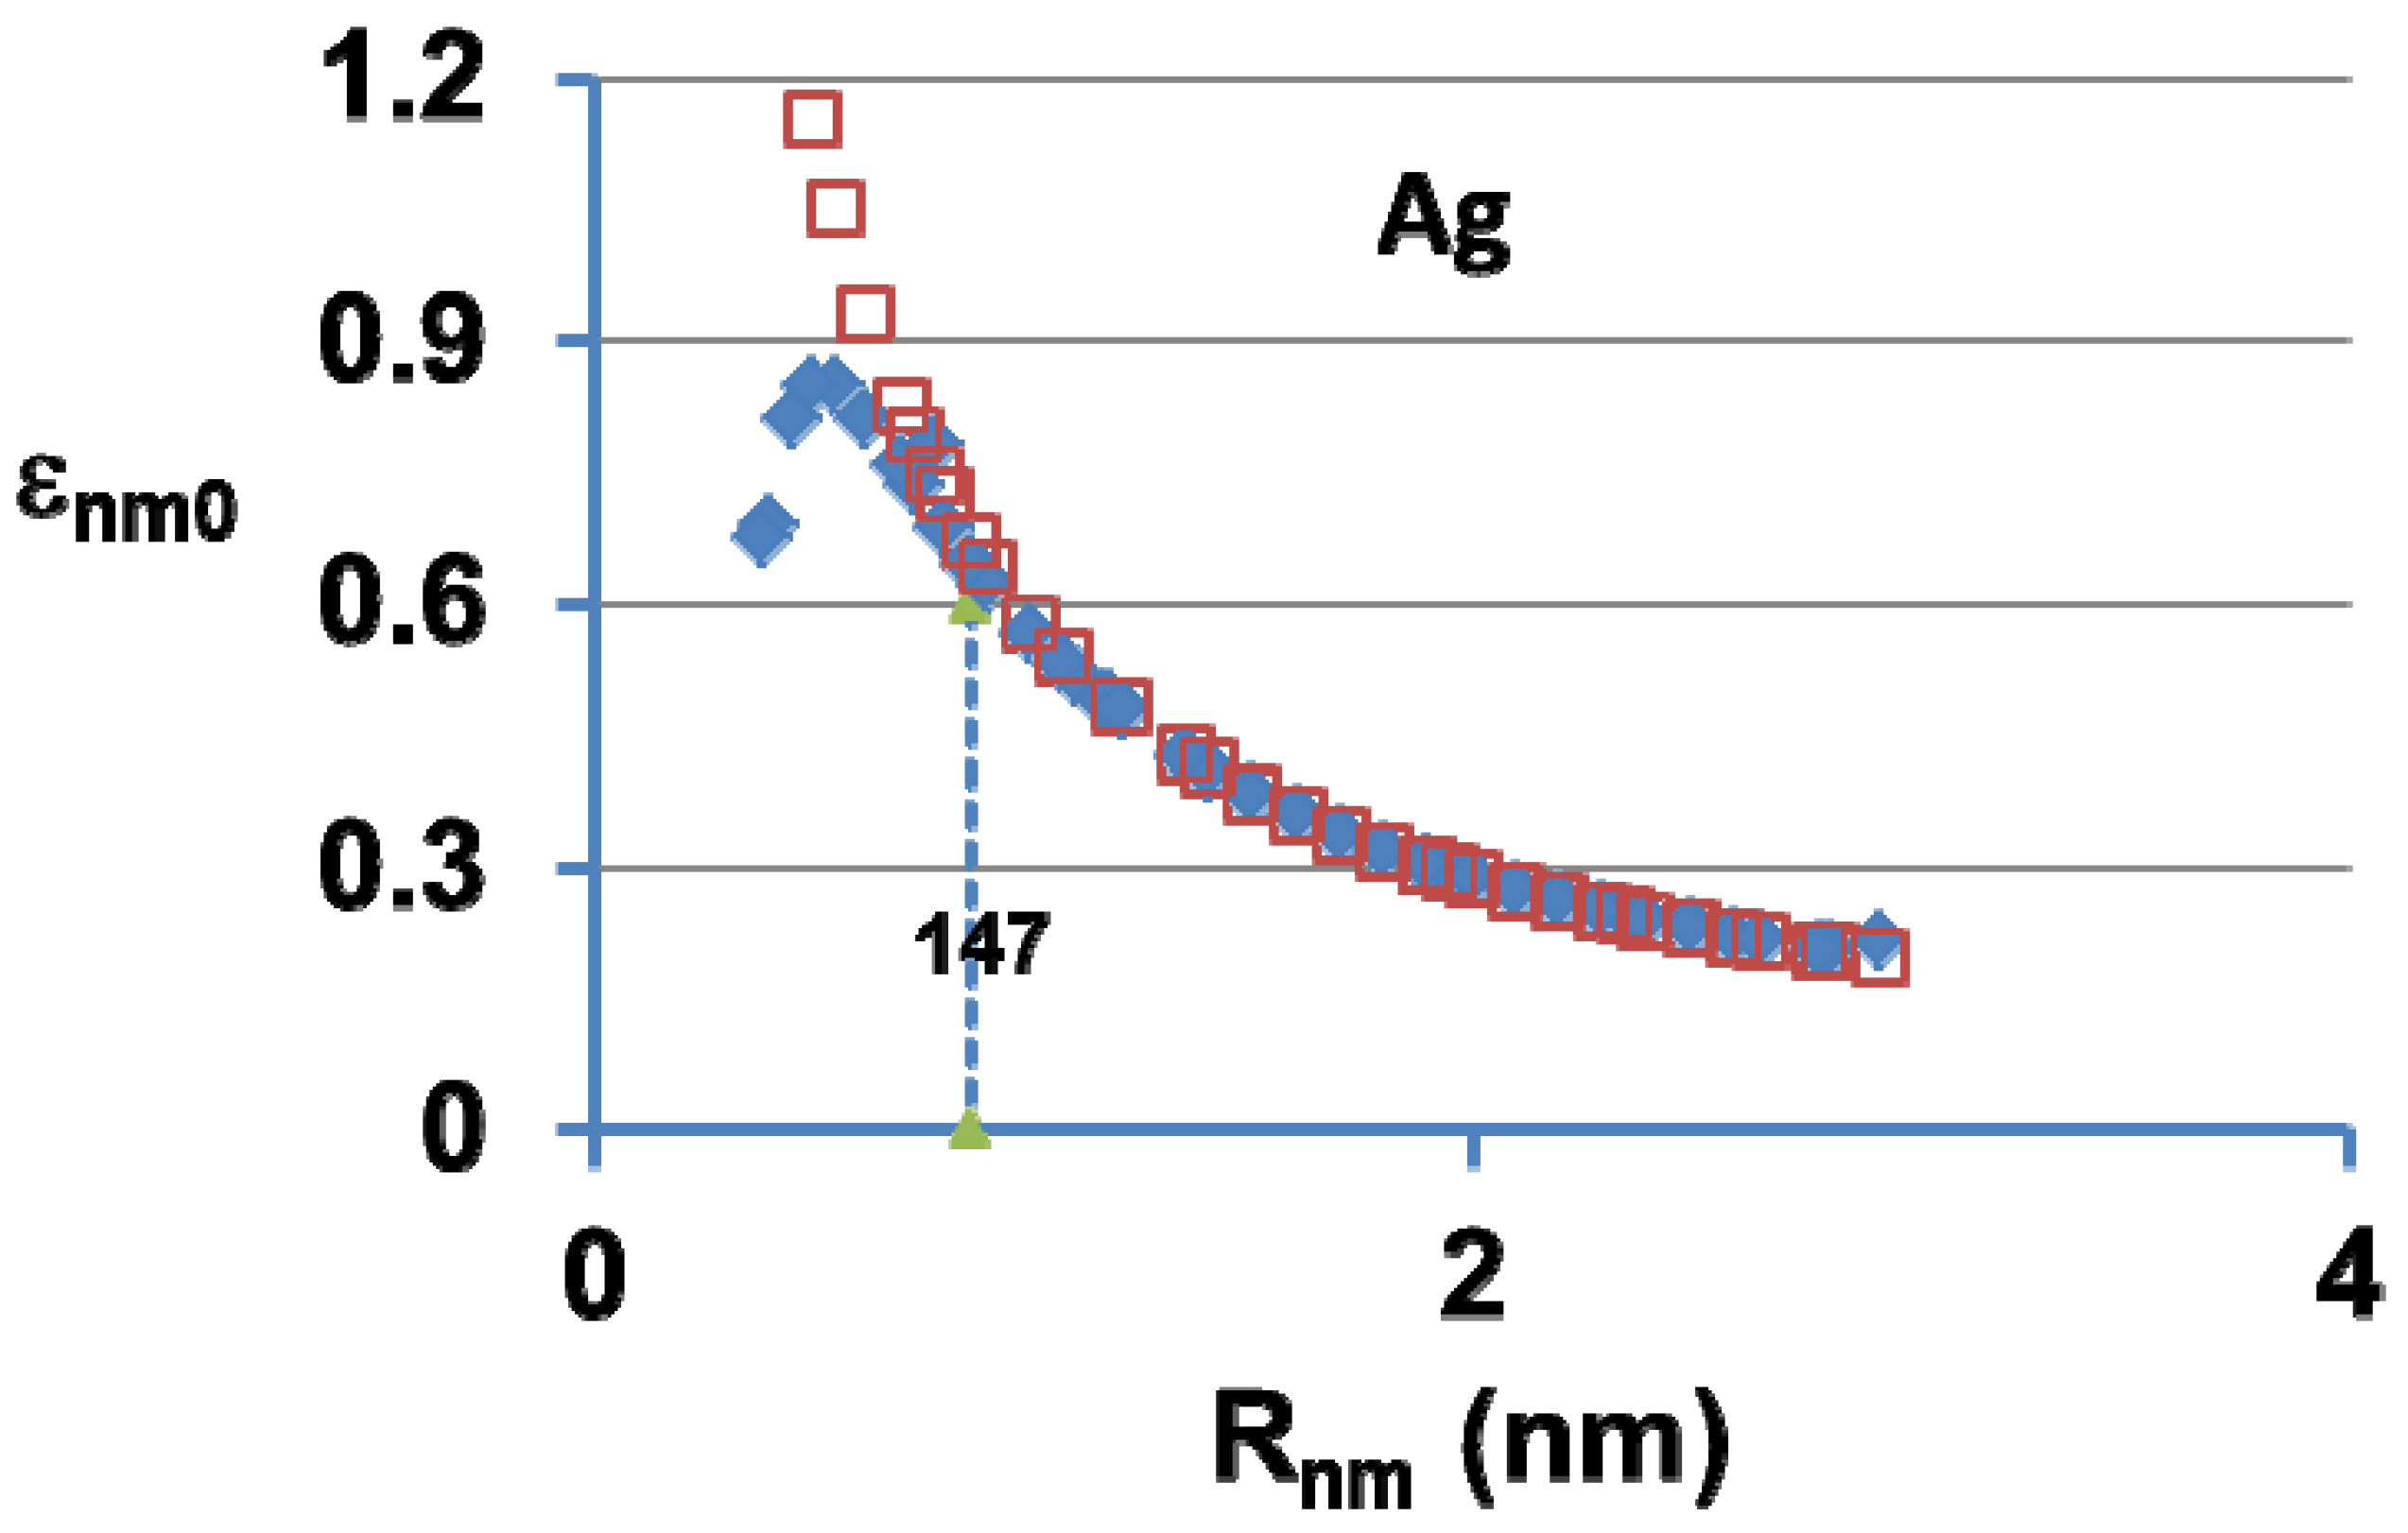
- Column 7, the energy saving coefficient εnm0 associated with the n-atom supercluster calculated using Equation (29) for n ≥ 147 and Equation (27) for n = 13 and 55, with Δz given in Table 2 column 3;
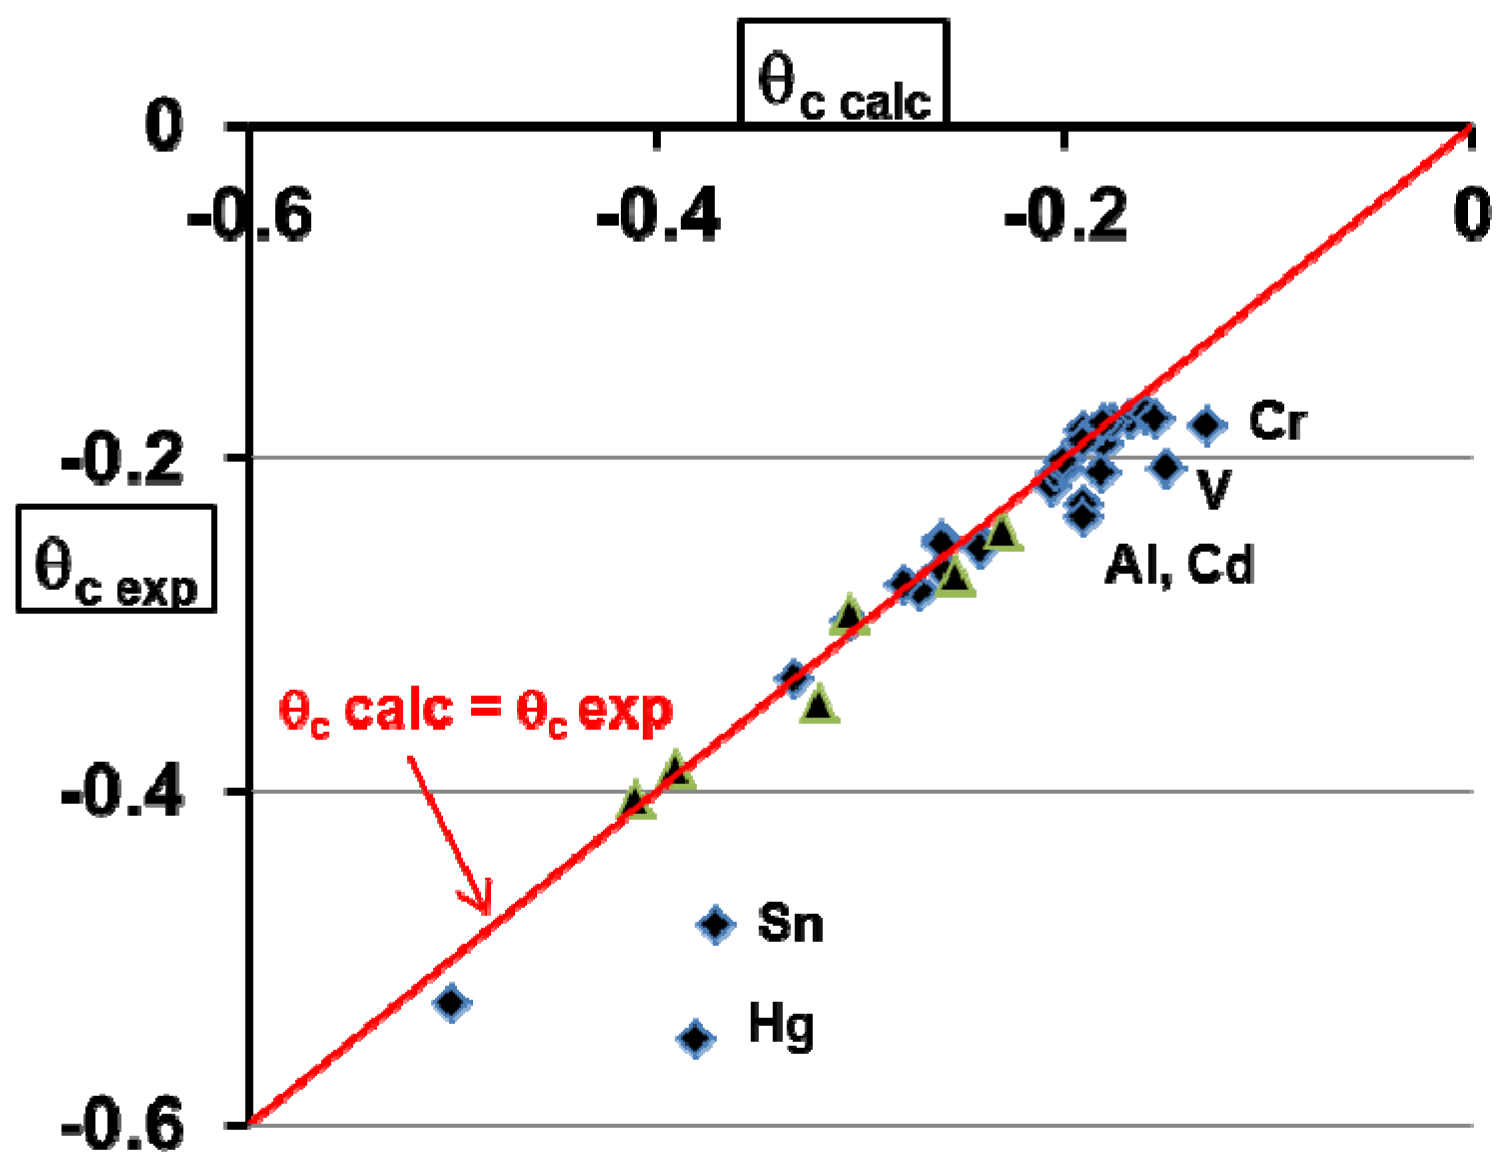
- Column 8, the experimental reduced crystallization temperature θc exp = (Tc − Tm)/Tm of a liquid droplet having a diameter Dexp;
- Column 9, the reduced crystallization temperature θc calc calculated using Equation (21);
- Column 10, the thermally-activated effective energy barrier ΔGeff/kBT given in Equations (21) and (20) leading to the crystallization of the corresponding liquid element;
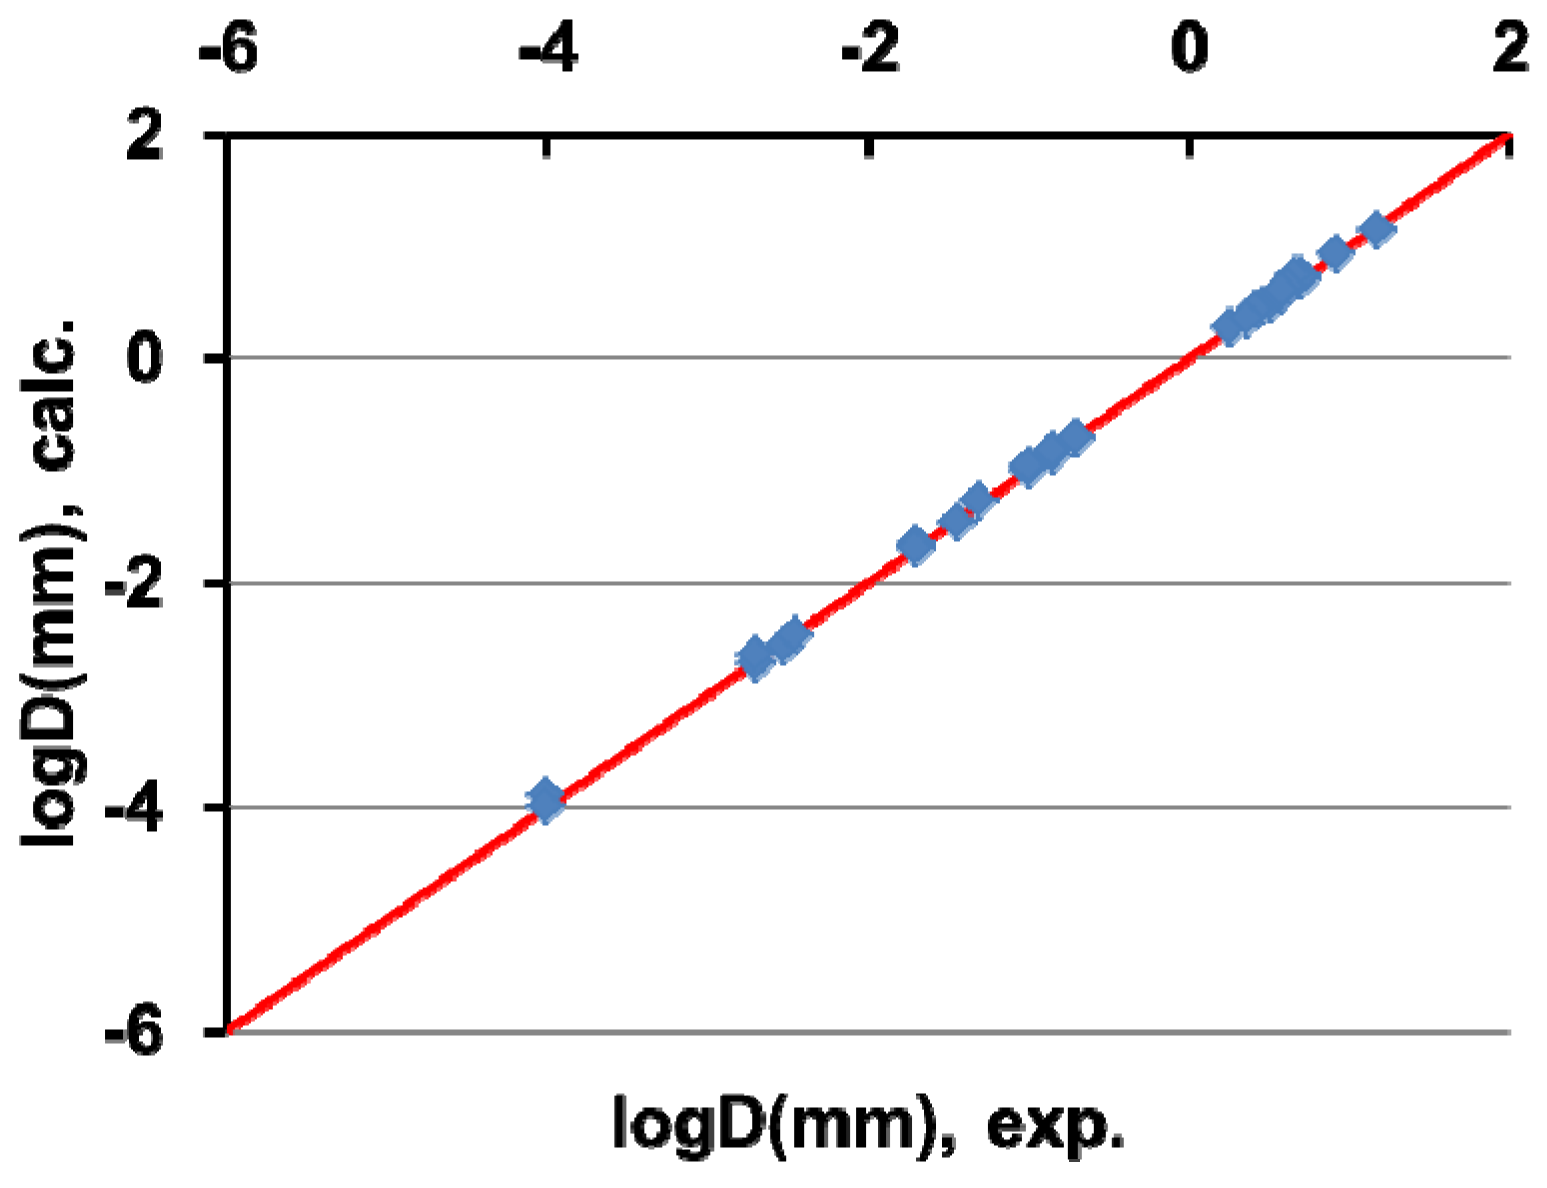
- Column 11, the calculated diameter Dcalc in mm of the liquid droplet of volume v submitted to crystallization at θc calc using Equation (21) and v × tsn ≈ v = π/6×D3 assuming that tsn = 1 s;
- Column 12, the experimental diameter Dexp in millimeters of the liquid droplet crystallizing at θc exp
- Column 13, references.

| 1 | 2 | 3 | 4 | 5 | 6 | 7 | 8 | 9 | 10 | 11 | 12 | 13 |
|---|---|---|---|---|---|---|---|---|---|---|---|---|
| Vm × 106 | ΔSm | Tm | n | Rnm | εnm0 | θc | θc | Dcalc | Dexp | References | ||
| m3 | J/K | K | nm | Exp. | Calc. | mm | mm | |||||
| Fe | 7.53 | 7.63 | 1809 | 55 | 0.55 | 0.859 | −0.304 | −0.298 | 61.7 | 0.1000 | 0.1000 | [34,35] |
| In | 15.90 | 7.69 | 429 | 147 | 0.98 | 0.707 | −0.260 | −0.266 | 51.0 | 0.0031 | 0.0030 | [36,37] |
| Ti | 11.10 | 7.93 | 1943 | 309 | 1.11 | 0.546 | −0.180 | −0.191 | 70.6 | 1.9300 | 1.8000 | [38] |
| Zr | 14.60 | 7.95 | 2125 | 561 | 1.48 | 0.447 | −0.167 | −0.177 | 73.5 | 5.0700 | 5.0000 | [39,40] |
| Mn | 8.88 | 7.98 | 1517 | 309 | 1.03 | 0.545 | −0.206 | −0.217 | 59.8 | 0.0500 | 0.0500 | [30,41] |
| Pb | 18.80 | 8.00 | 600 | 147 | 1.03 | 0.698 | −0.260 | −0.249 | 57.0 | 0.0200 | 0.0200 | [17] |
| Co | 7.11 | 9.16 | 1768 | 55 | 0.54 | 0.815 | −0.270 | −0.280 | 63.7 | 0.1900 | 0.2000 | [36,42] |
| Ag | 11.00 | 9.16 | 1234 | 309 | 1.10 | 0.521 | −0.332 | −0.360 | 41.7 | 0.0001 | 0.0001 | [43] |
| Au | 10.80 | 9.43 | 1336 | 309 | 1.10 | 0.516 | −0.160 | −0.174 | 76.6 | 14.2100 | 15.000 | [30,44] |
| Tc | 8.60 | 9.47 | 2430 | 55 | 0.57 | 0.843 | −0.240 | −0.252 | 79.3 | 5.6400 | [28] | |
| Cr | 7.54 | 9.60 | 2176 | 309 | 0.97 | 0.512 | −0.130 | −0.180 | 73.5 | 5.0200 | [28] | |
| Re | 9.50 | 9.62 | 3453 | 55 | 0.59 | 0.862 | −0.241 | −0.255 | 71.9 | 3.0100 | 2.9000 | [45] |
| Ir | 9.20 | 9.62 | 2716 | 309 | 1.04 | 0.512 | −0.190 | −0.183 | 72.1 | 3.1600 | 3.3000 | [28,46] |
| Mo | 10.00 | 9.63 | 2890 | 309 | 1.07 | 0.512 | −0.180 | −0.180 | 73.4 | 4.9700 | 4.9000 | [38,47] |
| Os | 8.85 | 9.64 | 3300 | 147 | 0.83 | 0.656 | −0.200 | −0.208 | 71.7 | 2.8200 | [28,48] | |
| Pd | 9.91 | 9.64 | 1825 | 309 | 1.03 | 0.512 | −0.182 | −0.209 | 62.0 | 0.1100 | 0.1000 | [30,49] |
| Pt | 9.66 | 9.65 | 2042 | 309 | 1.06 | 0.512 | −0.185 | −0.184 | 71.6 | 2.6900 | 2.6000 | [38] |
| Cu | 7.57 | 9.66 | 1356 | 55 | 0.55 | 0.781 | −0.259 | −0.252 | 71.7 | 5.7000 | 5.7000 | [50,51,52] |
| Rh | 8.89 | 9.69 | 2239 | 147 | 0.80 | 0.654 | −0.204 | −0.209 | 71.1 | 2.3000 | 2.3000 | [38] |
| Ta | 12.40 | 9.74 | 3288 | 147 | 0.88 | 0.653 | −0.200 | −0.206 | 72.5 | 3.6900 | 3.7000 | [38,53] |
| Nb | 10.80 | 9.82 | 2740 | 309 | 1.10 | 0.509 | −0.176 | −0.179 | 73.7 | 5.4200 | 5.0000 | [38] |
| Hg | 14.20 | 9.91 | 232 | 13 | 0.42 | 0.000 | −0.380 | −0.549 | 51.6 | 0.0034 | 0.0035 | [17,43] |
| V | 8.93 | 10.07 | 2175 | 309 | 1.03 | 0.504 | −0.150 | −0.206 | 63.0 | 0.1500 | 0.1400 | [28] |
| Ni | 7.04 | 10.14 | 1726 | 55 | 0.54 | 0.791 | −0.278 | −0.276 | 62.7 | 0.1400 | 0.1400 | [34,36] |
| Ru | 8.75 | 10.19 | 2523 | 147 | 0.80 | 0.644 | −0.200 | −0.202 | 73.7 | 5.3800 | 5.0000 | [28] |
| Hf | 14.90 | 10.20 | 2500 | 309 | 1.22 | 0.502 | −0.180 | −0.179 | 73.8 | 4.8000 | 4.6000 | [38] |
| Gaβ | 13.40 | 10.31 | 256 | 13 | 0.39 | 0.000 | −0.500 | −0.528 | 58.6 | 0.0350 | 0.0360 | [17,54] |
| Cd | 9.51 | 10.44 | 594 | 309 | 1.18 | 0.498 | −0.190 | −0.228 | 57.1 | 0.0210 | 0.0200 | [17] |
| Zn | 10.60 | 10.53 | 693 | 309 | 1.05 | 0.497 | −0.190 | −0.19 | 68.6 | 0.9810 | [28] | |
| Al | 10.20 | 11.48 | 932 | 309 | 1.09 | 0.483 | −0.190 | −0.236 | 57.0 | 0.0210 | 0.0200 | [17,55] |
| W | 16.50 | 12.69 | 3680 | 309 | 1.08 | 0.467 | −0.155 | −0.177 | 73.1 | 4.4500 | 4.2000 | [26,56] |
| Sn | 11.19 | 13.46 | 520 | 13 | 0.44 | 0.371 | −0.370 | −0.48 | 50.3 | 0.0022 | 0.0020 | [17,37] |
| Bi | 21.70 | 20.77 | 544 | 13 | 0.48 | 0.551 | −0.410 | −0.405 | 49.9 | 0.0019 | 0.0020 | [17,57] |
| Sb | 18.60 | 22.15 | 903 | 55 | 0.74 | 0.639 | −0.230 | −0.244 | 57.1 | 0.0210 | 0.0200 | [17] |
| Te | 21.00 | 24.76 | 723 | 13 | 0.48 | 0.653 | −0.320 | −0.348 | 57.1 | 0.022 | 0.0200 | [17] |
| Se | 19.50 | 27.13 | 494 | 13 | 0.47 | 0.507 | −0.305 | −0.294 | 72.8 | 3.9700 | 3.8000 | [58] |
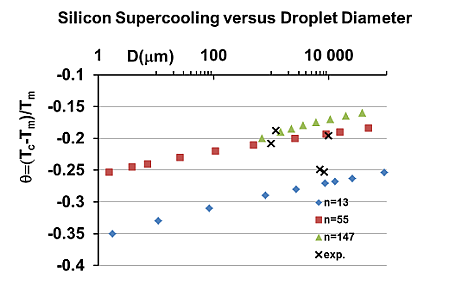
| Si | 12.20 | 29.79 | 1685 | 13 | 0.40 | 0.765 | −0.253 | −0.271 | 75.1 | 8.6900 | 8.4000 | [59,60,61,62] |
| Ge | 13.90 | 30.50 | 1210 | 13 | 0.42 | 0.695 | −0.390 | −0.387 | 41.0 | 0.0001 | 0.0001 | [36,43,52,63] |


5. Homogeneous Nucleation of 13-Atom Superclusters and Undercooling Rate Predictions

- Column 1, List of liquid elements;
- Column 2, Critical radius for spontaneous growth;
- Column 3, The number Δz per atom of s-electrons virtually transferred from superclusters to melt at Tm;
- Column 4, The energy saving coefficient εnm0 of 13-atom superclusters calculated with Equations (25)–(27);
- Column 5, The energy saving coefficient εnm0 of 55-atom superclusters calculated with Equations (24)–(26);
- Column 6, The energy saving coefficient εnm0 of 147-atom superclusters calculated with Equation (28) for n ≥ 147;
- Column 7, The energy saving coefficient εnm0 of 309-atom superclusters;
- Column 8, The energy saving coefficient εnm0 of 561-atom superclusters;
- Column 9, The condensation reduced temperature of 13-atom superclusters in 10 micrometer droplets;
- Column 10, The spontaneous growth reduced temperature around 13-atom superclusters in 10 micrometer droplets.
| 1 | 2 | 3 | 4 | 5 | 6 | 7 | 8 | 9 | 10 |
|---|---|---|---|---|---|---|---|---|---|
| R*2ls | Δz | εnm0 | εnm0 | εnm0 | εnm0 | εnm0 | θ13c (10 m) | θc (10 m) | |
| nm | n = 13 | n = 55 | n = 147 | n = 309 | n = 561 | n = 13 | n = 13 | ||
| Fe | 2.48 | 0.107 | 0.67 | 0.859 | 0.709 | 0.553 | 0.454 | −0.406 | −0.520 |
| In | 3.18 | 0.033 | 0.09 | 0.707 | 0.707 | 0.552 | 0.452 | −0.570 | −0.560 |
| Ti | 2.79 | 0.134 | 0.86 | 0.881 | 0.700 | 0.546 | 0.448 | −0.277 | −0.498 |
| Zr | 3.05 | 0.161 | 0.99 | 0.900 | 0.699 | 0.546 | 0.447 | −0.192 | −0.487 |
| Mn | 2.58 | 0.098 | 0.64 | 0.842 | 0.698 | 0.545 | 0.447 | −0.408 | −0.514 |
| Pb | 3.32 | 0.050 | 0.37 | 0.786 | 0.698 | 0.545 | 0.446 | −0.513 | −0.534 |
| Co | 2.29 | 0.116 | 0.66 | 0.815 | 0.667 | 0.521 | 0.427 | −0.370 | −0.490 |
| Ag | 2.65 | 0.094 | 0.62 | 0.808 | 0.667 | 0.521 | 0.427 | −0.348 | −0.492 |
| Au | 2.61 | 0.103 | 0.67 | 0.808 | 0.660 | 0.516 | 0.423 | −0.337 | −0.485 |
| Tc | 2.41 | 0.174 | 0.89 | 0.843 | 0.659 | 0.515 | 0.422 | −0.195 | −0.466 |
| Cr | 2.30 | 0.150 | 0.80 | 0.826 | 0.656 | 0.512 | 0.420 | −0.248 | −0.470 |
| Re | 2.48 | 0.258 | 1.05 | 0.862 | 0.656 | 0.512 | 0.420 | −0.160 | −0.450 |
| Ir | 2.46 | 0.201 | 0.95 | 0.849 | 0.656 | 0.512 | 0.420 | −0.094 | −0.458 |
| Mo | 2.53 | 0.220 | 1.00 | 0.855 | 0.656 | 0.512 | 0.420 | −0.123 | −0.455 |
| Os | 2.42 | 0.250 | 0.76 | 0.819 | 0.656 | 0.512 | 0.420 | −0.269 | −0.450 |
| Pd | 2.52 | 0.133 | 1.04 | 0.861 | 0.656 | 0.512 | 0.420 | −0.098 | −0.472 |
| Pt | 2.49 | 0.154 | 0.85 | 0.832 | 0.655 | 0.512 | 0.419 | −0.217 | −0.467 |
| Cu | 2.30 | 0.094 | 0.54 | 0.781 | 0.655 | 0.511 | 0.419 | −0.397 | −0.490 |
| Rh | 2.42 | 0.164 | 0.86 | 0.834 | 0.654 | 0.511 | 0.419 | −0.204 | −0.465 |
| Ta | 2.70 | 0.266 | 1.09 | 0.864 | 0.653 | 0.510 | 0.418 | −0.071 | −0.445 |
| Nb | 2.57 | 0.216 | 1.00 | 0.850 | 0.652 | 0.509 | 0.417 | −0.119 | −0.451 |
| Hg | 2.81 | 0.020 | 0.00 | 0.525 | 0.650 | 0.507 | 0.416 | −0.551 | −0.526 |
| V | 2.40 | 0.164 | 0.85 | 0.823 | 0.646 | 0.504 | 0.413 | −0.200 | −0.459 |
| Ni | 2.21 | 0.121 | 0.66 | 0.791 | 0.645 | 0.503 | 0.413 | −0.318 | −0.472 |
| Ru | 2.37 | 0.190 | 0.91 | 0.829 | 0.644 | 0.502 | 0.412 | −0.160 | −0.453 |
| Hf | 2.83 | 0.225 | 1.04 | 0.846 | 0.643 | 0.502 | 0.412 | −0.087 | −0.442 |
| Gaβ | 2.71 | 0.021 | 0.00 | 0.509 | 0.641 | 0.500 | 0.410 | −0.546 | −0.520 |
| Cd | 2.41 | 0.052 | 0.30 | 0.710 | 0.638 | 0.498 | 0.409 | −0.479 | −0.496 |
| Zn | 2.43 | 0.055 | 0.26 | 0.698 | 0.637 | 0.497 | 0.407 | −0.489 | −0.497 |
| Al | 2.32 | 0.081 | 0.49 | 0.733 | 0.619 | 0.483 | 0.396 | −0.379 | −0.467 |
| W | 2.67 | 0.338 | 1.04 | 0.797 | 0.598 | 0.467 | 0.383 | −0.030 | −0.412 |
| Sn | 2.56 | 0.058 | 0.37 | 0.675 | 0.587 | 0.458 | 0.375 | −0.406 | −0.452 |
| Bi | 2.53 | 0.089 | 0.55 | 0.628 | 0.508 | 0.396 | 0.325 | −0.218 | −0.382 |
| Sb | 2.35 | 0.147 | 0.70 | 0.639 | 0.497 | 0.388 | 0.318 | −0.109 | −0.366 |
| Te | 2.36 | 0.132 | 0.65 | 0.613 | 0.479 | 0.374 | 0.306 | −0.118 | −0.356 |
| Se | 2.23 | 0.094 | 0.51 | 0.575 | 0.464 | 0.362 | 0.297 | −0.197 | −0.353 |
| Si | 1.85 | 0.290 | 0.77 | 0.597 | 0.450 | 0.351 | 0.288 | −0.018 | −0.331 |
| Ge | 1.92 | 0.208 | 0.695 | 0.584 | 0.447 | 0.349 | 0.286 | −0.056 | −0.332 |
6. Maximum Superheating Temperatures of Superclusters at Constant Molar Volume
6.1. Superheating and Melting of n-atom Superclusters by Liquid Homogeneous Nucleation
6.2. Overheating and Melting of n-Atom Superclusters by Liquid Heterogeneous Nucleation
6.3. Prediction of Melting Temperatures of Superclusters in 38 Liquid Elements by Melt Superheating above Tm

| 1 | 2 | 3 | 4 | 5 | 6 | 7 | 8 | 9 | 10 | 11 | 12 | 13 | 14 |
|---|---|---|---|---|---|---|---|---|---|---|---|---|---|
| θf | θf (n-13) | θf (n-13) | θf (n-13) | θf (n-13) | θf (n) Hom. | θf (n) Hom. | θf (n) Hom. | θf (n) Hom. | θf (n) | θf (n) | θf (n) | θf (n) | |
| n = 13 | n = 55 | n = 147 | n = 309 | n = 561 | n = 55 | n = 147 | n = 309 | n = 561 | n = 55 | n = 147 | n = 309 | n = 561 | |
| Fe | 0 | 0.077 | 0.274 | 0.284 | 0.246 | 0.395 | 0.450 | 0.392 | 0.311 | 0.077 | 0.274 | 0.284 | 0.246 |
| In | 0 | 0.130 | 0.306 | 0.302 | 0.257 | 0.375 | 0.443 | 0.387 | 0.307 | 0.130 | 0.306 | 0.302 | 0.257 |
| Ti | 0.025 | 0.050 | 0.256 | 0.271 | 0.237 | 0.396 | 0.446 | 0.385 | 0.304 | 0.050 | 0.256 | 0.271 | 0.237 |
| Zr | 0.054 | 0.029 | 0.243 | 0.264 | 0.232 | 0.396 | 0.443 | 0.384 | 0.302 | 0.054 | 0.243 | 0.264 | 0.232 |
| Mn | 0 | 0.084 | 0.274 | 0.280 | 0.241 | 0.398 | 0.448 | 0.386 | 0.304 | 0.084 | 0.274 | 0.280 | 0.241 |
| Pb | 0 | 0.106 | 0.286 | 0.287 | 0.245 | 0.384 | 0.440 | 0.381 | 0.301 | 0.106 | 0.286 | 0.287 | 0.245 |
| Co | 0.045 | 0.099 | 0.270 | 0.267 | 0.227 | 0.420 | 0.446 | 0.370 | 0.286 | 0.099 | 0.270 | 0.267 | 0.227 |
| Ag | 0.027 | 0.098 | 0.268 | 0.266 | 0.226 | 0.412 | 0.442 | 0.367 | 0.285 | 0.098 | 0.268 | 0.266 | 0.226 |
| Au | 0.049 | 0.095 | 0.264 | 0.262 | 0.222 | 0.416 | 0.441 | 0.364 | 0.281 | 0.095 | 0.264 | 0.262 | 0.222 |
| Tc | 0.107 | 0.069 | 0.251 | 0.254 | 0.217 | 0.421 | 0.442 | 0.364 | 0.281 | 0.069 | 0.107 | 0.254 | 0.217 |
| Cr | 0.094 | 0.085 | 0.258 | 0.257 | 0.218 | 0.424 | 0.444 | 0.363 | 0.279 | 0.094 | 0.258 | 0.257 | 0.218 |
| Re | 0.145 | 0.047 | 0.238 | 0.246 | 0.212 | 0.422 | 0.442 | 0.362 | 0.278 | 0.145 | 0.238 | 0.246 | 0.212 |
| Ir | 0.126 | 0.061 | 0.246 | 0.250 | 0.215 | 0.422 | 0.442 | 0.362 | 0.279 | 0.126 | 0.246 | 0.250 | 0.215 |
| Mo | 0.133 | 0.054 | 0.242 | 0.248 | 0.213 | 0.422 | 0.440 | 0.361 | 0.278 | 0.133 | 0.242 | 0.248 | 0.213 |
| Os | 0.085 | 0.087 | 0.259 | 0.257 | 0.219 | 0.422 | 0.442 | 0.362 | 0.278 | 0.087 | 0.259 | 0.257 | 0.219 |
| Pd | 0.145 | 0.048 | 0.238 | 0.246 | 0.213 | 0.422 | 0.440 | 0.361 | 0.278 | 0.145 | 0.238 | 0.246 | 0.213 |
| Pt | 0.102 | 0.075 | 0.253 | 0.253 | 0.217 | 0.422 | 0.440 | 0.361 | 0.278 | 0.102 | 0.253 | 0.253 | 0.217 |
| Cu | 0.033 | 0.118 | 0.275 | 0.265 | 0.223 | 0.422 | 0.443 | 0.362 | 0.278 | 0.118 | 0.275 | 0.265 | 0.223 |
| Rh | 0.108 | 0.074 | 0.252 | 0.253 | 0.216 | 0.423 | 0.442 | 0.361 | 0.278 | 0.108 | 0.252 | 0.253 | 0.216 |
| Ta | 0.152 | 0.040 | 0.233 | 0.243 | 0.210 | 0.422 | 0.438 | 0.359 | 0.276 | 0.152 | 0.233 | 0.243 | 0.210 |
| Nb | 0.140 | 0.055 | 0.241 | 0.246 | 0.211 | 0.423 | 0.439 | 0.358 | 0.276 | 0.140 | 0.241 | 0.246 | 0.211 |
| Hg | 0 | 0.167 | 0.302 | 0.279 | 0.230 | 0.407 | 0.436 | 0.356 | 0.274 | 0.167 | 0.302 | 0.279 | 0.230 |
| V | 0.120 | 0.08 | 0.251 | 0.249 | 0.212 | 0.427 | 0.439 | 0.356 | 0.273 | 0.120 | 0.251 | 0.249 | 0.212 |
| Ni | 0.082 | 0.109 | 0.265 | 0.256 | 0.216 | 0.430 | 0.440 | 0.356 | 0.273 | 0.109 | 0.265 | 0.256 | 0.216 |
| Ru | 0.137 | 0.073 | 0.247 | 0.246 | 0.210 | 0.429 | 0.438 | 0.354 | 0.270 | 0.137 | 0.247 | 0.246 | 0.210 |
| Hf | 0.153 | 0.049 | 0.234 | 0.239 | 0.206 | 0.423 | 0.434 | 0.352 | 0.270 | 0.153 | 0.234 | 0.239 | 0.206 |
| Gaβ | 0 | 0.175 | 0.302 | 0.275 | 0.226 | 0.415 | 0.436 | 0.352 | 0.269 | 0.175 | 0.302 | 0.275 | 0.226 |
| Cd | 0 | 0.148 | 0.281 | 0.263 | 0.218 | 0.423 | 0.433 | 0.349 | 0.267 | 0.148 | 0.281 | 0.263 | 0.218 |
| Zn | 0 | 0.158 | 0.286 | 0.265 | 0.219 | 0.427 | 0.436 | 0.349 | 0.267 | 0.158 | 0.286 | 0.265 | 0.219 |
| Al | 0.082 | 0.136 | 0.266 | 0.247 | 0.205 | 0.435 | 0.428 | 0.337 | 0.256 | 0.136 | 0.266 | 0.247 | 0.205 |
| W | 0.230 | 0.072 | 0.227 | 0.220 | 0.186 | 0.445 | 0.420 | 0.323 | 0.243 | 0.230 | 0.227 | 0.22 | 0.186 |
| Sn | 0.105 | 0.158 | 0.259 | 0.233 | 0.191 | 0.443 | 0.411 | 0.314 | 0.205 | 0.158 | 0.259 | 0.233 | 0.191 |
| Bi | 0.275 | 0.151 | 0.214 | 0.185 | 0.151 | 0.455 | 0.358 | 0.256 | 0.190 | 0.275 | 0.275 | 0.256 | 0.190 |
| Sb | 0.315 | 0.136 | 0.203 | 0.177 | 0.145 | 0.454 | 0.350 | 0.248 | 0.184 | 0.315 | 0.315 | 0.248 | 0.184 |
| Te | 0.333 | 0.143 | 0.196 | 0.168 | 0.137 | 0.449 | 0.334 | 0.235 | 0.174 | 0.333 | 0.334 | 0.235 | 0.174 |
| Se | 0.339 | 0.160 | 0.193 | 0.163 | 0.133 | 0.448 | 0.321 | 0.225 | 0.166 | 0.339 | 0.321 | 0.225 | 0.166 |
| Si | 0.389 | 0.136 | 0.180 | 0.154 | 0.125 | 0.442 | 0.310 | 0.215 | 0.159 | 0.389 | 0.31 | 0.215 | 0.159 |
| Ge | 0.385 | 0.142 | 0.180 | 0.152 | 0.124 | 0.440 | 0.306 | 0.212 | 0.156 | 0.385 | 0.306 | 0.212 | 0.156 |
- Column 1, The liquid elements are classified as a function of the fusion entropy ΔSm;
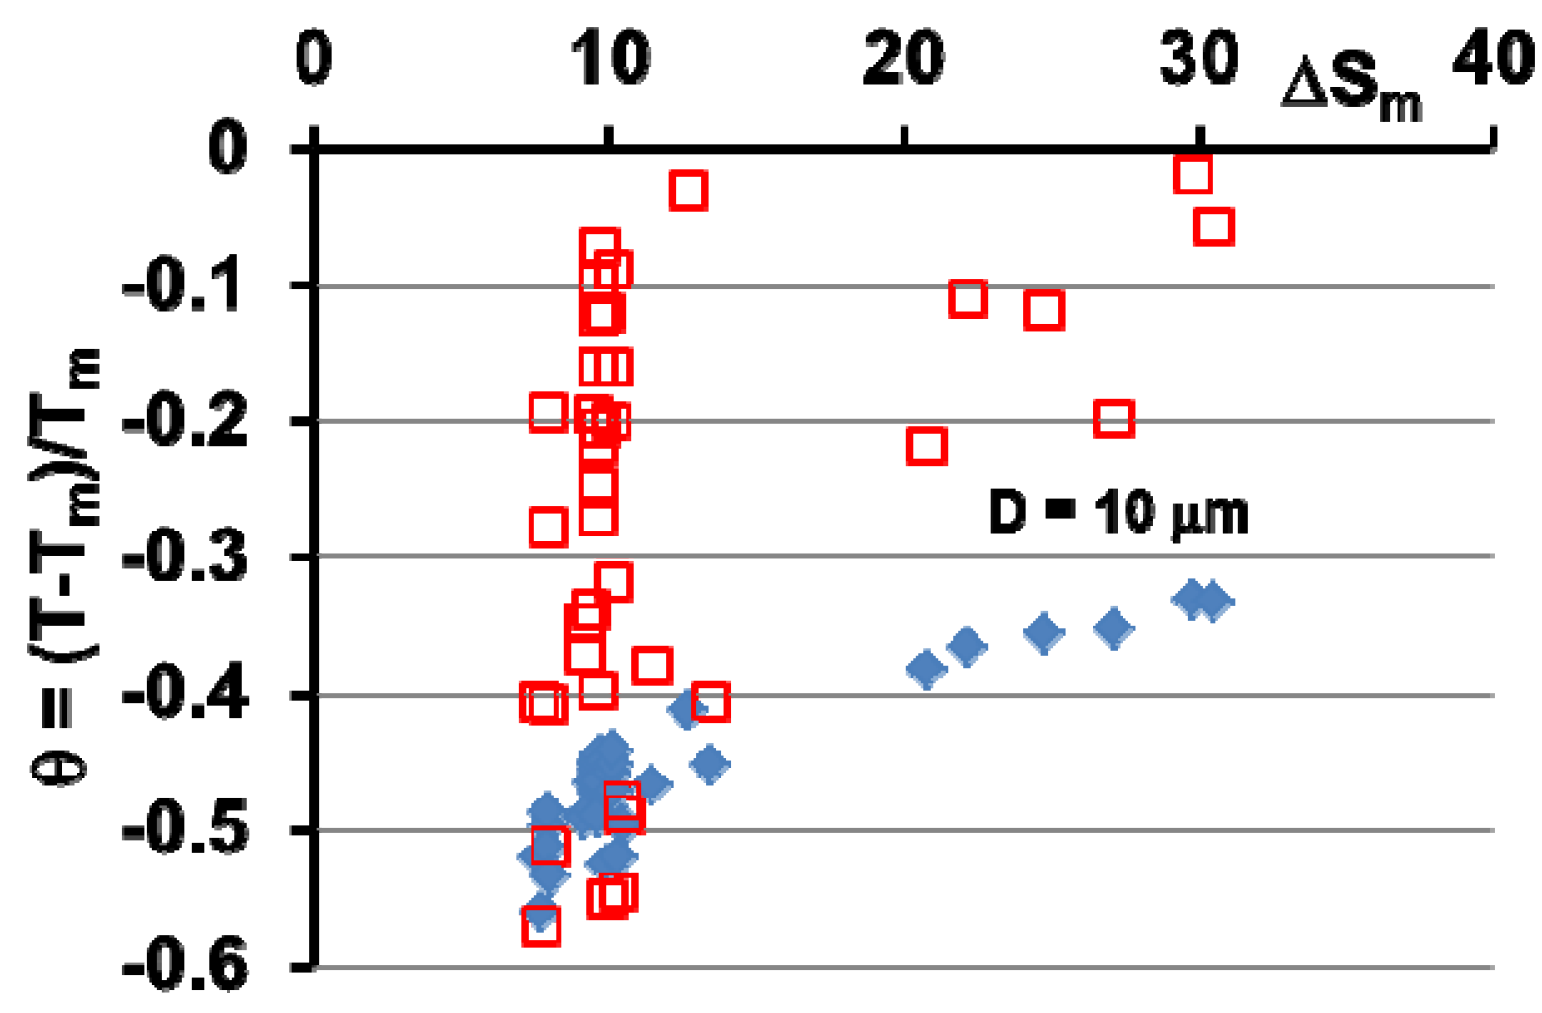
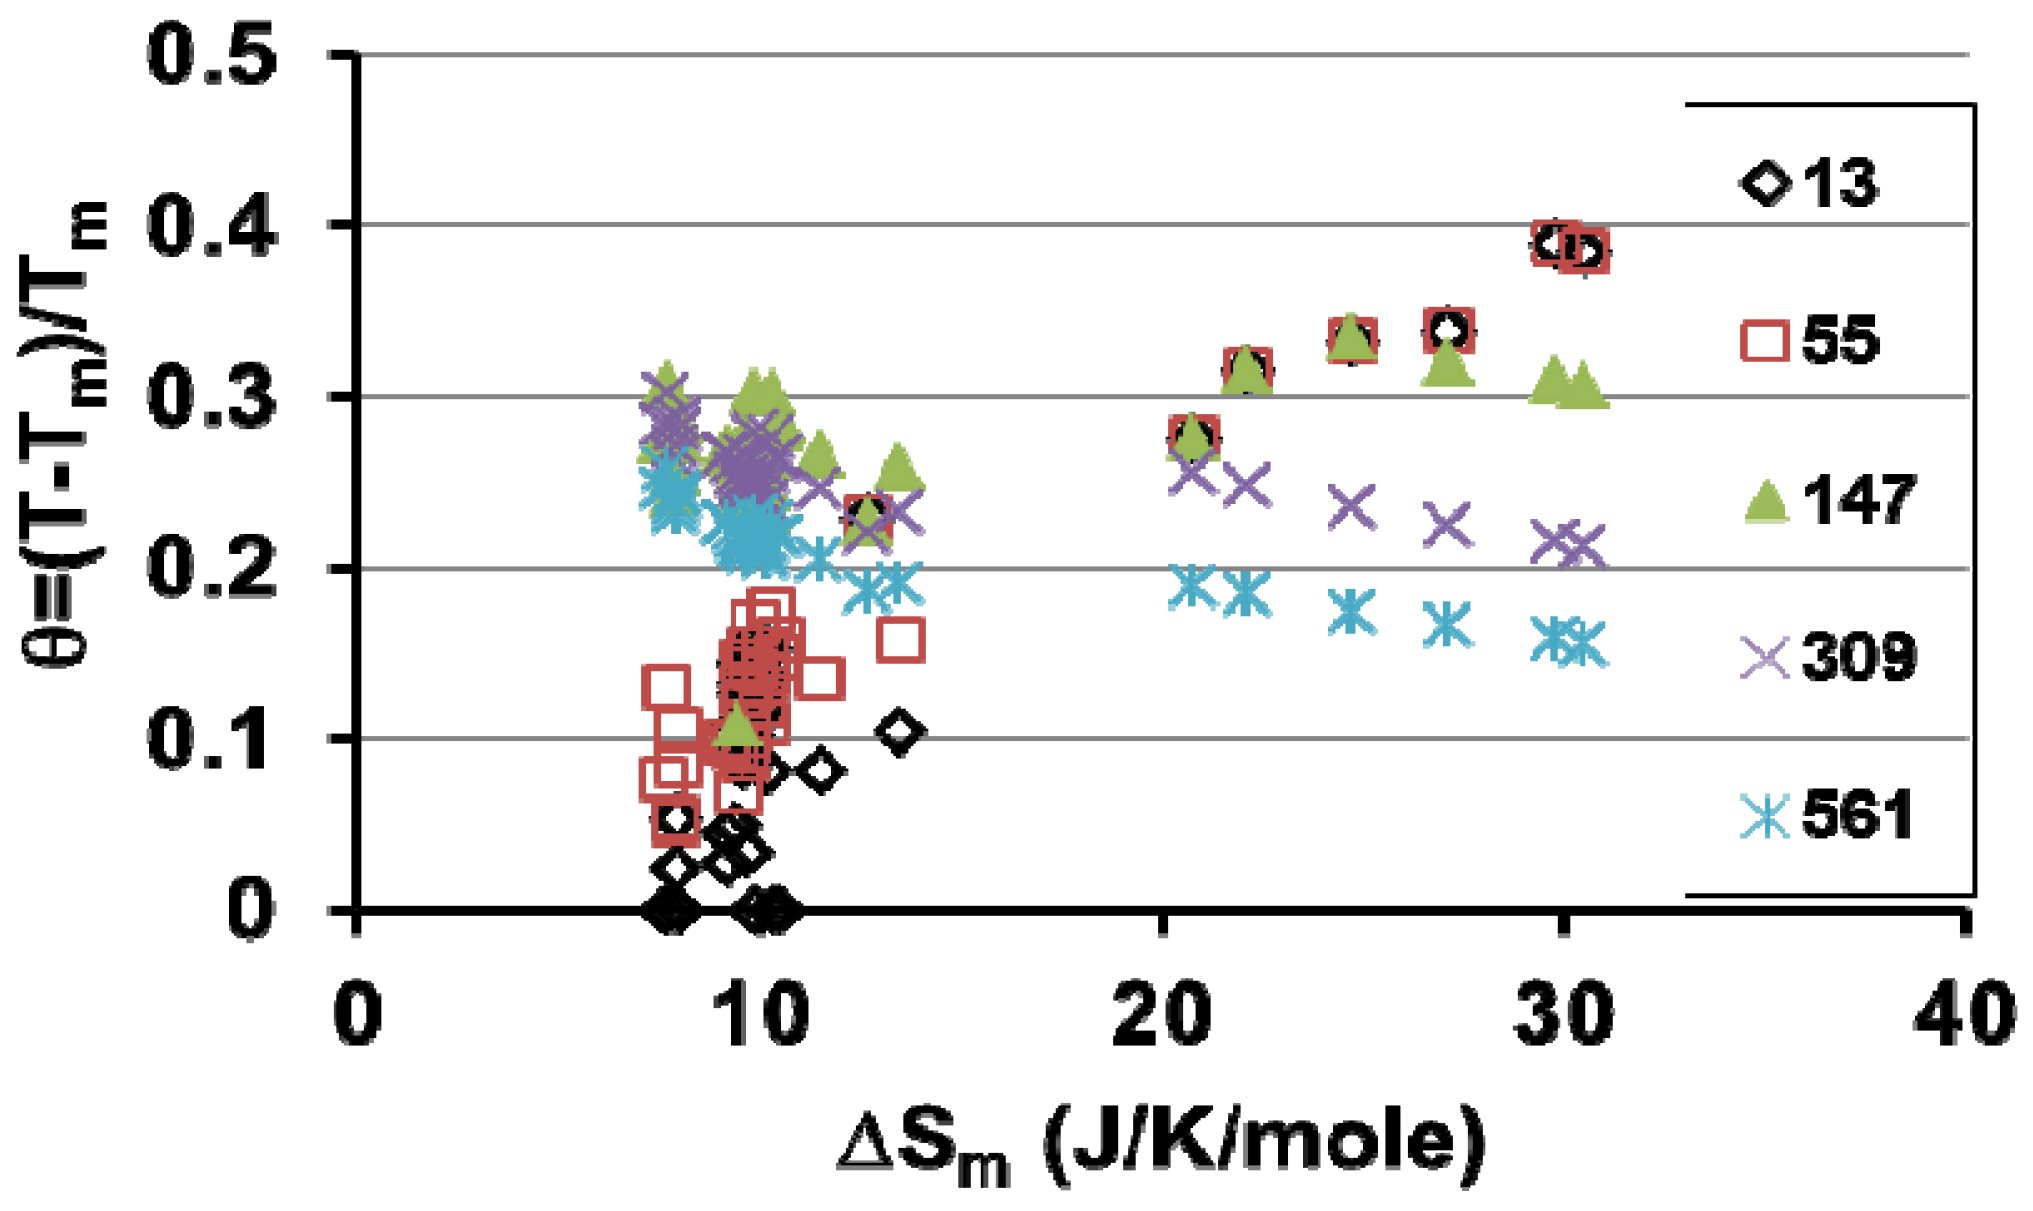
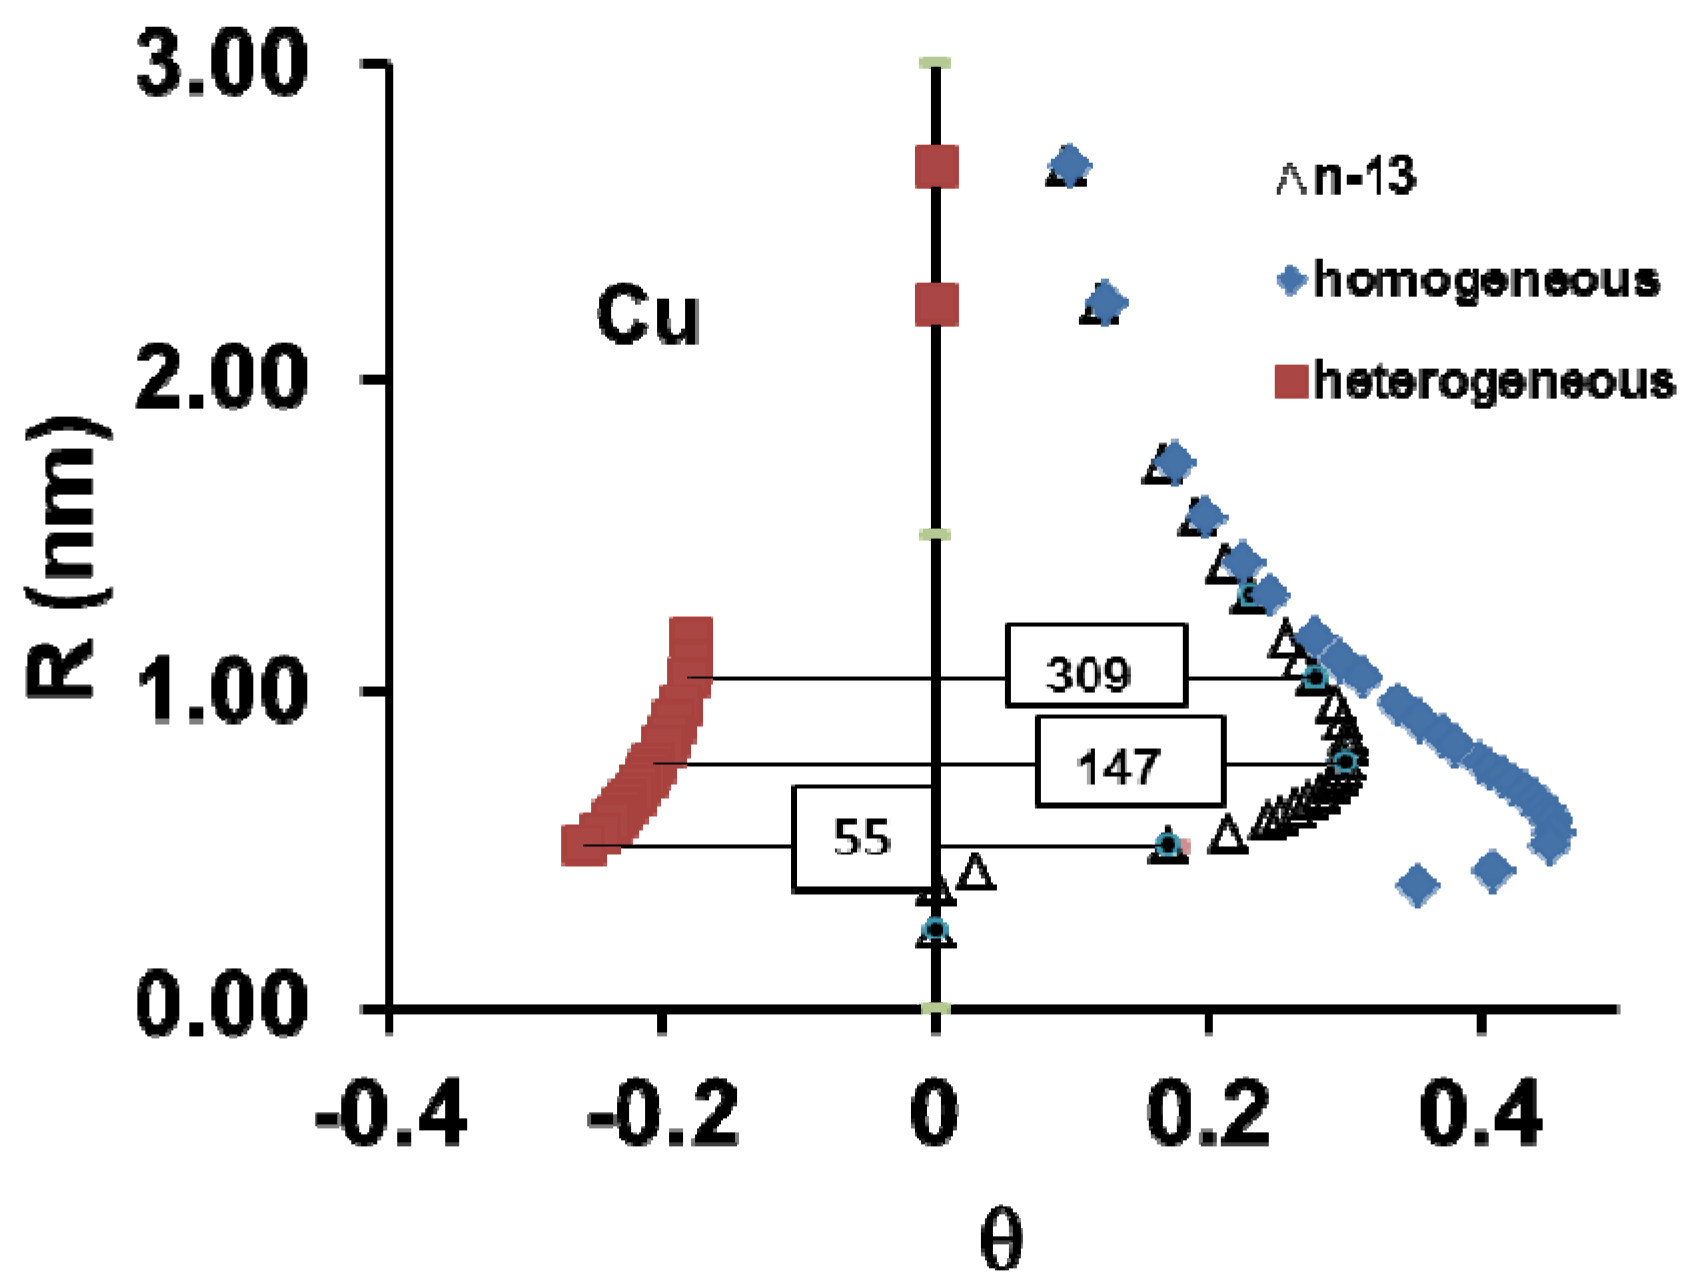
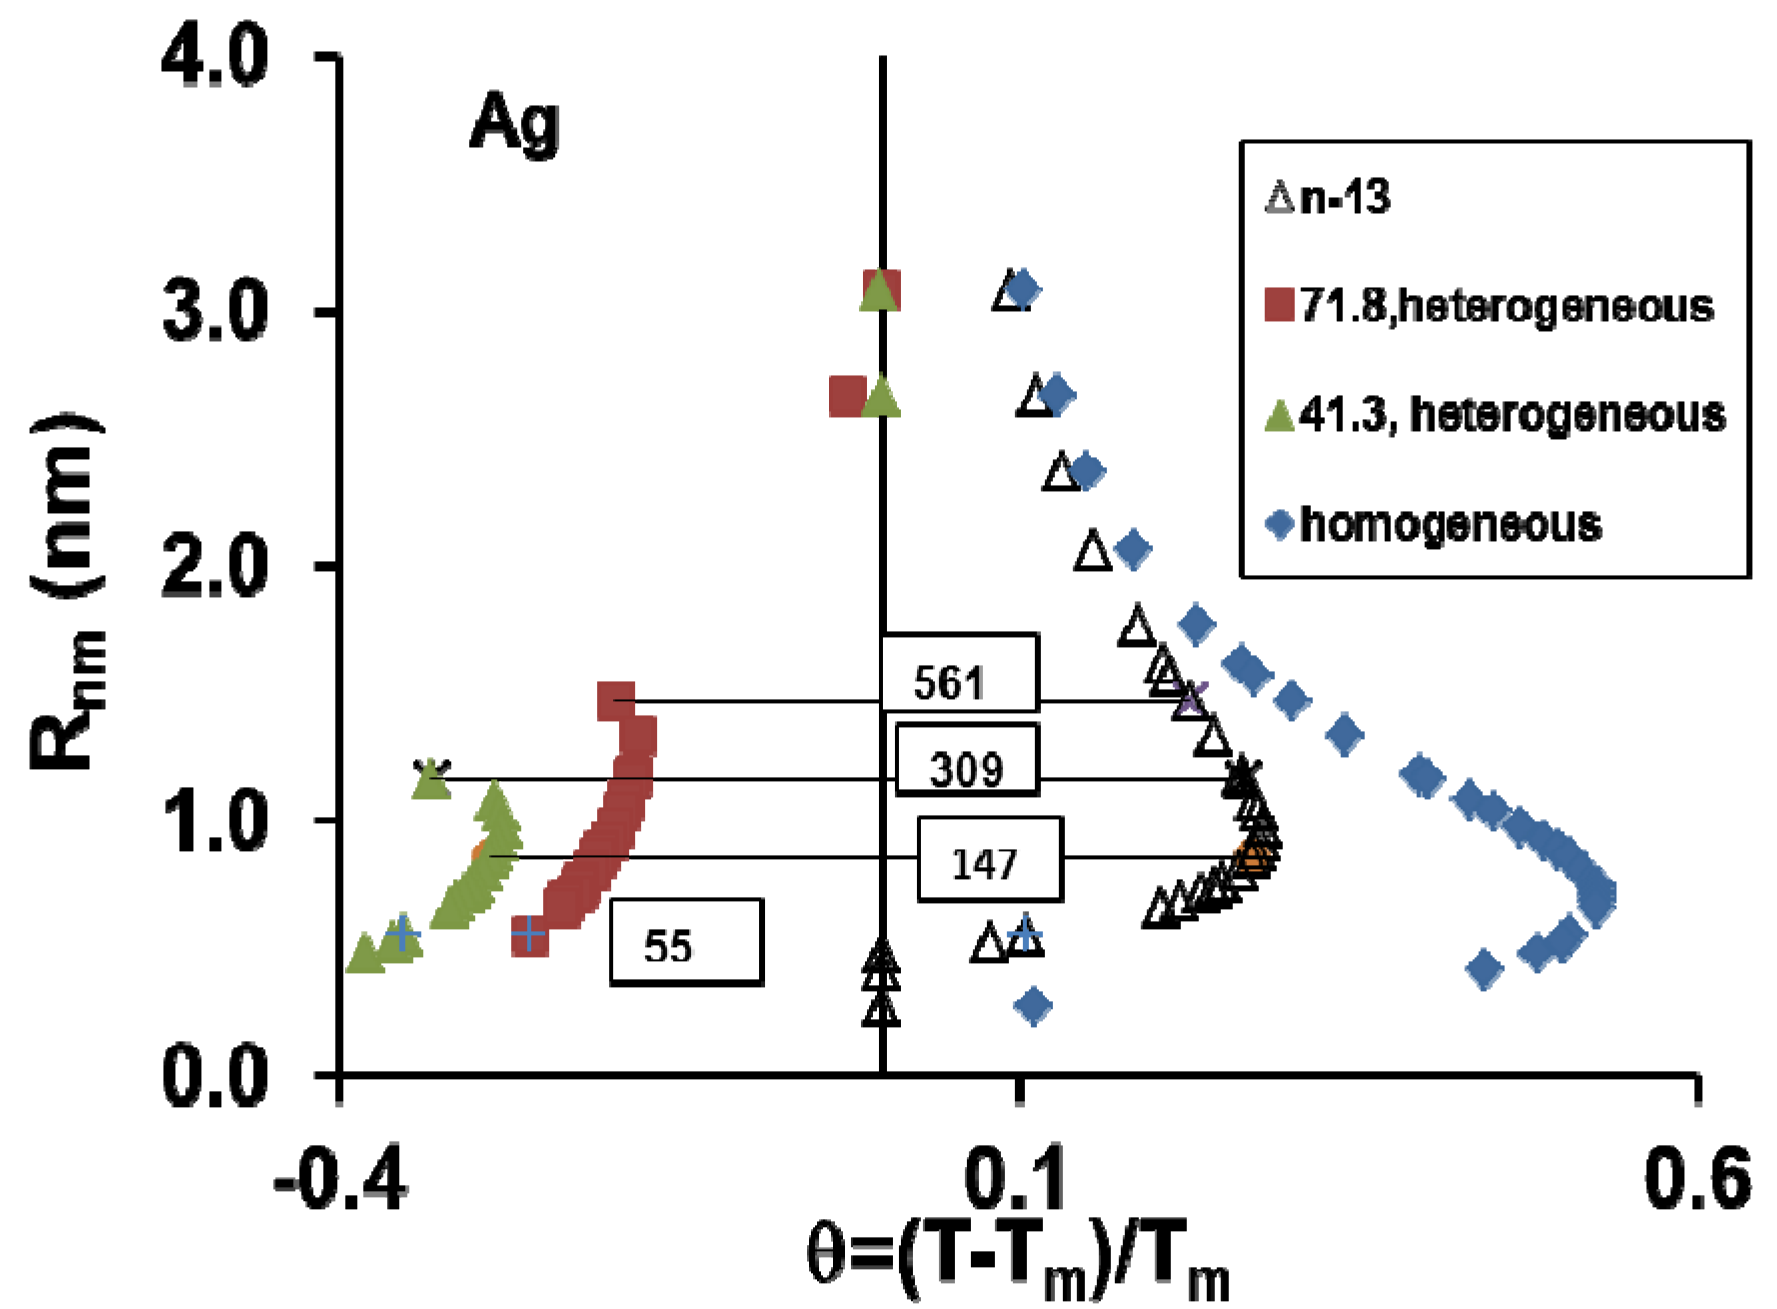
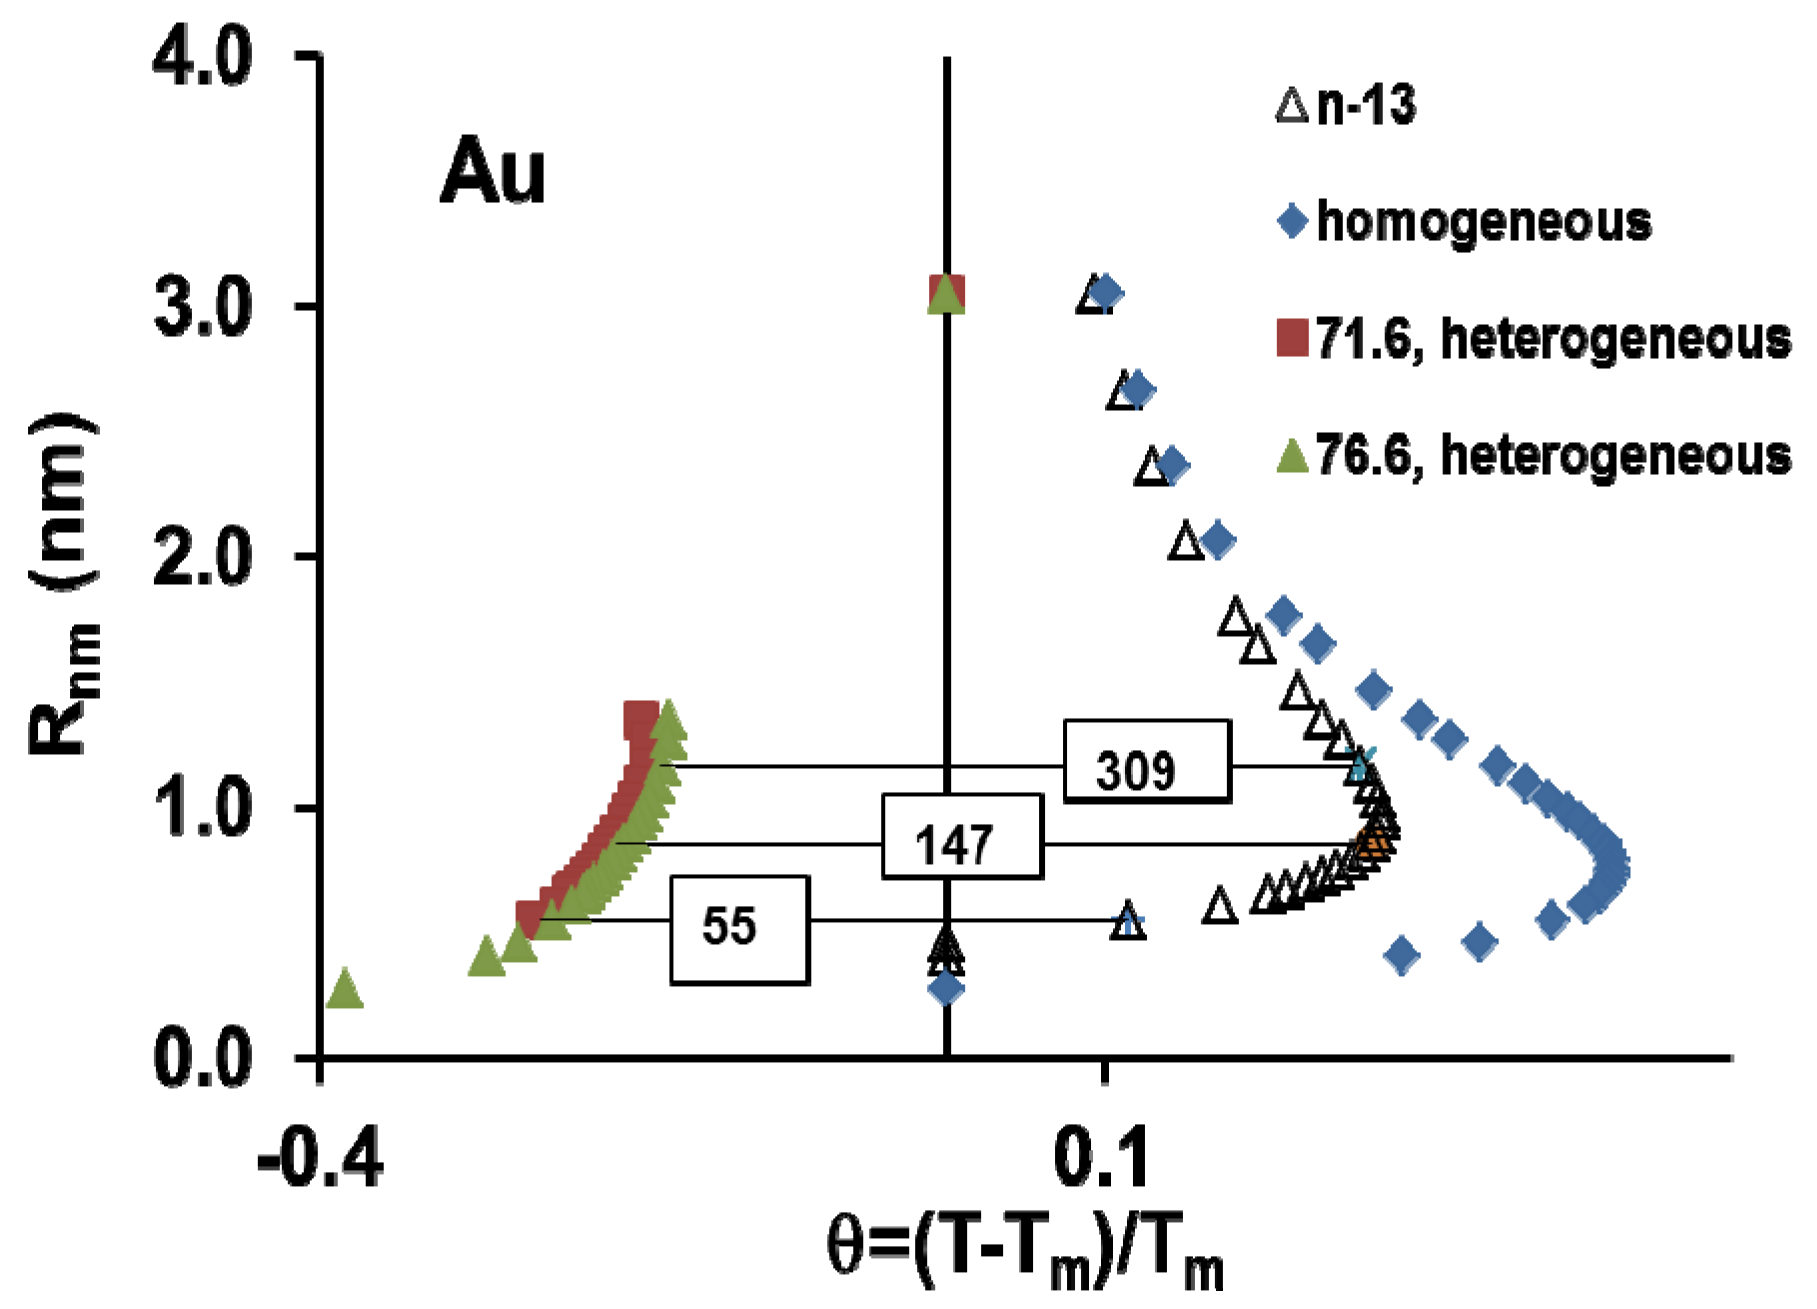
- Column 2, The melting temperature of 13-atom superclusters is high for large fusion entropies of Bi, Sb, Te, Se, Si and Ge. The highest value θ = 0.389 is obtained for Si; the lowest θ = 0 is obtained in 8 liquid elements. Homogeneous liquids do not contain any condensed cluster. They are crystallizing during undercooling because 13-atom clusters are condensed as shown in Figure 5. Their previous presence at Tm does not have any influence on the undercooling rate;
- Column 3, The calculated melting temperatures of 55-atom clusters induced by previous formation in their core of a droplet of 13 atoms are often lower than those of the 13-atom clusters. Then, they melt at the same temperature as the 13-atom clusters;
- Column 4, The calculated melting temperatures of 147-atom clusters induced by previous formation in their core of a droplet of 13 atoms are larger than those of the 13-atom clusters from Fe to Al. They are nearly equal for W and smaller from Sn to Ge;
- Column 5, The calculated melting temperatures of 309-atom clusters induced by previous formation in their core of a droplet of 13 atoms are larger those of the 13-atom clusters from Fe to Sn. They are smaller from Bi to Ge;
- Column 6, The calculated melting temperatures of 561-atom clusters induced by previous formation in their core of a droplet of 13 atoms are larger than those of the13-atom clusters from Fe to Sn except W. They are smaller from Bi to Ge;
- Columns 7, 8, 9 and 10, The melting temperatures of 55-, 147-, 309- and 561-atom superclusters are obtained considering homogeneous liquid nucleation without introducing heterogeneous nucleation from 13-atom droplets;
- Columns 11, 12, 13 and 14, The expected melting temperatures of 55-, 147-, 309- and 561-atom superclusters are selected in order to be coherent between them. The homogeneous nucleation temperature of some superclusters having a large fusion entropy are sometimes smaller than those of the 13-atom superclusters, as shown in Figure 6.
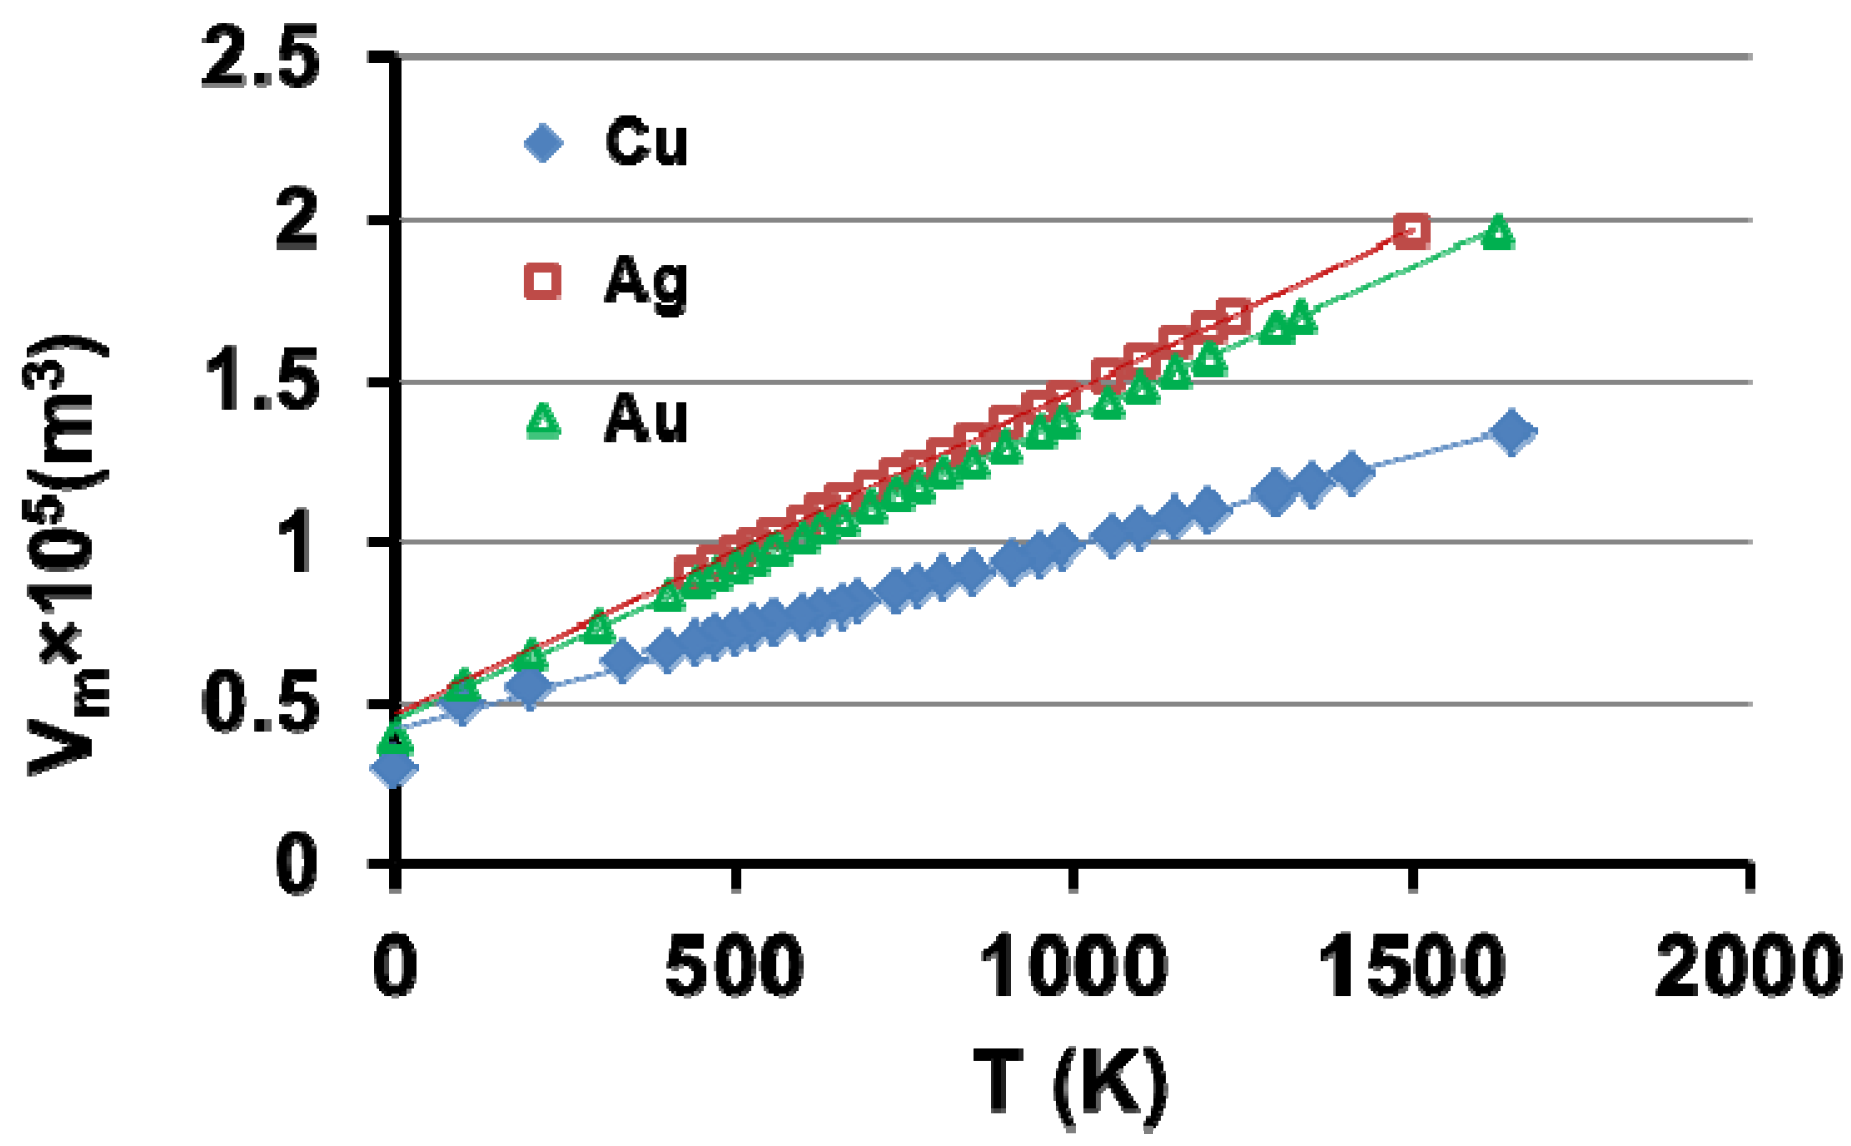
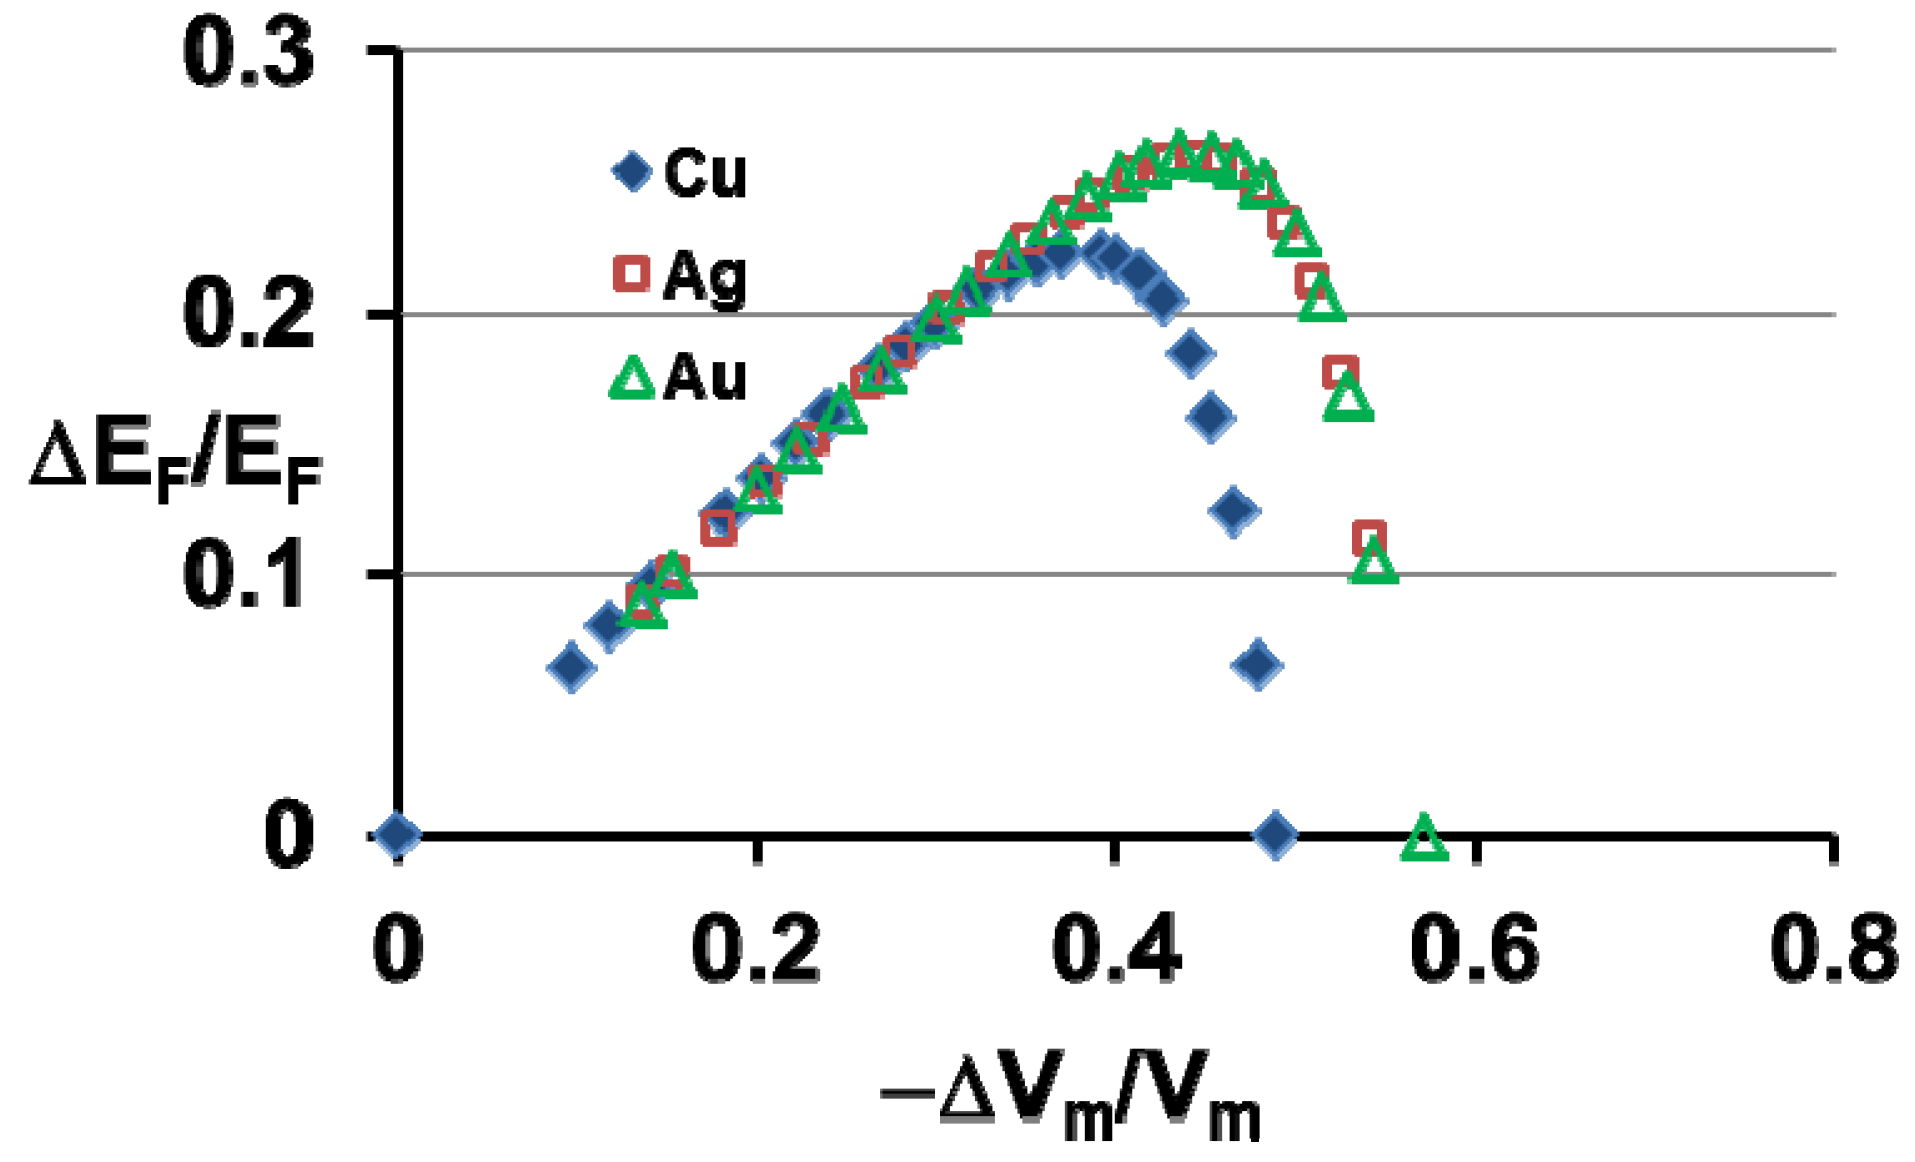
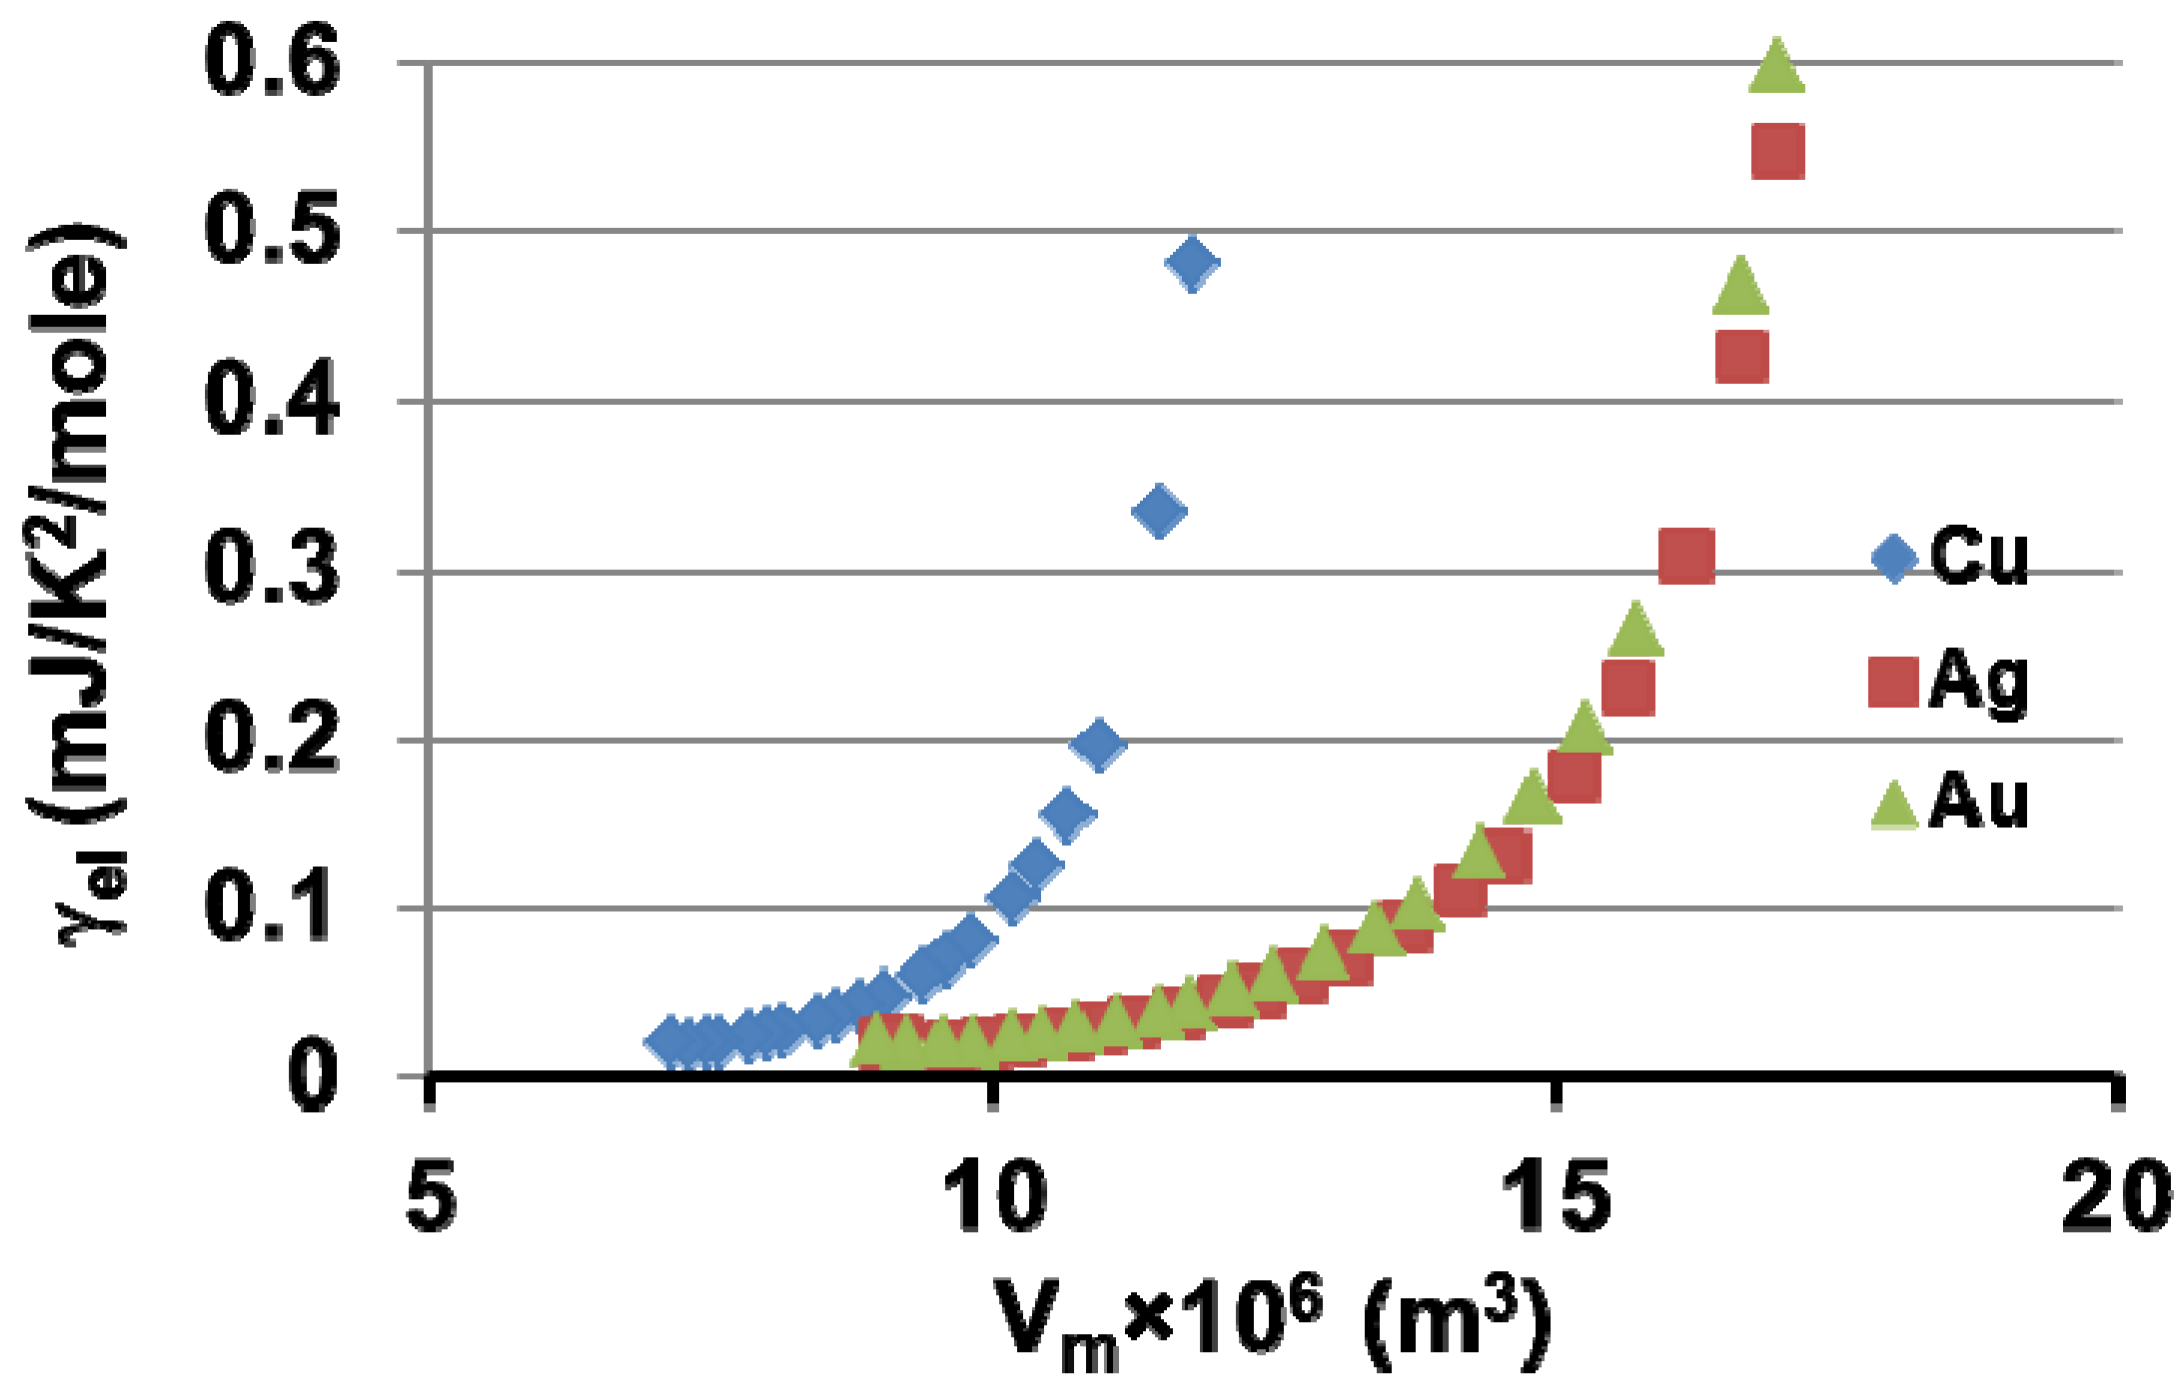
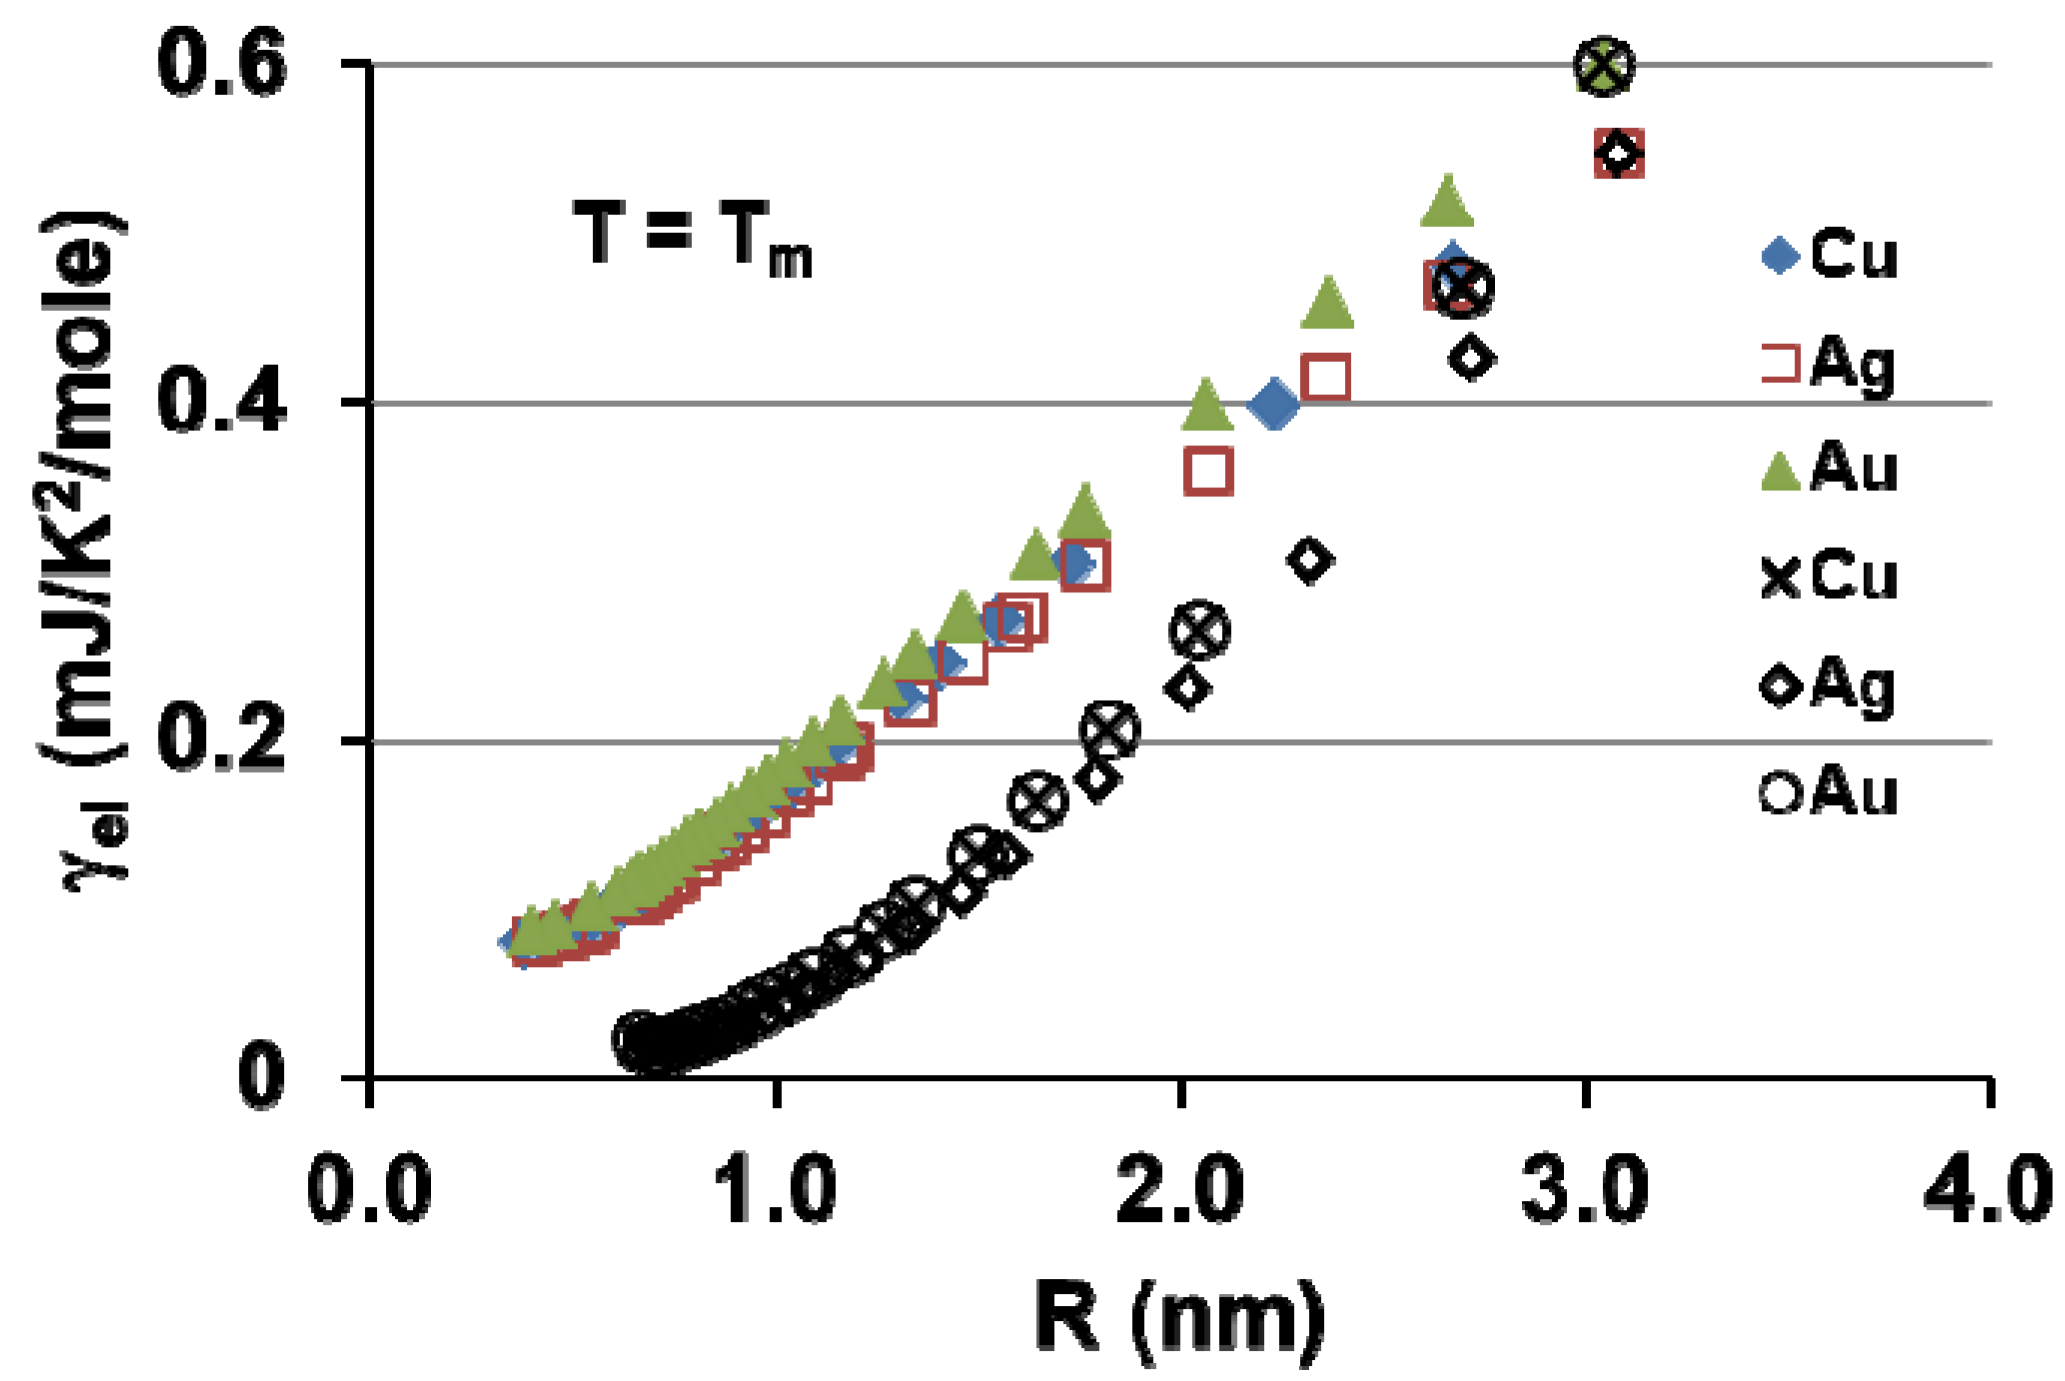
7. Electronic Properties of Cu, Ag and Au Superclusters


8. Silver Supercluster Formation into and Out of Undercooled Liquid
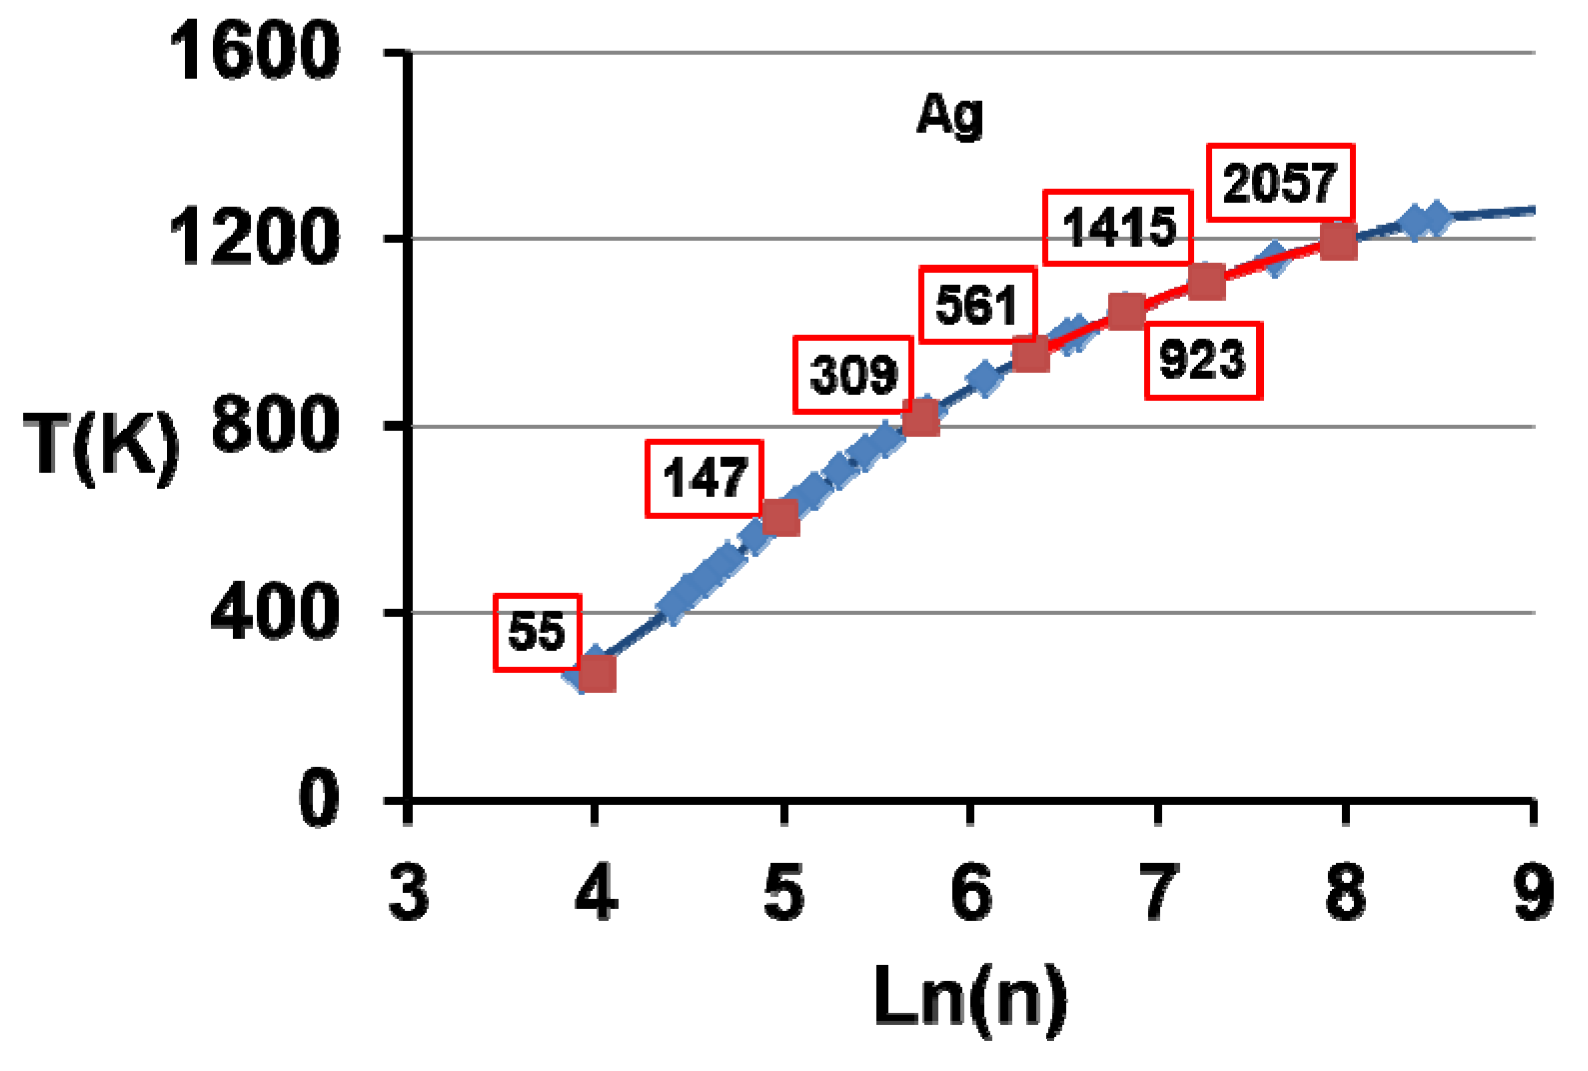
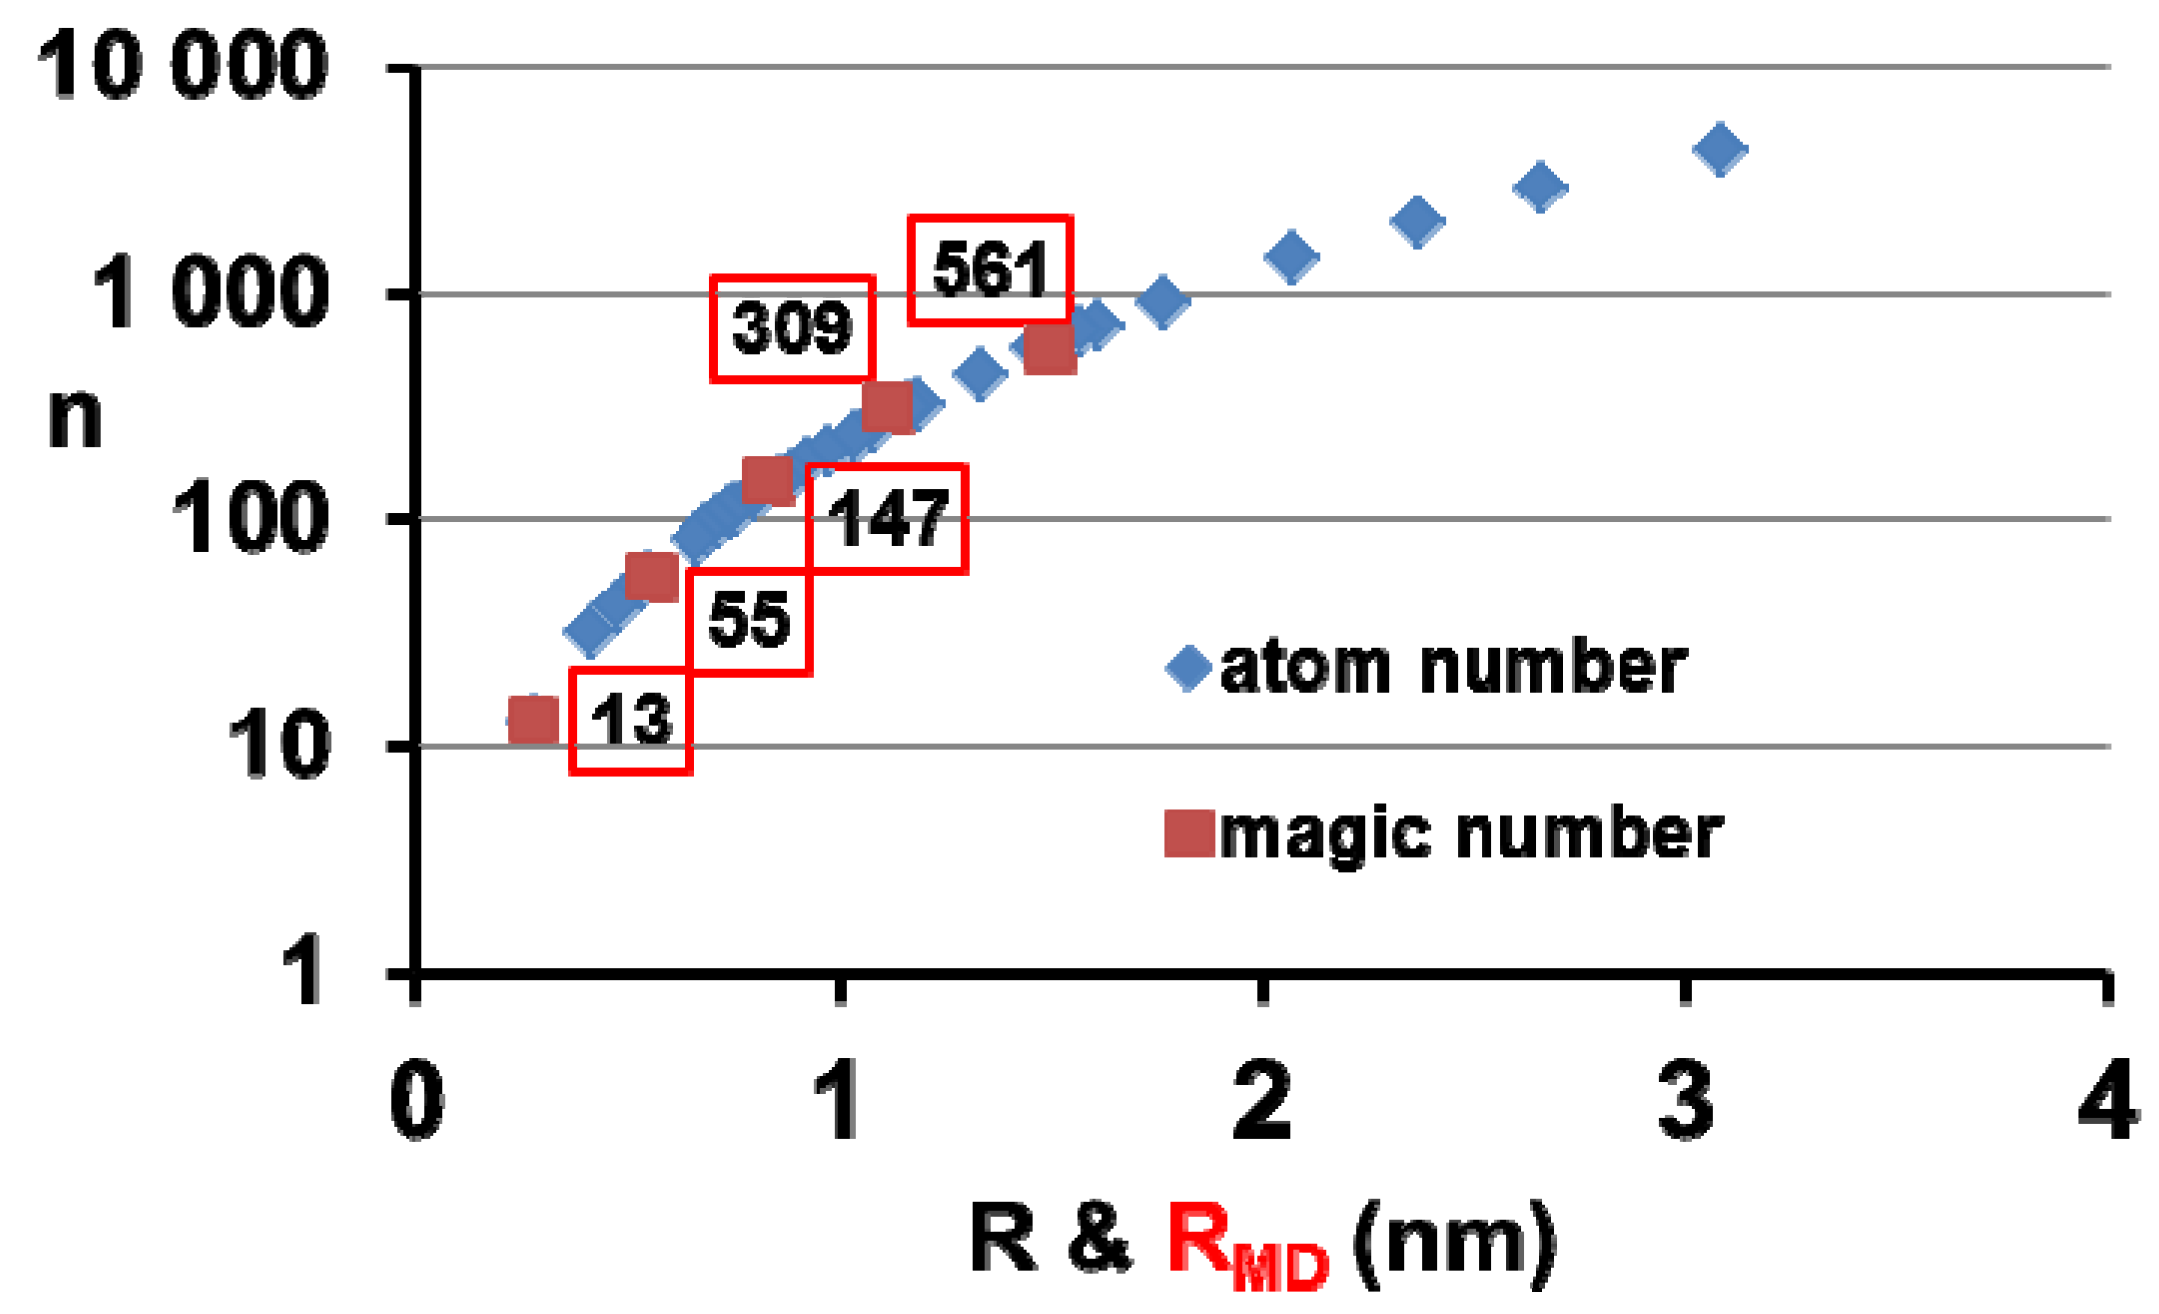
| n | 13 | 55 | 147 | 309 | 561 | 923 | 1415 | 2057 |
|---|---|---|---|---|---|---|---|---|
| R (Å) | 3.387 | 5.485 | 8.541 | 11.630 | 14.670 | 17.680 | 20.670 | 23.660 |
| RMD (Å) | 2.74 | 5.51 | 8.32 | 11.14 | 14.94 | |||
| T (K) | 0 | 291 | 604 | 817 | 952 | 1044 | 1108 | 1234 |

9. Melting of Cu, Ag and Au Superclusters Varying the Superheating
9.1. Overheating of Cu, Ag and Au Superclusters


9.2. Analysis of the Influence of Cu Superheating Time on the Undercooling Rate

10. Conclusions
Acknowledgments
Conflicts of Interest
References
- Frank, F.C. Supercooling of liquids. Proc. R. Soc. Lond. 1952, A215, 43–46. [Google Scholar] [CrossRef]
- Mauro, N.A.; Bendert, J.C.; Vogt, A.J.; Gewin, J.M.; Kelton, K.F. High energy X-ray scattering studies of the local order in liquid Al. J. Chem. Phys. 2011, 135, 044502. [Google Scholar] [CrossRef] [PubMed]
- Tanaka, H. Relationship among glass-forming ability, fragility, and short-range bond ordering of liquids. J. Non-Cryst. Solids 2005, 351, 678–690. [Google Scholar]
- Shen, Y.T.; Kim, T.H.; Gangopadhyay, A.K.; Kelton, K.F. Icosahedral order, frustration, and the glass transition: Evidence from time-dependent nucleation and supercooled liquid structure studies. Phys. Rev. Lett. 2009, 102, 057801. [Google Scholar] [CrossRef] [PubMed]
- Kuzmin, V.I.; Tytik, D.L.; Belashchenko, D.K.; Sirenko, A.N. Structure of silver clusters with magic numbers of atoms by data of molecular dynamics. Colloid J. 2008, 70, 284–296. [Google Scholar] [CrossRef]
- Wang, Y.; Teitel, S.; Dellago, C. Melting of icosahedral gold nanoclusters from molecular dynamics simulations. J. Chem. Phys. 2005, 122, 21722. [Google Scholar]
- Gafner, Y.Y.; Gafner, S.L.; Entel, P. Formation of an icosahedral structure during crystallization of nickel nanoclusters. Phys. Sol. State 2004, 46, 1327–1330. [Google Scholar] [CrossRef]
- Cleveland, C.L.; Luedtke, W.D.; Landman, U. Melting of gold clusters: Icosahedral precursors. Phys. Rev. Lett. 1998, 81, 2036–2039. [Google Scholar] [CrossRef]
- Aiyer, H.N.; Vijayakrishnan, V.; Subbana, G.N.; Rao, C.N.R. Investigations of Pd clusters by the combined use of HREM, STM, high-energy spectroscopies and tunneling conductance measurements. Surf. Sci. 1994, 313, 392–398. [Google Scholar] [CrossRef]
- Vinod, C.P.; Kulkarni, G.U.; Rao, C.N.R. Size-dependent changes in the electronic structure of metal clusters as investigated by scanning tunneling spectroscopy. Chem. Phys. Lett. 1998, 289, 329–333. [Google Scholar] [CrossRef]
- Van Leeuwen, D.A.; van Ruitenbeck, J.M.; Schmid, G.; de Jongh, L.J. Size-dependent magnetisation of Pd clusters and colloids. Phys. Lett. A 1992, 170, 325–333. [Google Scholar] [CrossRef]
- Harbola, M.K. Magic numbers for metallic clusters and the principle of maximum hardness. Proc. Natl. Acad. Sci. USA 1992, 89, 1036–1039. [Google Scholar] [CrossRef] [PubMed]
- Zhdanov, V.P.; Schwind, M.; Zoric, I.; Kasemo, B. Overheating and undercooling during melting and crystallization of metal nanoparticles. Phys. E 2010, 42, 1990–1994. [Google Scholar] [CrossRef]
- Kusche, R.; Hippler, T.; Schmidt, M.; von Issendorf, B.H.; Haberland, H. Melting of free sodium clusters. Eur. Phys. J. D 1999, 9, 1–4. [Google Scholar]
- Tournier, R.F. Presence of intrinsic growth nuclei in overheated and undercooled liquid elements. Phys. B Condens. Matt. 2007, 392, 79–91. [Google Scholar] [CrossRef]
- Tournier, R.F. Tiny Crystals Surviving above the melting temperature and acting as growth nuclei of the high-Tc superconductor microstructure. Mater. Sci. Forum 2007, 546–549, 1827–1840. [Google Scholar]
- Perezpezko, J.H. Nucleation in undercooled liquids. Mater. Sci. Eng. 1984, 65, 125–135. [Google Scholar] [CrossRef]
- Gutzow, I.; Schmeltzer, J. The Vitreous State/Thermodynamics, Structure, Rheology and Crystallization; Springer-Verlag: Berlin/Heidelberg, Germany; New York, NY, USA, 1995; ISBN:3-540-59087-0. [Google Scholar]
- Turnbull, D. Kinetics of solidification of supercooled liquid mercury droplets. J. Chem. Phys. 1952, 20, 411–424. [Google Scholar] [CrossRef]
- Wu, D.T.; Granasy, L.; Spaepen, F. Nucleation and the solid-liquid interfacial free energy. MRS Bull. 2004, 29, 945–950. [Google Scholar] [CrossRef]
- Tournier, R.F. Thermodynamic origin of the vitreous transition. Materials 2011, 4, 869–892. [Google Scholar] [CrossRef]
- Tournier, R.F. Expected properties of gold melt containing intrinsic nuclei. In Proceedings of the 6th International Conference on Electromagnetic Processing of Materials (EPM), Dresden, Germany, 19–23 October 2009; Forschungszentrum Dresden-Rossendorf: Dresden, Germany, 2009; pp. 304–307. [Google Scholar]
- Tournier, R.F. Nucleation of crystallization in titanium and vitreous state in glass-forming melt. In Proceedings of the 12th World Conference on Titanium (Ti-2011), Beijing, China, 19–24 June 2011; Chang, H., Lu, Y., Xu, D., Zhou, L., Eds.; Science Press: Beijing, China, 2012; Volume II, pp. 1527–1531. [Google Scholar]
- Tournier, R.F. Crystal growth nucleation and Fermi energy equalization of intrinsic growth nuclei in glass-forming melts. Sci. Technol. Adv. Mater. 2009, 10, 014607. [Google Scholar] [CrossRef]
- Tournier, R.F. Thermodynamics of the vitreous transition. Rev. Metall. 2012, 109, 27–33. [Google Scholar] [CrossRef]
- Vinet, B.; Cortella, L.; Favier, J.J.; Desré, P.J. Highly undercooled W and Re drops in an ultra-high vacuum drop tube. Appl. Phys. Lett. 1991, 58, 97–99. [Google Scholar] [CrossRef]
- Tournier, R.F.; Beaugnon, E. Texturing by cooling a metallic melt in a magnetic field. Sci. Technol. Adv. Mater. 2009, 10, 014501. [Google Scholar] [CrossRef]
- Vinet, V.; Magnusson, L.; Frederiksson, H.; Desre, P.J. Correlations between surface and interface energies with respect to crystal nucleation. J. Coll. Interf. Sci. 2002, 255, 363–374. [Google Scholar] [CrossRef]
- Kelton, K.F.; Lee, G.W.; Gangopadhyay, A.K.; Hyers, R.W.; Rathz, T.J.; Rogers, J.R.; Robinson, M.B.; Robinson, D.S. First X-ray scattering studies on electrostatically levitated metallic liquids: Demonstrated influence of local icosahedral order on the nucleation barrier. Phys. Rev. Lett. 2003, 90, 195504. [Google Scholar] [CrossRef] [PubMed]
- Turnbull, D.; Cech, R.E. Microscopic observation of the solidification of small metal droplets. J. Appl. Phys. 1950, 21, 804–810. [Google Scholar] [CrossRef]
- Tournier, R.F. Crystal growth nucleation and equalization of Fermi energies of intrinsic nuclei and glass-forming melts. J. Conf. Ser. 2009, 144, 012116. [Google Scholar] [CrossRef]
- Landau, L.; Lifchitz, E. Physique Théorique: Mecanique Quantique; MIR: Moscow, Russia, 1966; Volume III, pp. 1–135. [Google Scholar]
- Touloukian, Y.S.; Kirby, R.K.; Taylor, R.E.; Desai, P.D. Thermal Expansion: Metallic Elements and Alloys: Thermophysical Properties of Matter; Plenum Press: New York, NY, USA, 1970; Volume 12. [Google Scholar]
- Schade, J.; MacLean, A.; Miller, W.A. Undercooled Alloy Phases; Collings, E.W., Koch, C.C., Eds.; The Metallurgical Society: Warrendale, PA, USA, 1986; pp. 1–233. [Google Scholar]
- Dukhin, I. Sb Problemi Metallovedenia I Fiziki Metallov; [Collection: Problems of physical metallurgy and metal physics]; Metallurgizdat: Moscow, Russia, 1959; pp. 1–9. [Google Scholar]
- Turnbull, D. Undercoolability and the Exposure of Metastable Structures; Collings, E.W., Koch, C.C., Eds.; The Metallurgical Society: Warrendale, PA, USA, 1986; pp. 3–22. [Google Scholar]
- Perepezko, J.H.; Paik, J.S. Rapidly Solidified Amorphous and Crystalline Alloys; Keer, B.H., Griessen, B.C., Cohen, M., Eds.; North Holland: Amsterdam, The Netherlands, 1982; pp. 49–63. [Google Scholar]
- Hofmeister, W.H.; Robinson, M.B.; Bayuzick, R.J. Undercooling of pure metals in a containerless microgravity environment. Appl. Phys. Lett. 1986, 49, 1342–1344. [Google Scholar] [CrossRef]
- Herlach, D.M. Containerless undercooling ans solidification of pure metals. Ann. Rev. Mater. Sci. 1991, 21, 23–44. [Google Scholar] [CrossRef]
- Morton, C.W.; Hofmeister, W.H.; Bayuzick, R.J.; Rulison, A.J.; Watkins, J.L. The kinetics of solid nucleation in zirconium. Acta Mater. 1998, 46, 6033–6039. [Google Scholar] [CrossRef]
- Vonnegut, B. Variation with temperature of the nucleation rate of supercooled liquid tin and water drops. J. Coll. Sci. 1948, 3, 563–569. [Google Scholar] [CrossRef]
- Perepezko, J.H.; Follstaedt, D.M.; Peercy, P.S. Nucleation of allotropic phases during pulsed laser annealing of manganese. MRS Proc. 1985, 51. [Google Scholar] [CrossRef]
- Skripov, V.P. Homogeneous Nucleation in Melts and Amorphous Films: Crystal growth and materials; Kaldis, E., Scheel, H.J., Eds.; North Holland: Amsterdam, The Netherlands, 1977; pp. 328–376. [Google Scholar]
- Wilde, G.; Sebright, J.L.H.; Perepezko, J. Bulk liquid undercooling and nucleation in gold. Acta Mater. 2006, 54, 4759–4769. [Google Scholar] [CrossRef]
- Cortella, L.; Vinet, B.; Desré, P.J.; Pasturel, A.; Paxton, A.T.; von Schilfgaarde, M. Evidence of transitory metastable phases in refractory metals solidified from highly undercooled liquids in a drop tube. Phys. Rev. Lett. 1993, 70, 1469–1472. [Google Scholar] [CrossRef] [PubMed]
- Ishikawa, T.; Paradis, P.F.; Fujii, R.; Saita, Y.; Yoda, S. Thermophysical property measurements of liquid and supercooled iridium by containerless methods. Int. J. Thermophys. 2005, 26, 893–904. [Google Scholar] [CrossRef]
- Paradis, P.F.; Ischikawa, T.; Yoda, A. Noncontact measurements of thermophysical properties of molybdenum at high temperatures. Int. J. Thermophys. 2002, 21, 555–569. [Google Scholar] [CrossRef]
- Paradis, P.F.; Ishikawa, T.; Korke, N. Physical properties of equilibrium and non-equilibrium liquid osmium measured by levitation technique. J. Appl. Phys. 2006, 100, 103523. [Google Scholar] [CrossRef]
- Fehling, J.; Scheil, E. Untersuchung der unter Kuhlbarkeit von metallschmelzen. Zeit. für Metalkunde 1962, 53, 593–600. [Google Scholar]
- Gragnevski, K.I.; Mullis, A.M.; Cochrane, R.F. The mechanism for spontaneous grain refinement in undercooled pure Cu melts. Mater. Sci. Eng. A 2004, 375–377, 479–484. [Google Scholar]
- Gragnevski, K.I.; Mullis, A.M.; Cochrane, R.F. The effect of experimental variables on the level of melt undercooling. Mater. Sci. Eng. A 2004, 375–377, 485–487. [Google Scholar]
- Li, D.; Eckler, K.; Herlach, D.M. Development of grain structures in highly undercooled germanium and copper. J. Cryst. Growth 1996, 160, 59–65. [Google Scholar] [CrossRef]
- Cortella, L.; Vinet, B. Undercooling and nucleation studies on pure refractory metals processed in the Grenoble high-drop tube. Phil. Mag. B 1995, 71, 16–21. [Google Scholar] [CrossRef]
- Bosio, L.; Defrain, A.; Epelboin, I. Changements de phase du gallium à la pression atmosphérique. J. Phys. Fr. 1966, 27, 61–71. (In French) [Google Scholar]
- Perepezko, J.H.; Sebright, J.L.; Hockel, P.G.; Wilde, G. Undercooling and solidification of atomized liquid droplets. Mater. Sci. Eng. A 2002, 326, 144–153. [Google Scholar] [CrossRef]
- Paradis, P.F.; Ishikawa, T.; Fujii, R.; Yoda, S. Physical properties of liquid and undercooled tungsten by levitation technique. Appl. Phys. Lett. 2005, 86, 041901. [Google Scholar] [CrossRef]
- Yoon, W.; Paik, J.S.; Lacourt, D.; Perepezko, J.H. The effect of pressure on phase selection during nucleation in undercooled bismuth. J. Appl. Phys. 1986, 60, 3489. [Google Scholar] [CrossRef]
- Payne, W.P.; Olson, J.K.; Allen, A.; Kozhevnikov, V.F.; Taylor, P.C. Sound velocity in liquid and glassy selenium. J. Non-Cryst. Sol. 2007, 353, 3254–3259. [Google Scholar]
- Aoyama, T.; Paradis, P.F.T.; Ishikawa, S.; Yoda, S. Observation of rapid solidfication of deeply undercooled Si melt using electrostatic levitation. Mater. Sci. Eng. A 2004, 375–377, 460–463. [Google Scholar]
- Beaudhuin, M.; Zaidat, K.; Duffar, T.; Lemiti, M. Silicon controlled under electromagnetic levitation. J. Mater. Sci. 2010, 45, 2218–2222. [Google Scholar] [CrossRef]
- Li, D.; Herlach, D.M. High undercooling of bulk molten silicon by containerless processing. Europhys. Lett. 1996, 34, 423–428. [Google Scholar] [CrossRef]
- Liu, R.P.; Volksmann, T.; Herlach, D.M. Undercooling of molten silicon by containerless processing. Acta Mater. 2001, 49, 439–444. [Google Scholar] [CrossRef]
- Menoni, C.S.; Hu, J.Z.; Spain, I. Germanium at high pressures. Phys. Rev. B 1986, 34, 362–368. [Google Scholar] [CrossRef]
- Kittel, C. Introduction to Solid State Physics; John Wiley & Sons: New York, NY, USA, 1967; pp. 197–223. [Google Scholar]
- Tong, H.Y.; Shi, F.G. Dependence of supercooling of a liquid on its overheating. J. Chem. Phys. 1997, 107, 7964–7966. [Google Scholar] [CrossRef]
- Rudolph, P.; Koh, H.J.; Schäfer, N.; Fukuda, T. The crystal perfection depends on the superheating of the mother phase too-experimental facts and speculations on the “melt structure” of semiconductor compounds. J. Cryst. Growth 1996, 166, 578–582. [Google Scholar] [CrossRef]
- Hays, C.C.; Johnson, W.L. Undercooling of bulk metallic glasses processed by electrostatic levitation. J. Non-Cryst. Solids 1999, 250–252, 596–600. [Google Scholar]
- Porcar, L.; de Rango, P.; Bourgault, D.; Tournier, R. Superconductors-Materials, Properties and Applications: Magnetic Texturing of High-Tc Superconductors; Gabovitch, A., Ed.; Intech: Rijeka, Croatia, 2012; pp. 171–196. [Google Scholar]
© 2014 by the authors; licensee MDPI, Basel, Switzerland. This article is an open access article distributed under the terms and conditions of the Creative Commons Attribution license (http://creativecommons.org/licenses/by/3.0/).
Share and Cite
Tournier, R.F. Crystallization of Supercooled Liquid Elements Induced by Superclusters Containing Magic Atom Numbers. Metals 2014, 4, 359-387. https://doi.org/10.3390/met4030359
Tournier RF. Crystallization of Supercooled Liquid Elements Induced by Superclusters Containing Magic Atom Numbers. Metals. 2014; 4(3):359-387. https://doi.org/10.3390/met4030359
Chicago/Turabian StyleTournier, Robert F. 2014. "Crystallization of Supercooled Liquid Elements Induced by Superclusters Containing Magic Atom Numbers" Metals 4, no. 3: 359-387. https://doi.org/10.3390/met4030359